the Creative Commons Attribution 3.0 License.
the Creative Commons Attribution 3.0 License.
Satellite observations for describing fire patterns and climate-related fire drivers in the Brazilian savannas
Guilherme Augusto Verola Mataveli
Maria Elisa Siqueira Silva
Gabriel Pereira
Francielle da Silva Cardozo
Fernando Shinji Kawakubo
Gabriel Bertani
Julio Cezar Costa
Raquel de Cássia Ramos
Viviane Valéria da Silva
In the Brazilian savannas (Cerrado biome) fires are natural and a tool for shifting land use; therefore, temporal and spatial patterns result from the interaction of climate, vegetation condition and human activities. Moreover, orbital sensors are the most effective approach to establish patterns in the biome. We aimed to characterize fire, precipitation and vegetation condition regimes and to establish spatial patterns of fire occurrence and their correlation with precipitation and vegetation condition in the Cerrado. The Cerrado was first and second biome for the occurrence of burned areas (BA) and hotspots, respectively. Occurrences are higher during the dry season and in the savanna land use. Hotspots and BA tend to decrease, and concentrate in the north, but more intense hotspots are not necessarily located where concentration is higher. Spatial analysis showed that averaged and summed values can hide patterns, such as for precipitation, which has the lowest average in August, but minimum precipitation in August was found in 7 % of the Cerrado. Usually, there is a 2–3-month lag between minimum precipitation and maximum hotspots and BA, while minimum VCI and maximum hotspots and BA occur in the same month. Hotspots and BA are better correlated with VCI than precipitation, qualifying VCI as an indicator of the susceptibility of vegetation to ignition.


A common process in most of the land areas of the world (Hantson et al., 2013), fires consume large areas of vegetation across the Earth's surface, modifying its characteristics (Vadrevu et al., 2014) and playing an important role in climate due to the emissions related to biomass burning (Kaiser et al., 2012). Moreover, extensive fire activity disturbs the ecosystems, decreasing plants and animal species and causing soil depletion (Fearnside, 2000) as well as social and economic costs (Brunson and Tanaka, 2011; Stephenson et al., 2013).
The frequency of fire weather seasons is becoming higher: between 1979 and 2013 fire weather seasons have lengthened in more than 25 % of the world's vegetated area, increasing the global mean fire weather season about 19 % in length (Jolly et al., 2015). Globally, around 25 % of the areas which have a significant fire activity are characterized by a bimodal pattern, presenting at least one fire season occurring under unfavourable fire weather conditions, which indicates an anthropic influence in the occurrence of fires; predominantly bimodal pattern areas are mostly located in Canada–northern USA, central Eurasia, eastern Siberia, northern India and southern South America, highlighting the importance of population density and land management techniques in the global fire regime (Benali et al., 2017). In addition to anthropic action, climate is a powerful driver for the occurrence of fires, able to control the amount of fuel available for burning and enhancing the probability of ignition. While a higher amount of precipitation during the dry season reduces the occurrence of fires, rainier years during the dry season can increase fire activity in the following year (Archibald et al., 2010). Moreover, studies of long-term trends and interannual variability of fires found large year-to-year changes associated with extreme climate conditions (Chen et al., 2013). Combined with climate, fuel moisture and fuel type, which are characteristics of the vegetation, are dependent variables of the ignition and spread of fires (Leblon et al., 2012). Variations in vegetation condition, which can be expressed by vegetation indices, are an important indicator of stress factors for plants, such as drought, and are useful for assessing the susceptibility of vegetation to fires (Bajocco et al., 2015). Studies have already shown the correlation between the seasonal variability of fuel moisture and fire occurrence, as well as the intra-annual and interannual variability of vegetation condition due to shorter or longer dry seasons (Chéret and Denux, 2011). Therefore, the interaction of human activities, climate and vegetation defines the temporal and spatial patterns for the occurrence of fires, highlighting the importance of characterizing the spatial patterns of fire occurrence and their correlation with climatic variables and vegetation condition, which is necessary to understand the dynamics of areas affected by fires, especially in areas suffering severe changes in land use and land cover (LULC) and presenting climatic seasonality, such as the Cerrado biome (Brazilian savannas).
According to Archibald et al. (2010), the relationship between climate controllers and fire occurrence is complex and varies for each biome. Tropical savannas are the most frequently burned ecosystems in the world (van der Werf et al., 2008; Bowman et al., 2009), where humans are responsible for most of fires (Archibald et al., 2012), especially for opening areas for agriculture and livestock farming and for pest control (Shimabukuro et al., 2013). In the Cerrado, the second largest biome in South America and mostly constituting short grassland vegetation, natural fires are common due to lightning (Ramos-Neto and Pivello, 2000). Moreover, since the 1970s this biome has suffered an intense agricultural expansion process (Fearnside, 2001), and fire has been an important tool in this land-use and land-cover change (LULCC) process for removing the natural remnants of vegetation as well as shifting cultivations, eliminating crop residues and stimulating the regrowth of herbaceous plant for cattle feeding during the dry season (Pivello, 2011). These reasons qualify the Cerrado as an important biome to be studied; however, according to Beuchle et al. (2015), despite the increasing anthropic pressure in the Cerrado, LULCC in the biome has been overlooked until recently when compared to the efforts for monitoring LULCC in the Amazon biome. The absence of an effective fire policy also contributes to the LULCC process in the natural remnants of Cerrado, which is the most biodiverse savanna in the world (Durigan and Ratter, 2016).
Regarding the Cerrado, we can highlight studies that analysed fires and precipitation, such as Moreira de Araújo et al. (2012), Libonati et al. (2015a) and Moreira de Araújo and Ferreira (2015), which used averaged and summed values of burned areas (BA), hotspots or precipitation for the entire Cerrado, a biome presenting an area of more than 2 million km2; therefore, the variation of these variables within the biome was not analysed. Libonati et al. (2015b, 2016) analysed the spatial and temporal distribution of BA in the Cerrado; however, these works did not establish the spatial distribution of correlation between BA and hotspots and precipitation or vegetation condition, which is an important approach for understanding the complex climate–vegetation–fire occurrence relationship. The recent study of Nogueira et al. (2017) should also be mentioned, which analysed the sensitivity of fire danger indices (FDIs) in describing the seasonal fire danger in the Brazilian biomes, including the Cerrado, by correlating distinct FDIs with BA data sets and found that the sensitivity of FDIs is biome-specific.
Considering the phenomenon analysed, data derived from orbital sensors are the most efficient source of information to comprehend the fire dynamics once they allow the observation of large areas of the surface daily and repeatedly (Ichoku et al., 2012; Hantson et al., 2013; Andela et al., 2016). Among the orbital sensors available for studying fires, Moderate Resolution Imaging Spectroradiometer (MODIS) active fire and BA products were the first data sets derived from the new generation of moderate-resolution orbital sensors (Giglio et al., 2016) and have been widely used to study fires in the tropical savannas of Brazil (Nascimento et al., 2011; Moreira de Araújo et al., 2012; Libonati et al., 2015a, b, 2016; Moreira de Araújo and Ferreira, 2015), Africa (Archibald et al., 2010; Kusangaya and Sithole, 2015), Australia (Andersen et al., 2005; Yates et al., 2008; Maier et al., 2013) and in the entire tropical savannas (van der Werf et al., 2008). The use of MODIS data for estimating vegetation condition from vegetation indices (Chéret and Denux, 2007, 2011) should also be mentioned, while precipitation is mostly estimated using Tropical Rainfall Measurement Mission (TRMM) satellite data (Kummerow et al., 2000), which provide good estimates of the spatial and temporal patterns of precipitation and are widely validated.
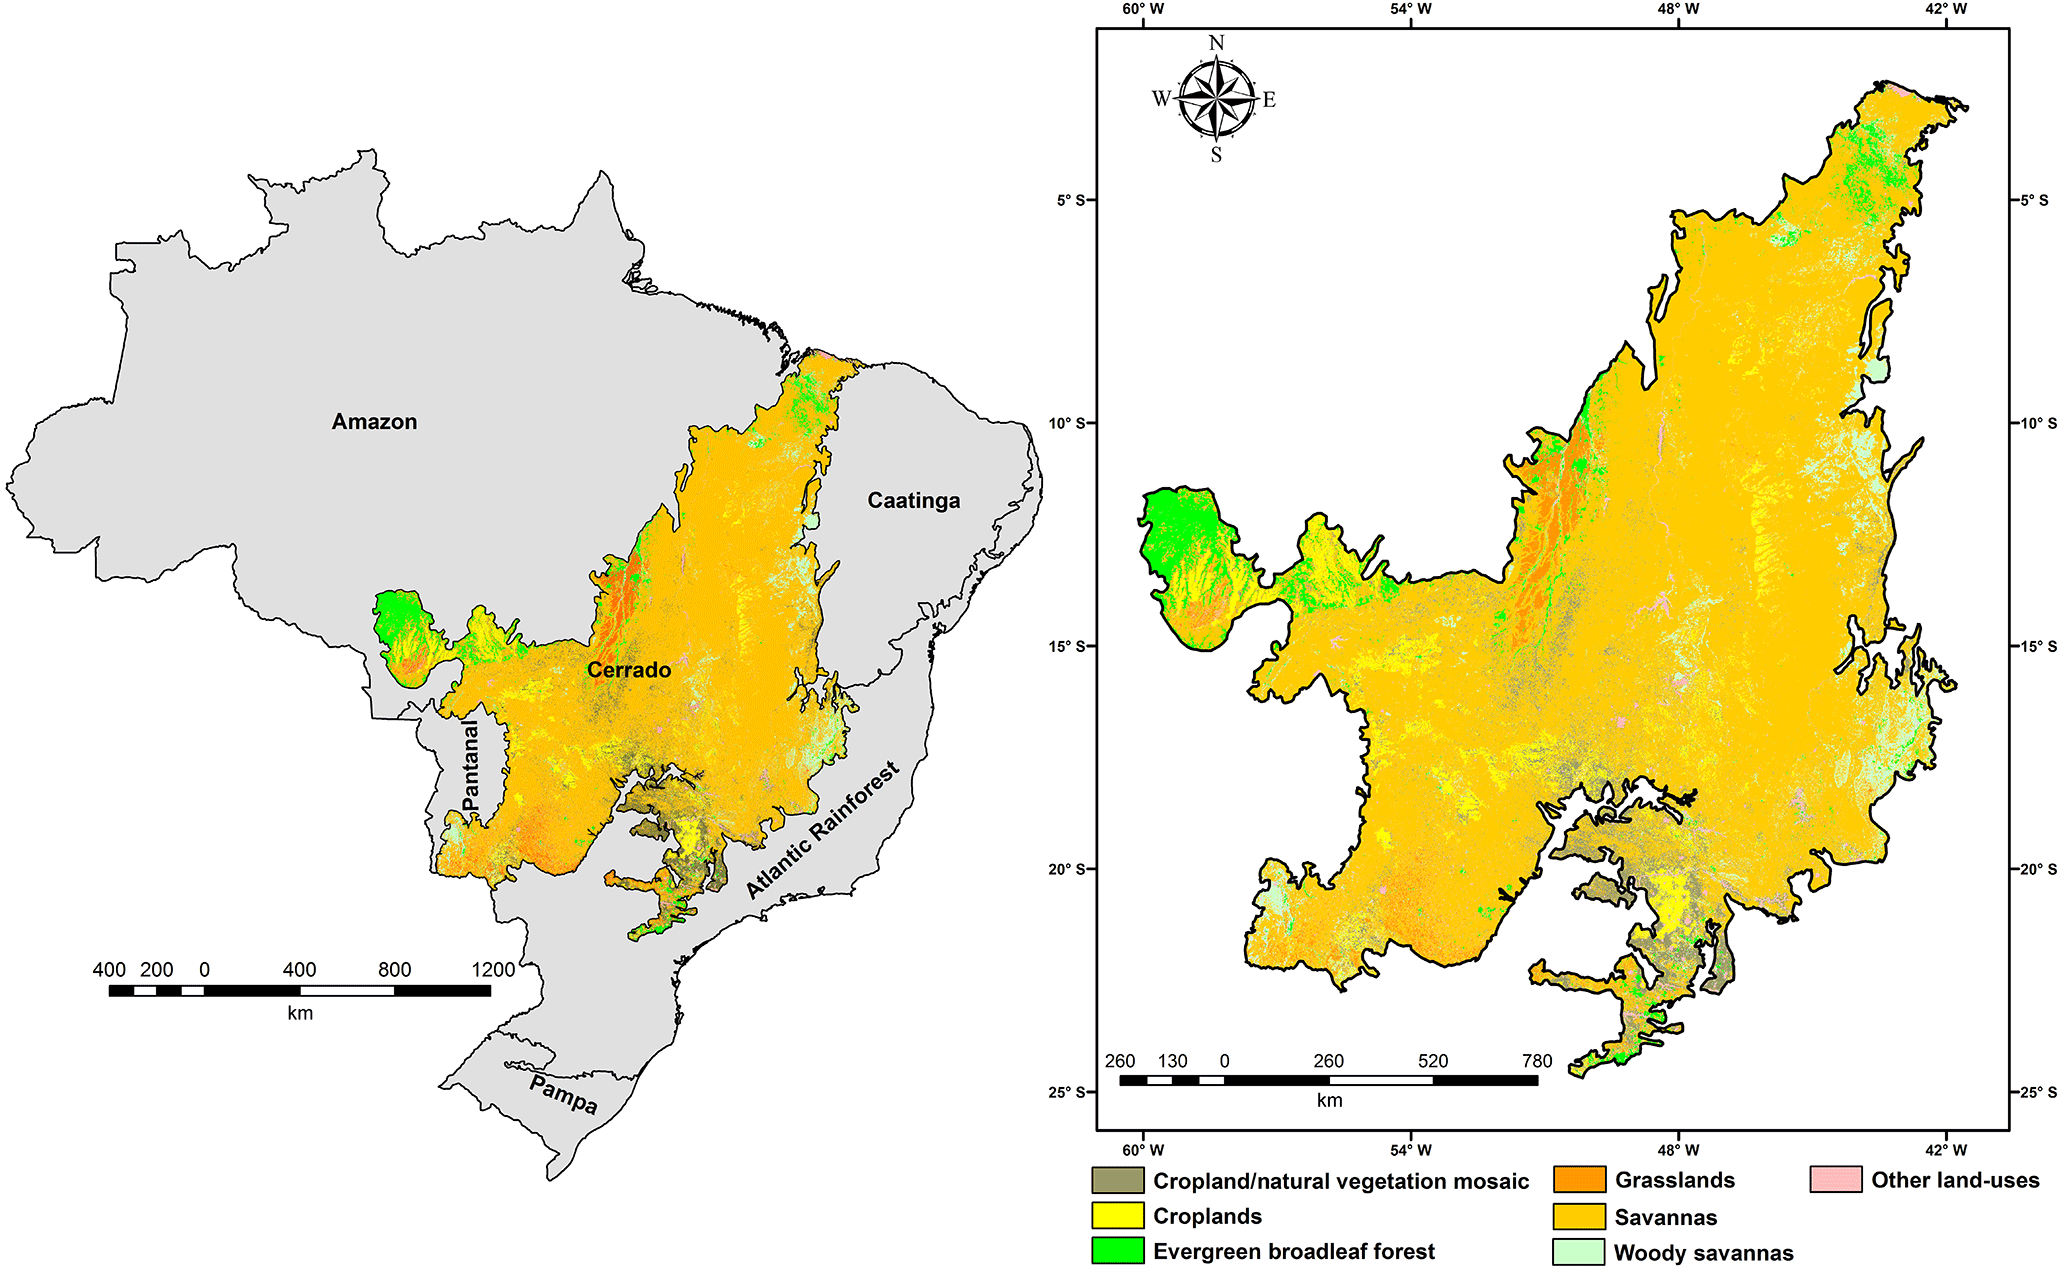
Figure 1Location of the Brazilian biomes, highlighting the Cerrado biome. Most frequent LULC in the Cerrado estimated by the MCD12Q1 product during the 2002–2013 period.
Given the information presented above, we aimed to characterize the fire, precipitation and vegetation condition regimes and to use spatial analysis tools to establish spatial patterns of fire occurrence and their correlation with precipitation and vegetation condition in the Cerrado using data obtained from orbital remote sensing during the 2002–2015 period.
2.1 Study area
The Cerrado (Fig. 1) is the second largest Brazilian biome, only smaller than the Amazon biome, and covers approximately 22 % of the Brazilian territory in 11 different states (IBGE, 2010). The biome is characterized by a wide climatic variability and covers a large area extended for many latitudinal belts (Kayano and Andreoli, 2009), usually presenting a dry season from May to September and a rainy season from October to April for most of the Cerrado (Coutinho, 1990; Pivello, 2011; Moreira de Araújo et al., 2012). Due to the high biological diversity, in particular endemic species that represent approximately 44 % of the flora (Klink and Machado, 2005), the Cerrado is a world biodiversity hotspot (Myers et al., 2000). Among the factors that explain the biodiversity in the biome, we can highlight a strong climatic seasonality, water availability and anthropic disturbances, such as deforestation and fires (Coutinho, 1990). The Cerrado is composed of different vegetal formations, presenting (i) grasslands, mainly constituted by herbaceous species and certain shrubs without the presence of tree species; (ii) savannas, with sparse tree and shrubs over a grassy extract; and (iii) forest formations, where tree species with continuous or discontinuous canopy dominate (Dias, 1992).
However, the LULCC process caused by the agricultural expansion since the 1970s (Fearnside, 2001) significantly reduced the natural vegetation of the biome. Before the 1970s, the Cerrado was considered unsuitable for agriculture due to the poor soils in the biome, but advances in agricultural techniques, favourable conditions for mechanization, government incentives and the low price of land contributed to transform the Cerrado into a growing agricultural region (Bickel and Dros, 2003). The anthropic fires in the natural remnants of the Cerrado, caused by the LULCC process, are commonly performed during the dry season, opposed to the natural fires, which usually occur at the beginning of the rainy season and favour the predominance of herbaceous species or cause land degradation in the remnants of the Cerrado (Pivello, 2011).
2.2 MODIS fire products
The MODIS sensor, designed for studying the dynamics of the biosphere, is on board the polar-orbiting Terra and Aqua satellites, providing data in 36 spectral channels between 0.4 and 14.4 µm with nominal spatial resolution ranging from 0.25 to 10 km, depending on the product, temporal resolution of 1 to 2 days and enabling four daily imaging surveys from the same surface (Justice et al., 2002; Giglio et al., 2003). MODIS active fire products (MOD14 and MYD14 products, derived from the MODIS sensor on board Terra and Aqua satellites, respectively) detect burning pixels with nominal spatial resolution of 1 km using a contextual algorithm that applies thresholds to the mid-infrared and thermal infrared brightness temperature (T4 and T11, respectively) (Giglio et al., 2003). According to Giglio et al. (2003), MODIS has two 4 µm channels (21 and 22), and, usually, channel 22 is used to detect active fires. However, when it saturates or has missing data, it is replaced with channel 21, while T11 is derived from channel 31; false detections are rejected by examining the brightness temperature relative to adjacent pixels. In addition to the spatial location, MODIS active fire products also provide other information regarding hotspots detected, such as fire radiative power (FRP), which is defined as the rate that energy is emitted as electromagnetic radiation during the combustion process and is related to the intensity of fires and biomass burning (Wooster et al., 2005).
Regarding BA, the MODIS globally gridded 0.5 km BA product (MCD45A1) (Roy et al., 2005) contains monthly burning and quality information on a per-pixel basis. MCD45A1 algorithm analyses the daily surface reflectance dynamics from both MODIS sensors for detecting the approximate date of burning and mapping the spatial extent of recent fires, enabling us to recognize spatial patterns of BA (MODIS Fire Products ATBD, 2006).
2.3 TRMM precipitation data
The TRMM satellite results from a joint program between the American and Japanese space agencies and aims to provide precipitation data in the tropical and subtropical areas of the globe (Kummerow et al., 2000). The TRMM satellite is operational since 1997 and equipped with three different sensors: (i) Precipitation Radar (PR), built to provide a 3-D view of rainfall distribution over the tropics and subtropics; (ii) Microwave Imager (TMI), which aims to analyse the content of the integrated precipitation column, cloud liquid water and ice, and rain intensity and type; and (iii) Visible and Infrared Scanner (VIRS), a sensor designed for observing cloud type, coverage and top temperature (Kummerow et al., 1998). For analysing the precipitation regime in the Cerrado biome between 2002 and 2015, TRMM monthly precipitation product (3B43), provided with spatial resolution of 0.25∘ (approximately 30 km) in millimetres per month (mm month−1), was used. TRMM satellite monthly estimates have been validated for Brazil by Pereira et al. (2013), who compared TRMM data with monthly precipitation estimated by 183 meteorological stations during the 1998–2010 period and found a strong correlation between TRMM data and the meteorological stations in Brazil; however, TRMM tends to overestimate monthly precipitation in 15 %.
2.4 MOD13A3 product and Vegetation Condition Index (VCI)
The use of vegetation indices is an important approach for monitoring both vegetation and LULC classes. Considering the goals of MODIS sensors, global vegetation indices derived from MODIS provide consistent spatial and temporal comparisons of vegetation conditions (Justice et al., 2002). The global MODIS 1 km Normalized Difference Vegetation Index (NDVI-MOD13A3 product, based on Terra MODIS data) is provided monthly and considers all data from the 16-day 1 km products that overlap the month employing a weighted temporal average when data are cloud free or a maximum value in case of clouds (MODIS Algorithm Theoretical Basis Document ATBD, 1999; Didan, 2015). In this study, MOD13A3 product was used to estimate the VCI in the Cerrado biome during the period between 2002 and 2015.
Satellite-based drought indices, such as the NDVI-based VCI (Kogan, 1995), are important sources of information for detecting the occurrence, the duration, the intensity and the impacts of drought (Quiring and Ganesh, 2010; Jiao et al., 2016). Initially proposed to evaluate the global weather impact over vegetation and later proven useful for evaluating wildfire danger, VCI is a relative measurement of the NDVI value at the observation date with respect to extreme conditions of NDVI over a reference period (Chéret and Denux, 2007), as shown in Eq. (1):
where NDVI, NDVIMin and NDVIMax correspond to the NDVI, NDVI minimum and NDVI maximum values, respectively. According to Chéret and Denux (2007), one of the most influential variables for assessing fire danger is the vegetation condition, which can be estimated using remote sensing and represented by VCI. Thenkabail et al. (2004), who analysed different vegetation indices for monitoring drought and vegetation conditions in southwest Asia, also proved VCI to be a sensitive indicator for monitoring vegetation conditions, presenting better results than other indices, such as the Temperature Condition Index (TCI). The great advantages of using VCI are that it can be easily estimated, it does not require station observation data and it can provide near-real-time estimates over the globe at a relatively high spatial resolution (Quiring and Papakryiakou, 2003).
2.5 MODIS Land Cover Type product (MCD12Q1)
The MCD12Q1 product provides global LULC maps annually with spatial resolution of 500 m using 8-day composite data from both MODIS sensors (Friedl et al., 2010). LULC classes are determined from a supervised classification algorithm based on high-quality land-cover training sites, also including as specific inputs normalized BRDF-adjusted reflectance and land surface temperature derived from MODIS data, and are provided in five distinct land-cover classification systems (MODIS Land Cover Product User Guide, 2013). In this work, we have used MCD12Q1 data based on the International Geosphere–Biosphere Programme (IGBP) classification system, which divides global LULC into 17 distinct LULC classes and is described in Friedl et al. (2002). The validation study of the MCD12Q1 product performed by Friedl et al. (2010) showed an overall accuracy of 75 %, despite the range in class-specific accuracies.
2.6 Data processing
Initially, all hotspots detected by the collection 6 MODIS active fire products in the Brazilian territory between 2002 and 2015 were grouped according to the spatial delimitation of the Brazilian biomes proposed by IBGE (2010), aiming to analyse the contribution of the hotspots occurred in the Cerrado nationally. Sequentially, the time series of monthly total hotspots in the entire Cerrado biome was generated considering the date of the occurrence of the hotspots available in the MODIS active fire products. Total hotspots for each year analysed and monthly average of hotspots were calculated. Aiming to analyse the major land uses related to the occurrence of fires in the biome, hotspots detected by the MODIS active fire products were crossed with the annual LULC maps derived from collection 5.1 MCD12Q1 product according to the spatial location of the hotspots. Firstly, all annual MCD12Q1 LULC maps following the IGBP classification system were clipped to the delimitation of the Cerrado proposed by IBGE (2010) and reclassified to seven LULC classes: savannas, woody savannas, grasslands, croplands, cropland/natural vegetation mosaic, evergreen broadleaf forest (LULC classes that compose around 98 % of the Cerrado, as will be shown below) and other land uses. It should be mentioned that the most recent annual LULC map derived from the MCD12Q1 product was produced for the year 2013; therefore, the spatial location of the hotspots detected in the Cerrado during the years 2014 and 2015 was crossed with the 2013 LULC map. The total and percentage of hotspots in the reclassified land uses of the Cerrado for the entire 2002–2015 period were then calculated, as well as the area of each reclassified land use during the period analysed.
Regarding BA analysis, initially all the 16 tiles of the collection 5 MCD45A1 product which cover the Brazilian territory were acquired and monthly BA pixels were grouped and summed according to the spatial delimitation of the Brazilian biomes, also aiming to evaluate the contribution of BA occurred in the Cerrado nationally, as proposed for the hotspots. Then, only pixels flagged as one, which are highly reliable observations and therefore the most likely to be BA, were considered, as previously proposed by Moreira de Araújo et al. (2012) and Moreira de Araújo and Ferreira (2015) for studying BA in the Brazilian biomes and in the Cerrado, respectively. For the analysis of the BA occurring only in the Cerrado biome, the five tiles covering the delimitation of the Cerrado biome were considered and processed as described above. Finally, the time series of monthly total BA in the entire Cerrado biome was generated for the 2002–2015 period, as well as annual estimates of BA for each year analysed and monthly average BA.
For TRMM data processing, version 7 3B43 product monthly images were obtained for the entire tropical and subtropical area of the globe and clipped to the study area according to the delimitation of the Cerrado proposed by IBGE (2010). Then, monthly and annual average precipitation for the entire Cerrado biome during the period between 2002 and 2015 was estimated.
VCI was estimated using the global 1 km monthly NDVI MODIS product. Initially, all the steps described for MCD45A1 in the Cerrado were performed for the collection 6 MOD13A3 product. Sequentially, maximum and minimum NDVI for each pixel of the study area were estimated based on MODIS NDVI time series from 2002 to 2015, which is necessary to define the maximum and minimum NDVI masks used to estimate VCI. Finally, monthly and annual VCI for the entire Cerrado biome were estimated using Eq. (1); for annual VCI, the term NDVI in Eq. (1) corresponded to the annual average NDVI of each pixel located in the study area.
Boxplot analysis for the Cerrado time series of monthly total hotspots, monthly total BA, monthly average precipitation and monthly average VCI was performed in order to analyse the variation of these variables during the months and years studied and to identify outliers. Moreover, Breaks For Additive Seasonal and Trend (BFAST), an additive method that decomposes a time series into seasonal, trend and noise components (Verbesselt et al., 2010), was applied to the Cerrado time series of monthly total hotspots, monthly total BA, monthly average precipitation and monthly average VCI aiming to find trends in the four time series analysed. According to Verbesselt et al. (2010), BFAST assumes that the trend component (Tt) is piecewise linear with break points, here, as well as the maximum number of interactions, considered as 1. The significance of the trend component found using BFAST for the four variables analysed was tested using the Student t test with significance level of 5 %.
Regarding the spatial analysis, all maps described here and presented in the results considered the same grid size (0.25∘ × 0.25∘, spatial resolution of TRMM data), so all results are comparable. The spatial distribution of the hotspots within the Cerrado was analysed by summing all the hotspots occurring in the Cerrado during the 2002–2015 period in each cell of the grid size described above. Additionally, the spatial pattern of FRP estimated by the MODIS active fires in the Cerrado was analysed by calculating the mean FRP of all hotspots detected in each grid cell of the biome considering the entire 2002–2015 period.
The spatial analysis also estimated the month with highest incidence of hotspots and BA, minimum amount of precipitation and minimum VCI in the Cerrado considering the 168 months analysed. Minimum or maximum monthly incidence was established according to the average of the sum of monthly hotspots, sum of monthly BA, monthly average precipitation and monthly average VCI for each of the 12 months in each grid cell of the Cerrado. Furthermore, the spatial monthly lag between the minimum of precipitation and maximum of hotspots, minimum of precipitation and maximum of BA, minimum of VCI and maximum of hotspots and minimum of VCI and maximum of BA was also calculated.
Spatial statistical analysis consisted on calculating the Pearson's correlation coefficient (R), which shows the linear relationship between two data sets, for each grid cell of the regular grid over the Cerrado considering the month-by-month values during the 168 months inserted in the 2002–2015 period for four pairs of variables: monthly total hotspots and monthly average precipitation, monthly total BA and monthly average precipitation, monthly total hotspots and monthly average VCI and between monthly total BA and monthly average VCI. Here, monthly total hotspots were established by summing the monthly total of hotspots in each grid cell of the Cerrado, monthly total BA was calculated by summing the area of all pixels considered as BA in each grid cell of the Cerrado, monthly average precipitation corresponded to the precipitation estimated by the 3B43 product, and monthly average VCI consisted of calculating the monthly average VCI in each grid cell of the regular grid over the Cerrado. The significance of the spatial correlations described above was also tested using the Student t test with significance level of 5 %.
Considering the entire Brazilian territory, MODIS fire products detected 5 235 881 hotspots and estimated 1 964 544 km2 burned during the 2002–2015 period. Within this total, 1 904 182 hotspots (approximately 36 %) were detected and 1 358 775 km2 (approximately 69 %) was burned in the area corresponding to the Cerrado, making the biome the first and second biome for the occurrence of BA and hotspots, respectively, during the period analysed. Despite having approximately half of the area of the Amazon biome, the Cerrado presented only 10 % less hotspots than the Amazon during the period between 2002 and 2015. However, considering the yearly density of hotspots in the Brazilian biomes, hotspot density in the Cerrado (0.067 hotspots km−2 yr−1) is approximately 60 % higher than in the Amazon (0.041 hotspots km−2 yr−1). Regarding BA, even considering the difference in the area of the biomes, the Cerrado concentrated 69 % of the Brazilian BA between 2002 and 2015, while the Amazon was responsible for 220 182 km2 of the BA during 2002–2015, approximately 11 % of the total. These results agree with those found by Moreira de Araújo et al. (2012), who used MOD14, MYD14 and MCD45A1 data to analyse the spatial patterns of hotspots and BA in the Brazilian territory during the 2002–2010 period and found the highest concentration of hotspots in the Amazon biome, while the Cerrado was responsible for 73 % of the Brazilian BA. It should be considered that the performance assessment of the MCD45A1 product in dense vegetation areas, such as the Amazon, is not good because omission errors are frequent, as shown by Roy et al. (2008), Cardozo et al. (2012) and Libonati et al. (2015b). Regarding the Cerrado, MCD45A1 usually presents omission errors related to the detection of small BA patches, mostly due to the coarse spatial resolution of the product, as shown by Libonati et al. (2015a), who also validated MCD64A1 and AQM BA data sets. In contrast, considering only September, when fires are more frequent in the Cerrado and, therefore, BA patches tend to be larger, a MCD45A1 validation study conducted by Moreira de Araújo and Ferreira (2015) showed good assessment when compared to BA maps derived from Landsat images.
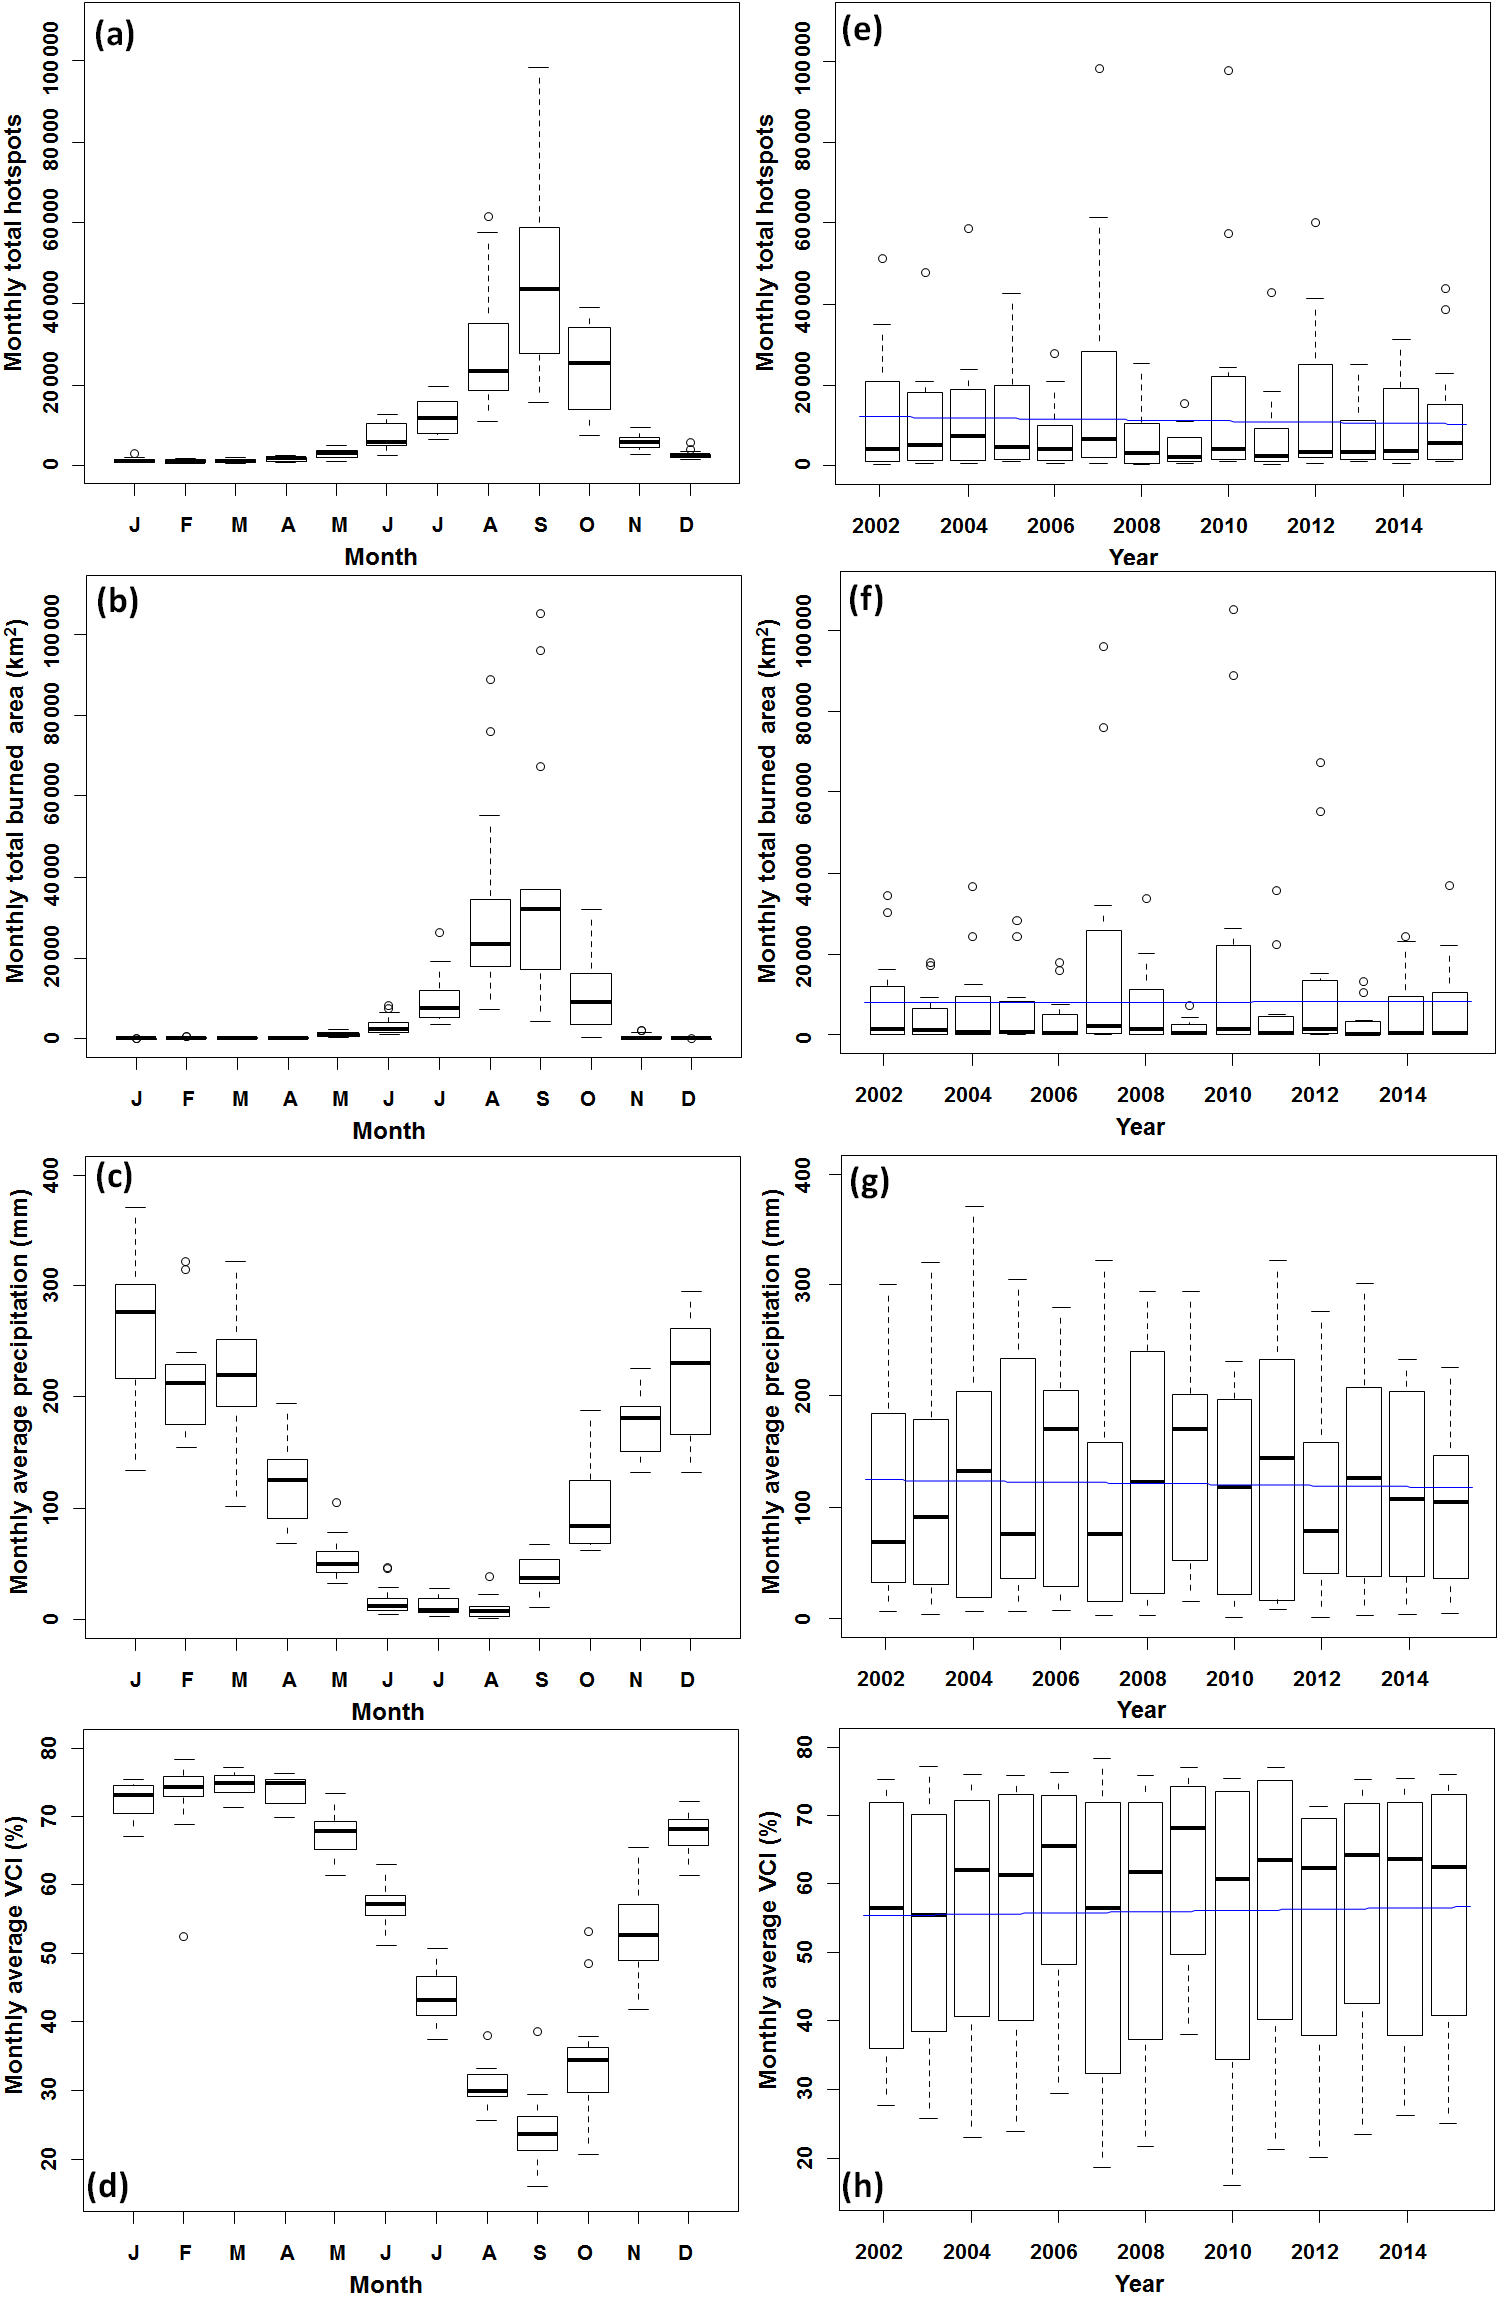
Figure 2Interannual boxplots for (a) monthly total hotspots, (b) monthly total burned area, (c) monthly average precipitation and (d) monthly average VCI; intra-annual boxplots and trends (blue lines) for (e) monthly total hotspots, (f) monthly total burned area, (g) monthly average precipitation and (h) monthly average VCI in the Cerrado biome during the 2002–2015 period. On each boxplot, the central mark represents the median, the edges of the boxplot are the 25th and 75th percentiles and the upper (lower) whisker delimits the most extreme value contained in the limit defined by the sum (difference) between the 75th (25th) percentile and the difference between the 75th and 25th (25th and 75th) percentiles multiplied by 1.5. Outliers (black circles) represent values outside the limits defined by the whiskers.
Considering only the Cerrado, the interannual and intra-annual variability in the occurrence of fires, precipitation and VCI along the considered period is shown in Fig. 2. Hotspots and BA are concentrated during the dry season (May to September for most of the Cerrado); however, they still have high averages in October, the beginning of the rainy season for most of the Cerrado, as will be shown below. There is also a possibly inverse relationship between fire occurrence and precipitation or vegetation condition, as long as months with higher monthly values of hotspots or BA had lower values of precipitation or VCI. Monthly total hotspots ranged from 461 to 98 238 and monthly total BA ranged from 1.75 to 105 338 km2, while monthly average precipitation and VCI ranged, respectively, from 1.5 to 370 mm and from 15.9 to 78.3 %. Analysing biomass burning, LULCC and the hydrological cycle in the northern sub-Saharan Africa, a savanna region suffering an intense LULCC process, Ichoku et al. (2016) also found that the seasonal peak of fires is anticorrelated with annual water-cycle indicators, such as precipitation and vegetation greenness, except in humid West Africa, where this situation occurs only during the dry season and burning virtually stops when monthly average precipitation reaches 120 mm.
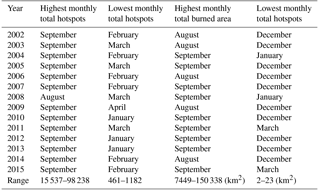
Table 1Estimate of the month presenting highest monthly total hotspots, lowest monthly total hotspots, highest monthly total burned area and lowest monthly total hotspots and range of the values found in the Cerrado biome for the 2002–2015 time series.
Annual total hotspots in the biome ranged from 53 798 (2009) to 248 911 (2007) and annual total BA ranged from 19 023 km2 (2009) to 249 982 km2 (2010), while annual precipitation ranged from 1209 mm (2007) to 1706 mm (2009) and annual average VCI ranged from 54 % (2007) to 62 % (2009), both considered normal or good according to Coleve (2011), who defined VCI values between 0 and 20 % as extremely dry, between 20 and 40 % as dry, between 40 and 60 % as normal, between 60 and 80 % as good and between 80 and 100 % as excellent. It is possible to note that the occurrence of hotspots and BA was lower in years of higher precipitation and VCI. The year 2009 presented the highest precipitation and VCI and the lowest total annual hotspots and BA, while 2007 presented highest occurrence of hotspots and lowest precipitation and VCI. Highest total annual BA was found in 2010, approximately 15 000 km2 higher than the annual total BA in 2007.
Highest monthly total hotspots in the entire Cerrado were found in September for all years analysed except for 2008, when monthly total hotspots in October were 6 % higher than in September and ranged significantly, from 15 537 (September 2009) to 98 238 (September 2007). In contrast, lowest monthly total hotspots were found in the middle or end of the rainy season, ranging from 461 (February 2002) to 1182 (January 2010). Regarding BA, the highest monthly total BA was found in August or September and ranged from 7449 km2 (August 2009) to 105 338 km2 (September 2010). The lowest monthly total BA was concentrated in the middle of the rainy season, ranging from 2 km2 (December 2010) to 23 km2 (March 2015). These results are summarized in Table 1.
Accordingly, monthly average hotspots ranged from 1022 (February) to 47 670 (September) and monthly average BA ranged from 14 km2 (December) to 38 913 km2 (September), while monthly average precipitation ranged from 10 mm (August) to 257 mm (January) and monthly average VCI from 24 % (September) to 75 % (March). The increase in the occurrence of fires initiates in May, agreeing with the beginning of the dry season, grows steadily and reaches the maximum in September, which is the end of the dry season for most of the Cerrado biome. In October, the beginning of the rainy season for most of the Cerrado, when precipitation (105 mm) is almost four times higher than the average precipitation during the dry season (27 mm) and average VCI increases in 10 % from September to October, monthly average hotspots and BA start decreasing but still have high averages (24 489 hotspots and 10 403 km2, respectively). Spontaneous combustion, the possibility of fires ignited criminally, the natural occurrence of fires related to lightning and land management practices are the causes of fires at the beginning of the rainy season. For example, Ramos-Neto and Pivello (2000) found that 91 % of the fire events registered at the Emas National Park, located in the Cerrado, between June 1995 and May 1999 were caused by lightning during the wet season or in the seasonally transitional months. Furthermore, due to the influence of distinct meteorological phenomena, such as the Intertropical Convergence Zone (ITCZ) and upper-level cyclonic vortex disturbances in the north of the biome (north of 6∘ S), the dry season can be displaced ahead in the year (Kayano and Andreoli, 2009). The central–southern areas of the Cerrado are mainly controlled by anticyclones and cold fronts, with the dry season characterized by the incursion and settlement of dry air masses over the region, while the rainy season is characterized by local heat convection and the action of the South Atlantic Convergence Zone (Kayano and Andreoli, 2009). Thus, we have a substantial variation of the dry season peak in the Cerrado, which will be empathized in the spatial analysis presented below, highlighting the need for spatialized information in addition to summed and averaged time series in the Cerrado. Throughout the rainy season, precipitation and VCI elevate and the average of hotspots and BA decreases: the average of hotspots (5414) and BA (1683 km2) in the rainy season is, respectively, 3.62 and 10.14 times lower than the average of hotspots and burned in the dry season (19 627 hotspots and 17 072 km2, respectively).
Furthermore, monthly total hotspots and BA in September 2007 and September 2010 (98 238 and 97 573 hotspots and 96 152 and 105 338 km2, respectively) represent two remarkable episodes, as long as the total number of hotspots in these single months is higher than the total hotspots detected by MODIS active fire products in the years 2006, 2008, 2009, 2011 and 2013 and BA detected was higher than the BA in the years 2003, 2004, 2005, 2006, 2008, 2009, 2011, 2013, 2014 and 2015. In these months, the physical conditions for the occurrence of fires were extremely favourable: since the beginning of the dry season in 2007 and 2010 monthly average precipitation was lower than the monthly average precipitation for the Cerrado between 2002 and 2015. Average precipitation in the dry season of 2007 and 2010 was, respectively, 55 and 68 % of the average precipitation in the Cerrado for the 2002–2015 period (26.7 mm). The drought during the dry season contributed to make the vegetation vulnerable to fires, when most of the areas of the Cerrado in September 2007 and September 2010 presented low values of VCI (lower than 5 %), especially in the southwestern region of the biome. Monthly average VCI in the Cerrado for September 2007 and September 2010 was, respectively, 25 and 33 % lower than the monthly average VCI for September (24 %).
Still analysing Fig. 2, we can see the wide variation of the variables within the months; higher displacements in monthly total hotspots and BA were found during the dry season, especially in August and September, when outliers were identified, such as September of 2007 and 2010. Regarding precipitation, high variability was found during the entire rainy season, especially December and January, and outliers were found in February, May, June and August. VCI interannual boxplot presented the highest variation in October and November, and outliers were found in February, August, September and October. Libonati et al. (2015a) also found seasonal variations in median, lower and upper quartiles and extremes values when analysing monthly values of BA and precipitation for the entire Cerrado area. Regarding trends in Fig. 2 (blue lines in each intra-annual boxplot, which were all significant according to the Student t test), a slight decrease in monthly total hotspots and in monthly total BA was found for the 2002–2015 period (decrease of 8.27 % hotspots and 2.67 % km2 in relation to the monthly average of total hotspots and BA considering the entire 168 months analysed, respectively), agreeing with results found by Archibald et al. (2010) for southern Africa, a region also dominated by savanna formations. The negative trend in fire occurrence was previously reported by Archibald (2016) for Africa, explained by the fragmentation of the landscape caused by LULCC, and by Andela et al. (2017), who found a global decline in BA caused by human activity, including the Cerrado, which, according to the authors, may be related to the increase in livestock, responsible for suppressing fire activity by reducing fuel loads, or related to changes in fire management practices. Still, the difficulty of MCD45A1 in detecting small-sized BA due to the coarse spatial resolution of the product may account for the negative trend found, since smaller BA patches seem to be a result of the fragmented landscape related to the advance of the agricultural activities over the natural remnants of the Cerrado. The monthly average precipitation trend was also negative in the period (decrease of 2.93 % in relation to the monthly average precipitation considering the entire 168 months analysed), which also denotes the importance of human activities in the fire regime of the Cerrado, where fire and precipitation trends are usually opposed. This negative trend in monthly precipitation was also found by Marcuzzo et al. (2012), who identified a decrease in precipitation in the mid-western Cerrado for all months except March. According to Coelho et al. (2016), the 2002–2015 period is part of a greater period of reduction of precipitation in central and southeast Brazil and has been referenced as a drying period in large-scale studies. Opposed to the other variables, monthly average VCI tends to slightly increase in the Cerrado (increase of 1.21 % in relation to the monthly average VCI considering the entire 168 months analysed), despite the negative trend in precipitation. When analysing vegetation variability and trends in northeastern Brazil using BFAST, Schucknecht et al. (2013) found similar results: positive trends in NDVI, which is the base of VCI, and negative trends in precipitation, concluding that the direction of vegetation trends frequently do not match with precipitation trends, also suggesting that analysing only precipitation is not enough for explaining vegetation trends.
Table 2Area range (km2) and average area (km2, %) of the LULC classes in the Cerrado biome estimated by the MCD12Q1 product during the 2002–2013 period, and total and percentage of hotspots detected by the MODIS active fires products in the LULC classes of the Cerrado during the 2002–2015 period.
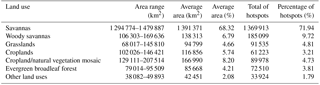
Regarding LULC, MCD12Q1 product shows that the Cerrado is mostly composed of savannas, as shown in Table 2. On average, 68.32 % of the Cerrado was composed by savannas during the 2002–2013 period (1 391 371 km2), followed by cropland/natural vegetation mosaic (166 990 km2, 8.2 %), woody savannas (138 313 km2, 6.79 %), croplands (116 856 km2, 5.74 %), grasslands (94 799 km2, 4.66 %), evergreen broadleaf forest (85 668 km2, 4.21 %) and other land uses (42 451 km2, 2.08 %). The spatial distribution of the most frequent land use estimated by the MCD12Q1 product during the 2002–2013 period is shown in Fig. 1. Comparing the oldest (2002) and the newest (2013) annual MCD12Q1 LULC maps, we can see that despite the increasing anthropic pressure in the Cerrado savanna areas increased in 3.77 %, followed by croplands (1.65 %), while grasslands and woody savannas areas decreased in 3.22 and 1.02 %, respectively. These results may be caused by the accuracy of the MCD12Q1 product, which, despite the overall accuracy of 75 %, presents confusion between specific classes: savanna areas are usually confused with woody savannas, grasslands, cropland/natural vegetation mosaic and closed shrublands areas (Friedl et al., 2010). Moreover, comparing the MCD12Q1 results with two Landsat-based LULC mappings for the Cerrado financed by the Brazilian government for the years 2002 (MMA, 2002) and 2013 (INPE, 2015), we have distinct results: while MCD12Q1 shows that 63.58 and 67.35 % of the Cerrado in 2002 and 2013, respectively, is composed of savannas, Landsat-based mappings found that natural remnants in the Cerrado (which includes forest and savanna formations) declined from 60.5 to 54.6 % between 2002 and 2013; therefore, over a period of 11 years natural remnants were reduced in 120 150 km2. Comparing the LULC maps for the Cerrado provided by MMA (2002) and INPE (2015), agricultural areas increased 1.2 % (24 434 km2) and pasture areas increased in 3 % (61 093 km2) during the 2002–2013 period. According to Pivello (2011), the LULCC process in the Cerrado usually begins with the use of fire in the natural remnants for removing the vegetation, and then the cleared area is shifted to planted pasture, subsistence agriculture or industrial farming. While in subsistence agriculture areas fire is traditionally used for pest control, crop rotation and pasture management, in industrial farming areas, besides the removal of the natural vegetation, fire is a tool for burning crop residues, and in extensive beef-cattle production areas annual or biannual fires are used for stimulating regrowth of grass in the dry season when forage stocks are low. According to Pivello (2011), in Cerrado conservation areas fires are usually prohibited and no fire management techniques are applied, such as prescribed burnings, which results in enhanced fuel loads and, when natural, accidental or criminal fires happen, more intense fires and larger BA.
Approximately 72 % of the hotspots detected by the MODIS active fire products (1 369 913) occurred in savannas areas during the 2002–2015 period (Table 2). Followed by savannas, around 9.7 % of the hotspots occurred in woody savannas (185 099), 4.8 % in grasslands areas (91 535), 4.7 % in cropland/natural vegetation mosaic areas (89 978), 3.8 % in evergreen broadleaf areas (72 510), 3.2 % in croplands (61 223) and 1.8 % in areas of other land uses (33 924). Nascimento et al. (2011), when analysing the occurrence of hotspots in the LULC of the Cerrado for the period between May 2008 and May 2009, found 75.6, 13.2, 11 and 0.2 % hotspots in the natural remnants, pasture areas, agriculture areas and other land uses, respectively. The difference between results found and those found by Nascimento et al. (2011) may be caused by the distinct LULC maps used: while we used annual LULC maps from MCD12Q1 product, Nascimento et al. (2011) used the LULC map provided by MMA (2002). Ichoku et al. (2016), who also used MODIS active fires and MCD12Q1 data, found more than 75 % of the satellite fire detections in the northern sub-Saharan region occurring in savanna and woody savannas areas during the 2001–2014 period, which is also suffering under the LULCC process from natural areas to croplands.
Regarding the spatial distribution of fires in the biome, Fig. 3a shows the total of hotspots detected by MODIS active fire products in the Cerrado during the 2002–2015 period considering a regular grid of 0.25∘. The LULCC process in the Cerrado began in the 1970s in the southern region of the biome and advanced over the years to the northern region (Fearnside, 2000). Therefore, in the south of the biome land use is well established since human occupation in these areas is older, and LULCC from natural remnants to other land uses is not frequent because there are few natural remnants of the Cerrado, causing lower concentration of hotspots. According to INPE (2015), in 2013 the states of São Paulo (SP), Paraná (PR) and Mato Grosso do Sul (MS), located in the south of the biome and indicated in Fig. 3a, presented only 17, 37 and 31 % of natural cover in the areas of Cerrado, respectively. We can see a considerable number of hotspots in northern São Paulo state. In this region, fires are related to sugarcane pre-harvest burning: Brazil is the world leader in cropping sugarcane and most of the Brazilian sugarcane cultivation areas are located in the Cerrado areas of São Paulo state, responsible for approximately 50 % of the national production (Rudorff et al., 2010).
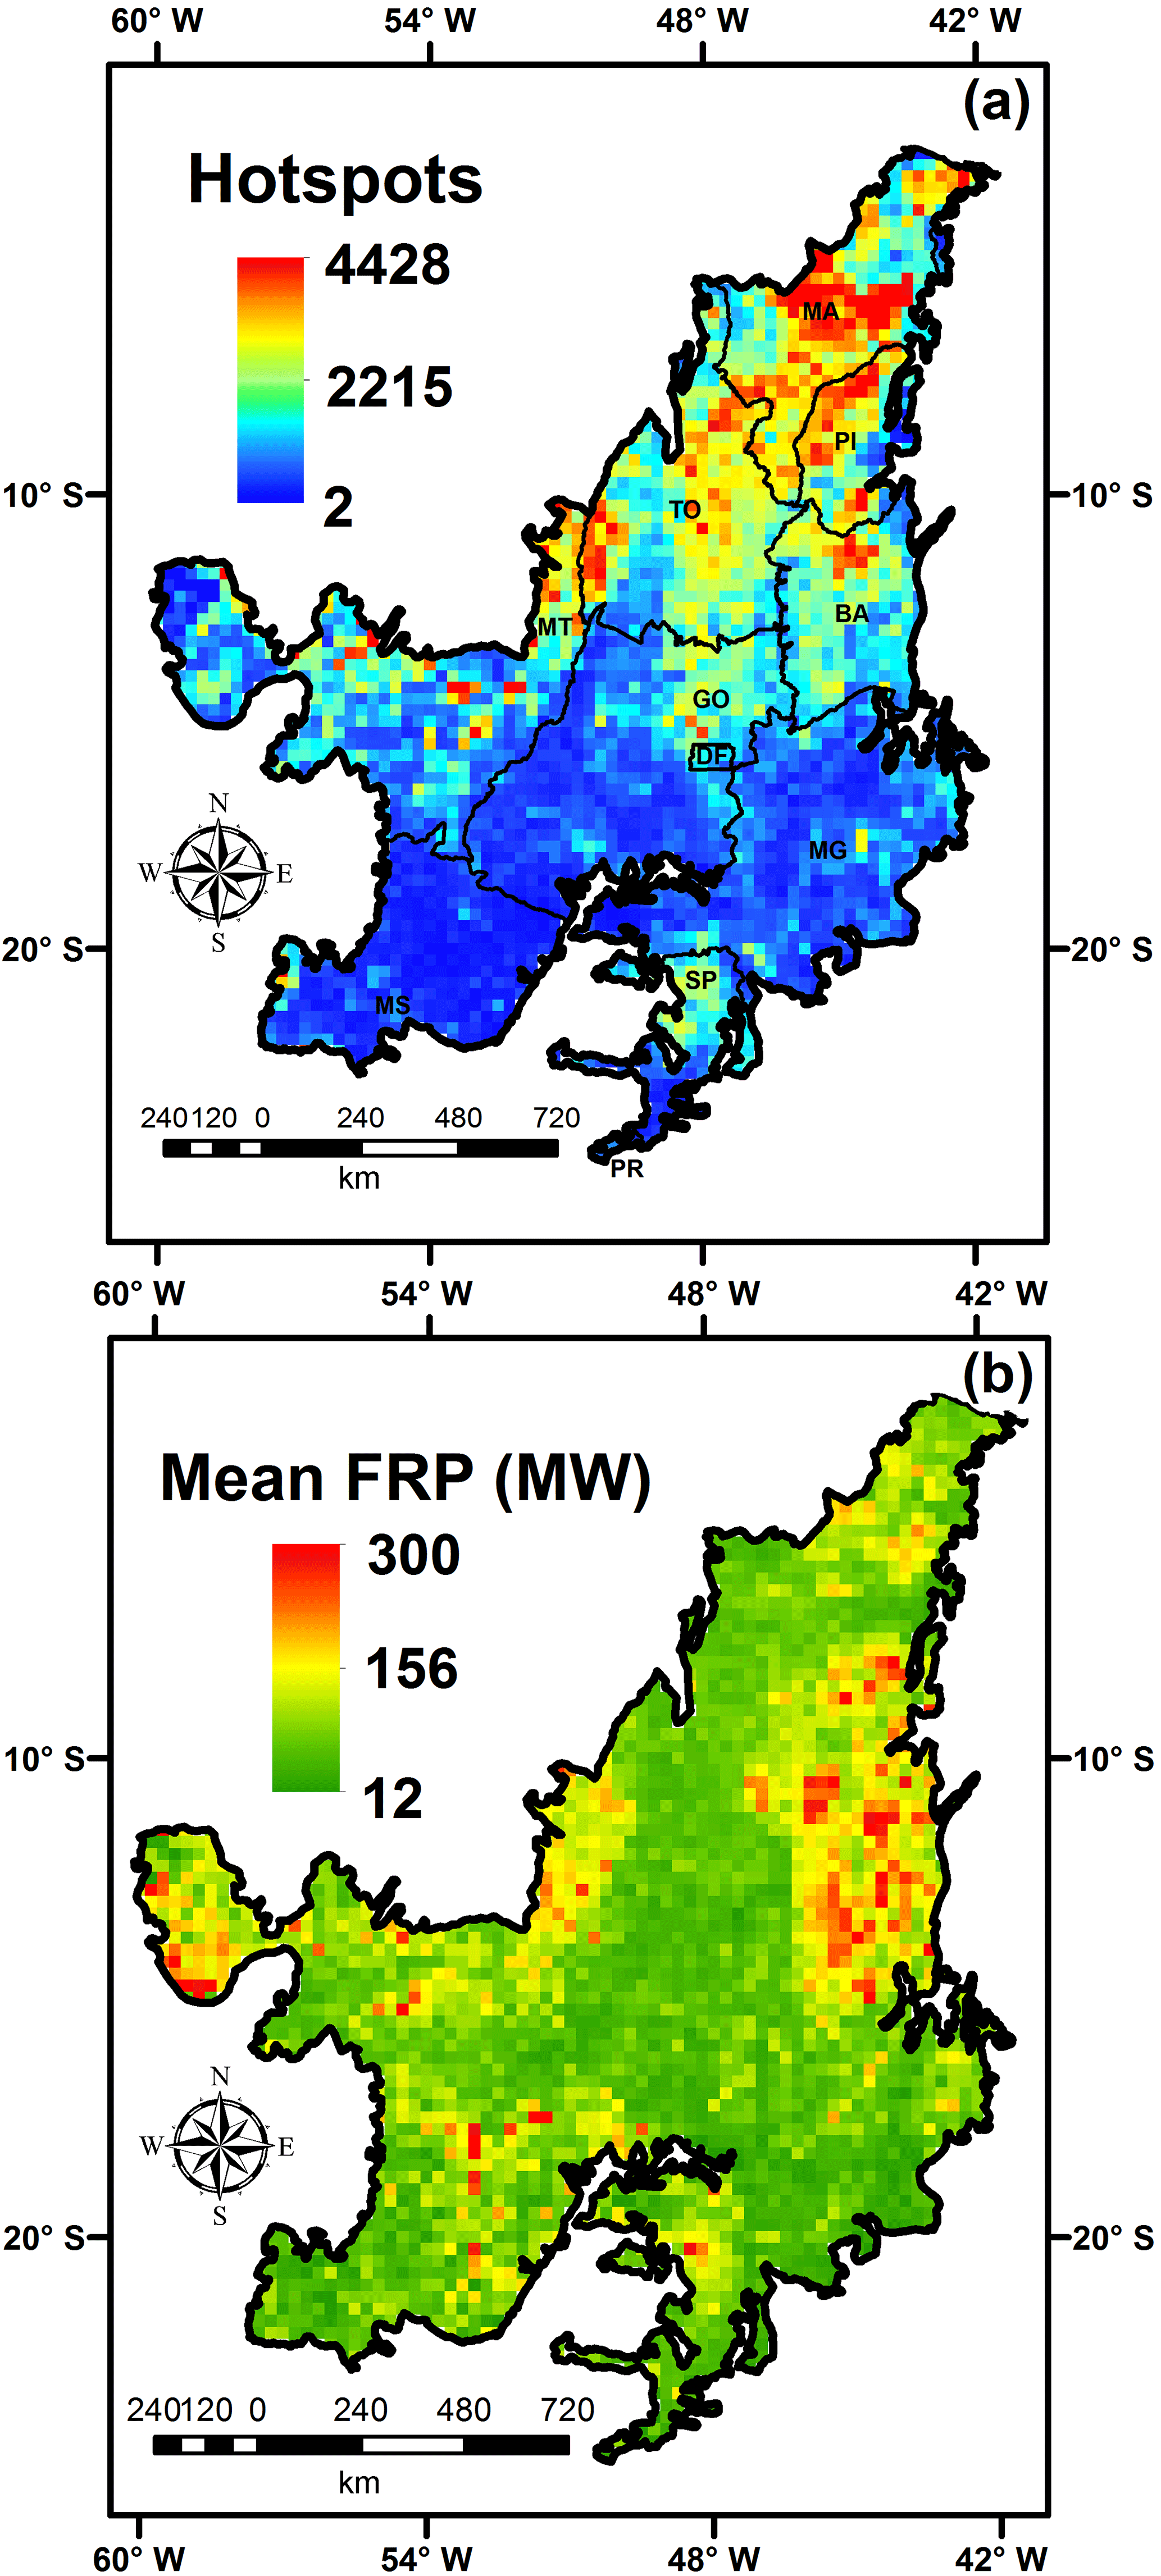
Figure 3(a) Total of hotspots and (b) mean FRP detected by the MODIS active fire products in the Cerrado biome between 2002 and 2015.

Figure 4Estimate of the month when (a) maximum of hotspots, (b) maximum of burned area, (c) minimum of precipitation and (d) minimum of VCI were found in the Cerrado for the 2002–2015 time series.
Over the years, the agricultural frontier advanced from central and northern Mato Grosso state (MT in Fig. 3a) to the central-northern and northeastern biome. Grecchi et al. (2014) analysed, between 1985 and 2005, the decrease of natural remnants in the Cerrado areas of the Mato Grosso state, traditional in the cultivation of soybeans, and concluded that approximately 42 % of the natural remnants of the Cerrado in the state were shifted to agricultural areas during the 20 years analysed. Furthermore, the north is the current agricultural expansion area in the Cerrado, especially in the eastern region of Maranhão, Piauí and Tocantins, western Bahia (MA, PI, TO and BA in Fig. 3a, respectively) and in the region known as MATOPIBA (boundary of Maranhão, Tocantins, Piauí and Bahia states). The Maranhão state presented the highest concentration of hotspots, concentrating 4428 hotspots in only one grid cell (approximately 316 hotspots yr−1). According to Spera et al. (2016), the MATOPIBA region can be considered an agricultural frontier since the early 2000s and, as opposed to other areas of the Cerrado, does not have a previous land use related to cattle ranching; therefore, agriculture is advancing over the natural remnants with the use of fire for converting the land use rather than advancing over previously cleared pasture areas. Moreover, according to INPE (2015), Bahia, Tocantins, Maranhão and Piauí states still had in 2013, respectively, 67, 72, 72 and 83 % of natural cover in the areas of Cerrado, making them potential areas for agricultural expansion. Analysing the spatial pattern of BA in the Cerrado using AQM BA product, Libonati et al. (2015b, 2016) also found highest concentration in the north of the biome. From the spatial distribution of FRP present in Fig. 3b, we can see that more intense fires are not necessarily located where hotspots are more concentrated. In fact, the intensity of fires is more dependent on climate and fuels conditions than the absolute number of fire detections (Govender et al., 2006; Rissi et al., 2017), and, therefore, fires occurring at the end of the dry season are potentially more intense (Archibald, 2016). Areas where average FRP was higher (Bahia and Piauí states), presenting an average FRP of up to 300 MW, are predominantly constituted of pasture areas or natural remnants composed of grasslands or savannas, and fires from fuels mostly composed of grassy formations tend to be more intense. For example, while a fire in North American native forest species with a biomass burning rate of 10 kg s−1 would have a corresponding FRP of 22 MW (Freeborn et al., 2008), a fire in African savanna formations with the same biomass burning rate would have a corresponding FRP of 27 MW (Wooster et al., 2005).
From spatial patterns of the month with highest incidence of hotspots and BA, and minimum precipitation and VCI in the Cerrado (Fig. 4), we see that analysing only averaged and/or summed values for the entire biome can hide some patterns. Despite having the highest average of hotspots in September (59.8 %), as discussed above, 19.4 % of the grid cells concentrated the highest incident of hotspots in August, 12.4 % in October, 1.5 % in June, 2.2 % in July, 2.1 % in November and 2.6 % in other months. Central Cerrado showed the highest incidence in September, while cells with the highest incidence in October were concentrated in the central-eastern of the biome. August peaks were found in the south of the Cerrado, agreeing with the peak of sugarcane harvest, and in the north of the biome. There are areas with different patterns, such as in the Mato Grosso state (MT in Fig. 3a), which are areas where fire occurrence is low and are not correlated with precipitation or VCI, as will be shown below. For BA, 52.4 % of the grid cells concentrated the highest incidence of BA in September, followed by 25.5 % in August, 11.8 % in October, 4.3 % in July, 2 % in June, 1.4 % in November and 2.6 % in other months. There is an increase in peaks occurring in August and a decrease in September when compared to hotspots, especially observed in the central-western area of the Cerrado. In Fig. 2, there is a notable value of average monthly total BA in August, close to the monthly average in September.
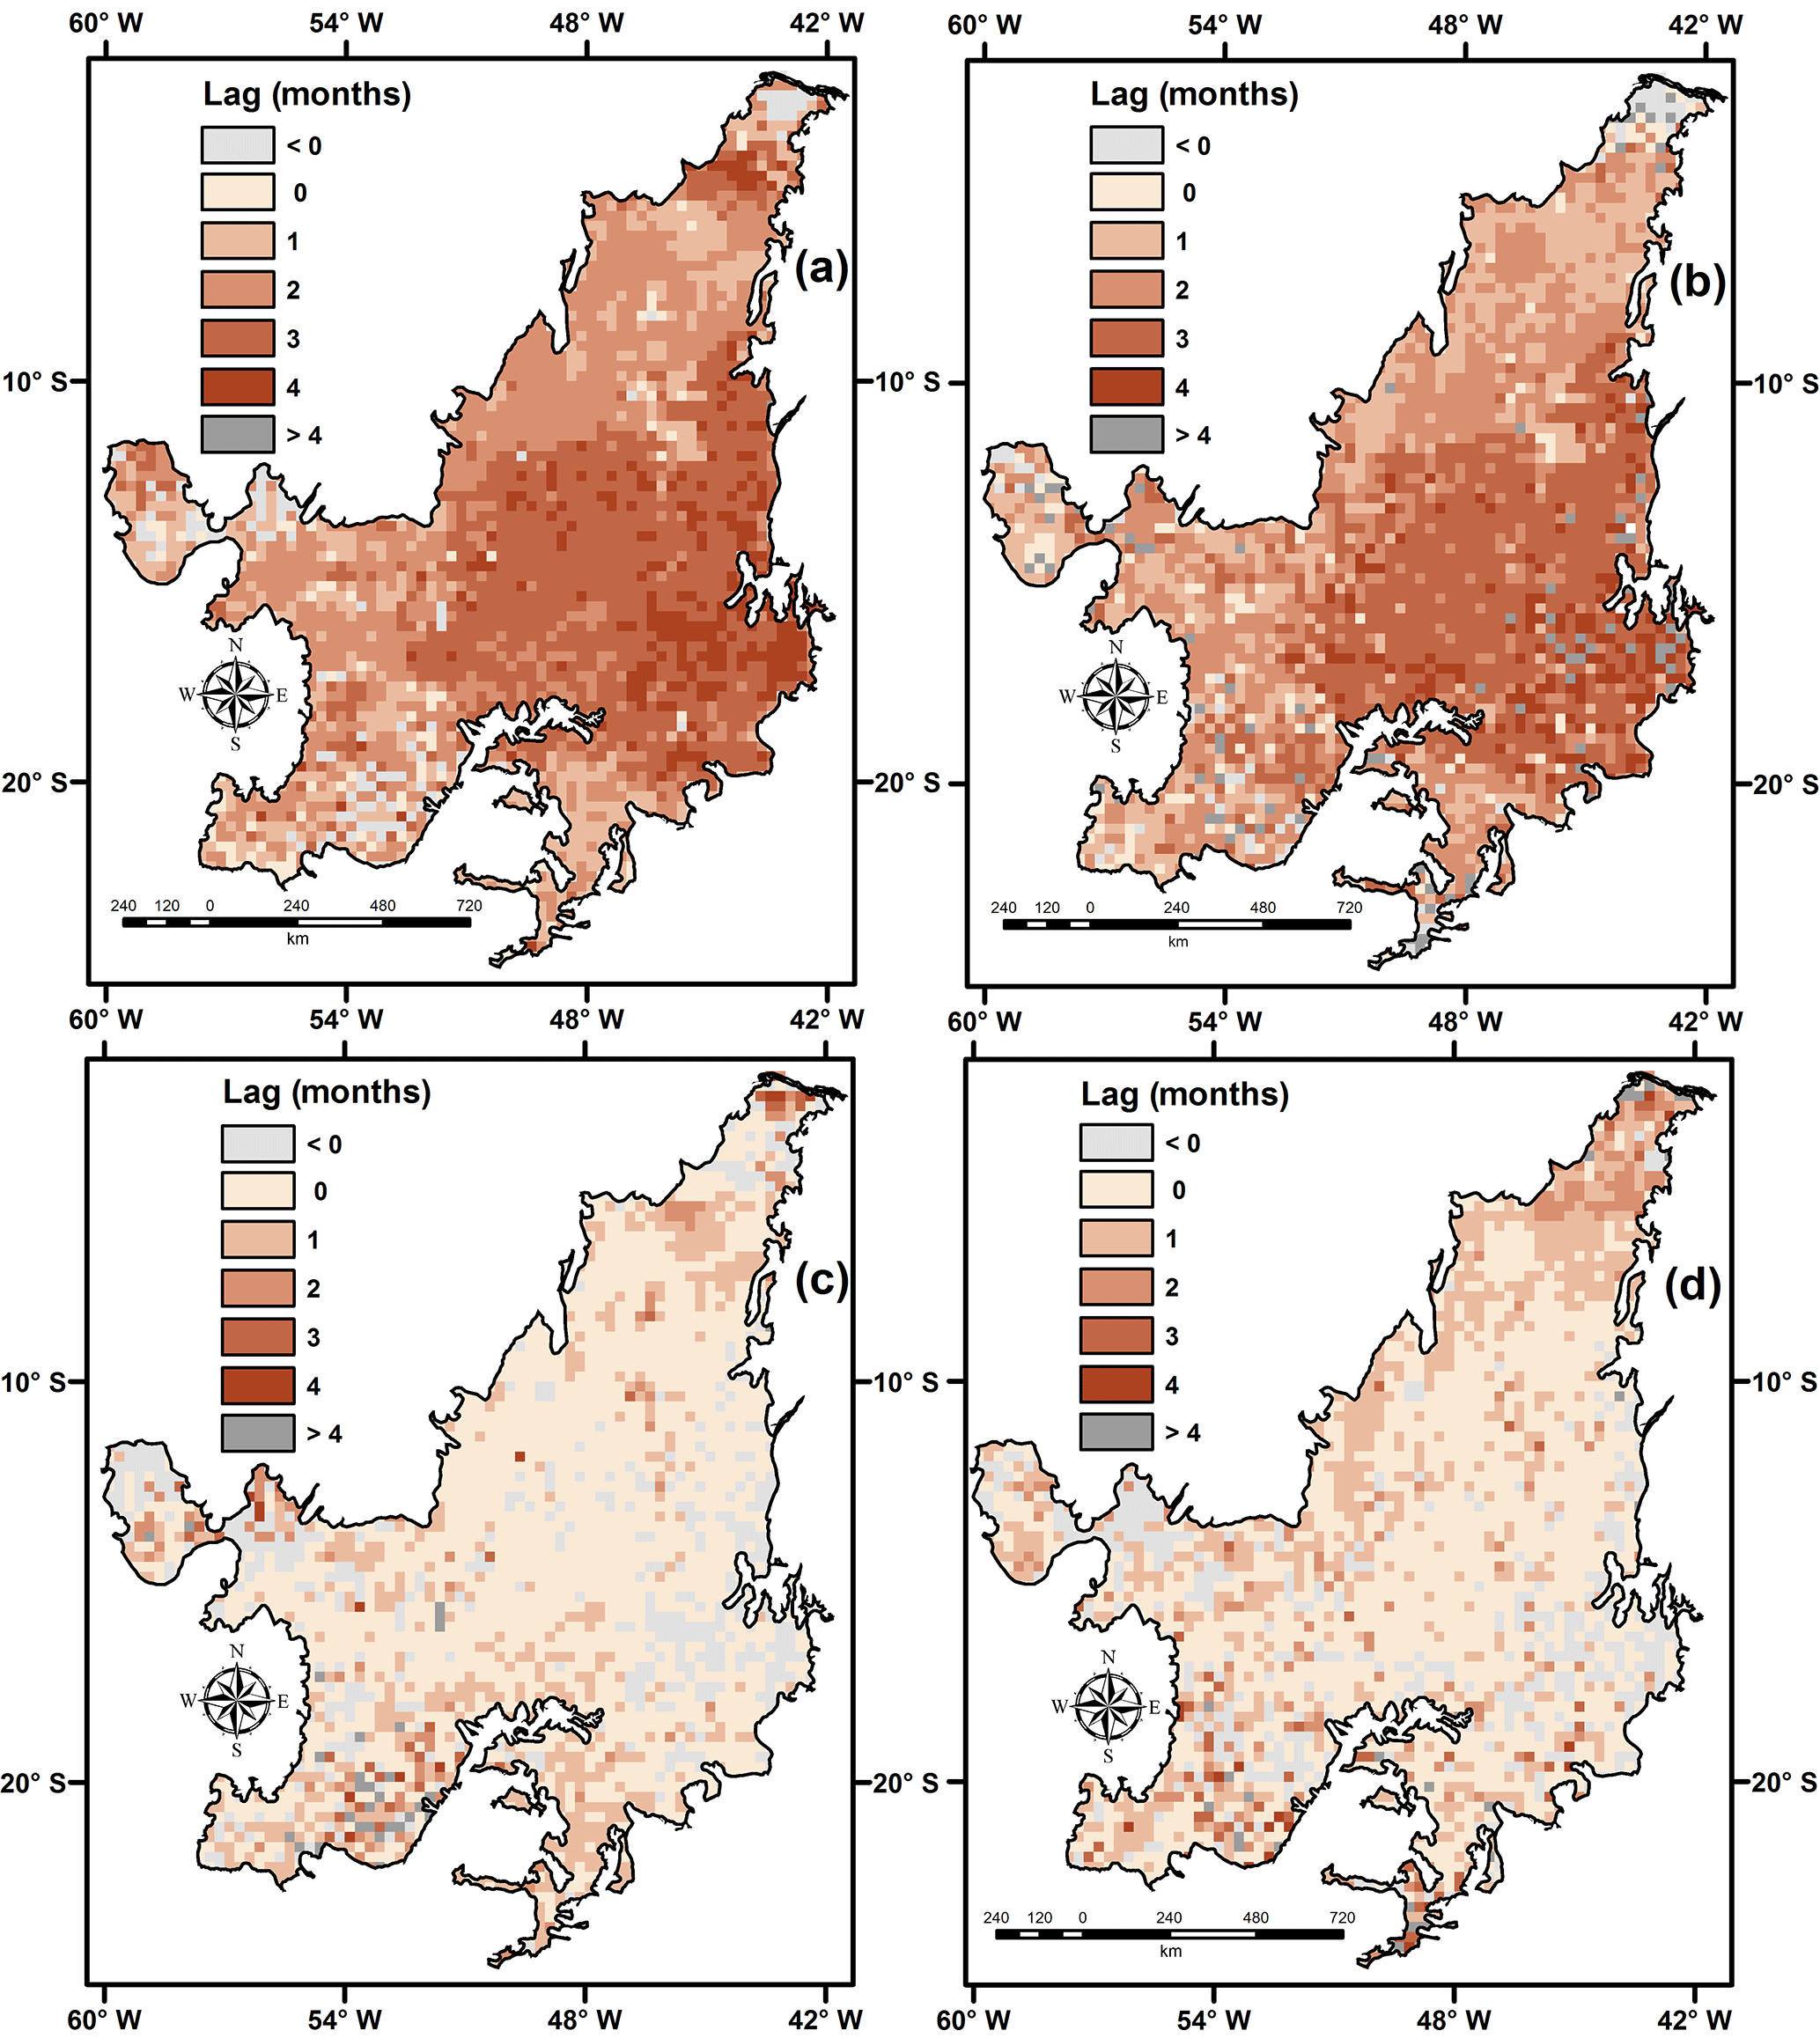
Figure 5Lag in months between (a) minimum of precipitation and maximum of hotspots, (b) minimum of precipitation and maximum of burned area, (c) minimum of VCI and maximum of hotspots and (d) minimum of VCI and maximum of burned area in the Cerrado for the 2002–2015 time series.
In Fig. 2, we see that monthly average precipitation is lower in August; however, Fig. 4c shows that minimum precipitation occurred during August for only 7 % of the Cerrado. July and June concentrated, respectively, 51.1 and 40 % of the minimum precipitation in the Cerrado. There is a clear concentration of minimum precipitation during June in the central-eastern biome, while minimum precipitation in July is distributed over the southern, central-western and northern biome. October and September accounted for, respectively, 1.6 and 0.3 % of the minimum precipitation in the Cerrado. Regarding VCI, most of the Cerrado (87 %) concentrated minimum VCI in September, followed by 6.7 % in August, 4 % in October and 2.3 % in other months. While minimum VCI in September is spatially distributed over almost all the Cerrado, areas presenting minimum VCI in October or other months concentrated in the extreme north of the biome, where the seasonal regime is distinct from the remaining Cerrado due to the ITCZ influence, and areas where minimum VCI occurred in August or other months were found in the west, a transitional area from the Cerrado to the Amazon biome. Here, it should be mentioned that not only droughts are responsible for lowering VCI values; among other reasons we can highlight senesce and fire occurrence. Therefore, minimum VCI values in September may also result from fires occurred in August or even the synergy of both drought and fires.
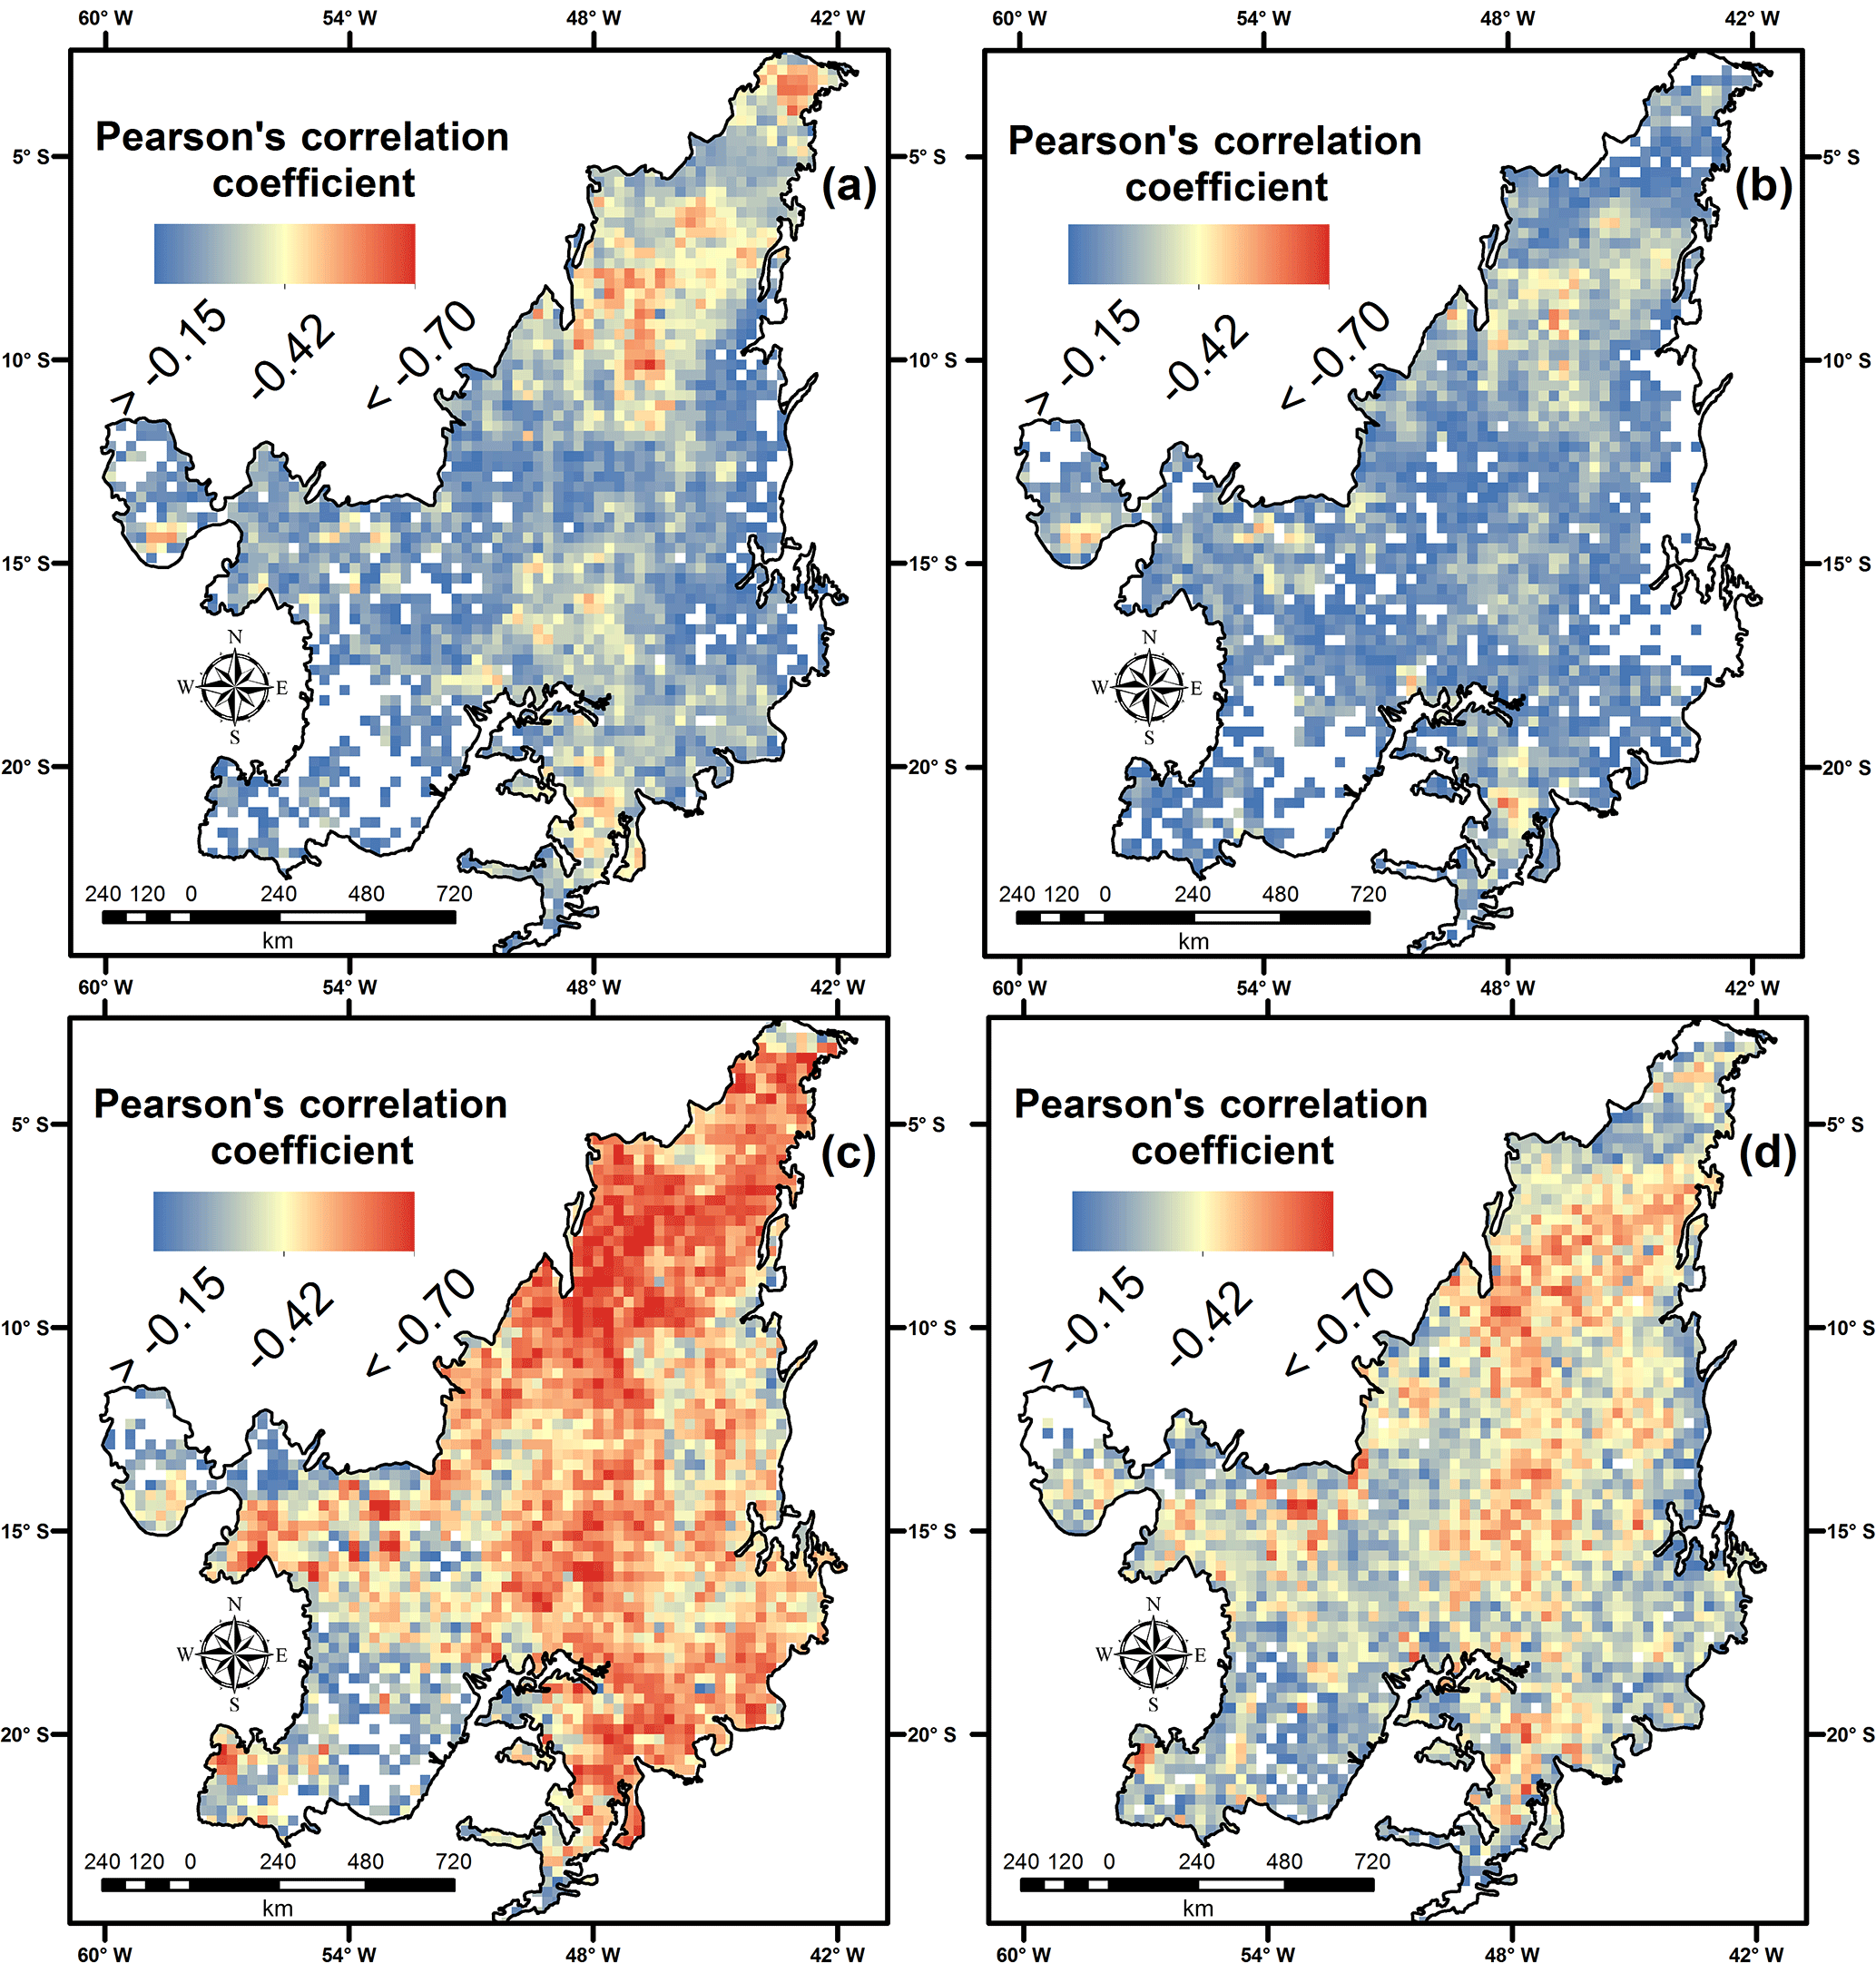
Figure 6Spatial correlation between (a) monthly total hotspots and monthly average precipitation, (b) monthly total burned area and monthly average precipitation, (c) monthly total hotspots and monthly average VCI and (d) monthly total burned area and monthly average VCI in the Cerrado biome during the 2002–2015 period. Only statistically significant pixels are shown in the figure.
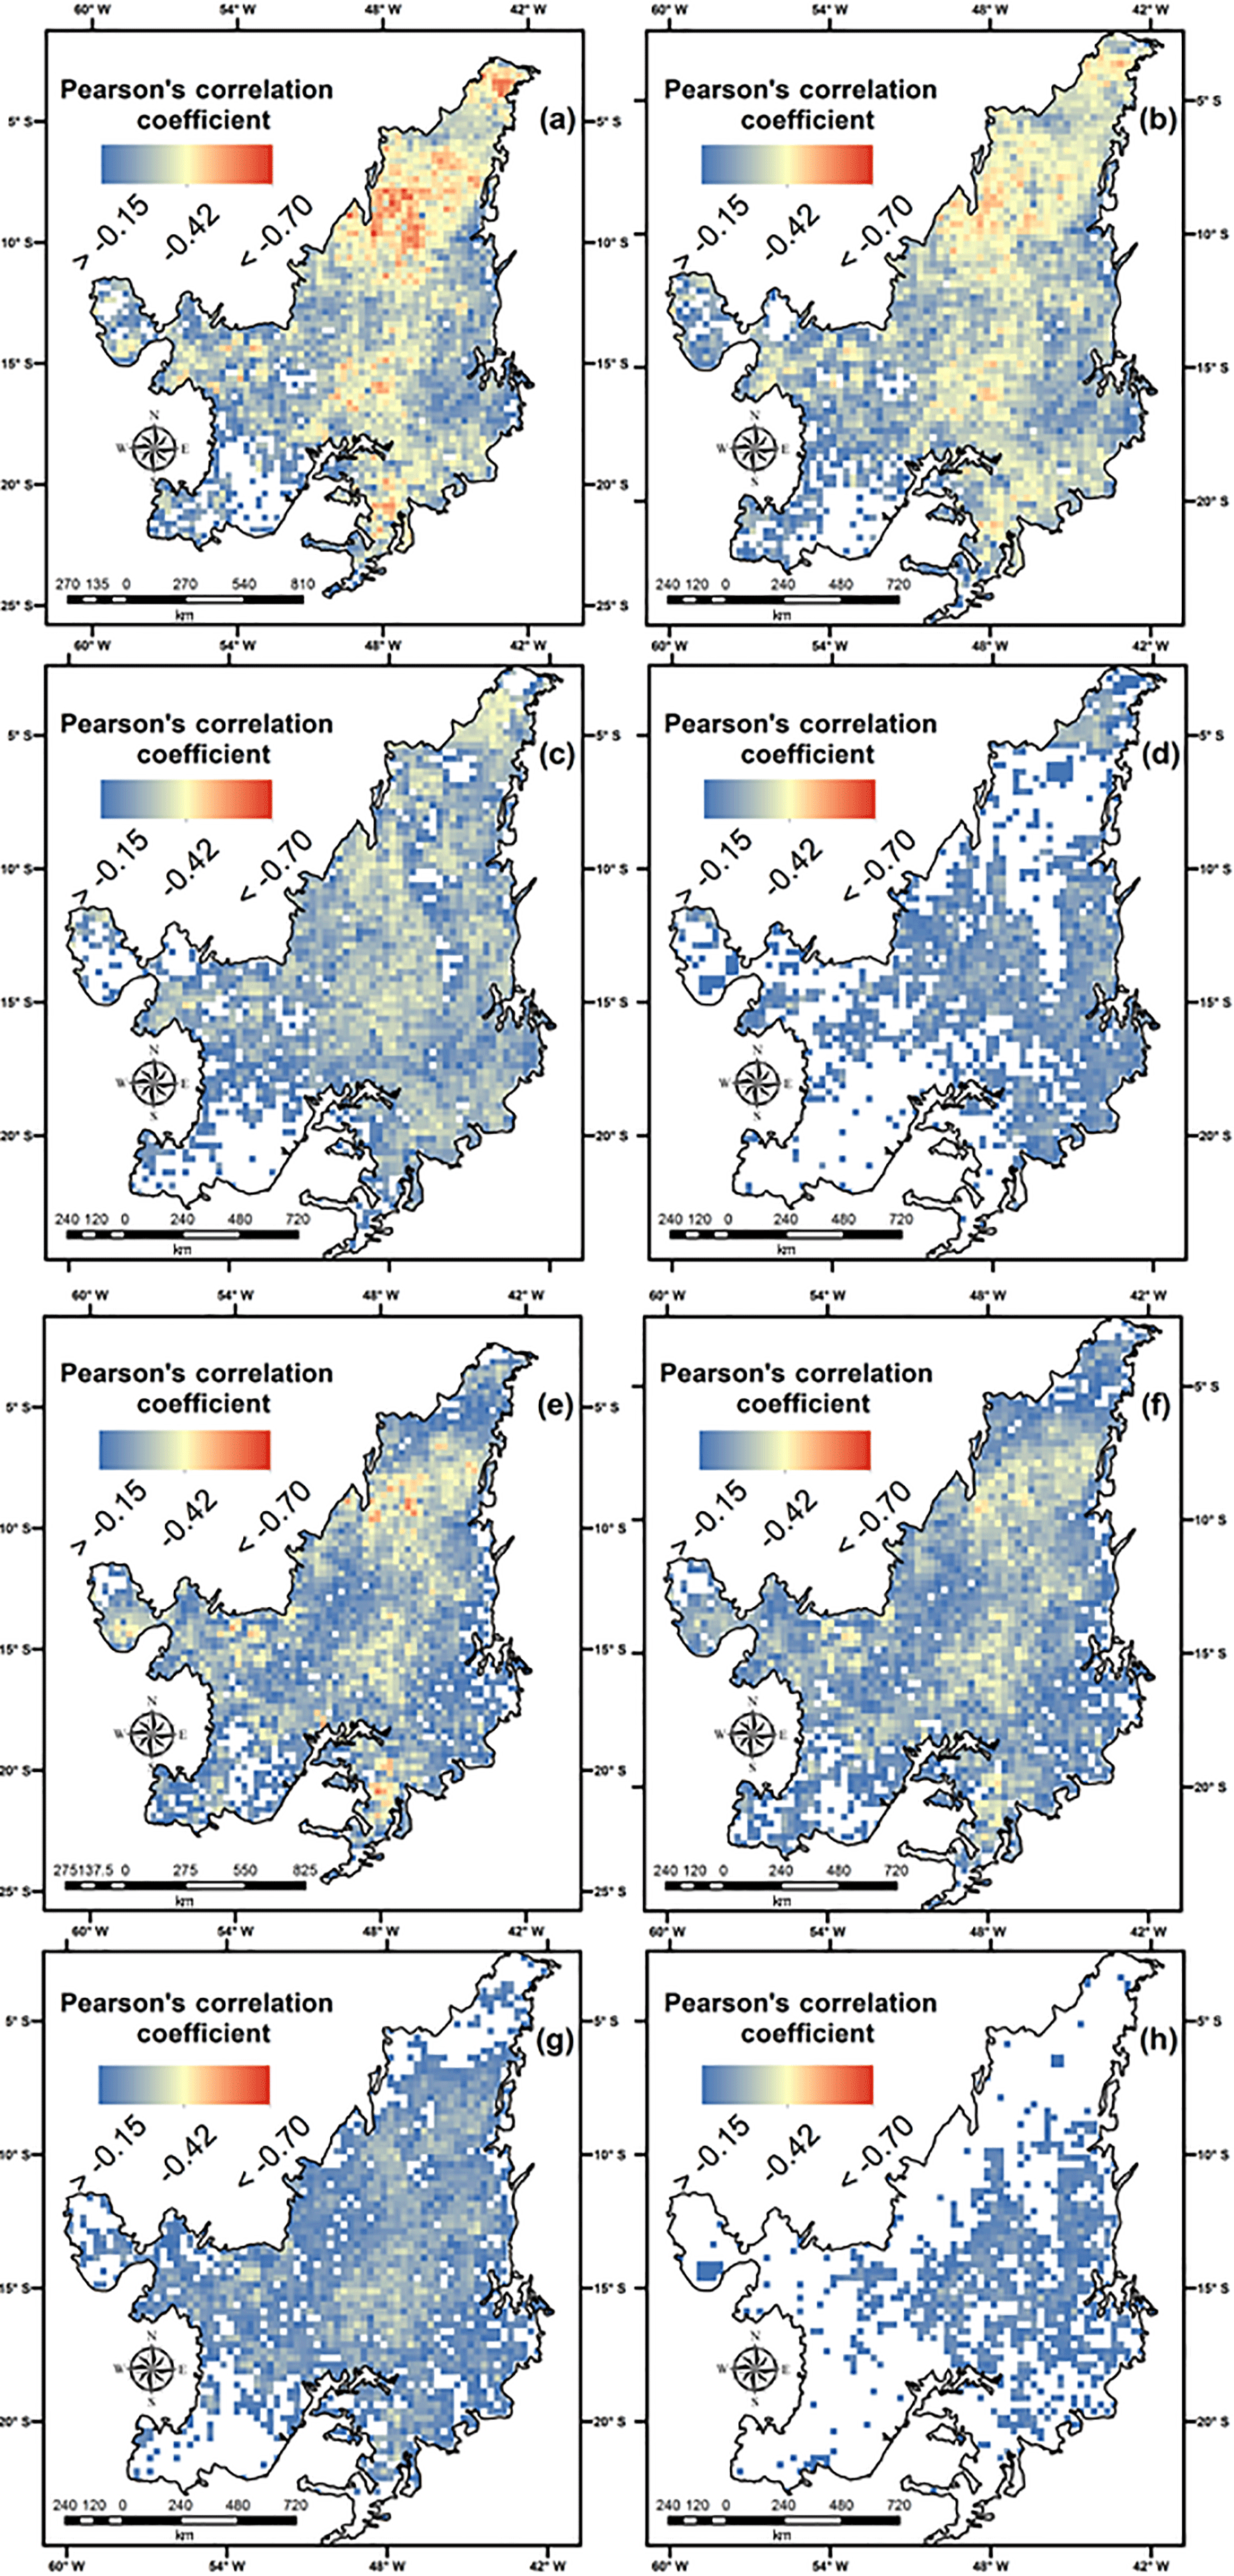
Figure 7Spatial correlation between (a) monthly total hotspots and 1-month lag monthly average precipitation, (b) monthly total hotspots and 2-month lag monthly average precipitation, (c) monthly total hotspots and 3-month lag monthly average precipitation, (d) monthly total hotspots and 4-month lag monthly average precipitation, (e) monthly total burned area and 1-month lag monthly average precipitation, (f) monthly total burned area and 2-month lag monthly average precipitation, (g) monthly total burned area and 3-month lag monthly average precipitation and (h) monthly total burned area and 4-month lag monthly average precipitation in the Cerrado biome. Only statistically significant pixels are shown in the figure.
The lag in months between the minimum of precipitation and maximum of hotspots, minimum of precipitation and maximum of BA, minimum of VCI and maximum of hotspots and minimum of VCI and maximum of BA is shown in Fig. 5. Hotspots and BA peak usually occur 2 or 3 months after the minimum of precipitation for most of the Cerrado. Two-month lags between hotspots and BA and precipitation were more common (34.2 and 30.1 % of the Cerrado, respectively) and presented values very close to 3-month lags (32 and 30 %, respectively). Three-month lags were especially concentrated in central-eastern Cerrado, where most of the minimum precipitation occurs in June. One-month lag areas (17.4 and 22.4 %, respectively) occurred in the sugarcane areas of São Paulo state and in the areas where hotspots were more concentrated during the 2002–2015 period (Fig. 3a), possibly related to the use of fire at the end of the dry season for enhancing the removal of the natural vegetation in cleared areas or stimulating regrowth of pasture for cattle feeding. No lags between hotspots and precipitation and between BA and precipitation were found, respectively, in 3.7 and 5 % of the Cerrado, such as in the Mato Grosso do Sul state (MS in Fig. 3a), while areas with minimum of precipitation at the beginning of the dry season and maximum of hotspots and BA at the end of the dry season (4-month lag) accounted for 8.5 and 5.9 %, especially those located in the extreme north of the biome. Other lags occurred in areas with a low occurrence of fires and areas that are not correlated with precipitation or VCI, 4.2 and 6.6 % of the Cerrado, respectively. While maximums of hotspots and BA usually occur 2 or 3 months after the minimum of precipitation in the Cerrado, maximums of hotspots and BA are concentrated in the same month when VCI is minimum for most of the Cerrado (59.7 and 51.4 % of the area of the biome, respectively). One-month lags were also considerable (18 and 24.2 %, respectively), mostly occurring in the south and north of the biome, as well as areas where the maximum of hotspots and BA was found before the minimum VCI (16.3 and 14.9 %, respectively). Thus, more than 75 % of the Cerrado presented lag of up to 1 month between minimum VCI and maximum of hotspots or BA, showing that VCI is a good indicator of the vegetation condition and its susceptibility to ignition. Areas where maximum hotspots and BA occurred before minimum VCI may also result from land management techniques, where anthropic action is the main driver for the occurrence of fires, and areas where fires are not usual, such as in the south of the Mato Grosso do Sul state (MS in Fig. 3a).
Accordingly, spatial correlations between monthly total hotspots and monthly average precipitation, between monthly total BA and monthly average precipitation, between monthly total hotspots and monthly average VCI and between monthly total BA and monthly average VCI are shown in Fig. 6. Results found in Fig. 6 show that hotspots and BA are better correlated with VCI than precipitation in the Cerrado. The relatively lower correlation obtained for both hotspots and BA with precipitation values (Fig. 6a and b) when compared to VCI values (Fig. 6c and d) can be explained by the results shown in Fig. 5, which presented the higher monthly lag between hotspots and BA with precipitation than the monthly lag between hotspots and BA with VCI. Correlations between monthly total hotspots and monthly average precipitation, between monthly total BA and monthly average precipitation, between monthly total hotspots and monthly average VCI and between monthly total BA and monthly average VCI were, respectively, significant in 83, 75, 94 and 94 % of the Cerrado. Spatially, higher correlations for all the four pairs of variables analysed were found in the areas that concentrated most of the hotspots (Fig. 3a), located in the central-north and northeast of the biome. It is also worth mentioning the good correlations for the four pairs of variables analysed in the south of the biome, in the areas related to sugarcane pre-harvest burning. According to Aguiar et al. (2011), more than 100 000 km2 of sugarcane cultivation areas used pre-harvest burning between 2006 and 2011 in São Paulo state, being that pre-harvest burning was higher in years of lower precipitation, such as 2010. Considering the monthly values analysed, hotspots and VCI (Fig. 6c) were the better correlated variables, reaching values lower than -0.7 in many grid cells, especially in the north of the biome, and BA was also better correlated with VCI than precipitation. Moreover, the results recently found by Nogueira et al. (2017) should be mentioned, which computed several FDIs in the Brazilian biomes and suggest that the relationship between climate-related drivers and fires, expressed by FDIs and BA correlation, is biome-specific to explain the seasonal variation of BA in the Brazilian biomes, since FDIs computed from empirical water balances considering a lower soil capacity are more correlated with the seasonal pattern of fire occurrence in the Cerrado. Still considering the results in Fig. 6, we can state that precipitation can be used as a previous indicator for the occurrence of fires, while VCI can be used as an instantaneous indicator of fire risk in the Cerrado, depending on the location within the biome for both cases. Moreover, if we correlate monthly total hotspots or BA with monthly average precipitation from 1, 2, 3 or 4 months before, there are relative persistent correlation values close to −0.4 up to 3-month lag, especially in the north, extreme north and south of the biome, as seen in Fig. 7, showing that the relationship between precipitation and fires needs to consider precipitation from previous months.
Furthermore, van der Werf et al. (2008) analysed the climatic control on the variability of fire in the tropical and subtropical areas of the globe and showed the importance of other factors in controlling the occurrence of fires in the savannas: besides climate, land use and grazing also influence the amount of fuel available for burning; therefore, the relationship between fires and precipitation or VCI may not be uniform. Additionally, the authors also point out that in the savannas the seasonal ignition of anthropic fires depends on the land management: prescribed fires are set at the end of the dry season, aiming to increase the removal of unwanted plant species and favour resprouting, or at the beginning of the dry season to reduce soil depletion and the probability of uncontrolled wildfires, which may contribute to the results found in this study and by them. Accordingly, Price et al. (2012) investigated the use of prescribed fires in savanna landscapes of western Arnhem Land (Australia) and concluded that imposing prescribed fires at the beginning of the dry season can substantially reduce BA and fire severity. For the Cerrado, Rissi et al. (2017) compared fire behaviour in early, middle and late dry season and found that fire intensity is mainly influenced by the combination of dead fuel percentage and fuel load.
However, according to van der Werf et al. (2008), climate may impose limitations for the occurrence of fires in these areas, since drier periods improve the removal of vegetation during the clearing process; fires in the savannas predominantly occur over short grassland vegetation, whose development is directly related to the previous wet season. Randerson et al. (2005) positively correlated the severity of the fire season in the Cerrado with the terrestrial water storage in the early wet season, which, according to Chen et al. (2013), suggests that the increase of fuel loads in the Cerrado may expand the occurrence of fires in the upcoming dry season.
Data derived from orbital remote sensing were used to characterize the fire, precipitation and vegetation condition regimes in the Cerrado, as well as spatial patterns and correlation between the variables. This approach was successful for establishing patterns and can be used for analysing other vegetated areas of the globe affected by fires.
Time series of monthly values for the entire biome showed that fires in the biome are higher in September and October, according to the end of the dry season and beginning of the rainy season, which can variate within the biome, when the deficit in precipitation and extreme vegetation condition reached maximum indices. However, spatial analysis showed patterns that are not sen in time series analysis of monthly average and summed values. For example, monthly values indicated minimum precipitation in August; however, spatial analysis identified minimum precipitation in August for only 7 % of the Cerrado. Therefore, the variation of the variables analysed within the biome must be considered to better describe fire patterns and climate-related fire drivers in the Cerrado.
Besides the increasing anthropic pressure and changes in the LULC of the biome, hotspots and BA tend to decrease during the period analysed, probably a result of the fragmented landscape and smaller BA patches, more difficult to be detected by orbital sensors such as MODIS. Nevertheless, it should be considered that the time series analysed in the study corresponded to 14 years; therefore, longer time series should be investigated in future studies in order to verify trends found.
We found that 72 % of the hotspots detected in the Cerrado occurred in savanna areas, which is the predominant land use of biome. However, MCD12Q1 annual LULC maps showed major discrepancies when compared to Landsat-based LULC maps; therefore, future efforts should concentrate on validating the MCD12Q1 product in the Cerrado.
Spatial analysis also showed that more intense fire occurrences were not necessarily found where hotspots were more concentrated (north of the biome, the current agricultural frontier of the Cerrado), showing the link between FRP and fuel type and condition rather than the absolute number of detections.
Our results qualify VCI as an indicator of the susceptibility of vegetation to ignition, while precipitation can be used as a previous indicator for the occurrence of fires. Still, future studies should especially focus on the anthropic action as a driver for the occurrence of fires in the Cerrado, which seems to be able to change fire patterns in the tropical savannas according to the land management technique imposed.
All the remote sensing data used in this study (MODIS and TRMM data sets) are provided by NASA.
The authors declare that they have no conflict of interest.
We thank the National Counsel of Technological and Scientific Development
(CNPq, grant number 162898/2015-0), the Minas Gerais State Research
Foundation (FAPEMIG, grant number APQ-01698-14), and the Coordination for
the Improvement of Higher Education Personnel (CAPES, grant number
6123/2015-05) for their financial support.
Edited by: Ricardo Trigo
Reviewed by: two anonymous referees
Aguiar, D. A., Rudorff, B. F. T., Silva, W. F., Adami, M., and Mello, M. P.: Remote sensing images in support of environmental protocol: monitoring the sugarcane harvest in São Paulo State, Brazil, Remote Sens., 3, 2682–2703, https://doi.org/10.3390/rs3122682, 2011.
Andela, N., van der Werf, G. R., Kaiser, J. W., van Leeuwen, T. T., Wooster, M. J., and Lehmann, C. E. R.: Biomass burning fuel consumption dynamics in the tropics and subtropics assessed from satellite, Biogeosciences, 13, 3717–3734, https://doi.org/10.5194/bg-13-3717-2016, 2016.
Andela, N., Morton, D. C., Giglio, L., Chen, Y., van der Werf, G. R., Kasibhatla, P. S., DeFries, R. S., Collatz, G. J., Hantson, S., Kloster, S., Bachelet, D., Forrest, M., Lasslop, G., Li, F., Mangeon, S., Melton, J. R., Yue, C., and Randerson, J. T.: A human-driven decline in global burned area, Science, 356, 6345, https://doi.org/10.1126/science.aal4108, 2017.
Andersen, A. N., Cook, G. D., Corbett, L. K., Douglas, M. M., Eager, R. W., Russel-Smith, J., Setterfield, S. A., Williams, R. J., and Woinarski, J. C. Z.: Fire frequency and biodiversity conservation in Australian tropical savannas: implications from the Kapalga fire experiment, Austral Ecol., 30, 155–167, https://doi.org/10.1111/j.1442-9993.2005.01441.x, 2005.
Archibald, S.: Managing the human component of fire regimes: lessons from Africa, Philos. T. R. Soc. B, 371, 1696, https://doi.org/10.1098/rstb.2015.0346, 2016.
Archibald, S., Nickless, A., Govender, N., Scholes, R. J., and Lehsten V.: Climate and the inter-annual variability of fire in southern Africa: a meta-analysis using long-term field data and satellite-derived burnt area data, Global Ecol. Biogeogr., 19, 794–809, https://doi.org/10.1111/j.1466-8238.2010.00568.x, 2010.
Archibald, S., Carla Staver, A., and Levin, S. A.: Evolution of human-driven fire regimes in Africa, P. Natl. Acad. Sci. USA, 109, 847–852, https://doi.org/10.1073/pnas.1118648109, 2012.
Bajocco, S., Dragoz, E., Gitas, I., Smiraglia, D., Salvati, L., and Ricotta, C.: Mapping forest fuels through vegetation phenology: the role of coarse-resolution satellite time-series, Plos One, 10, e0119811, https://doi.org/10.1371/journal.pone.0119811, 2015.
Benali, A., Mota, B., Carvalhais, N., Oom, D., Miller, L. M., Campagnolo, M. L., and Pereira, J. M. C.: Bimodal fire regimes unveil a global-scale anthropogenic fingerprint, Global Ecol. Biogeogr., 26, 799–811, https://doi.org/10.1111/geb.12586, 2017.
Beuchle, R., Grecchi, R. C., Shimabukuro, Y. E., Seliger, R., Eva, H. D., Sano, E., and Achard, F.: Land cover changes in the Brazilian Cerrado and Caatinga biomes from 1990 to 2010 based on a systematic remote sensing sampling approach, Appl. Geogr., 58, 116–127, https://doi.org/10.1016/j.apgeog.2015.01.017, 2015.
Bickel, U. and Dros, J. M.: The impacts of soybean cultivation on Brazilian ecosystems: Three case studies, WWF Forest Conversion Initiative, Washington, USA, 33 pp., 2003.
Bowman, D. M. J. S., Balch, J. K., Artaxo, P., Bond, W. J., Carlson, J. M., Cochrane, M. A., D'Antonio, C. M., DeFries, R. S., Doyle, J. C., Harrison, S. P., Johnston, F. H., Keeley, J. E., Krawchuk, M. A., Kull, C. A., Marston, J. B., Moritz, M. A., Prentice, I. C., Roos, C. I., Scott, A. C., Swetnam, T. W., van der Werf, G. R., and Pyne, S. J.: Fire in the Earth System, Science, 324, 5926, https://doi.org/10.1126/science.1163886, 2009.
Brunson, M. W. and Tanaka, J.: Economic and social impacts of wildfires and invasive plants in American deserts: lessons from the Great Basin, Range. Ecol. Manage., 64, 463–470, https://doi.org/10.2111/REM-D-10-00032.1, 2011.
Cardozo, F. S., Pereira, G., Shimabukuro, Y. E., and Moraes, E. C.: Validation of MODIS MCD45A1 product to identify burned areas in Acre State - Amazon forest, in: Proceedings of the IEEE 2012 International Geoscience and Remote Sensing Symposium, 22–27 July 2012, München, Germany, 6741–6744, 2012.
Chen, Y., Morton, D. C., Jin, Y., Collatz, G. J., Kasibhatla, P. S., van der Werf, G. R., DeFries, R. S., and Randerson, J. T.: Long-term trends and interannual variability of forest, savanna and agricultural fires in South America, Carbon Manag., 4, 617–638, https://doi.org/10.4155/cmt.13.61, 2013.
Chéret, V. and Denux, J. P.: Mapping wildfire danger at regional scale with an index model integrating coarse spatial resolution remote sensing data, J. Geophys. Res.-Biogeo., 112, G02006, https://doi.org/10.1029/2005jg000125, 2007.
Chéret, V. and Denux, J. P.: Analysis of MODIS NDVI time series to calculate indicators of Mediterranean forest fire susceptibility, GISci. Rem. Sens., 48, 171–194, https://doi.org/10.2747/1548-1603.48.2.171, 2011.
Coelho, C. A. S., de Oliveira, C. P., Ambrizzi, T., Reboita, M. S., Carpenedo, C. B., Campos, J. L. P. S., Tomaziello, A. C. N., Pampuch, L. A., Custódio, M. S., Dutra, L. M. M., da Rocha, R. P., and Rehbein, A.: The 2014 southeast Brazil austral summer drought: regional scale mechanisms and teleconnections, Clim. Dynam., 46, 11–12, https://doi.org/10.1007/s00382-015-2800-1, 2016.
Coleve, P. A.: Aplicação de índices das condições de vegetação no monitoramento em tempo quase real da seca em Moçambique usando NOAA AVHRR-NDVI, GEOUSP, 29, 85–95, 2011.
Coutinho, L. M.: Fire in the Ecology of the Brazilian Cerrado, in: Fire in the Tropical Biota: Ecosystem Processes and Global Challenges, Goldammer, J. G., Springer-Verlag, Berlin, Germany, 82–105, 1990.
Dias, B. F. S.: Cerrados: Uma caracterização, in: Alternativas de desenvolvimentos dos Cerrados: Manejo e conservação dos recursos naturais renováveis, FUNATURA, Brasília, Brazil, 11–25, 1992.
Didan, K.: MOD13A3: MODIS/Terra vegetation Indices Monthly L3 Global 1km SIN Grid V006, available at: https://lpdaac.usgs.gov/dataset_discovery/modis/modis_products_table/mod13a3_v006 (last access: 20 November 2017), 2015.
Durigan, G. and Ratter, J. A.: The need for a consistent fire policy for Cerrado conservation, J. Appl. Ecol., 53, 11–15, https://doi.org/10.1111/1365-2664.12559, 2016.
Fearnside, P. M.: Global warming and tropical land-use Change: Greenhouse gas emissions from biomass burning, decomposition and soils in forest conversion, shifting cultivation and secondary vegetation, Climatic Change, 46, 1–2, https://doi.org/10.1023/a:1005569915357, 2000.
Fearnside, P. M.: Soybean cultivation as a threat to the environment in Brazil, Environ. Conserv., 28, 23–38, https://doi.org/10.1017/s0376892901000030, 2001.
Freeborn, P. H., Wooster, M. J., Hao, W. M., Ryan, C. A., Nordgren, B. L., Baker, S. P., and Ichoku, C.: Relationships between energy release, fuel mass loss, and trace gas and aerosol emissions during laboratory biomass fires, J. Geophys. Res.-Atmos., 113, D01301, https://doi.org/10.1029/2007JD008679, 2008.
Friedl, M. A., Mclver, D. K., Hodges, J. C. F., Zhang, X. Y., Muchoney, D., Strahler, A. H., Woodcock, C. E., Gopal, S., Schneider, A., Cooper, A., Baccini, A., Gao, F., and Schaaf, C.: Global land cover mapping from MODIS: algorithms and early results, Remote Sens. Environ., 83, 1–2, https://doi.org/10.1016/S0034-4257(02)00078-0, 2002.
Friedl, M. A., Sulla-Menashe, D., Tan, B., Schneider, A., Ramankutty, N., Sibley, A., and Huang, X.: MODIS Collection 5 global land cover: Algorithm refinements and characterization of new datasets, Remote Sens. Environ., 114, 168–182, https://doi.org/10.1016/j.rse.2009.08.016, 2010.
Giglio, L., Descloitres, J., Justice, C. O., and Kaufman, Y. J.: An enhanced contextual fire detection algorithm for MODIS, Remote Sens. Environ., 87, 2–3, https://doi.org/10.1016/s0034-4257(03)00184-6, 2003.
Giglio, L., Schroeder, W., and Justice, C. O.: The collection 6 MODIS active fire detection algorithm and fire products, Remote Sens. Environ., 178, 31–41, https://doi.org/10.1016/j.rse.2016.02.054, 2016.
Govender, N., Trollope, W. S. W., and van Wilgen, B. W.: The effect of fire season, fire frequency, rainfall and management on fire intensity in savanna vegetation in South Africa, J. Appl. Ecol., 43, 748–758, https://doi.org/10.1111/j.1365-2664.2006.01184.x, 2006.
Grecchi, R. C., Gwyn, Q. H. J., Bénié, G. B., Formaggio, A. R., and Fahl, F. C.: Land use and land cover changes in the Brazilian Cerrado: A multidisciplinary approach to assess the impacts of agricultural expansion, Appl. Geogr., 55, 300–312, https://doi.org/10.1016/j.apgeog.2014.09.014, 2014.
Hantson, S., Padilla, M., Corti, D., and Chuvieco, E.: Strengths and weaknesses of MODIS hotspots to characterize global fire occurrence, Remote Sens. Environ., 131, 152–159, https://doi.org/10.1016/j.rse.2012.12.004, 2013.
IBGE: Brazilian Institute for Geography and Statistics: Brazilian biomes, available at: http://downloads.ibge.gov.br/downloads_geociencias.htm (last access: 2 February 2017), 2010.
Ichoku, C., Kahn, R., and Chin, M.: Satellite contributions to the quantitative characterization of biomass burning for climate modeling, Atmos. Res., 111, 1–28, https://doi.org/10.1016/j.atmosres.2012.03.007, 2012.
Ichoku, C., Ellison, L. T., Willmot, K. E., Matsui, T., Dezfuli, A. K., Gatebe, C. K., Wang, J., Wilcox, E. M., Lee, J., Adegoke, J., Okonkwo, C., Bolten, J., Policelli, F. S., and Habib, S.: Biomass burning, land-cover change, and the hydrological cycle in Northern sub-Saharan Africa, Environ. Res. Lett., 11, 095005, https://doi.org/10.1088/1748-9326/11/9/095005, 2016.
INPE: National Institute for Space Research: TerraClass Cerrado Project: Mapping land-use and land-cover in the Cerrado, available at: http://www.dpi.inpe.br/tccerrado/ (last access: 2 February 2017), 2015.
Jiao, W., Zhang, L., Chang, Q., Fu, D., Cen, Y., and Tong, Q.: Evaluating an enhanced Vegetation Condition Index (VCI) based on VIUPD for drought monitoring in the continental United States, Remote Sens., 8, 224, https://doi.org/10.3390/rs8030224, 2016.
Jolly, W. M., Cochrane, M. A., Freeborn, P. H., Holden, Z. A., Brown, T. J., Williamson, G. J., and Bowman, D. M. J. S.: Climate-induced variations in global wildfire danger from 1979 to 2013, Nat. Commun., 6, 7537, https://doi.org/10.1038/ncomms8537, 2015.
Justice, C. O., Townshend, J. R. G., Vermote, E. F., Masuoka, E., Wolfe, R. E., Saleous, N., Roy, D. P., and Morisette, J. T.: An overview of MODIS Land data processing and product status, Remote Sens. Environ., 83, 1–2, https://doi.org/10.1016/s0034-4257(02)00084-6, 2002.
Kaiser, J. W., Heil, A., Andreae, M. O., Benedetti, A., Chubarova, N., Jones, L., Morcrette, J.-J., Razinger, M., Schultz, M. G., Suttie, M., and van der Werf, G. R.: Biomass burning emissions estimated with a global fire assimilation system based on observed fire radiative power, Biogeosciences, 9, 527–554, https://doi.org/10.5194/bg-9-527-2012, 2012.
Kayano, M. T. and Andreoli, R. V.: Clima da região Nordeste do Brasil, in: Tempo e Clima no Brasil, 1, edited by: Cavalcanti, I. F. A., Ferreira, N. J., Silva, M. G. A. J., and Dias, M. A. F. S., Oficina de Textos, São Paulo, Brazil, 213–233, 2009.
Klink, C. A. and Machado, R. B.: Conservation of the Brazilian Cerrado, Conserv. Biol., 19, 707–713, https://doi.org/10.1111/j.1523-1739.2005.00702.x, 2005.
Kogan, F. N.: Droughts of the late 1980s in the United States as derived from NOAA polar-orbiting satellite data, B. Am. Meteorol. Soc., 76, 655–668, https://doi.org/10.1175/1520-0477(1995)076<0655:dotlit>2.0.co;2, 1995.
Kummerow, C., Barnes, W., Kozu, T., Shiue, J., and Simpson, J.: The Tropical Rainfall Measurement Mission (TRMM) Sensor Package, J. Atmos. Ocean. Tech., 15, 809–817, https://doi.org/10.1175/1520-0426(1998)015<0809:TTRMMT>2.0.CO;2, 1998.
Kummerow, C., Simpson, J., Thiele, O., Barnes, W., Chang, A. T. C., Stocker, E., Adler, R. F., Hou, A., Kakar, R., Wentz, F., Ashcroft, P., Kozu, T., Hong, Y., Okamoto, K., Iguchi, T., Kuroiwa, H., Im, E., Haddad, Z., Huffman, G., Ferrier, B., Olson, W. S., Zipser, E., Smith, E. A., Wilheit, T. T., North, G., Krishnamurti, T., and Nakamura, K.: The status of the Tropical Rainfall Measuring Mission (TRMM) after two years in orbit, J. Appl. Meteorol., 39, 1965–1982, https://doi.org/10.1175/1520-0450(2001)040<1965:tsottr>2.0.co;2, 2000.
Kusangaya, S. and Sithole, V. B.: Remote sensing-based fire frequency mapping in a savannah rangeland, S. Afr. J. Geomat., 4, 36–49, https://doi.org/10.4314/sajg.v4i1.3, 2015.
Leblon, B., Bourgeau-Chavez, L., and San-Miguel-Ayanz, J.: Use of Remote Sensing in wildfire management, in: Sustainable development – Authoritative and leading edge content for environmental management, 1, edited by: Curkovic, S., InTech Press, Rijeka, Croatia, 55–82, 2012.
Libonati, R., DaCamara, C. C., Setzer, A. W., Morelli, F., and Melchiori, A. E.: An algorithm for burned area detection in the Brazilian Cerrado using 4 µm MODIS Imagery, Remote Sens., 7, 15782–15803, https://doi.org/10.3390/rs71115782, 2015a.
Libonati, R., DaCamara, C. C., Setzer, A. W., and Morelli, F.: Spatio-temporal variability of burned area over Brazil for the period 2005–2010 using MODIS data, in: Proceedings of the XVII Brazilian Symposium on Remote Sensing, 25–29 April 2015, João Pessoa, Brazil, 675–682, 2015b.
Libonati, R., DaCamara, C. C., and Setzer, A. W.: Spatial and temporal patterns of burned area over Brazilian Cerrado from 2005 to 2015 using remote sensing, in: Proceedings of the Geosciences Union General Assembly 2016, 25–29 April 2016, Vienna, Austria, 2016.
Maier, S. W., Russell-Smith, J., Edwards, A. C., and Yates, C.: Sensitivity of the MODIS fire detection algorithm (MOD14) in the savanna region of the Northern Territory, Australia, ISPRS J. Photogramm. Remote Sens., 76, 11–16, https://doi.org/10.1016/j.isprsjprs.2012.11.005, 2013.
Marcuzzo, F. F. N., Cardoso, M. R. D., and Faria, T. G.: Chuvas no Cerrado da região Centro-Oeste do Brasil: análise histórica e tendência futura, Atel. Geog., 6, 112–130, https://doi.org/10.5216/ag.v6i2.15234, 2012.
MMA: Brazilian Ministry of Environment: PROBIO Project: Conservation and Sustainable Use of Brazilian Biological Diversity, available at: http://mapas.mma.gov.br/mapas/aplic/probio/datadownload.htm (last access: 2 February 2017), 2002.
MODIS Fire Products Algorithm Theoretical Basis Document (ATBD): MODIS Fires Products, available at: https://modis.gsfc.nasa.gov/data/atbd/atbd_mod14.pdf (last access: 2 February 2017), 2006.
MODIS Land Cover Product User Guide: User Guide for the MODIS Land Cover Type Product (MCD12Q1), available at: https://lpdaac.usgs.gov/sites/default/files/public/modis/docs/MCD12Q1_UserGuide_07302013.pdf (last access: 14 September 2017), 2013.
MODIS Algorithm Theoretical Basis Document (ATBD): MODIS Vegetation Index (MOD 13), available at: http://modis.gsfc.nasa.gov/data/atbd/atbd_mod13.pdf (last access: 2 February 2017), 1999.
Moreira de Araújo, F. and Ferreira, L. G.: Satellite-based automated burned area detection: A performance assessment of the MODIS MCD45A1 in the Brazilian savanna, Int. J. Appl. Earth Obs., 36, 94–102, https://doi.org/10.1016/j.jag.2014.10.009, 2015.
Moreira de Araújo, F., Ferreira, L. G., and Arantes, A. E.: Distribution patterns of burned areas in the Brazilian biomes: An analysis based on satellite data for the 2002–2010 period, Remote Sens., 4, 1929–1946, https://doi.org/10.3390/rs4071929, 2012.
Myers, N., Mittermeier, R. A., Mittermeier, C. G., da Fonseca, G. A. B., and Kent, J.: Biodiversity hotspots for conservation priorities, Nature, 403, 853–858, https://doi.org/10.1038/35002501, 2000.
Nascimento, D. T. F., Moreira de Araújo, F., and Ferreira, L. G.: Análise dos padrões de distribuição espacial e temporal dos focos de calor no bioma Cerrado, Rev. Bras. Cart., 63, 461–475, 2011.
Nogueira, J. M. P., Rambal, S., Barbosa, J. P. R. A. D., and Mouillot, F.: Spatial pattern of the seasonal drought/burned area relationship across Brazilian biomes: Sensitivity to drought metrics and global Remote-Sensing fire products, Climate, 5, 42, https://doi.org/10.3390/cli5020042, 2017.
Pereira, G., Silva, M. E. S., Moraes, E. C., and Cardozo, F. S.: Avaliação dos dados de precipitação estimados pelo satélite TRMM para o Brasil, Rev. Bras. Rec. Hidr., 18, 139–148, https://doi.org/10.21168/rbrh.v18n3.p139-148, 2013.
Pivello, V. R.: The use of fire in the Cerrado and Amazonian rainforests of Brazil: past and present, Fire Ecol., 7, 24–39, https://doi.org/10.4996/fireecology.0701024, 2011.
Price, O. F., Russell-Smith, J., and Watt, F.: The influence of prescribed fire on the extent of wildfire in savanna landscapes of western Arnhem Land, Australia, Int. J. Wildland Fire, 21, 297–305, https://doi.org/10.1071/wf10079, 2012.
Quiring, S. M. and Ganesh, S.: Evaluating the utility of the Vegetation Condition Index (VCI) for monitoring meteorological drought in Texas, Agr. Forest Meteorol., 150, 330–339, https://doi.org/10.1016/j.agrformet.2009.11.015, 2010.
Quiring, S. M. and Papakryiakou, T. N.: An evaluation of agricultural drought indices for the Canadian prairies, Agr. Forest Meteorol., 118, 1–2, https://doi.org/10.1016/s0168-1923(03)00072-8, 2003.
Ramos-Neto, M. B. and Pivello, V. R.: Lightning fires in a Brazilian savanna national park: rethinking management strategies, Environ. Manage., 26, 675–684, https://doi.org/10.1007/s002670010124, 2000.
Randerson, J. T., van der Werf, G. R., Collatz, G. J., Giglio, L., Still, C. J., Kasibhatla, P., Miller, J. B., White, J. W. C., DeFries, R. S., and Kasischke, E. S.: Fire emissions from C3 and C4 vegetation and their influence on interannual variability of atmospheric CO2 and δ13CO2, Global Biogeochem. Cy., 19, GB2019, https://doi.org/10.1029/2004gb002366, 2005.
Rissi, M. N., Baeza, M. J., Gorfone-Barbosa, E., Zupo, T., and Fidelis, A.: Does season affect fire behaviour in the Cerrado?, Int. J. Wildland Fire, 26, 427–433, 2017.
Roy, D. P., Jin, Y., Lewis, P. E., and Justice, C. O.: Prototyping a global algorithm for systematic fire-affected area mapping using MODIS time series data, Remote Sens. Environ., 97, 137–162, https://doi.org/10.1016/j.rse.2005.04.007, 2005.
Roy, D. P., Boschetti, L., Justice, C. O., and Ju, J.: The collection 5 MODIS burned area product – Global evaluation by comparison with the MODIS active fire product, Remote Sens. Environ., 112, 3690–3707, https://doi.org/10.1016/j.rse.2008.05.013, 2008.
Rudorff, B. F. T., Aguiar, D. A., Silva, W. F., Sugawara, L. M., Adami, M., and Moreira, M. A.: Studies on the rapid expansion of sugarcane for ethanol production in São Paulo state (Brazil) using Landsat data, Remote Sens., 2, 1057–1076, https://doi.org/10.3390/rs2041057, 2010.
Schucknecht, A., Erasmi, S., Niemeyer, I., and Matschullat, J.: Assessing vegetation variability and trends in north-eastern Brazil using AVHRR and MODIS NDVI time series, Eur. J. Remote Sens., 46, 40–59, https://doi.org/10.5721/EuJRS20134603, 2013.
Shimabukuro, Y. E., Pereira, G., Cardozo, F. S., Stockler, R., Freitas, S. R., and Coura, S. M. C.: Biomass burning emission estimation in Amazon tropical forest, in: Earth observation of ecosystem services, 1, edited by: Alcaraz-Segura, D., Di Bella, C. M., and Straschnoy, J. V., CRC Press, Boca Raton, USA, 125–148, 2013.
Spera, S. A., Galford, G. L., Coe, M. T., Macedo, M. N., and Mustard, J. F.: Land-use change affects water recycling in Brazil's last agricultural frontier, Glob. Change Biol., 22, 3405–3413, https://doi.org/10.1111/gcb.13298, 2016.
Stephenson, C., Handmer, J., and Betts, R.: Estimating the economic, social and environmental impacts of wildfires in Australia, Environ. Hazards, 12, 93–111, https://doi.org/10.1080/17477891.2012.703490, 2013.
Thenkabail, P. S., Gamage, M. S. D. N., and Smakhtin, V. U.: The use of Remote Sensing data for drought assessment and monitoring in Southwest Asia, Int. Wat. Manag. Inst., Research Rep., Colombo, Sri Lanka, 34 pp., 2004.
Vadrevu, K. P., Lasko, K., Giglio, L., and Justice, C.: Analysis of Southeast Asian pollution episode during June 2013 using satellite remote sensing datasets, Environ. Pollut., 195, 245–256, https://doi.org/10.1016/j.envpol.2014.06.017, 2014.
van der Werf, G. R., Randerson, J. T., Giglio, L., Gobron, N., and Dolman, A. J.: Climate controls on the variability of fires in the tropics and subtropics, Global Biogeochem. Cy., 22, GB3028, https://doi.org/10.1029/2007gb003122, 2008.
Verbesselt, J., Hyndman, R., Newnham, G., and Culvenor, D.: Detecting trend and seasonal changes in satellite image time series, Remote Sens. Environ., 114, 106–115, https://doi.org/10.1016/j.rse.2009.08.014, 2010.
Wooster, M. J., Roberts, G., Perry, G. L. W., and Kaufman, Y. J.: Retrieval of biomass combustion rates and totals from fire radiative power observations: calibration relationships between biomass consumption and fire radiative energy release, J. Geophys. Res.-Atmos., 110, D24311, https://doi.org/10.1029/2005JD006318, 2005.
Yates, C. P., Edwards, A. C., and Russell-Smith, J.: Big fires and their ecological impacts in Australian savannas: size and frequency matters, Int. J. Wildland Fire, 17, 768–781, https://doi.org/10.1071/wf07150, 2008.