the Creative Commons Attribution 4.0 License.
the Creative Commons Attribution 4.0 License.
 | 17 May 2018
Rainfall threshold calculation for debris flow early warning in areas with scarcity of data
Hua-Li Pan
Yuan-Jun Jiang
Jun Wang
Guo-Qiang Ou
Debris flows are natural disasters that frequently occur in mountainous areas, usually accompanied by serious loss of lives and properties. One of the most commonly used approaches to mitigate the risk associated with debris flows is the implementation of early warning systems based on well-calibrated rainfall thresholds. However, many mountainous areas have little data regarding rainfall and hazards, especially in debris-flow-forming regions. Therefore, the traditional statistical analysis method that determines the empirical relationship between rainstorms and debris flow events cannot be effectively used to calculate reliable rainfall thresholds in these areas. After the severe Wenchuan earthquake, there were plenty of deposits deposited in the gullies, which resulted in several debris flow events. The triggering rainfall threshold has decreased obviously. To get a reliable and accurate rainfall threshold and improve the accuracy of debris flow early warning, this paper developed a quantitative method, which is suitable for debris flow triggering mechanisms in meizoseismal areas, to identify rainfall threshold for debris flow early warning in areas with a scarcity of data based on the initiation mechanism of hydraulic-driven debris flow. First, we studied the characteristics of the study area, including meteorology, hydrology, topography and physical characteristics of the loose solid materials. Then, the rainfall threshold was calculated by the initiation mechanism of the hydraulic debris flow. The comparison with other models and with alternate configurations demonstrates that the proposed rainfall threshold curve is a function of the antecedent precipitation index (API) and 1 h rainfall. To test the proposed method, we selected the Guojuanyan gully, a typical debris flow valley that during the 2008–2013 period experienced several debris flow events, located in the meizoseismal areas of the Wenchuan earthquake, as a case study. The comparison with other threshold models and configurations shows that the selected approach is the most promising starting point for further studies on debris flow early warning systems in areas with a scarcity of data.


Debris flow is rapid, gravity-induced mass movement consisting of a mixture of water, sediment, wood and anthropogenic debris that propagate along channels incised on mountain slopes and onto debris fans (Gregoretti et al., 2016). It has been reported in over 70 countries and often causes severe economic losses and human casualties, seriously retarding social and economic development (Imaizumi et al., 2006; Tecca and Genevois, 2009; Dahal et al., 2009; Liu et al., 2010; Cui et al., 2011; McCoy et al., 2012; Degetto et al., 2015; Tiranti and Deangeli, 2015; Hu et al., 2016). Rainfall is one of the main triggering factors of debris flows and is the most active factor when debris flows occur, which also determines the temporal and spatial distribution characteristics of the hazards. As one of the important and effective means of non-engineering disaster mitigation, much attention has been paid to debris flow early warning by researchers (Pan et al., 2013; Guo et al., 2013; Zhou and Tang, 2014; Wei et al., 2017). For rainstorm-triggered debris flows, the precipitation and intensity of rainfall are the decisive factors of debris flow initiation, and a reasonable rainfall threshold target is essential to ensure the accuracy of debris flow early warning. However, if an extreme event occurs, such as an earthquake, the rainfall threshold of debris flow may change a lot. Tang et al. (2012a) analyzed the critical rainfall of Beichuan city and found that the cumulative rainfall triggering debris flow decreased by 14.8–22.1 % when compared with the pre-earthquake period, and the critical hour rainfall decreased by 25.4–31.6 %. Chen et al. (2013) analyzed the pre- and post-earthquake critical rainfall for debris flow in Xiaogangjian gully and found that the critical rainfall for debris flow in 2011 was approximately 23 % lower than the value during the pre-earthquake period. Other researchers, such as Chen (2008), Chen et al. (2009) and Shied et al. (2009), have reached the conclusion that the post-earthquake critical rainfall for debris flow is markedly lower than that of the pre-earthquake period. The Guojuanyan gully, a small gully located in the meizoseismal areas of a big earthquake, had no debris flows under the annual average rainfall before 2008, but it became a debris flow gully after the earthquake under the same conditions, even though the rainfall was smaller than the annual average rainfall. This indicated that earthquakes have a big influence on debris flow occurrence. The earthquake triggered many unstable slopes, collapses and landslides that have served as the source material for debris flow and shallow landslides in the years after the earthquake (Tang et al., 2009, 2012b; Xu et al., 2012; Hu et al., 2016). Therefore, the rainfall threshold of debris flow post-earthquake is an important and urgent issue to study for debris flow early warning and mitigation.
As an important and effective means of disaster mitigation, debris flow early warning has received much attention from researchers. The rainfall threshold is the core of debris flow early warning, on which there is already a great deal of research (Cannon et al., 2008; Chen and Huang, 2010; Baum and Godt, 2010; Staley et al., 2013; Winter et al., 2010; Zhou and Tang, 2014; Segoni et al., 2015; Rosi et al., 2015). Although the formation mechanism of debris flow has been extensively studied, it is difficult to perform distributed physically based modeling over large areas, mainly because the spatial variability of geotechnical parameters is very difficult to assess (Tofani et al., 2017). Therefore, many researchers (Wilson and Joyko, 1997; Campbell, 1975; Cheng et al., 1998) have had to determine the empirical relationship between rainfall and debris flow events and to determine the rainfall threshold depending on the combinations of rainfall parameters, such as antecedent rainfall, rainfall intensity and cumulative rainfall. Takahashi (1978), Iverson and Lahusen (1989) and Cui (1991) predicted the formation of debris flow based on studies of slope stability, hydrodynamic action and the influence of pore water pressure on the formation process of debris flow. Caine (1980) first statistically analyzed the empirical relationship between rainfall intensity and the duration of debris flows and shallow landslides and proposed an exponential expression (). Afterwards, other researchers, such as Wieczorek (1987), Jibson (1989), Hong et al. (2005), Dahal et al. (2009), Guzzetti et al. (2008) and Saito et al. (2010), carried out further research on the empirical relationship between rainfall intensity and the duration of debris flows, established the empirical expression of rainfall intensity–duration (I–D) and proposed debris flow prediction models. Although I–D is the most used approach, other rainfall parameters have been considered as well for debris flow thresholds. Shied and Chen (1995) established the critical condition of debris flow based on the relationship between cumulative rainfall and rainfall intensity. Zhang et al. (2014) developed a model for debris flow forecasting based on the water–soil coupling mechanism at the watershed scale. In addition, some researchers have highlighted the importance of finding more robust hydrological bases to empirical rainfall thresholds for landslide initiation (Bogaard and Greco, 2018; Canli et al., 2017; Segoni et al., 2018). When data are scarce, a robust validation of a threshold model can be based on a quantitative comparison with alternate versions of the threshold (Althuwaynee et al., 2015) or with thresholds calculated with completely different approaches (Frattini et al., 2009; Lagomarsino et al., 2015). Wei et al. (2017) investigated a rainfall threshold method for predicting the initiation of channelized debris flows in a small catchment, using field measurements of rainfall and runoff data.
Overall, the studies on the rainfall threshold of debris flow can be separated into two methods: the demonstration method and the frequency calculated method. The demonstration method employs statistical analysis of rainfall and debris flow data to study the relationship between rainfall and debris flow events and to obtain the rainfall threshold curve (Bai et al., 2008; Tian et al., 2008; Zhuang et al., 2009). The I–D approaches would be this kind of method. This method is relatively accurate, but it needs a long-term rainfall database and disaster information; therefore, it can be applied only to areas with a history of long-term observations. The frequency calculated method, assuming that debris flow and torrential rain have the same frequency and, thus, debris flow rainfall threshold, can be calculated based on the rainstorm frequency in mountain towns that have abundant rainfall data but a lack of disaster data (Yao, 1988; Liang and Yao, 2008). Researchers have also analyzed the relationship between debris flow occurrences and precipitation and soil moisture content based on initial debris flow conditions (Hu and Wang, 2003). However, this approach is rarely applied to the determination of debris flow rainfall thresholds because it needs series of rainfall data. Pan et al. (2013) calculated the threshold rainfall for debris flow pre-warning by calculating the critical depth of debris flow initiation combined with the amount and regulating factors of runoff generation.
Most mountainous areas have little data regarding rainfall and hazards, especially in Western China. Neither the traditional demonstration method nor the frequency calculated method can satisfy the debris flow early warning requirements in these areas. Therefore, how to calculate the rainfall threshold in these data-poor areas has become one of the most important challenges for the debris flow early warning systems. To solve this problem, this paper developed a quantitative method of calculating rainfall threshold for debris flow early warning in areas with scarcity of data based on the initiation mechanism of hydraulic-driven debris flows.
2.1 Location and gully characteristics of the study area
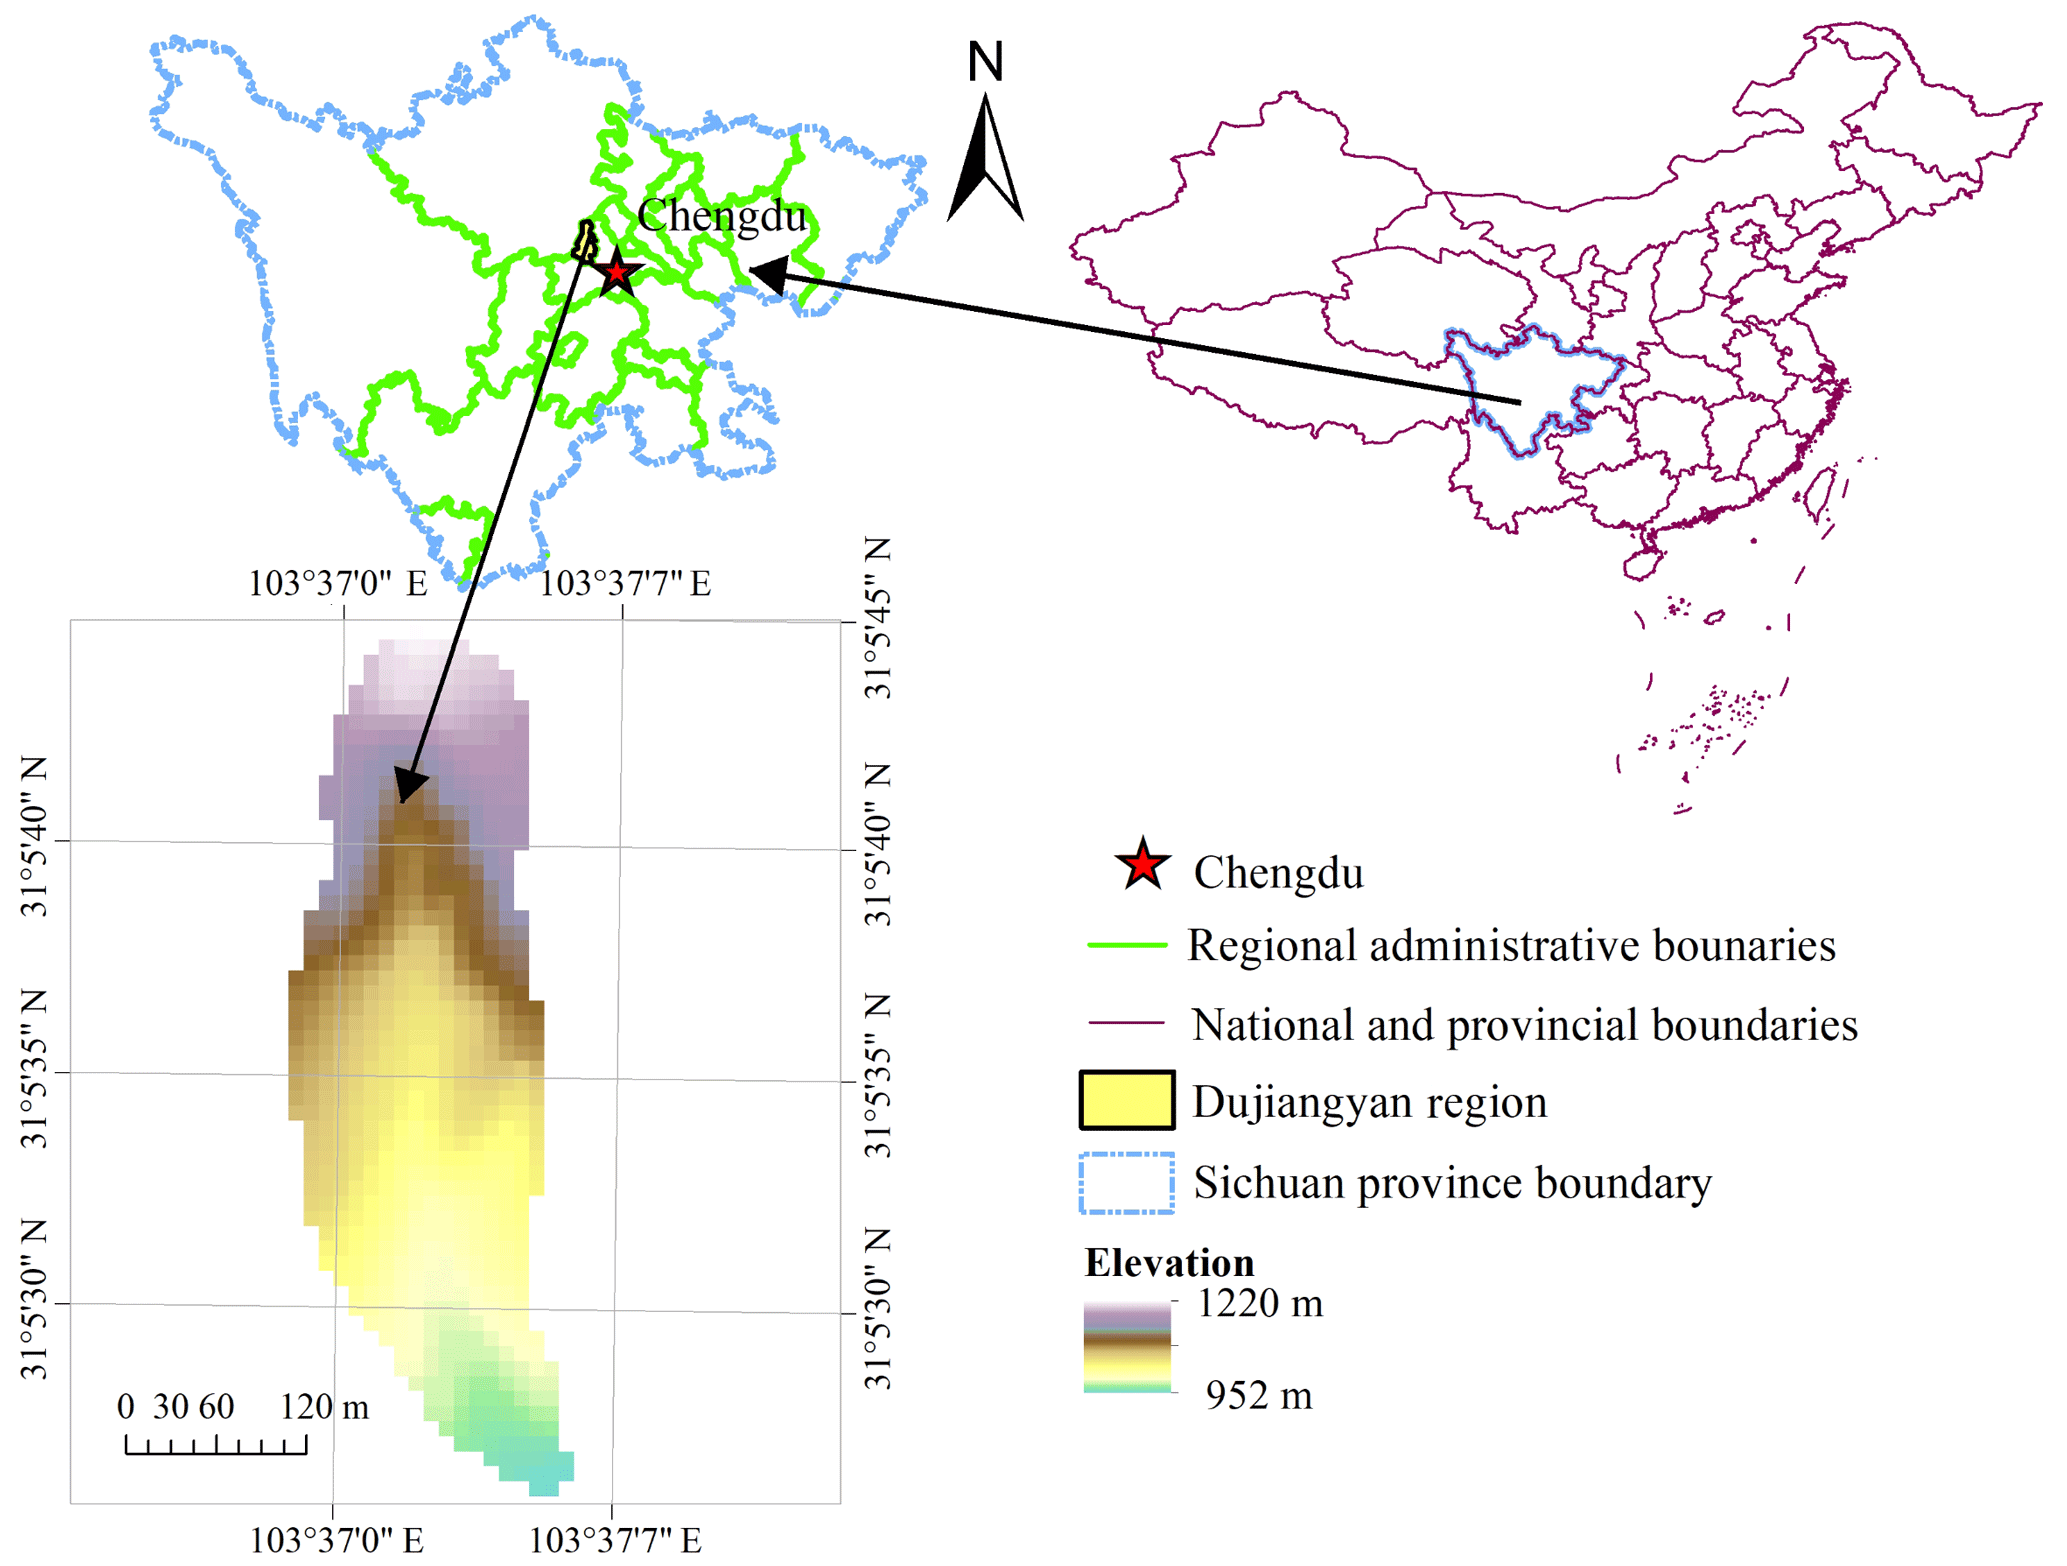
The Guojuanyan gully in Dujiangyan city, located in the meizoseismal areas of the Wenchuan earthquake, China, was selected as the study area (Fig. 1). It is located at the Baisha River, which is the first tributary of the Min River. The seismic intensity of the study area was XI, which was the maximum seismic intensity of the Wenchuan earthquake. The Shenxi Gully Earthquake Site Park is on the right side of this gully. The area extends from 31∘05′27′′ to 31∘05′46′′ N latitude and 103∘36′58′′ to 103∘37′09′′ E longitude, covering an area of 0.15 km2 with a population of 20 inhabitants. The elevation range is from 943 to 1222 m, the average gradient of the main channel is 270 ‰ (the average slope angle is 15.1∘), and the length of the main channel is approximately 580 m.
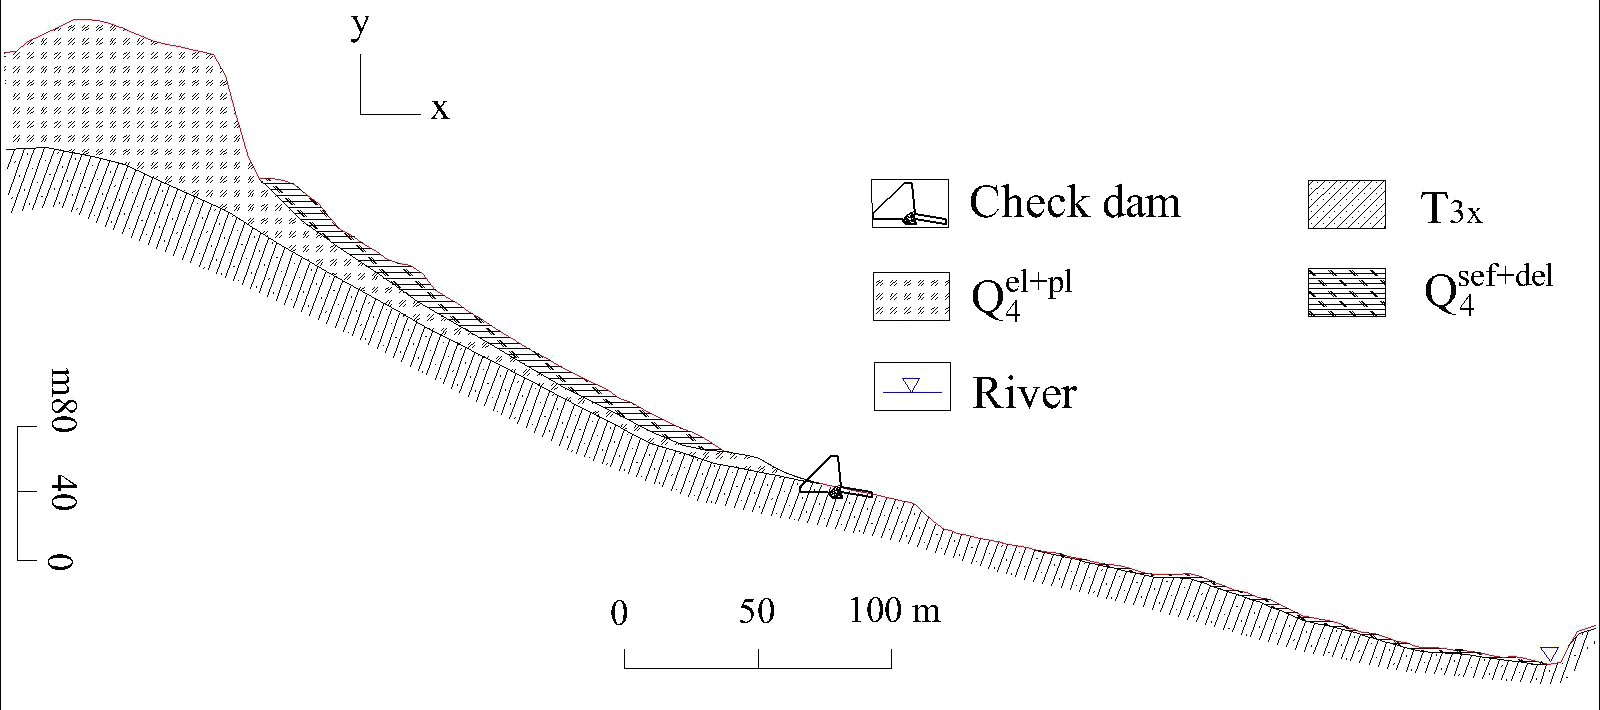
Geologically, the Guojuanyan gully is composed of bedrock and Quaternary strata. The bedrock is upper Triassic Xujiahe petrofabric (T3x), the lithology of which is mainly sandstone, mudstone, carbonaceous shale belonging to massive layered structures, and semi-solid petrofabric. The Quaternary strata are alluvium , alluvial materials , landslide accumulations and debris flow deposits . The thickness of the Quaternary strata ranges from 1 to 20 m and varies greatly. The strata profile of the Guojuanyan gully is shown in Fig. 2.
Geographically, the study area belongs to the Longmen Mountains. The famous Longmenshan tectonic belt has a significant effect on this region, especially the Hongkou–Yingxiu fault. The study area has strong tectonic movement and strong erosion, and the main channel is “V” shaped. The area is characterized by a rugged topography, and the main slope gradient interval of the gully is 20 to 40∘, accounting for 52.38 % of the entire study area.
Climatically, this area has a subtropical and humid climate, with an average annual temperature of 15.2 ∘C and an average annual rainfall of 1200 mm (Wang et al., 2014).
2.2 Materials and debris flow characteristics of the study area
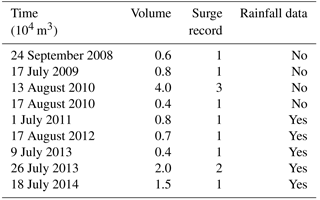
The Wenchuan earthquake generated a landslide in the Guojuanyan gully, leading to an abundance of loose deposits that have served as the source materials for debris flows. A comparison of the Guojuanyan gully before and after the Wenchuan earthquake is shown in Fig. 3. According to the field investigation and field tests, the 3-D landslide characteristics induced by the earthquake and the infiltration characteristics of the loose materials are shown in Tables 1 and 2 (Wang et al., 2016). They indicate that the volume of materials is more than 20 × 104 m3, and the infiltration capability of the earth surface has increased significantly. Therefore, the triggering rainfall for debris flow decreased greatly. The Guojuanyan gully had no debris flows before the earthquake because of the lack of loose solid materials; however, it became a debris flow gully after the earthquake, and debris flows occurred in the following years (Table 3). The specific conditions of these debris flow events were collected through field investigations and interviews. The field investigations and experiments determined that the density of the debris flow was between 1.8 and 2.1 g cm−3. Unfortunately, there were no rainfall data before 2011, when we started field surveys in the Guojuanyan gully.
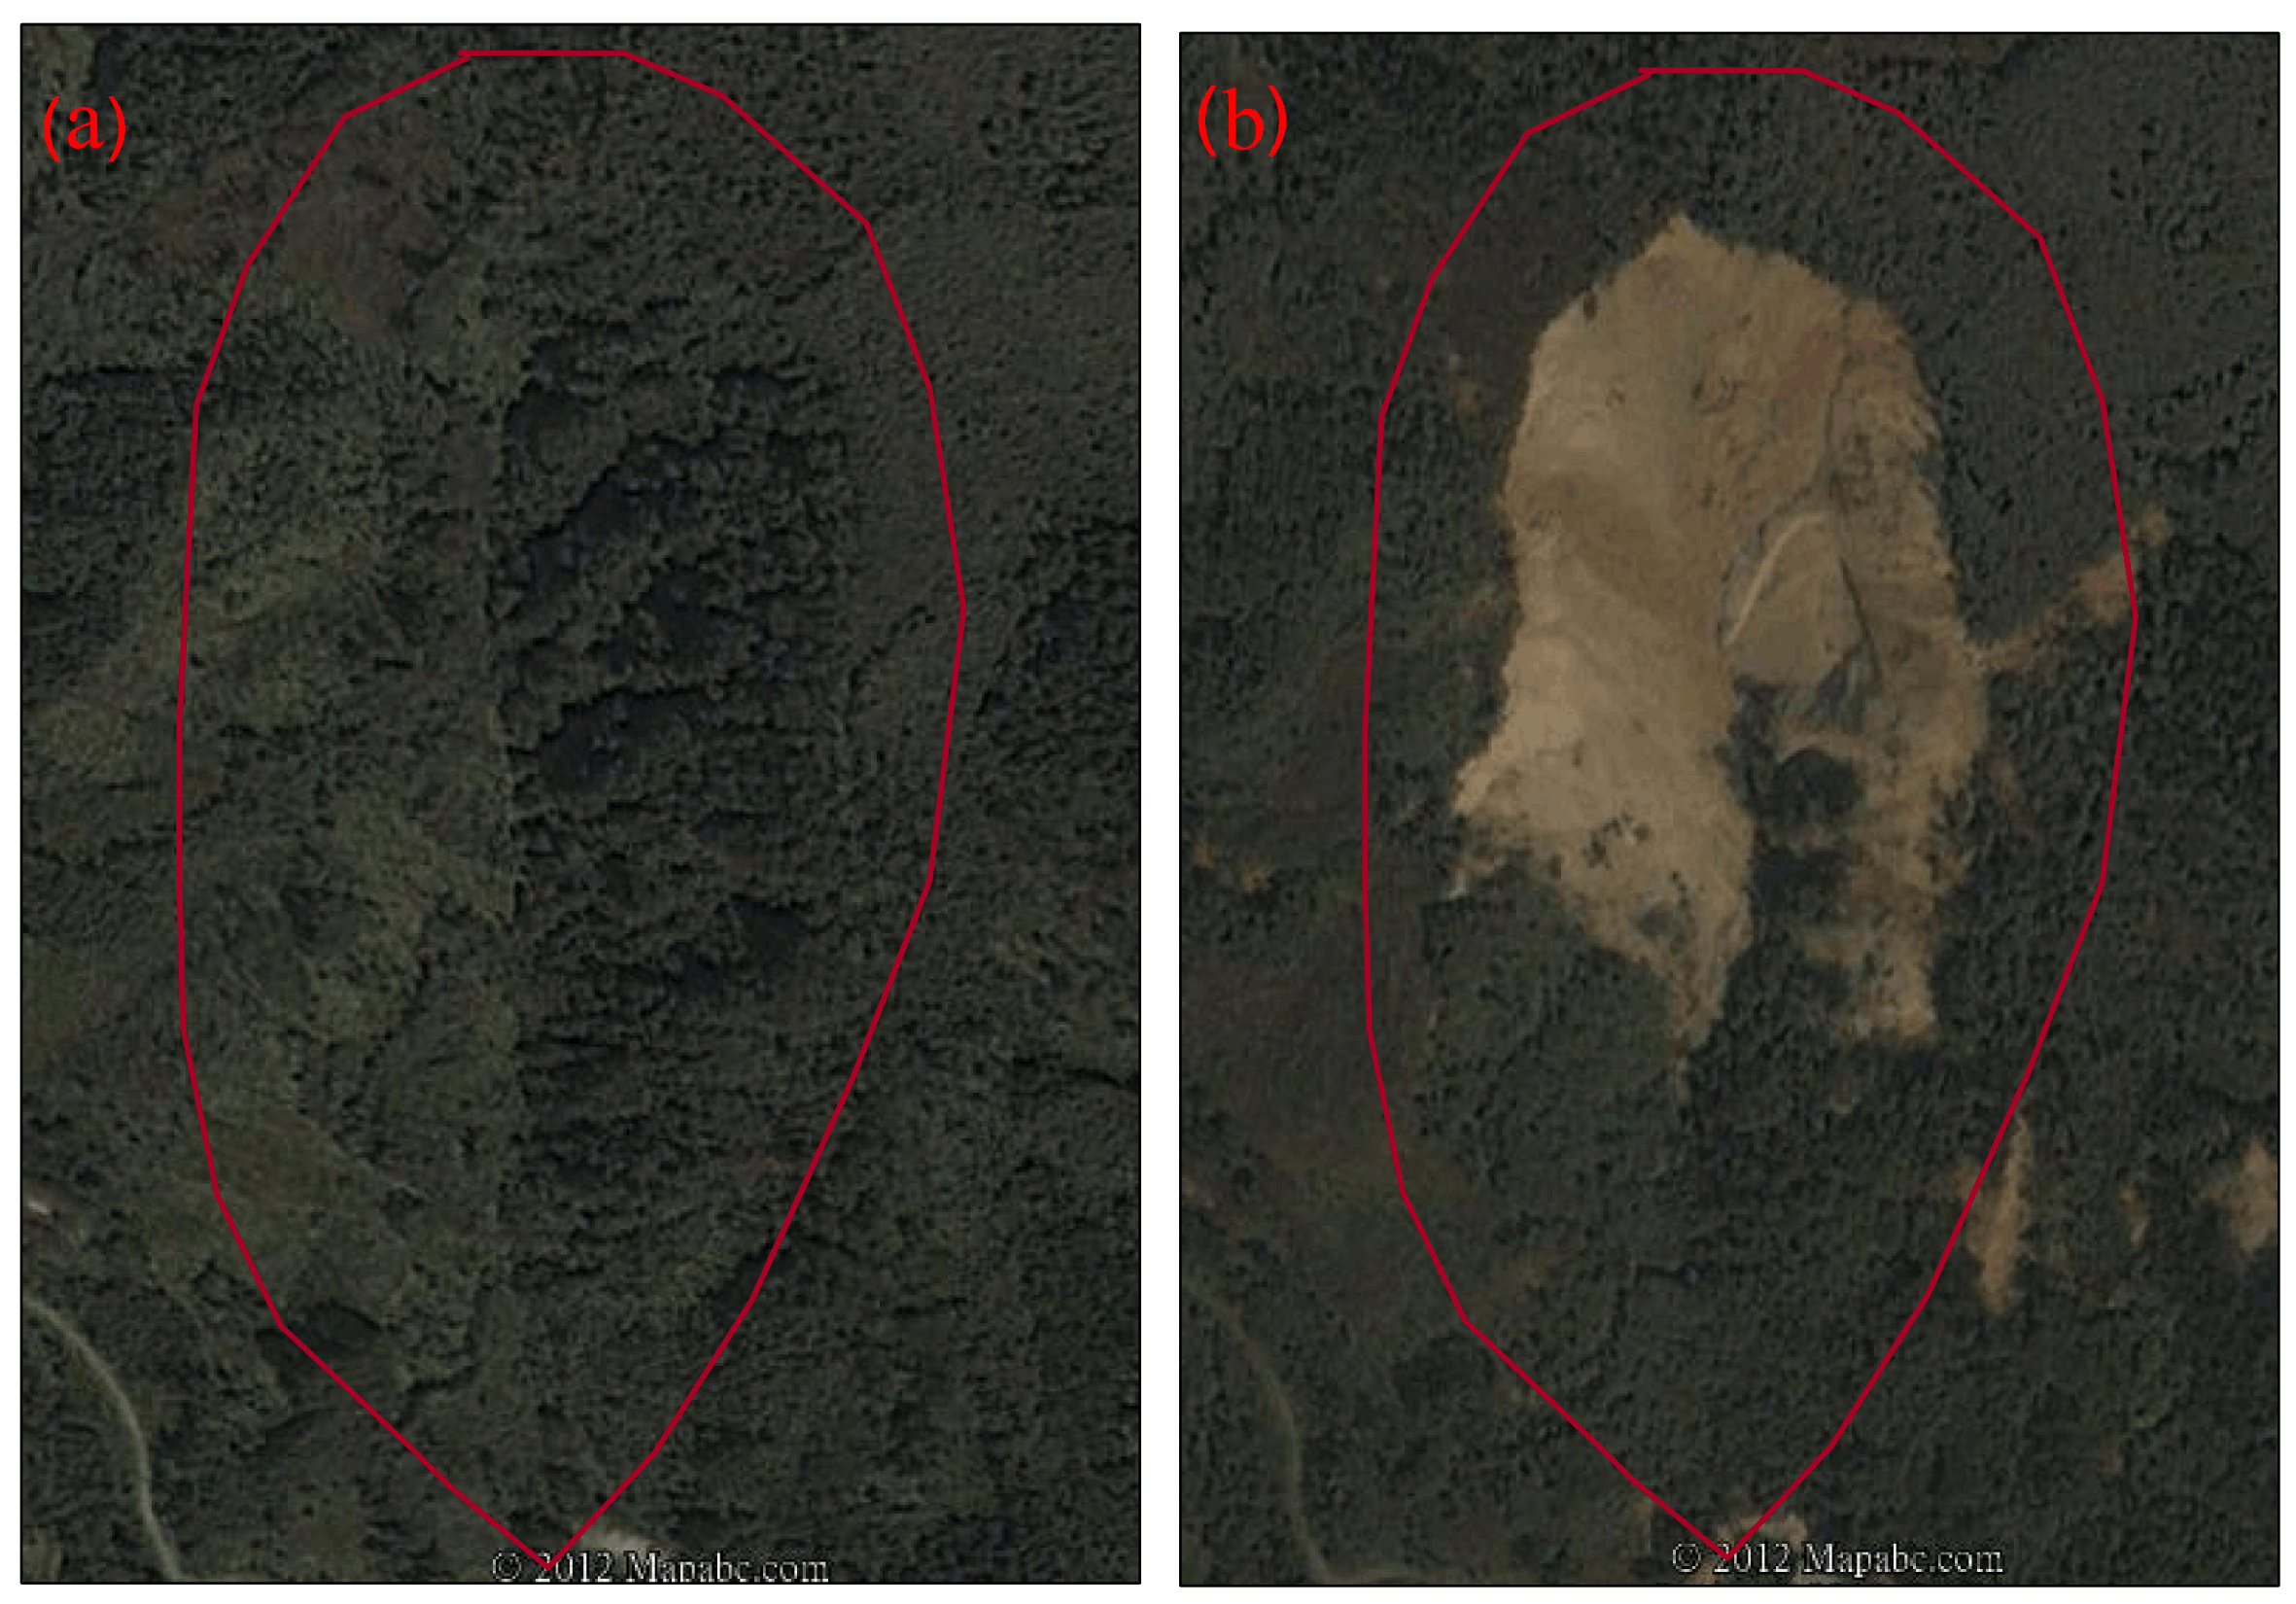
Figure 3The Guojuanyan gully before (a) and after (b) the Wenchuan earthquake (from Google Earth).
Table 1The landslide 3-D characteristics induced by the earthquake in the study area.
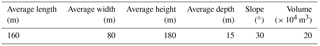
Table 2The infiltration characteristics of solid materials in the study area.
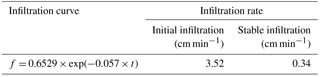
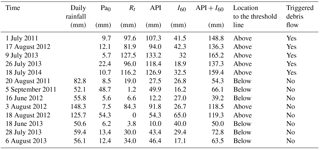
Table 3The specific conditions of debris flow events in the Guojuanyan gully after the earthquake.
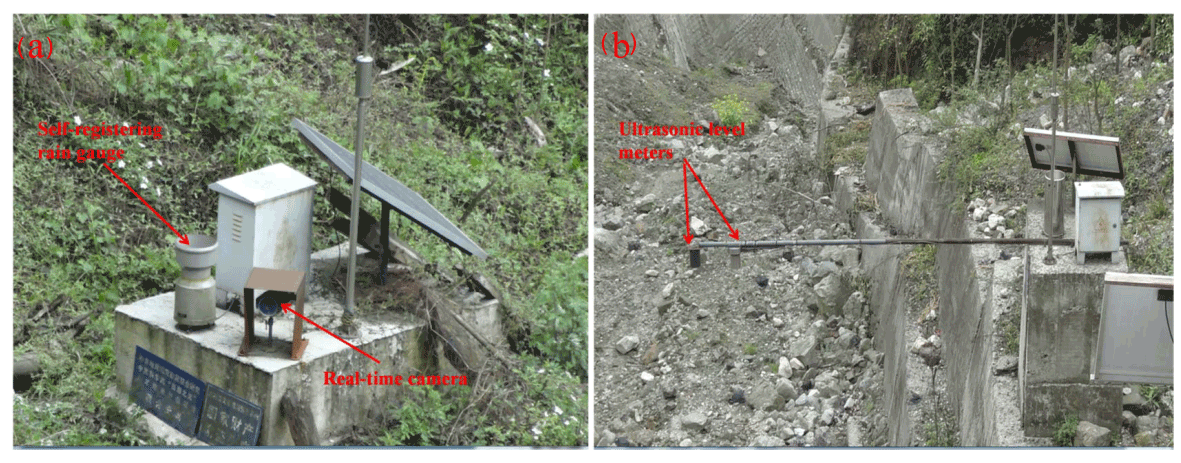
2.3 Debris flow monitoring and stream bed survey of the study area
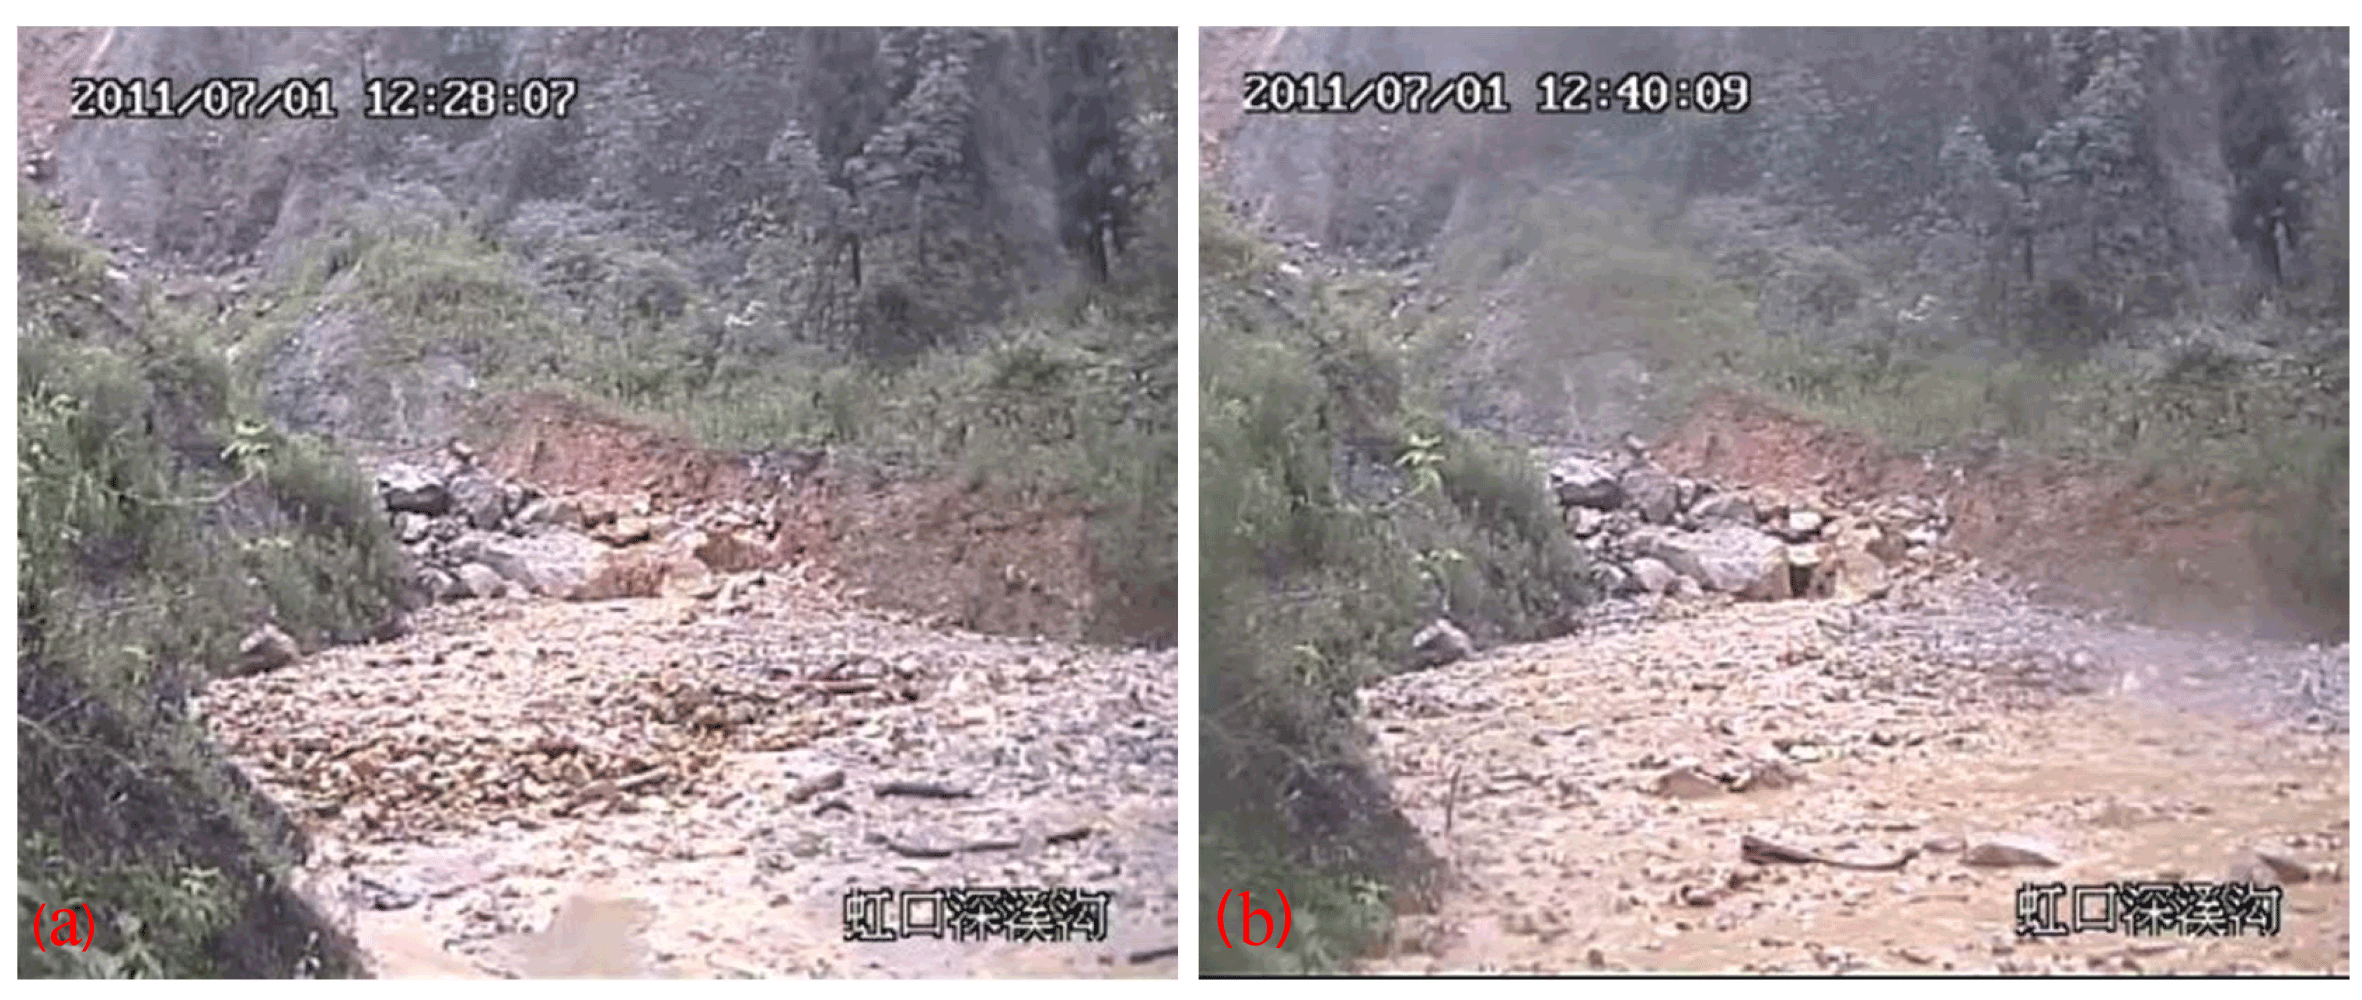
After the Wenchuan earthquake, continuous field surveillance was undertaken in the study area. A debris flow monitoring system was also established in the study area. To identify the debris flow events, this monitoring system recorded stream water depth, precipitation and real-time video of the gully (Fig. 4). The water depth was measured using an ultrasonic level meter, and precipitation was recorded by a self-registering rain gauge. The real-time video was recorded onto a data logger and transmitted to the monitoring center, located in the Institute of Mountain Hazards and Environment, Chinese Academy of Sciences. When a rainstorm or a debris flow event occurs, the real-time data, including rainfall data, video record and water depth data, can be observed and queried directly in the remote client computer in the monitoring center. Figure 5 shows images taken from the recorded video. These data can be used to analyze the rainfall or other characteristics, such as the 10 min, 1 and 24 h critical rainfall. The recorded video is usually used to analyze the whole inundated process of debris flow events and to identify debris flow events as well as the data from rainfall, flow depth and field investigation.
2.4 Data collection and the characteristics of rainfall
The Wenchuan earthquake occurred in the Longmenshan tectonic belt, located on the eastern edge of the Tibetan plateau, China, which is one of three rainstorm areas of Sichuan Province (Longmen Mountains rainstorm area, Qingyi River rainstorm area and Daba Mountains rainstorm area). Heavy rainstorms and extreme rainfall events occur frequently. Because there were few data in the mountainous areas, we collected the rainfall data from 1971 to 2000 and from 2011 to 2012 (from our own on-site monitoring); the characteristics of the rainfalls are as follows:
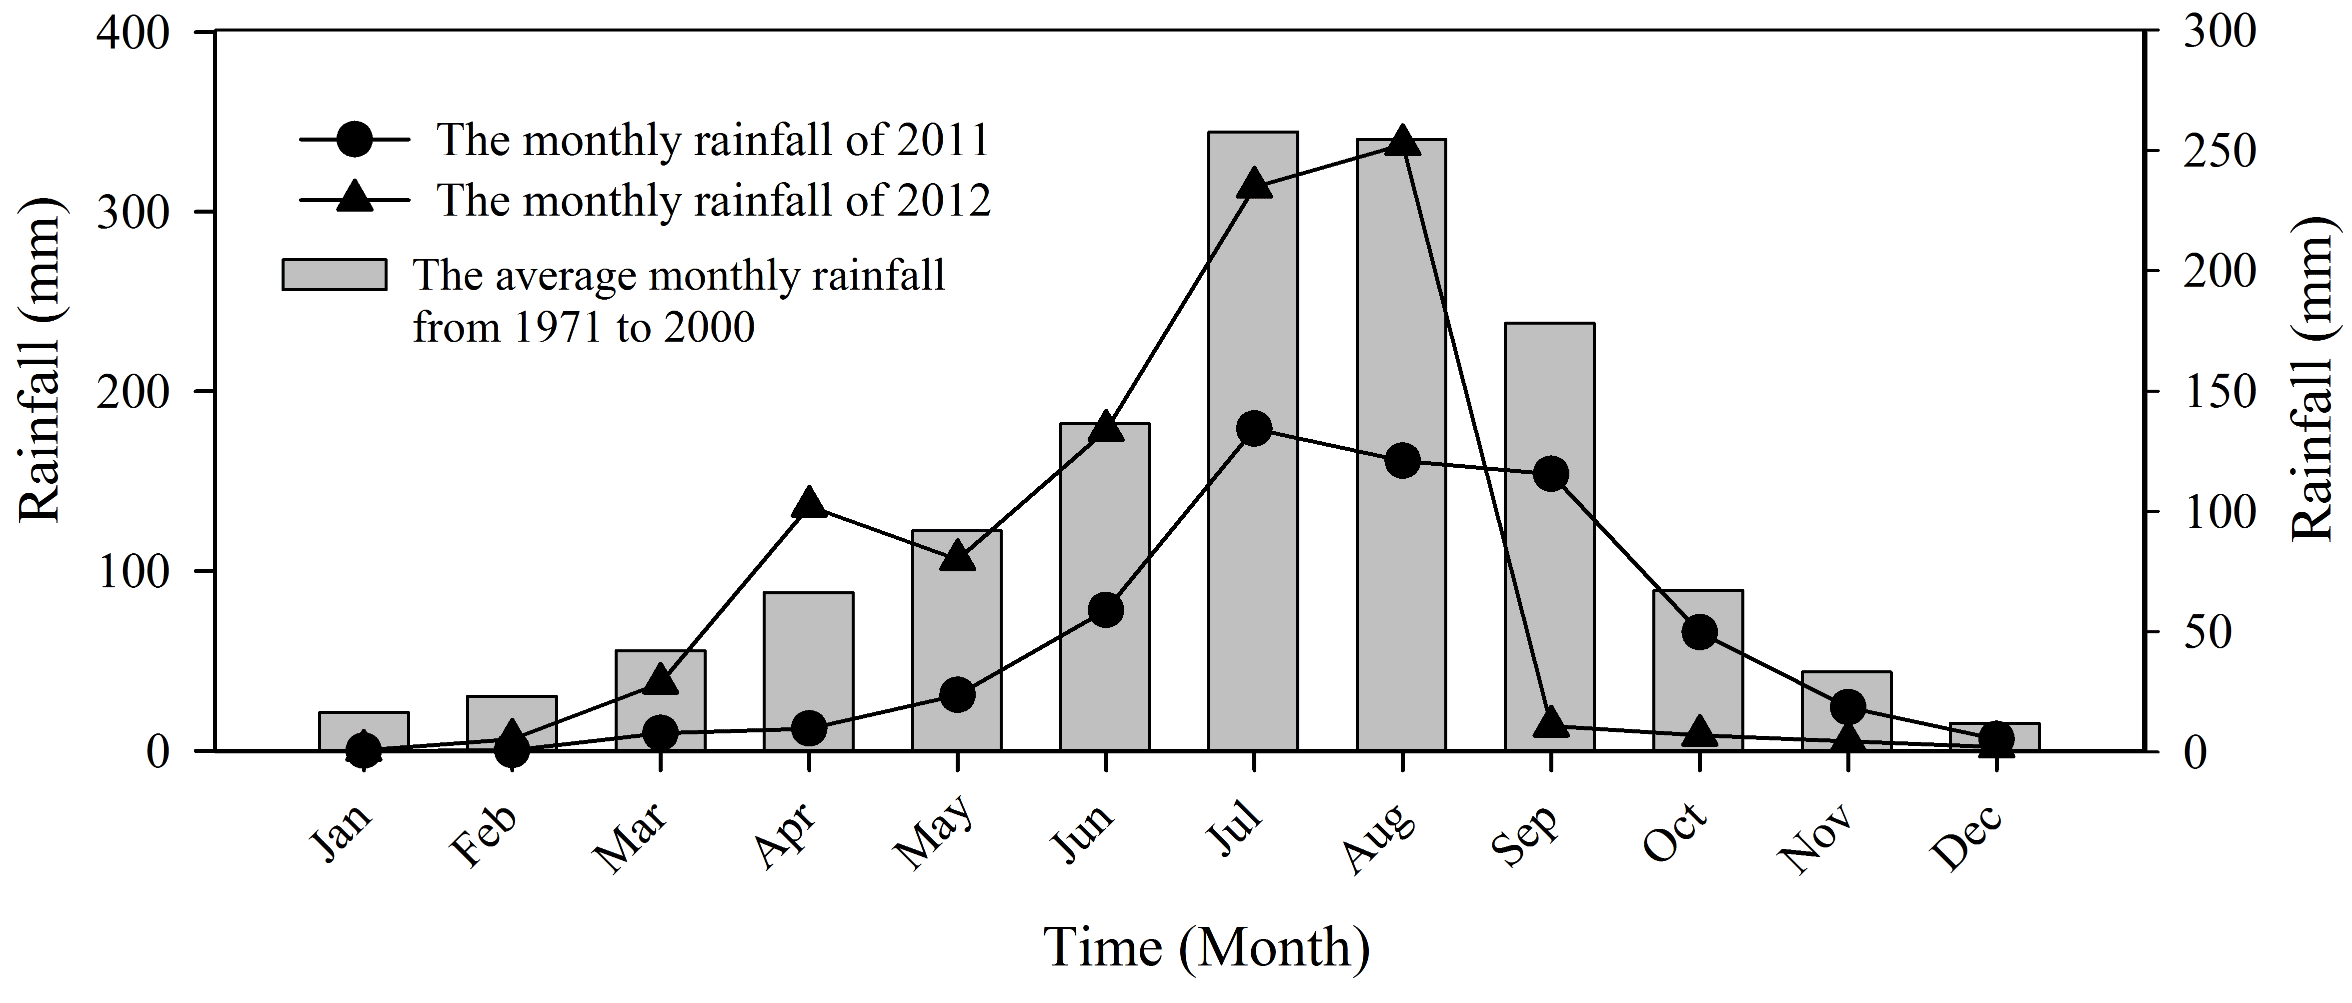
Figure 6The average monthly precipitation of the Guojuanyan gully from 1971 to 2000 and the monthly rainfall of 2011 and 2012.
-
Abundant precipitation. The average annual precipitation was 1177.3 mm from 1971 to 2000, and the average monthly precipitation is shown in Fig. 6. From 1971 to 2000, the minimum annual precipitation of 713.5 mm occurred in 1974, and the maximum annual precipitation of 1605.4 mm occurred in 1978. The total precipitation in 2012 is 1148 mm, in the trend range of the historical data.
-
Seasonality of the distribution of precipitation. From Fig. 6 we can observe that rainfall is seasonal, with approximately 80 % of the total rainfall occurring during the monsoon season (from June to September) and the other 20 % in other seasons. The laws of monthly rainfall in 2011 and 2012 coincide with the historical data. For instance, in 2012, the total annual rainfall in this area was approximately 1148 mm, and rainfall in the monsoon season from June to September was 961 mm, accounting for 83.7 % of the annual total.
-
Great differences in rainfall intensity. From 1971 to 2000, the maximum monthly rainfall was 592.9 mm, the daily maximum rainfall was 233.8 mm, the hourly maximum rainfall was 83.9 mm, the 10 min maximum rainfall was 28.3 mm and the longest continuous rainfall time was 28 days.
Debris flow field monitoring data and on-site investigation data were used to identify the debris flow events and to analyze the characteristics of the rainfall pattern and the critical rainfall characteristics. Analyzing the typical rainfall process curves (Fig. 13), we find that the hourly rainfall pattern of the Guojuanyan gully is the peak pattern, displaying the single peak and multiple peaks, a characteristic of short-duration rainstorms. Through the statistical analysis of the 10 min, 1 and 24 h critical rainfall of debris flow events after the earthquake, their characteristics can be obtained, as shown in Fig. 7.

According to the Sichuan Hydrology Record Handbook (Sichuan Water and Power Department 1984), during 1940–1975, the annual average of maximum 10 min rainfall of the study area is approximately 15.1 mm, the maximum 1 h rainfall is 45.0 mm and the annual average of maximum 24 h rainfall is 132 mm. Figure 7 shows that the majority of the debris flow events in 2011–2014 occurred in a rainfall below the annual average values. This can be a consequence of the Wenchuan earthquake, which explicitly lowered the triggering rainfall threshold in the test site.
This study makes an attempt to analyze the trigger rainfall threshold for debris flow by using the initiation mechanism of debris flow, firstly to analyze the rainfall characteristics of the watershed by using the field monitoring data and then to calculate the runoff yield and concentration progress based on field observation. Additionally, the critical runoff depth to initiate debris flow was calculated by the initiation mechanism with the underlying surface condition (materials, longitudinal slope, etc.) of the gully. Then, the corresponding rainfall for the initiation of debris was back-calculated based on the stored-full runoff generation. At last, these factors were combined to build the rainfall threshold model. This method can be applied to the early warning system in the areas with scarcity of rainfall data.

The flow chart of the research is shown in Fig. 8.
The main influence factors for the formation of debris flow event include three parts: a steep slope of the gully (served as potential energy condition), abundant solid materials (source condition) and water source condition (usually is rainfall condition for rainstorm debris flow). For rainstorm debris flow events, the precipitation and intensity of rainfall are the decisive factors of debris flow initiation. If there are no earthquakes or other extreme events, the topography of the gully can be considered relatively stable. In contrast, rainfall conditions and the distribution of solid materials that determine the occurrence of debris flows can display temporal and spatial variation within the same watershed. Therefore, it is common to provide warning of debris flows based on rainfall data after assessing the supply and distribution of loose solid materials. In Takahashi's model, the characteristics of soil, such as the porosity and the hydraulic conductivity of soils, are not considered, and the characteristic particle size and the volume concentration of sediment are considered, while the characteristics of topography are mainly represented by the longitudinal slope of the gully. Furthermore, in the stored-full runoff model, the maximum storage capacity of watershed, which is mainly decided by the porosity and permeability of the soil, may represent the characteristic of the hydraulic conductivity of solid material to a certain extent. Therefore, this study does not consider the hydraulic conductivity.
3.1 Rainfall pattern and the spatial–temporal distribution characteristics
Mountain hazards such as debris flows are closely related to rainfall duration, rainfall amount and rainfall pattern (Liu et al., 2009). Rainfall patterns affect not only the formation of surface runoff but also the formation and development of debris flows. Different rainfall patterns result in different soil water contents; thus, the internal structure of the soil, stress conditions, shear resistance, slip resistance and removable thickness can vary. The initiation of a debris flow is the result of both short-duration heavy rains and the antecedent rainfall (Cui et al., 2007; Guo et al., 2013). Many previous observational data sets have shown that the initiation of a debris flow often appears at a certain time that has a high correlation with the rainfall pattern (Rianna et al., 2014; Mohamadi and Kavian, 2015).
The precipitation characteristics affect not only the formation of runoff but also the formation and development of the debris flow. Different rainfalls result in different soil water contents, and thus the internal structure of the soil, stress conditions, corrosion resistance and slip resistance can vary (Pan et al., 2013). Based on the rainfall characteristics, rainfall patterns can be roughly divided into two kinds, the flat pattern and the peak pattern, as shown in Fig. 9. If the rainfall intensity has little variation, there is no obvious peak in the whole rainfall process; such rainfall can be described as flat pattern rainfall. If the soils are characterized by low hydraulic conductivity, this kind of rainfall cannot trigger a debris flow separately; they will mainly be triggered by the great amount of effective antecedent precipitation. When the rainfall intensity increases suddenly during a certain period of time, the rainfall process will have an obvious peak and is termed peak pattern rainfall. If the hydraulic conductivity is high enough, the rainfall can infiltrate the soil completely and mass can move easily. These debris flows are mainly controlled by the short-duration heavy rains. Peak pattern rainfall may have one or more peaks (Pan et al., 2013).

Through analyzing the rainfall data of the Guojuanyan gully, the rainfall pattern and the spatial–temporal distribution characteristics can be obtained.
3.2 The calculation of the antecedent precipitation index (API)
The rainfall factor influencing debris flows consists of three parts: indirect antecedent precipitation (IAP) (Pa0 in this paper), direct antecedent precipitation (DAP) (Rt in this paper) and triggering precipitation (TP) (I60 in this paper). The relationships among them are shown in Fig. 10. Obviously, IAP increases soil moisture and decreases the soil stability, and DAP saturates soils and thus decreases the critical condition of debris flow occurrence. Although TP is believed to initiate debris flows directly, its contribution amounts to only 37 % of total water (Cui et al., 2007). Guo et al. (2013) analyzed the rainstorms and debris flow events during June and September in 2006 and 2008: there were 208 days with antecedent rainfall more than 10 mm, approximately 57 % days of the rain season. Among them, there were 66 days with antecedent rainfall between 10 and 15 mm, with 1 debris flow event; 53 days between 15 and 20 mm, with 4 debris flow events; 28 days between 20 and 25 mm, with 4 debris flow events; 30 days between 25 and 33 mm, with 5 debris flow; and 35 days more than 33 mm, with 9 debris flow events. So this group of data can specifically illustrate the importance of the antecedent rainfall to the debris flow events.
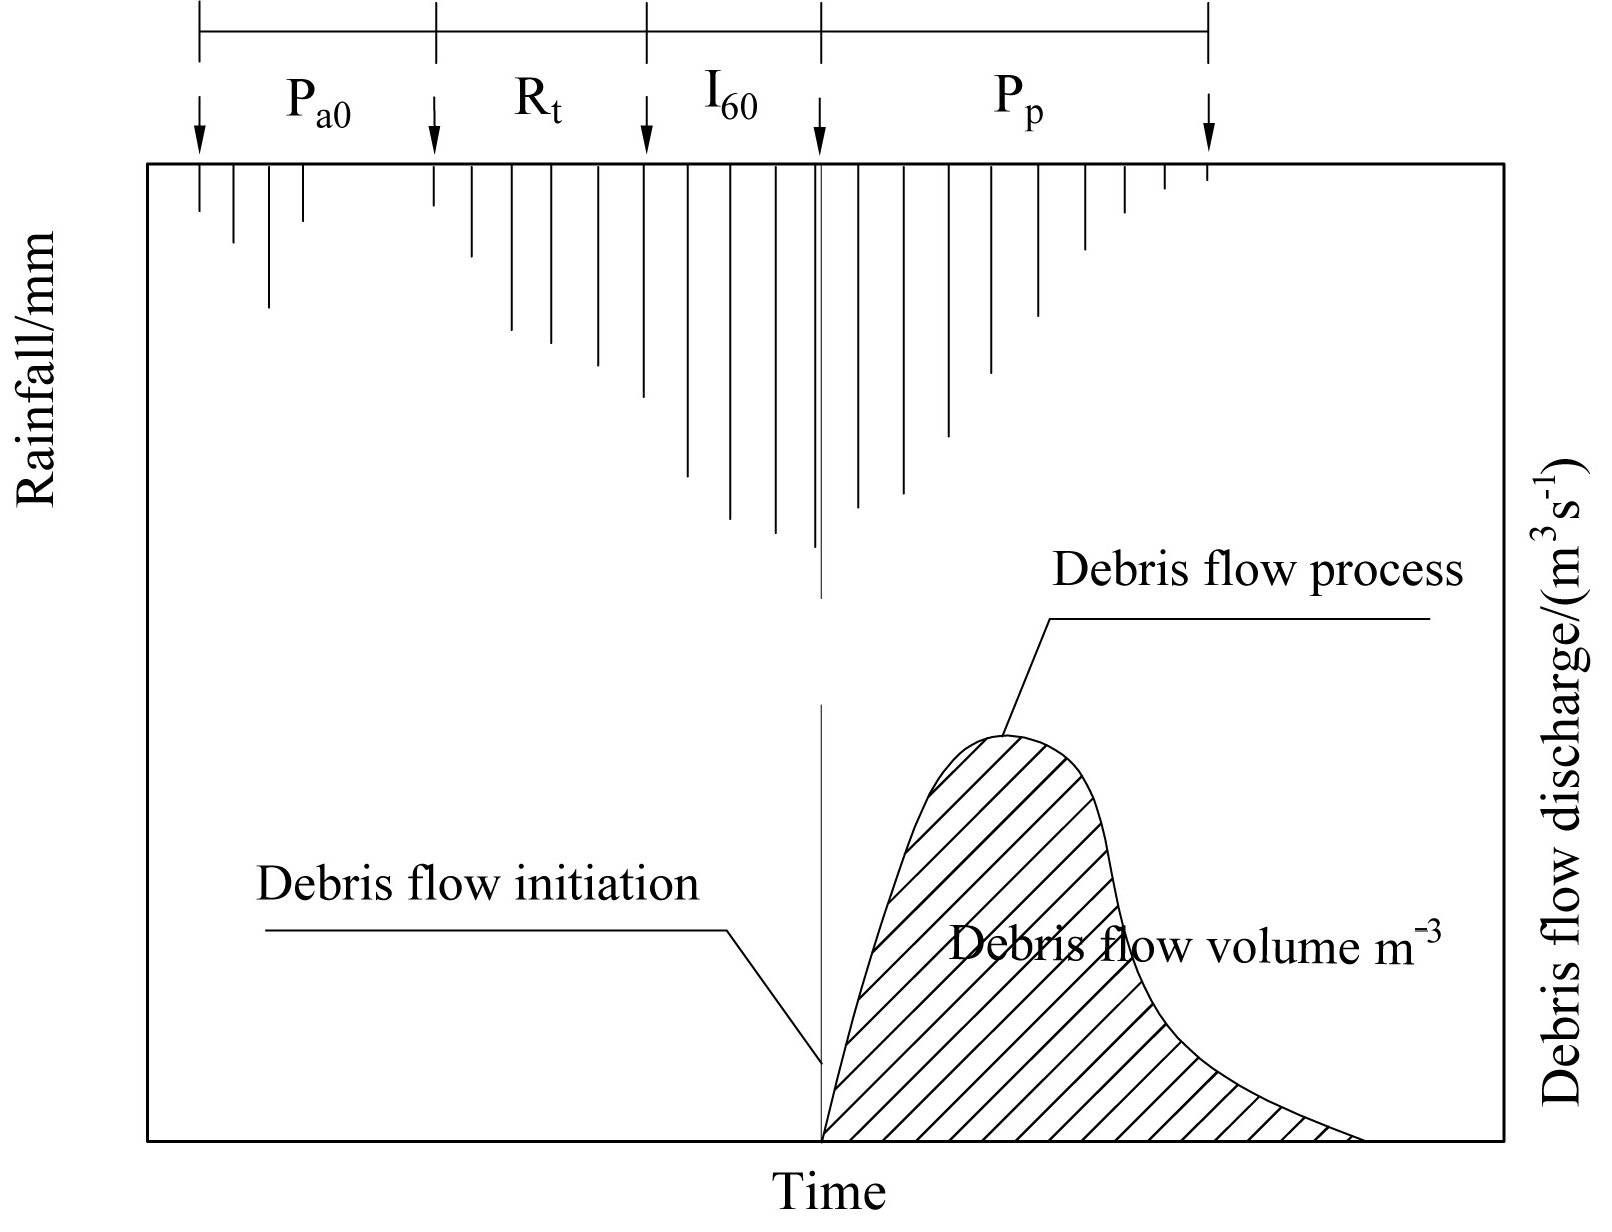
As in Fig. 10, take 1 h rainfall (I60), obtained from the observed data of the Guojuanyan gully, as the TP. The API includes IAP and DAP, calculated as the following expression (Zhao et al., 2011; Guo, 2013; Zhuang et al., 2015):
where Pa0 is the effective antecedent precipitation (mm) and Rt is the direct antecedent precipitation (mm), which is the precipitation from the beginning of the rainfall that triggers debris flow to the 1 h before the debris flow.
It is difficult to study the influence of antecedent rainfall to debris flow as it mainly relies on the heterogeneity of soils (strength and permeability properties), which makes it hard to measure the moisture. Usually, the frequently used method for calculating antecedent daily rainfall is the weighted sum equation as below (Crozier and Eyles, 1980; Glade et al., 2000):
where Pi is the daily precipitation on the ith day preceding the debris flow event () and Ki is a decay coefficient due to evaporation and geomorphological conditions of the soil. The value of the K is typically 0.8–0.9 and can be determined by the test of soil moisture content based on Eq. (2) in the watershed. The effect of a rainfall event usually diminishes with the time going forward. Different patterns of storm debris flow gullies require different numbers of previous indirect rainfall days (n), which can be determined by the relationship between the triggering rainfall and the antecedent rainfall of a debris flow (Pan et al., 2013). If the rainfall is sharp and heavy, the initiation of debris flow would mainly be determined by DAP and TP, while the influence of the antecedent precipitation would be decreased, and vice versa.
3.3 The rainfall threshold curve of debris flows
3.3.1 The initiation mechanism of hydraulic-driven debris flows
When the watershed hydrodynamics, which include the runoff, soil moisture content and the discharge, reach a certain level, the loose deposits in the channel bed will initiate movement and the sediment concentration of the flow will increase, leading the sediment-laden flow to transform into a debris flow. The formation of this kind of debris flow is a completely hydrodynamic process. Therefore, it can be regarded as the initiation problem of debris flow under hydrodynamic force. The forming process of hydraulic-driven debris flows is shown in Fig. 11.
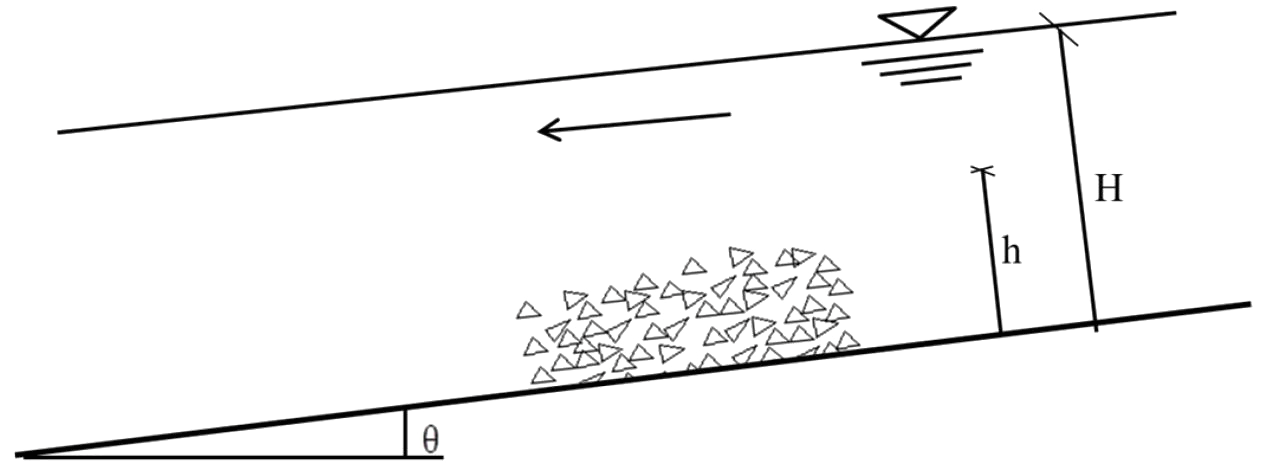
According to Takahashi's model, the critical depth for hydraulic-driven debris flows is
where C∗ is the volume concentration obtained by experiments (0.812); σ is the unit weight of loose deposits (usually 2.65 g cm−3); ρ is the unit weight of water (1.0 g cm−3); θ is the channel bed slope (∘); ϕ is the internal friction angle (∘) and can be measured by shear tests; and dm is the average grain diameter (mm), which can be expressed as
where d16, d50 and d84 are characteristic particle sizes of the loose deposits (mm), whose weight percentages are 16, 50 and 84 %, respectively.
Takahashi's model has become one of the most common for the initiation of debris flow. A great deal of related studies were published based on Takahashi's model. Some discussed the laws of debris flow according to the geomorphology and the water content (Sassa et al., 2010; Wang et al., 2016), while others examined the critical conditions of debris flow with mechanical stability analysis (Cao et al., 2004; Jiang et al., 2016). However, Takahashi's relation was determined for debris flow propagating over a rigid bed – hence, with a minor effect of quasi-static actions near the bed. Lanzoni et al. (2017) slightly modified the Takahashi formulation of the bulk concentration, which considered the long-lasting grain interactions at the boundary between the upper inertial grain layer and the underlying static sediment bed and validated the proposed formulation with a wide set of experimental data (Takahashi, 1978; Tsubaki et al., 1983; Lanzoni, 1993; Armanini et al., 2005). The effects of flow rheology on the basis of velocity profiles are analyzed with attention to the role of different stress-generating mechanisms.
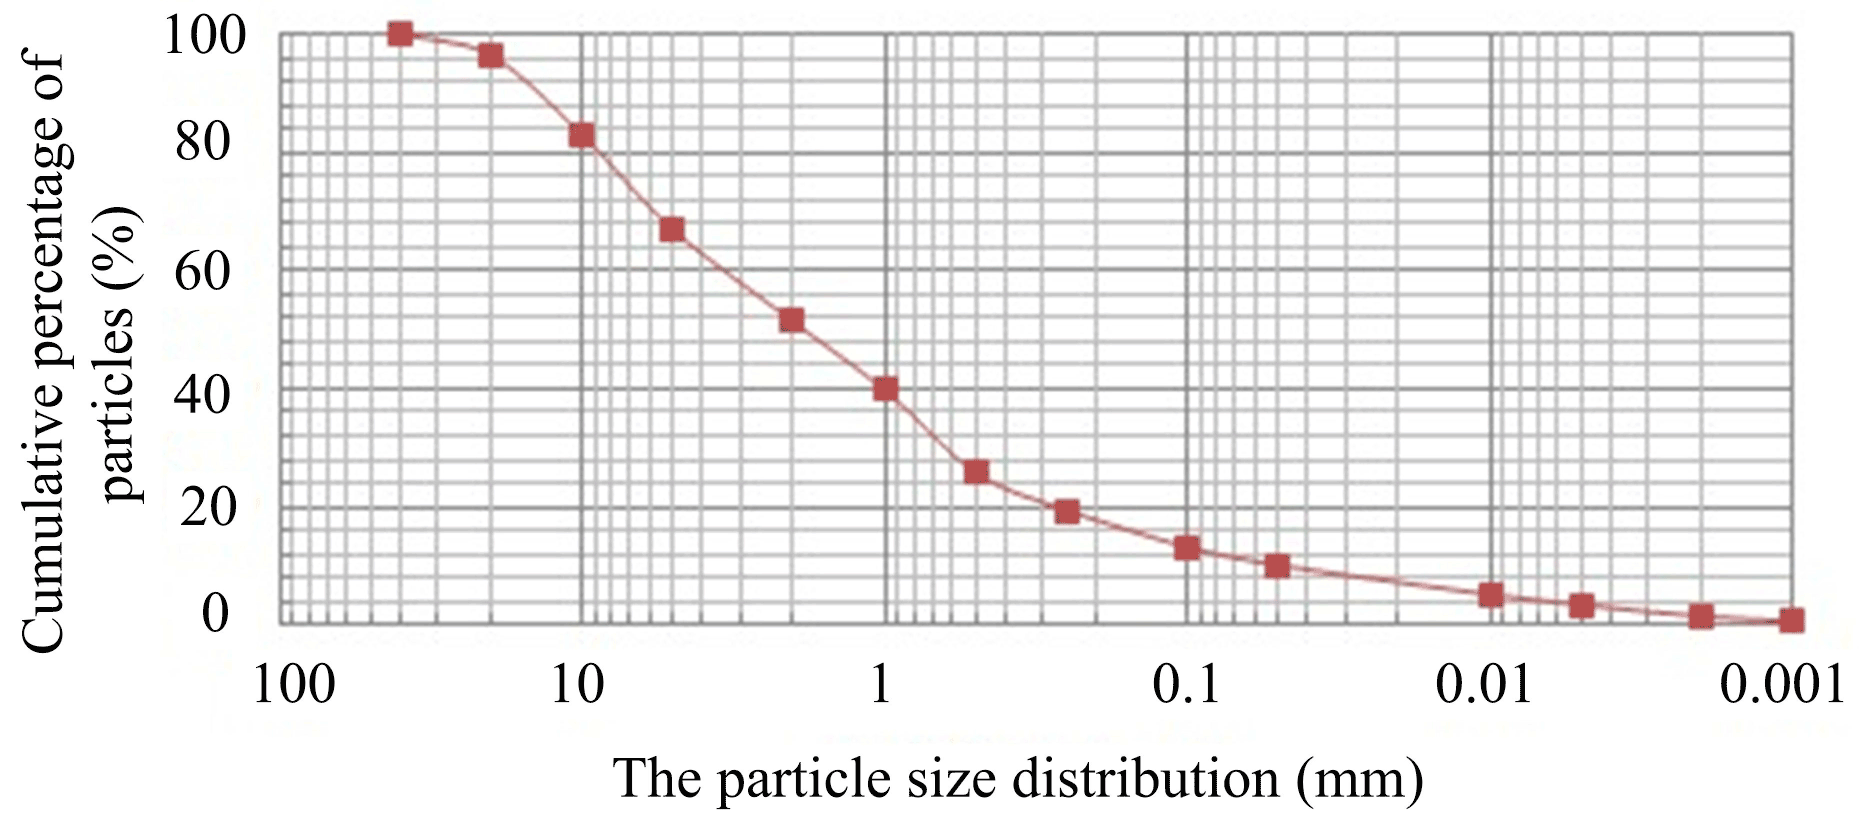
Table 4Critical water depth of debris flow triggering in Guojuanyan gully.
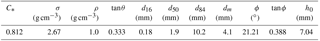
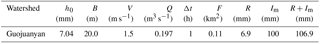
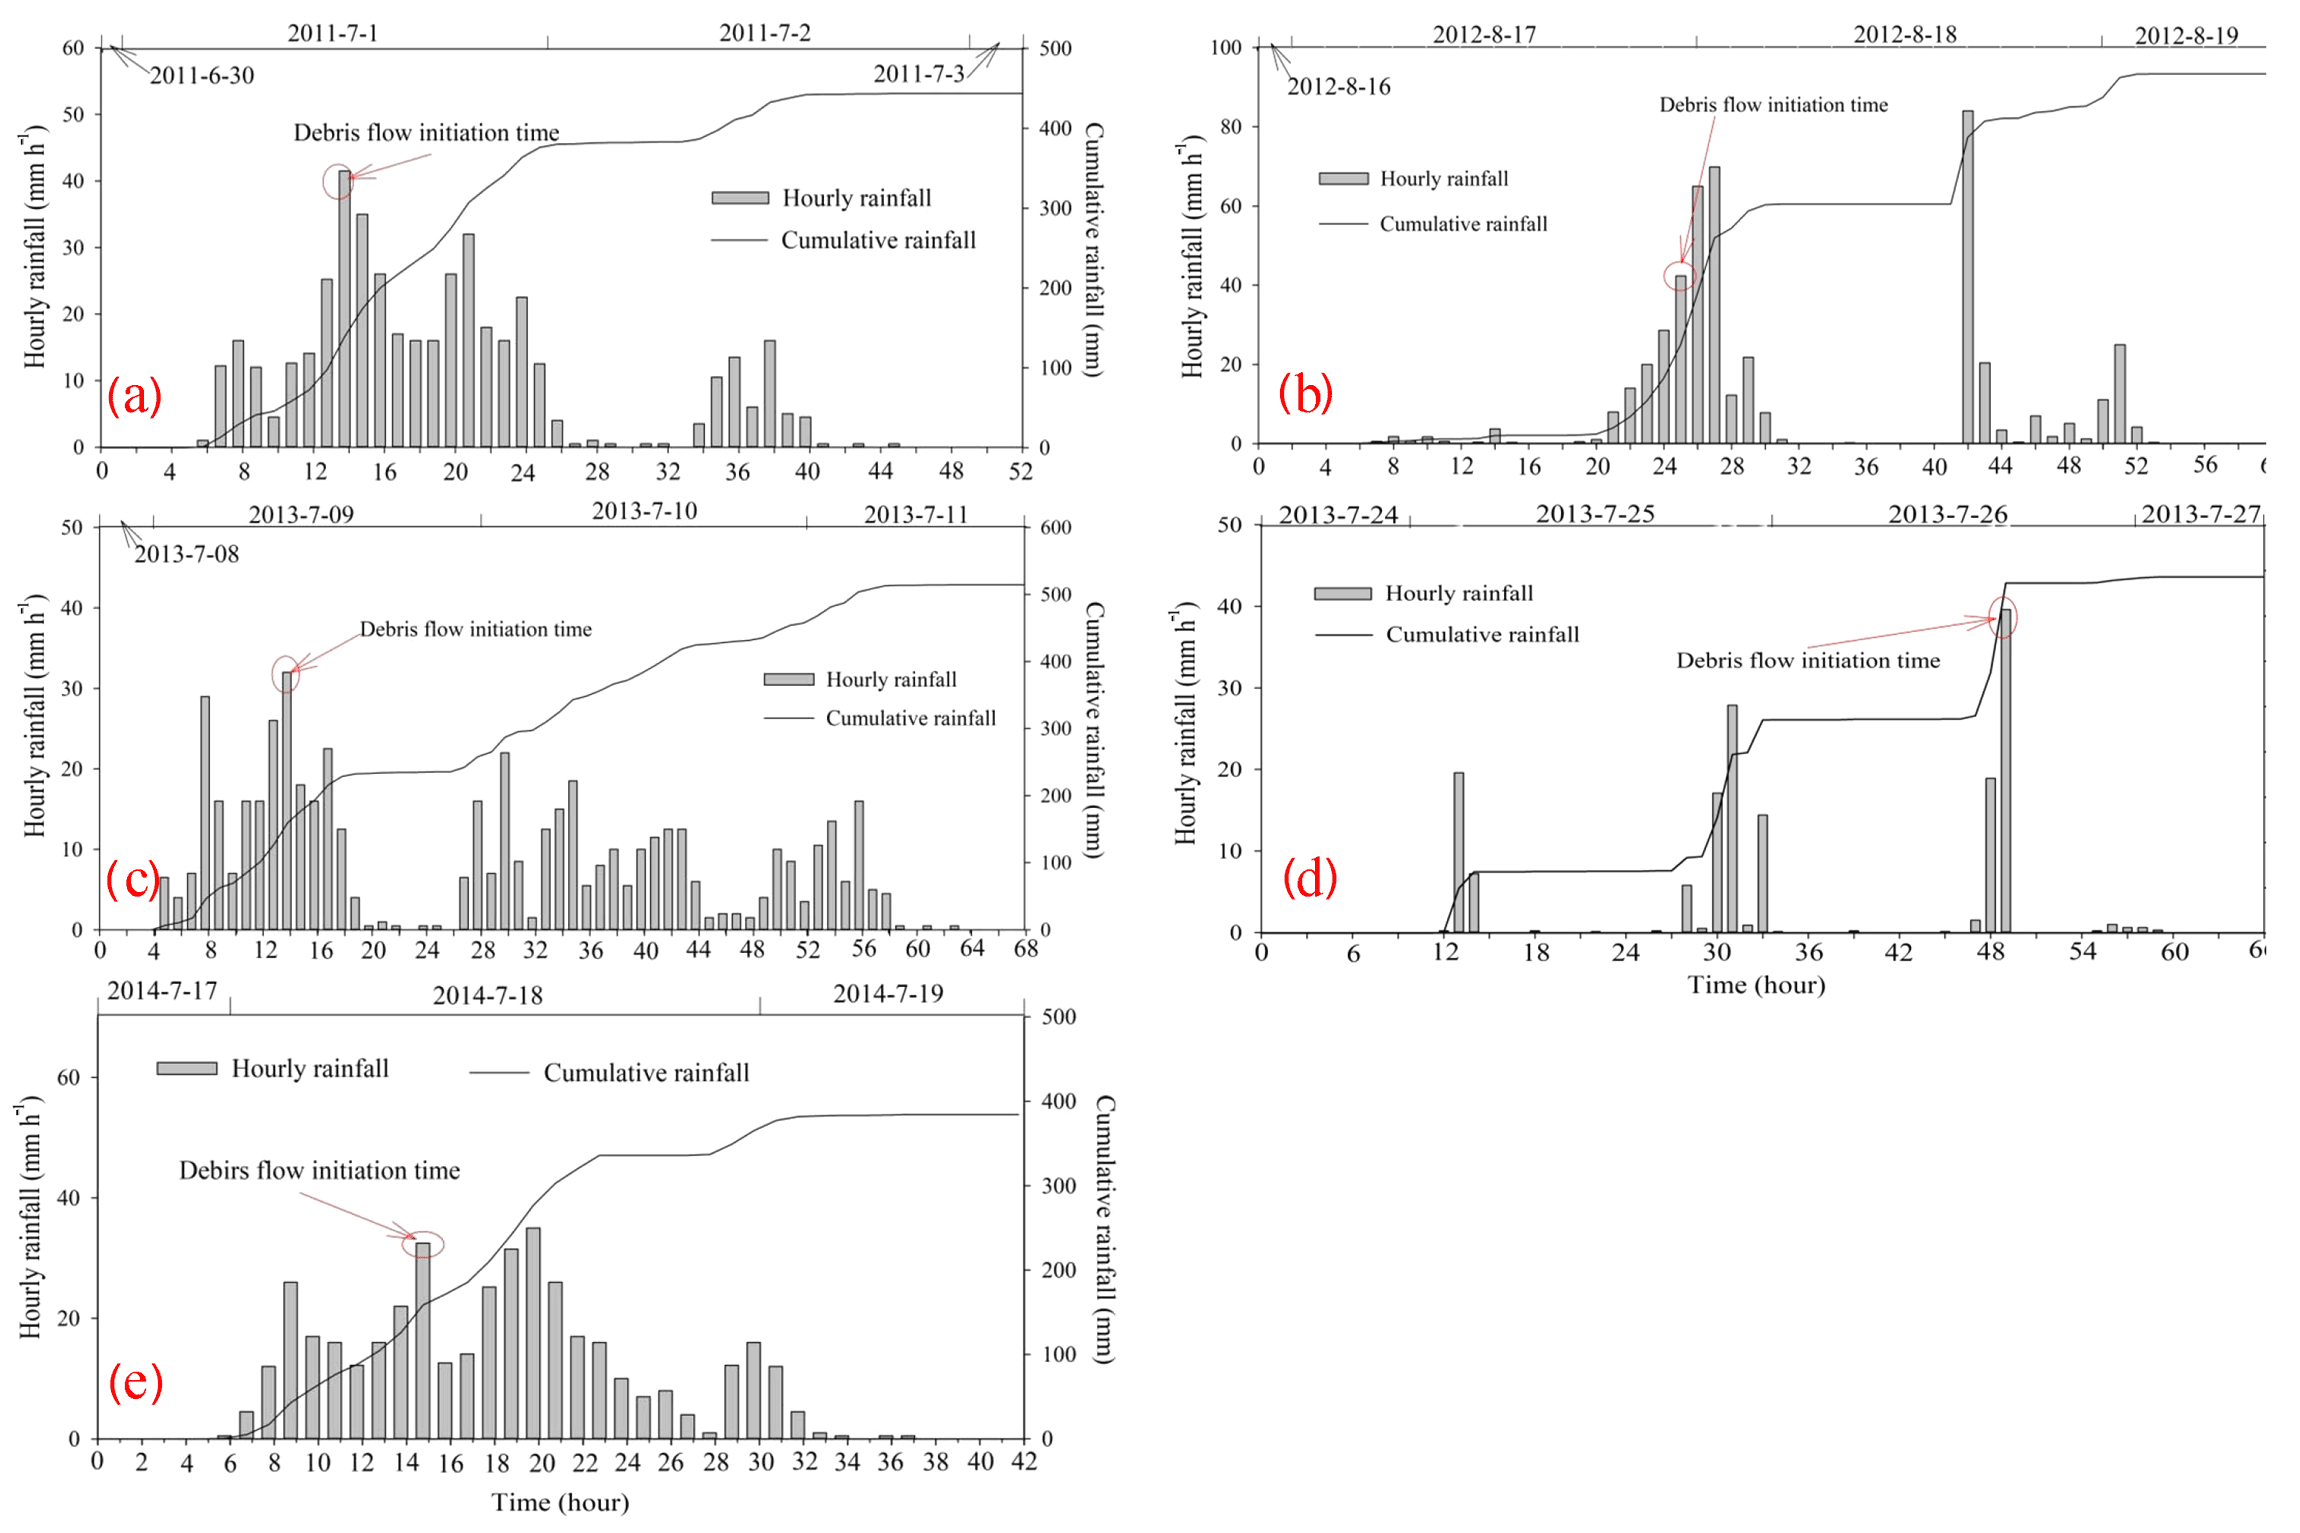
Figure 13The rainfall process of debris flow events in the Guojuanyan gully from 2011 to 2014 (a 1 July 2011; b 17 August 2012; c 9 July 2013; d 26 July 2013; e 18 July 2014).
This study aims to the initiation of loose solid materials in the gully under surface runoff; the interactions on the boundary are not involved. Therefore, Takahashi's model can be used in this study.
3.3.2 Calculation of watershed runoff yield and concentration
The stored-full runoff, one of the modes of runoff production, is also called the super storage runoff. The reason for the runoff yield is that the aeration zone and the saturation zone of the soil are both saturated. In the humid and semi-humid areas where rainfall is plentiful because of the high groundwater level and soil moisture content, when the losses of precipitation meet the plant interception and infiltration, the stored-full runoff would not increase anymore with continued rain. The Guojuanyan gully is located in Dujiangyan city, which is in a humid area. Therefore, stored-full runoff can be used to calculate the watershed runoff. That is, it can be supposed that the water storage can reach the maximum storage capacity of the watershed in each heavy rain event. Therefore, the rainfall loss in each time I is the difference between the maximum water storage capacity Im and the soil moisture content before the rain Pa. The water balance equation of stored-full runoff is expressed as follows (Ye et al., 1992):
where R is the runoff depth (mm), P is the precipitation of one rainfall (mm), I is the rainfall loss (mm) and Im is the watershed maximum storage capacity (mm) for a certain watershed (a constant for a certain watershed that can be calculated by the infiltration curve or infiltration experiment data). In this study, Im comes from the Sichuan Hydrology Record Handbook (Sichuan Water and Power Department 1984) and Pa is the API, referring to the total rainfall prior to the 1 h peak rainfall leading to debris flow initiation.
Equation (5) can be expressed as follows:
The precipitation intensity is a measure of the peak precipitation. At the same time, the duration of the peak precipitation is generally brief, lasting only up to tens of minutes. Therefore, 10 min precipitation intensity (maximum precipitation over a 10 min period during the rainfall event) is selected as the triggering rainfall for debris flow, which is appropriate and the most representative. However, it is difficult to obtain such short-duration rainfall data in areas with scarcity of data. Therefore, in this study, P and Pa are replaced by I60 (1 h rainfall) and API, respectively; thus, Eq. (6) is expressed as
In the hydrological study, the runoff depth R is
where R is the runoff depth (m); W is the total volume of runoff (m3); F is the watershed area (km2); Δt is the duration time, in this study it is 1 h; and Q is the average flow of the watershed (m3 s−1), which can be expressed as follows:
where B is the width of the channel (m), V is the average velocity (m s−1) and h0 is the critical depth (m).
Equation (7) is the expression of the rainfall threshold curve for a watershed, which can be used for debris flow early warning. This proposed rainfall threshold curve is a function of the API and 1 h rainfall (I60), which is a line with a negative slope.
4.1 The rainfall threshold curve of debris flow
4.1.1 The critical depth of the Guojuanyan gully
The grain grading graph (Fig. 12) is obtained by laboratory grain size analysis experiments for the loose deposits of the Guojuanyan gully. Figure 12 shows that the characteristic particle sizes d16, d50, d84 and dm are 0.18, 1.9, 10.2 and 4.1 mm, respectively. According to Eq. (1), the critical depth (h0) of the Guojuanyan gully is 7.04 mm.
4.1.2 The rainfall threshold curve of debris flow
Taking the cross section at the outlet of the debris flow formation region as the computation object, based on the field investigations and measurements, the width of the cross section is 20 m, and the average velocity of debris flows, which is calculated by the several debris flow events, is 1.5 m s−1. Based on the Sichuan Hydrology Record Handbook (Sichuan Water and Power Department 1984), the watershed maximum storage capacity (Im) of the Guojuanyan gully is 100 mm. According to Eqs. (5)–(7), the calculated rainfall threshold curve of debris flow in the Guojuanyan gully is shown in Table 5.
From the calculated results, we can conclude the rainfall threshold of the debris flow is mm; that is, when the sum of the API and the 1 h rainfall (I60) reaches 107 mm (early warning area), the gully may trigger debris flow.
4.2 Validation of the results
4.2.1 The typical debris flow events in the Guojuanyan gully after earthquake
Five typical debris flow events and the corresponding rainfall processes are showed in Fig. 13. The debris flow initiation time and the rainfall, both hourly rainfall and cumulative rainfall, have been recorded. From Fig. 13, the five debris flows were triggered by torrential rains.
4.2.2 The calculation of API and 1 h triggering rainfall of the typical rainstorms during 2010–2014
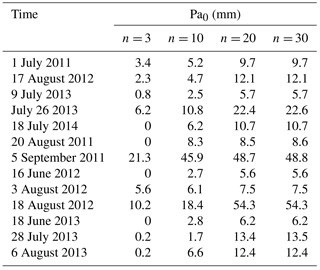
Based on the field tests and experiences, the value of K in Eq. (2) is identified as 0.8 (Cui et al., 2007). To determine the number of previous indirect rainfall days (n), a comparison of 3, 10, 20 and 30 days is shown in Table 6. It indicates that the value of the effective antecedent precipitations (Pa0) increased from 3 to 20 days, while the value of Pa0 barely changed at 30 days. Therefore, it can be concluded that the effect of a rainfall event usually diminished in 20 days. Hence, the number of previous indirect rainfall days (n) is identified as 20.
Thus, the intensity of the 1 h triggering rainfall I60 and cumulative rainfall for the typical rainstorms are shown in Table 7. In addition to the rainfall process of the five debris flow events (Fig. 13), some typical rainfalls whose daily rainfall was greater than 50 mm but did not trigger a debris flow were also calculated as a contrast; the greatest 1 h rainfall is considered as I60.
Table 7The data of typical rainfall in the Guojuanyan gully after the earthquake.
The proposed rainfall threshold curve is shown in Fig. 14, in which the red line defines the threshold relationship. It shows that the calculated values I60+ API of debris flow events in the Guojuanyan gully are all above the rainfall threshold curve, while most of the rainstorms that did not trigger debris flow lie below the curve. Therefore, this indicates that the rainfall threshold curve calculated by this work is reasonable through validation by rainfall and hazard data of the Guojuanyan gully.
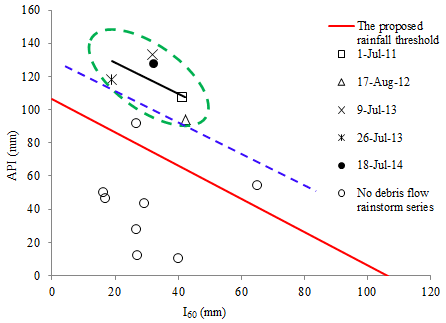
Figure 14The calculated rainfall threshold curve (red line), the trend line (black line) of the debris flow events and the debris flows triggering thresholds (dashed line) in Guojuanyan gully.
The trend of the debris flow events as well as the debris flow thresholds were analyzed in Fig. 14 by using the monitoring rainfall data. A comparison between the thresholds and the calculated threshold curve indicates that they have the same laws. Therefore, the threshold calculated method proposed in this work is reasonable and can be used in areas with scarcity of data. The proposed rainfall threshold curve is a function of the API and the 1 h rainfall (I60), which has been validated by rainfall and hazard data. It should be noted that the proposed approach is based on a procedure that can be exported elsewhere only if a site-specific calibration is used to develop specific thresholds for other test sites. Therefore, the specific value of the threshold should be calculated by the initiation conditions of the debris flow in a specific gully.
However, this work still has two limitations. In Fig. 14, there are two points above the curve that did not trigger debris flow at all. Although we have highlighted the significance and interconnection of antecedent rainfall, critical rainfall and 1 h triggering rainfall, as well as their accurate determination before the hour of debris flow triggering, it should be noted that the rainfall is only the triggering factor of debris flows. A comprehensive warning system must contain more environmental factors, such as the geologic and geomorphologic factors and the distribution of material source. In addition, the special and complex formative environment of debris flow after an earthquake caused the rainfall threshold is much more complex and uncertain. The rainfall threshold of debris flow is influenced by the API, rainfall characteristics, amount of loose deposits, channel and slope characteristics, and so on. Therefore, we should further study the characteristics of the movable solid materials, the shape of gully, and so on to modify the rainfall threshold curve. In contrast, if the two rainstorms were under the threshold, all the debris flow event points would still be located above the threshold and there would be no missed alarms. Therefore, the threshold established in this work is convenient and relatively safe.
Restricted by the limited rainfall data, this study was validated by only five debris flow events. Another limitation of this work is that the approach proposed in this study has not been validated by gullies other than the Guojuanyan gully so far. Figures 13 and 14 indicated that only five debris flow events were triggered by high-intensity and short-duration rainfalls. In the future, the value of the curve should be further validated and continuously corrected with more rainfall and disaster data in later years.
First, in the areas affected by the Wenchuan earthquake, loose deposits are widely distributed, causing dramatic changes to the environmental development of debris flow; thus, debris flow occurrence increased dramatically in the subsequent years. The characteristics of the 10 min, 1 h and 24 h critical rainfalls were represented based on a comprehensive analysis of limited rainfall and hazard data. The statistical results show that the 10 min and 1 h critical rainfalls of different debris flow events have minor differences; however, the 24 h critical rainfalls vary widely. The 10 min and 1 h critical rainfalls have a notably higher correlation with debris flow occurrences than the 24 h critical rainfalls.
Second, the rainfall pattern of the Guojuanyan gully is the peak pattern, both single peak and multi-peak. The API was fully explored by the antecedent effective rainfall and triggering rainfall.
Third, as an important and effective means of debris flow early warning and mitigation, the rainfall threshold of debris flow was determined in this paper, and a new method to calculate the rainfall threshold was put forward. Firstly, the rainfall characteristics, hydrological characteristics and some other topography conditions were analyzed. Then, the critical water depth for the initiation of debris flows was calculated according to the topography conditions and physical characteristics of the loose solid materials. Finally, according to the initiation mechanism of hydraulic-driven debris flow, combined with the runoff yield and concentration laws of the watershed, this study promoted a new method to calculate the debris flow rainfall threshold. At last, the hydrological condition for the initiation of a debris flow is the result of both short-duration heavy rains (I60) and the API. The proposed approach resolves the problem of debris flow early warning in areas with scarce data and can be used to establish warning systems of debris flows for similar catchments in areas with scarce data, although it still needs further modification. This study provides a new point of view of debris flow early warning in mountainous areas.
The data are not available online but can be accessed by contacting the corresponding author.
The authors declare that they have no conflict of interest.
This article is part of the special issue “Landslide early warning systems: monitoring systems, rainfall thresholds, warning models, performance evaluation and risk perception”. It is not associated with a conference.
This paper was supported by the CRSRI Open Research Program (program no.
CKWV2015229/KY), CAS Pioneer Hundred Talents Program, 135 Strategic Program
of the Institute of Mountain Hazards and Environment, CAS (no. SDS-135-1701),
and National Nature Science Foundation of China (51679229). It was also
supported by Youth Innovation Promotion Association of the Chinese Academy
of Sciences (2018405).
Edited by: Samuele Segoni
Reviewed by: three anonymous referees
Althuwaynee, O. F., Pradhan, B., and Ahmad, N.: Estimation of rainfall threshold and its use in landslide hazard mapping of Kuala Lumpur metropolitan and surrounding areas, Landslides, 12, 861–875, https://doi.org/10.1007/s10346-014-0512-y, 2015.
Armanini, A., Capart, H., Fraccarollo, L., and Larcher, M.: Rheological stratification in experimental free-surface flows of granular-liquid mixtures, J. Fluid Mech., 532, 269–319, https://doi.org/10.1017/S0022112005004283, 2005.
Bai, L. P., Sun, J. L., and Nan, Y.: Analysis of thecritical rainfall thresholds for mudflow in Beijing, China, Geological Bulletin of China, 27, 674–680, 2018 (in Chinese).
Baum, R. L. and Godt, J. W.: Early warning of rainfall-induced shallow landslides and debris flows in the USA, Landslides, 7, 259–272, 2010.
Bogaard, T. and Greco, R.: Invited perspectives: Hydrological perspectives on precipitation intensity-duration thresholds for landslide initiation: proposing hydro-meteorological thresholds, Nat. Hazards Earth Syst. Sci., 18, 31–39, https://doi.org/10.5194/nhess-18-31-2018, 2018.
Caine, N.: The rainfall intensity-duration control of shallow landslides and debris flows, Phys. Geogr., 62A, 23–27, 1980.
Campbell, R. H.: Debris Flow Originating from Soil Slipduring Rainstorm in Southern California, Q. J. Eng. Geol. Hydroge., 7, 339–349, https://doi.org/10.1144/GSL.QJEG.1974.007.04.04, 1975.
Canli, E., Mergili, M., and Glade, T.: Probabilistic landslide ensemble prediction systems: Lessons to be learned from hydrology, Nat. Hazards Earth Syst. Sci. Discuss., https://doi.org/10.5194/nhess-2017-427, in review, 2017.
Cannon, S. H., Gartner, J. E., Wilson, R. C., Bowers, J. C., and Laber, J. L.: Storm rainfall conditions for floods and debris flows from recently burned areas in southwestern Colorado and southern California, Geomorphology 96, 250–269, 2008.
Cao, Z., Pender, G., Wallis, S., and Carling, P.: Computational dam-break hydraulics over erodible sediment bed, J. Hydraul. Eng., 130.7, 689–703, 2004.
Chen, N. S., Yang, C. L., Zhou, W., Hu, G. S., Li, H., and Hand, D.: The Critical Rainfall Characteristics for Torrents andDebris Flows in the Wenchuan Earthquake Stricken Area, J. Mt. Sci., 6, 362–372, https://doi.org/10.1007/s11629-009-1064-9, 2009.
Chen, S. C. and Huang, B. T.: Non-structural mitigation programs for sediment-related disasters after the Chichi Earthquake in Taiwan, J. Mt. Sci., 7, 291–300, 2010.
Chen, Y. J., Yu B., Zhu, Y., Wang, T., and Qi, X.: Characteristics of critical rainfall of debris flow after earthquake – a case study of the Xiaogangjian gully, J. Mt. Sci., 31, 356–361, 2013 (in Chinese).
Chen, Y. S.: An influence of earthquake on the occurrence of landslide and debris flow, Taipei: National Cheng Kung University, 2008.
Cheng, Z. L., Zhu, P. Y., and Liu, L. J.: The Relationshipbetween Debris Flow Activity and Rainfall Intensity, Journal of Natural Disasters, 7, 118–120, 1998 (in Chinese).
Crozier, M. J. and Eyles, R. J.: Assessing the probability of rapid mass movement, in: New Zealand Institution of Engineers Proceedings of Technical Groups, Proc. Third Australia, New Zealand Conference on Geomechanics, Wellington, 247–251, 1980.
Cui, P.: Experiment Research of the Initial Condition andMechanism of Debris Flow, Chinese Sci. Bull., 21, 1650–1652, 1991 (in Chinese).
Cui, P., Zhu, Y. Y., Chen, J., Han, Y. S., and Liu, H. J.: Relationships between antecedant rainfall and debris flows in Jiangjia Ravine, China, in: Debris flow hazard mitigation mechanics, Prediction, and Assessment, edited by: Chen, C. L. and Majir, J. J., Millpress, Rotterdam, 1–10, 2007.
Cui, P., Hu, K. H, Zhuang, J. Q., Yang, Y., and Zhang, J.: Prediction of debris-flow danger area by combining hydro-logical and inundation simulation methods, J. Mt. Sci., 8, 1–9, https://doi.org/10.1007/s11629-011-2040-8, 2011.
Dahal, R. K., Hasegawa, S., Nonomura, A., Yamanaka, M., Masuda, T., and Nishino, K.: Failure characteristics of rainfall-induced shallow landslides in granitic terrains of Shikoku Island of Japan, Environ. Geol., 56, 1295–1310, https://doi.org/10.1007/s00254-008-1228-x, 2009.
Degetto, M., Gregoretti, C., Bernard, M.: Comparative analysis of the differences between using LiDAR cotour-based DEMs for hydrological modeling of runoff generating debris flows in the Dolomites, Front. Earth Sci., 3, 1–15, https://doi.org/10.3389/feart.2015.00021, 2015.
Frattini, P., Crosta, G., and Sosio, R.: Approaches for defining thresholds and return periods for rainfall-triggered shallow landslides, Hydrol. Proc., 23, 1444–1460, https://doi.org/10.1002/hyp.7269, 2009.
Gregoretti, C., Degetto, M., and Boreggio, M.: GIS-based cell model for simulating debris flow runout on a fan, J. Hydrol., 534, 326–340, https://doi.org/10.1016/j.jhydrol.2015.12.054, 2016.
Glade, T., Crozier, M., and Smith, P.: Applying probability determination to refine landslide-triggering rainfall thresholds using an empirical “antecedent daily rainfall model” Pure Appl. Geophys., 157, 1059–1079, 2000.
Guo, X. J., Cui, P., and Li, Y.: Debris flow warning threshold based on antecedent rainfall: a case study in Jiangjia Ravine, Yunnan, China, J. Mt. Sci., 10, 305–314, 2013.
Guzzetti, F., Peruccacci, S., Rossi, M., and Stark, C. P.: The rainfall intensity–duration control of shallow landslides and debris flows: an update, Landslides, 5, 3–17, 2008.
Hong, Y., Hiura, H., Shino, K., Sassa, K., Suemine, A., Fukuoka, H., and Wang, G. H.: The influence of intense rainfall on the activity of large-scale crystalline schist landslides in shikoku island, Japan, Landslides, 2, 97–105, https://doi.org/10.1007/s10346-004-0043-z, 2005.
Hu, M. J. and Wang, R.: Testing Study of the Correlation among Landslide, Debris Flow and Rainfall in Jiangjia Gully, Chinese J. Rock Mech. Eng., 22, 824–828, 2003 (in Chinese).
Hu, W., Dong, X. J., Wang, G. H., van Asch, T. W. J., and Hicher, P. Y.: Initiation processes for run-off generated debris flows in the Wenchuan earthquake area of China, Geomorphology, 253, 468–477, https://doi.org/10.1016/j.geomorph.2015.10.024, 2016.
Imaizumi, F., Sidle, R. C., Tsuchiya, S., and Ohsaka, O.: Hydrogeomorphic processes in a steep debris flow initiation zone, Geophys. Res. Lett., 33, L10404, https://doi.org/10.1029/2006GL026250, 2006.
Iverson, R. M. and Lahusen, R. G.: Dynamic Pore-PressureFluctuations in Rapidly Shearing Granular Materials, Science, 246, 796–799, https://doi.org/10.1126/science.246.4931.796, 1989.
Jiang, X. G., Cui, P., Chen, H. Y, and Guo, Y. Y.: Formation conditions of outburst debris flow triggered by overtopped natural dam failure, Landslides, 14, 1–11, 2016.
Jibson, R. W.: Debris flows in southern Puerto Rico, Geol. S. Am. S., 236, 29–56, https://doi.org/10.1130/SPE236-p29, 1989.
Lagomarsino, D., Segoni, S., Rosi, A., Rossi, G., Battistini, A., Catani, F., and Casagli, N.: Quantitative comparison between two different methodologies to define rainfall thresholds for landslide forecasting, Nat. Hazards Earth Syst. Sci., 15, 2413–2423, https://doi.org/10.5194/nhess-15-2413-2015, 2015.
Lanzoni, S.: Meccanica di miscugli solido-liquido in regime granulo-inerziale, PhD thesis, Univ. of Padova (in Italian), Padua, Italy, 1993.
Lanzoni, S., Gregoretti, C., and Stancanelli, L. M.: Coarse-grained debris flow dynamics on erodible beds, J. Geophys. Res.-Earth, 122, 592–614, https://doi.org/10.1002/2016JF004046, 2017.
Liang, G. M. and Yao, L. K.: Study on the critical rainfall for debris flows, Lu Ji Gongcheng, 6, 3–5, 2008 (in Chinese).
Liu, J. F., You, Y., Chen, X. Z., and Fan, J. R.: Identification of potential sites of debris flows in the upper Min River drainage, following environmental changes caused by the Wenchuan earthquake, J. Mt. Sci., 3, 255–263, https://doi.org/10.1007/s11629-010-2017-z, 2010.
Liu, Y. H., Tang, C., Li, T. F., Wen, M. S., and Lian, J. F.: Statistical relations between geo-hazards and rain type, J. Eng. Geol., 17, 656–661, 2009 (in Chinese).
Mccoy, S. W., Kean, J. W., Coe, J. A., Tucker, G. E., Staley, D. M., and Wasklewicz, W. A.: Sediment entrainment by debris flows: In situ measurements from the head waters of a steep catchment, J. Geophys. Res., 117, F03016, https://doi.org/10.1029/2011JF002278, 2012.
Mohamadi, M. A. and Kavian, A.: Effects of rainfall patterns on runoff and soil erosion in field plots, Int. Soil Water Conserv. Res., 3, 273–281, https://doi.org/10.1016/j.iswcr.2015.10.001, 2015.
Pan, H. L., Ou, G. Q, Huang, J. C., and Bo, C.: Study of rainfall threshold of debris flow forewarning in data lack areas, RockSoil Mech., 33, 2122–2126, 2012 (in Chinese).
Pan, H. L., Huang, J. C., Wang, R., and Ou, G. Q,.: Rainfall threshold calculation method for debris flow pre-warning in data-poor areas, J. Earth Sci., 24, 854–862, https://doi.org/10.1007/s12583-013-0377-3, 2013.
Rianna, G., Pagano, L., and Urciuoli, G.: Rainfall patterns triggering shallow flowslides in pyroclastic soils, Eng. Geol., 174, 22–35, https://doi.org/10.1016/j.enggeo.2014.03.004, 2014.
Rosi, A., Lagomarsino, D., Rossi, G., Segoni, S., Battistini, A., and Casagli, N.: Updating EWS rainfall thresholds for the triggering of landslides, Nat. Hazards, 78, 297–308, 2015.
Saito, H., Nakayama, D., and Matsuyama, H.: Relationship between the initiation of a shallow landslide and rainfall intensity – duration thresholds in Japan, Geomorphology, 118, 167–175, https://doi.org/10.1016/j.geomorph.2009.12.016, 2010.
Sassa, K., Nagai, O., Solidum, R., Yamazaki, Y., and Ohta, H.: An integrated model simulating the initiation and motion of earthquake and rain induced rapid landslides and its application to the 2006 Leyte landslide, Landslides, 7, 219–236, 2010.
Segoni, S., Battistini, A., Rossi, G., Rosi, A., Lagomarsino, D., Catani, F., Moretti, S., and Casagli, N.: Technical Note: An operational landslide early warning system at regional scale based on space-time-variable rainfall thresholds, Nat. Hazards Earth Syst. Sci., 15, 853–861, https://doi.org/10.5194/nhess-15-853-2015, 2015.
Segoni, S., Rosi, A., Lagomarsino, D., Fanti, R., and Casagli, N.: Brief communication: Using averaged soil moisture estimates to improve the performances of a regional-scale landslide early warning system, Nat. Hazards Earth Syst. Sci., 18, 807–812, https://doi.org/10.5194/nhess-18-807-2018, 2018.
Shied, C. L. and Chen, L. Z.: Developing the critical line of debris – flow occurrence, Journal of Chinese Soil and Water Conservation, 26, 167–172, 1995 (in Chinese).
Shieh, C. L., Chen, Y. S., Tsai, Y. J., and Wu, J. H.: Variability in rainfall threshold for debris flow after the Chi-Chi earthquake in central Taiwan, China, Int. J. Sediment Res., 24, 177–188, 2009.
Staley, D. M., Kean, J. W., Cannon, S. C., Schmidt, K. M., and Laber, J. L.: Objective definition of rainfall intensity–duration thresholds for the initiation of post-fire debris flows in southern California, Landslides, 10, 547–562, 2013.
Takahashi, T.: Mechanical Characteristics of Debris Flow, J. Hydraul. Div.-ASCE, 104, 1153–1169, 1978.
Tang, C., Zhu, J., and Li, W. L.: Rainfall-triggered debris flows following the Wenchuan earthquake, B. Eng. Geol. Environ., 68, 187–194, https://doi.org/10.1007/s10064-009-0201-6, 2009.
Tang, C., Asch, T. W. J. V., Chang, M., Chen, G. Q., Zhao, X. H., and Huang, X. C.: Catastrophic debris flows on 13 August 2010 in the Qingping area, southwestern China: the combined effects of as trong earthquake and subsequent rainstorms, Geomorphology, 139–140, 559–576, https://doi.org/10.1016/j.geomorph.2011.12.021, 2012a.
Tang, C., Zhu, J., Chang, M., Ding, J., and Qi, X.: An empirical–statistical model for predicting debris-flow runout zones in the Wenchuan earthquake area, Quatern. Int., 250, 63–73, https://doi.org/10.1016/j.quaint.2010.11.020, 2012b.
Tecca, P. R. and Genevois, R.: Field observations of the June 30, 2001 debris flow at Acquabona (Dolomites, Italy), Landslides, 6, 39–45, https://doi.org/10.1007/s10346-009-0145-8, 2009.
Tian, B., Wang, Y. Y., and Hong, Y.: Weighted relation between antecedent rainfall and processprecipitation in debris flow prediction – A case study ofJiangjia gully in Yunnan province, Bulletin of Soil and Water Conservation, 28, 71–75, 2008 (in Chinese).
Tiranti, D. and Deangeli, C.: Modeling of debris flow depositional patterns according to the catchment and sediment source area characteristics, Front. Earth Sci., 3, 1–14, https://doi.org/10.3389/feart.2015.00008, 2015.
Tofani, V., Bicocchi, G., Rossi, G., Segoni, S., D'Ambrosio, M., Casagli, N., and Catani, F.: Soil characterization for shallow landslides modeling: a case study in the Northern Apennines (Central Italy), Landslides, 14, 755–770, https://doi.org/10.1007/s10346-017-0809-8, 2017.
Tsubaki, T., Hashimoto, H., and Suetsugi, T.: Interparticle stresses and characteristics of debris flows, Hydrosci. Hydrraul. Eng., 1, 67–82, 1983.
Wang, E. C. and Meng, Q. R.: Mesozoic and cenozoic tectonic evolution of the Longmenshan fault belt, Sci. China Ser. D, 52, 579–592, https://doi.org/10.1007/s11430-009-0053-8, 2009.
Wang, G. H., Furuya, G., Zhang, F. Y., Doi, I., Watanabe, N., Wakai A., and Marui H.: Layered internal structure and breaching risk assessment of the Higashi-Takezawa landslide dam in Niigata, Japan, Geomorphology, 267, 48–58, 2016.
Wang, J., Yu, Y., Yang, S., Lu, G. H., and Ou, G. Q.: A Modified Certainty Coefficient Method (M-CF) for Debris Flow Susceptibility Assessment: A Case Study for the Wenchuan Earthquake Meizoseismal Areas, J. Mt. Sci., 11, 1286–1297, https://doi.org/10.1007/s11629-013-2781-7, 2014.
Wang, J., Yu, Y., Ou, G. Q., Pan, H. L., and Qiao, C.: Study on the Geotechnical Mechanical Characteristics of Loose Materials in the Wenchuan Earthquake-hit Areas, Science Technology and Engineering, 16, 11–18, 2016 (in Chinese).
Wang, J., Yang, S., Ou, G. Q., Gong, Q. H., and Yuan, S. X.: Debris flow hazards assessment by combing numberical simulation and land utilization, B. Eng. Geol. Environ., 1–15, https://doi.org/10.1007/s10064-017-1006-7, 2017.
Wei, Z. L., Shang, Y. Q., Zhao, Y., Pan, P., and Jiang, Y. J.: Rainfall threshold for initiation of channelized debris flows in a small catchment based on in-site measurement, Eng. Geol., 217, 23–34, https://doi.org/10.1016/j.enggeo.2016.12.003, 2017.
Wieczorek, G. F.: Effect of rainfall intensity and during in debris flows in central Santa Cruz Mountain, California, Eng. Geol., 7, 93–104, https://doi.org/10.1130/REG7-p93, 1987.
Wilson, R. C. and Jayko, A. S.: Preliminary Maps ShowingRainfall Thresholds for Debris-Flow Activity, San Franciscoby Region, California, U.S. Geological SurveyOpen-File Report 97-745 F, 1997.
Winter, M. G.: Debris flow, rainfall and climate change in Scotland, Q. J. Eng. Geol. Hydroge., 43, 429–446, 2010.
Xu, Q., Zhang, S., Li, W. L., and van Asch, Th. W. J.: The 13 August 2010 catastrophic debris flows after the 2008 Wenchuan earthquake, China, Nat. Hazards Earth Syst. Sci., 12, 201–216, https://doi.org/10.5194/nhess-12-201-2012, 2012.
Yao, L. K.: A research on the calculation of criticalrainfall with frequency of debris flow and torrentialrain, J. Soil Water Conserv., 2, 72–78, 1988 (in Chinese).
Ye, S. Z.: Hydrological calculation, Water conservancy and Hydropower Press, p. 111, 1992.
Zhang, S. J., Yang, H. J., Wei, F. Q., Jiang, Y. H., and Liu, D. L.: A model of debris flow forecast based on the water-soil coupling mechanism, J. Earth Sci., 25, 757–763, https://doi.org/10.1007/s12583-014-0463-1, 2014.
Zhao, Y., Wei, F., Yang, H., and Jiang, Y.: Discussion on using antecedent precipitation index to supplement relative soil moisture data series, Procedia Environmental Sciences, 10, 1489-1495, 2011.
Zhou, W. and Tang, C.: Rainfall thresholds for debris flow initiation in the Wenchuan earthquake-stricken area, southwestern China, Landslides, 11, 877–887, 2014.
Zhuang, J. Q., Peng, C., Ge, Y. G., and Yong, H.: Relationship between rainfall characteristics and totalamount of debris flow, Journal of Beijing Forestry University, 31, 77–83, 2009 (in Chinese).
Zhuang, J., Cui, P., Wang, G., Chen, X., Iqbal, J., and Guo, X.: Rainfall thresholds for the occurrence of debris flows in the jiangjia gully, yunnan province, China, Eng. Geol., 195, 335–346, 2015.