the Creative Commons Attribution 4.0 License.
the Creative Commons Attribution 4.0 License.
 | 12 Jun 2018
Learning in an interactive simulation tool against landslide risks: the role of strength and availability of experiential feedback
Pratik Chaturvedi
Akshit Arora
Varun Dutt
Feedback via simulation tools is likely to help people improve their decision-making against natural disasters. However, little is known on how differing strengths of experiential feedback and feedback's availability in simulation tools influence people's decisions against landslides. We tested the influence of differing strengths of experiential feedback and feedback's availability on people's decisions against landslides in Mandi, Himachal Pradesh, India. Experiential feedback (high or low) and feedback's availability (present or absent) were varied across four between-subject conditions in a tool called the Interactive Landslide Simulation (ILS): high damage with feedback present, high damage with feedback absent, low damage with feedback present, and low damage with feedback absent. In high-damage conditions, the probabilities of damages to life and property due to landslides were 10 times higher than those in the low-damage conditions. In feedback-present conditions, experiential feedback was provided in numeric, text, and graphical formats in ILS. In feedback-absent conditions, the probabilities of damages were described; however, there was no experiential feedback present. Investments were greater in conditions where experiential feedback was present and damages were high compared to conditions where experiential feedback was absent and damages were low. Furthermore, only high-damage feedback produced learning in ILS. Simulation tools like ILS seem appropriate for landslide risk communication and for performing what-if analyses.


Landslides cause massive damages to life and property worldwide (Chaturvedi et al., 2014; Chaturvedi and Dutt, 2015; Margottini et al., 2011). Imparting knowledge about landslide causes and consequences and spreading awareness about landslide disaster mitigation are likely to be effective ways of managing landslide risks. The former approach supports structural protection measures that are likely to help people take mitigation actions and reduce the probability of landslides (Becker et al., 2013; Osuret et al., 2016; Webb and Ronan, 2014). In contrast, the latter approach likely reduces people's and assets' perceived vulnerability to risk. However, it does not influence the physical processes. One needs effective landslide risk communication systems (RCSs) to educate people about cause-and-effect relationships concerning landslides (Glade et al., 2005). To be effective, these RCSs should possess five main components (Rogers and Tsirkunov, 2011): monitoring, analysing, risk communication, warning dissemination, and capacity building.
Among these components, prior research has focused on monitoring and analysing the occurrence of landslide events (Dai et al., 2002; Montrasio et al., 2011). For example, there exist various statistical and process-based models for predicting landslides (Dai et al., 2002; Montrasio et al., 2011; Reder et al., 2018; Segoni et al., 2018; Vaz et al., 2018). Several satellite-based and sensor-based landslide monitoring systems are being used in landslide RCSs (Hong et al., 2006; Quanshah et al., 2010; Rogers et al., 2011; Frodella et al., 2017; Intrieri et al., 2017). To be effective, however, landslide RCSs need not only be based upon sound scientific models, but they also need to consider human factors, i.e. the knowledge and understanding of people residing in landslide-prone areas (Meissen and Voisard, 2008). Thus, there is an urgent need to focus on the development, evaluation, and improvement of risk communication, warning dissemination, and capacity-building measures in RCSs.
Improvements in risk communication strategies are likely to help people understand the cause-and-effect processes concerning landslides and help them improve their decision-making against these natural disasters (Grasso and Singh, 2009). However, surveys conducted among communities in landslide-prone areas (including those in northern India) have shown a lack of awareness and understanding among people about landslide risks (Chaturvedi and Dutt, 2015; Oven, 2009; Wanasolo, 2012). In a survey conducted in Mandi, India, Chaturvedi and Dutt (2015) found that 60 % of people surveyed were not able to answer questions on landslide susceptibility maps, which were prepared by experts. Also, Chaturvedi and Dutt (2015) found that a sizeable population reported landslides to be “acts of God” (39 %) and attributed activities like “shifting of temple” as causing landslides (17 %). These results are surprising as the literacy rate in Mandi and surrounding areas is quite high (81.5 %) (Census, 2011), and these results show numerous misconceptions about landslides among people in landslide-prone areas. Overall, urgent measures need to be taken that improve public understanding and awareness about landslides in affected areas.
Promising recent research has shown that experiential feedback in simulation tools likely helps improve public understanding about dynamics of physical systems (Chaturvedi et al., 2017; Dutt and Gonzalez, 2010; 2011; 2012; Fischer, 2008). Dutt and Gonzalez (2012) developed a dynamic climate change simulator (DCCS) tool, which was based upon a more generic stock-and-flow task (Gonzalez and Dutt, 2011a). The authors provided frequent feedback on cause-and-effect relationships concerning Earth's climate in DCCS, and this experiential feedback helped people reduce their climate misconceptions compared to a no-DCCS intervention. Although the prior literature has investigated the role of frequency of feedback about inputs and outputs in physical systems, little is known on how differing strengths of experiential feedback (i.e. differing probabilities of damages due to landslides) influence people's decisions over time. Also, little is known on how experiential feedback's availability (presence or absence) in simulation tools influences people's decisions.
The primary goal of this research is to evaluate how differing strengths of experiential feedback and feedback's availability influence people's mitigation decisions against landslides. A study of how the strength of experiential feedback influences people's decisions against landslides is important because people's experience of landslide consequences due to differing probabilities of landslide damages could range from no damages at all to large damages involving several injuries, infrastructure damages, and deaths. Thus, due to differing probabilities of landslide damages, some people may experience severe landslide damages and consider landslides to be a serious problem requiring immediate actions, whereas other people may experience no damages and consider landslides to be a trivial problem requiring very little attention.
In addition, the availability of feedback in simulation tools is also likely to influence people's decisions against landslides. When feedback is absent, people are only likely to acquire descriptive knowledge about the cause-and-effect relationships governing the landslide dynamics (Dutt and Gonzalez, 2010). However, when feedback is present, people get to repeatedly experience the positive or negative consequences of their decisions against landslide risks (Dutt and Gonzalez, 2010, 2011). This repeated experience will likely help people understand the cause-and-effect relationships governing the landslide dynamics.
Chaturvedi et al. (2017) proposed a computer-simulation tool, called the Interactive Landslide Simulator (ILS). The ILS tool is based upon a landslide model that considers the influence of both human factors and physical factors on landslide dynamics. Thus, in ILS, both physical factors (e.g. spatial geology and rainfall) and human factors (e.g. monetary contributions to mitigate landslides) influence the probability of catastrophic landslides. In a preliminary investigation involving the ILS tool, Chaturvedi et al. (2017) varied the probability of damages due to landslides at two levels: low probability and high probability. The high probability was set about 10 times higher than the low probability. People were asked to make monetary investment decisions, where people's monetary payments would be used for mitigating landslides (e.g. by building a retaining wall, planned road construction, provision of proper drainage or by planting crops with long roots in landslide-prone areas; please see Patra and Devi (2015) for a review of such mitigation measures). People's investments were significantly greater when the damage probability was high than when this probability was low. However, Chaturvedi et al. (2017) did not fully evaluate the effectiveness of experiential feedback of damages in the ILS tool against control conditions where this experiential feedback was not present. Also, Chaturvedi et al. (2017) did not investigate people's investment decisions over time and certain strategies in ILS, where these decisions and strategies would be indicative of learning of landslide dynamics in the tool.
The prior literature on learning from experiential feedback (Baumeister et al., 2007; Dutt and Gonzalez, 2012; Finucane et al., 2000; Knutti, 2005; Reis and Judd, 2013; Wagner, 2007) suggests that increasing the strength of damage feedback by increasing the probabilities of landslide damages in simulation tools would likely increase people's mitigation decisions. That is because a high probability of landslide damages will make people suffer monetary losses, and people would tend to minimize these losses by increasing their mitigation actions over time. It is also expected that the presence of experiential feedback about damages in simulation tools is likely to increase people's landslide mitigation actions over time (Dutt and Gonzalez, 2010, 2011, 2012). That is because the experiential feedback about damages will likely enable people to make decisions and see the consequences of their decisions; however, the absence of this feedback will not allow people to observe the consequences of their decisions once these decisions have been made (Dutt and Gonzalez, 2012). At first glance, these explanations may seem to assume people to be economically rational individuals while facing landslide disasters (Bossaerts and Murawski, 2015; von Neumann and Morgenstern, 1947), where one disregards people's bounded rationality, risk perceptions, attitudes, and behaviours (De Martino et al., 2006; Gigerenzer and Selten, 2002; Kahneman and Tversky, 1979; Simon, 1959; Slovic et al., 2005; Thaler and Sunstein, 2008; Tversky and Kahneman, 1992). However, in this paper, we consider people to be bounded rational agents (Gigerenzer and Selten, 2002; Simon, 1959), who tend to minimize their losses against landslides slowly over time via a trial-and-error learning process driven by personal experience in an uncertain environment (Dutt and Gonzalez, 2010; Slovic et al., 2005).
In this paper, we evaluate the influence of differing strengths of experiential feedback about landslide-related damages and the experiential feedback's availability in the ILS tool. More specifically, we test whether people increase their mitigation actions in the presence of experiential damage feedback compared to in the absence of this feedback. In addition, we evaluate how different probabilities of damages influence people's mitigation actions in the ILS tool. Furthermore, we also analyse people's mitigation actions over time across different conditions.
In what follows, first, we detail the characteristics of the study area and then a computational model on landslide risks that considers the role of both human factors and physical factors. Next, we detail the working of the ILS tool, i.e. based on the landslide model. Furthermore, we use the ILS tool in an experiment to evaluate the influence of differing strengths of experiential feedback and feedback's availability on people's decisions. Finally, we close this paper by discussing our results and detailing the benefits of using tools like ILS for communicating landslide risks in the real world.
In this paper, the study area was one involving the local communities living in Mandi (31.58∘ N, 76.91∘ E), a township located in the state of Himachal Pradesh, India (see Fig. 1). Mandi has an average elevation of 850 m a.m.s.l. (above mean-sea level), 23 km2 area, and a population of 26 422 people (Census, 2011). Literacy rate in Mandi is 81.5 %, and most of the population are Hindus by religion. Mandi is a highly religious place with a huge number of Hindu temples all around the town (Census, 2011). Geologically, Mandi is located on the folds of the Lesser Himalayas, and it lies in the earthquake Zone IV and V, the highest earthquake zones in the world (Hpsdma, 2017). Apart from inherent geological weaknesses that may cause landslides in Mandi, other anthropogenic activities such as road construction, deforestation of hill slopes, building construction on slopes, and debris dumping may also trigger landslides in the area surrounding the town (Hpsdma, 2017). As per Kahlon et al. (2014), around 90 % of Mandi is prone to landslides, where 25 % of this area falls under the severe landslide hazard risk category. Of the 919 landslide events that occurred in Himachal Pradesh during the past 39 years (from 1971 to 2009), 99 of them (11 %) were in Mandi, making it the fourth-highest-ranked district in terms of number of landslides, behind Shimla, Solan, and Kinnaur (Kahlon et al., 2014). The problem of landslides is accelerated in the monsoon season (mid-June to mid-September) in the town. The per-capita income of people in Mandi is close to INR 292 (∼ USD 4.48 or EUR 3.63) per day (Census, 2011). In addition, as per the tenancy laws of Himachal Pradesh, most people own land, which cannot be sold to people from outside the state (Himachal, 2012). The average per-capita property value in the state would be close to INR 20 million (Census, 2011). These values of per-capita daily income and property wealth were used in the ILS tool, and these values are detailed ahead in this paper. Furthermore, the prevailing rainfall pattern and the landslide hazard zonation (LHZ) map of Mandi, which were used in the ILS tool, are also detailed ahead in this paper.
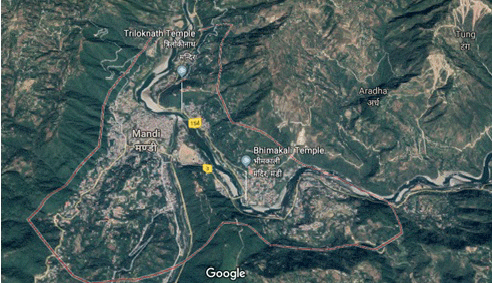
Figure 13-D satellite view of Mandi and adjoining areas. The town is located in a valley around the Beas River with high mountains that are prone to landslides on both sides. Source: Google Maps.
Chaturvedi et al. (2017) proposed a computational model for simulating landslide risks that was based upon the integration of human and physical factors (see Fig. 2). Here, we briefly detail this model and use it in the ILS tool for our experiment (reported ahead). As seen in Fig. 2, the probability of landslides due to human factors in the ILS tool is adapted from a model suggested by Hasson et al. (2010) (see box 1.1 in Fig. 2). In the model of Hasson et al. (2010), the probability of a disaster (e.g. landslide) due to human factors (e.g. investment) was a function of the cumulative monetary contributions made by participants to avert the disaster from the total endowment available to participants. Thus, investing against disaster in mitigation measures reduces the probability of disaster, and not investing in mitigation measures increases the probability of disaster. However, by reducing the landslide risk, people also have less ability to engage in other profitable investments due to loss in revenue. Although we assume this model to incorporate human mitigation actions in the ILS tool, there may also be other model assumptions possible where certain detrimental human actions (e.g. deforestation) may increase the probability of landslides or the risk of landslides (where risk = probability (hazard) × consequence). We plan to consider such model assumptions as part of our future research. In addition, there may be contributions made by the national, regional, and local governments to provide protection measures against landslides in addition to the investments made by people residing in the area (Hpsdma, 2017). Such investments may be made based upon the past occurrences of landslides in the study area. Furthermore, people may also be able to buy insurance that covers the damages caused by landslides. However, in India, in the absence of assistance from the government, people tend to rely on their own wealth for adaptation to landslide occurrence. Thus, purchasing insurance against disasters is less common and unpopular as insurance companies mostly do not pay insured amounts in the event of natural disasters like landslides (ICICI, 2018). In this paper, we restrict our analyses to only people's own investments influencing landslides. We plan to consider the role of government contributions to mitigation and adaptation (mostly after landslide events) and partial insurance payments as part of our future research.
Furthermore, in the landslide model, the probability of landslides due to physical (natural) factors (see box 1.2 in Fig. 2) is a function of the prevailing rainfall conditions and the nature of geology in the area (Mathew et al., 2013). In this paper, we restrict our focus to considering only weather (rainfall)-induced landslides. As shown in Fig. 2, the ILS model focuses on calculation of total probability of landslide (due to physical and human factors) (box 1.3 in Fig. 2). This total probability of landslide is calculated as a weighted sum of probability of landslide due to physical factors and probability of landslide due to human factors. Furthermore, the model simulates different types of damages caused by landslides and their effects on people's earnings (box 1.4 in Fig. 2).
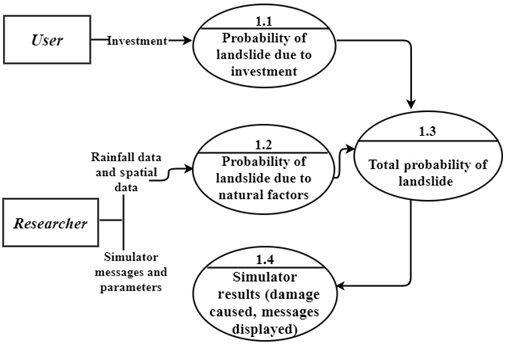
Figure 2Probabilistic model of the Interactive Landslide Simulator tool. Figure adapted from Chaturvedi et al. (2017).
3.1 Total probability of landslides
As described by Chaturvedi et al. (2017), the total probability of landslides is a function of landslide probabilities due to human factors and physical factors. This total probability of landslides can be represented as the following:
Where W is a free weight parameter in [0, 1]. The total probability formula involves calculation of two probabilities, probability of landslide due to human investments (P(I)) and probability of landslide due to physical factors (P(E)). These probabilities have been defined below. According to Eq. (1), the total probability of landslides will change based upon both human decisions and environmental factors over time. In the ILS model, we simulate the total probability of landslides P(T), where a landslide occurs when a uniformly distributed random number () is less than or equal to P(T) on a certain day. If a uniformly distributed random number in [0, 1] (U(0,1)) is less than or equal to a point probability value, then it simulates this point probability value. For example, if %, then U(0,1) will be less than or equal to the 30 % value exactly 30 % of the total number of times it is simulated; thus this random process will simulate a 30 % probability value.
3.1.1 Probability of landslide due to human investments (P(I))
As suggested by Chaturvedi et al. (2017), the probability P(I) is calculated using the probability model suggested by Hasson et al. (2010). In this model, P(I) is directly proportional to the amount of money invested by participants for landslide mitigation. The probability of landslide due to human investments is
B represents the budget available towards addressing landslides for a day (if a person earns an income or salary, then B is the same as this income or salary earned in a day). n represents the number of days. xi represents the investments made by a person for each day i to mitigate landslides; xi≤B. M represents return to mitigation, which is a free parameter and captures the lower bound probability of P(I); i.e. P(I)= 1−M when a person puts her entire budget B into landslide mitigation (; 0 1.
People's monetary investments (xi) are for mitigation measures like building retaining walls or planting long-root crops.
3.1.2 Probability of landslide due to physical factors (P(E))
Some of the physical factors impacting landslides include rainfall, soil types, and slope profiles (Chaturvedi et al., 2017; Dai et al., 2002). These factors can be categorized into two categories:
-
probability of landslide due to rainfall (P(R)),
-
probability of landslide due to soil types and slope profiles (spatial probability, P(S)).
For the sake of simplicity, we have assumed that P(S) is independent of P(R). Thus, given P(R) and P(S), the probability of landslide due to physical factors, P(E), is defined as
In the first step, P(R) is calculated based upon a logistic-regression model (Mathew et al., 2013) as follows:
where DR, 3DCR, and 30DAR are the daily rainfall, the 3-day cumulative rainfall, and the 30-day antecedent rainfall in the study area, respectively. This model in Eqs. (4a) and (4b) was developed for the study area by Mathew et al. (2013), and we have used the same model in this paper. The rainfall parameters in the model were calculated from the daily rain data from the Indian Metrological Department (IMD). We compared the shape of the P(R) distribution by averaging rainfall data over the past 5 years with the shape of the P(R) distribution by averaging rainfall data over the past 30 years. This comparison revealed that there were no statistical differences between these two distributions. Thus, we used the daily rainfall data averaged over the past 5 years (2010–2014) to find the average rainfall values on each day out of the 365 days in a year. Next, these averaged rainfall values were put into Eqs. (4a) and (4b) to generate the landslide probability due to rainfall (P(R)) over an entire year. Figure 3 shows the resulting shape of P(R) distribution as a function of days in the year for the study area. Due to the monsoon period in India during mid-June–mid-September, there is a peak in the P(R) distribution curve during these months. Depending upon the start date in the ILS tool, one could read P(R) values from Fig. 3 as the probability of landslides due to rainfall on a certain day in the year. This P(R) function was assumed to possess the same shape across all participants in the ILS tool.
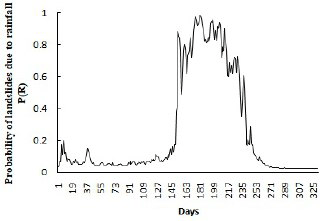
Figure 3Probability of landslide due to rainfall over days for the study area. The probability was generated by using Eqs. (4a) and (4b).
The second step is to evaluate the spatial probability of landslides, P(S). The determination of P(S) is done from the LHZ map of the study area (see Fig. 4a; Anbalagan, 1992; Chaturvedi et al., 2017; Clerici et al., 2002), which provides the landslide susceptibility of the area and is based on various landslide causative factors in the study area (e.g. geology, geometry, and geomorphology). As shown in Fig. 4a, we computed the spatial probability of landslides in the study area based upon the total estimated hazard (THED) rating of different locations on a LHZ map (see legend) and their surface area of coverage (the maximum possible value of THED is 11.0, and its minimum possible value is 0.0). Table 1 provides the THED scale to report the susceptibility of an area to landslides (Anbalagan, 1992).
First, from Table 1, the critical THED values (e.g. 3.5, 5.0, 6.5, and 8.0) were converted into a probability value by dividing by the highest THED value (= 11.0). Next, we used the LHZ map of the study area (Fig. 4a) to find the surface area that was in a hazard class (very low, low, moderate, high, and very high) and used this area to determine the cumulative probability density function for P(S). For example, if a THED of 3.5 (low hazard class) has a 20 % coverage area on LHZ (Fig. 4a), then the spatial probability is less than equal to 0.32 (= 3.5∕11.0) with a 20 % chance. Similarly, if a THED of 5.0 (moderate hazard class) has a 30 % coverage area on LHZ, then the spatial probability is less than equal to 0.45 (= 5.0∕11.0) with a 50 % chance (30 % + 20 %). Such calculations enabled us to develop a cumulative density function for P(S) (see Fig. 4b). As shown in Fig. 4b (the cumulative density function of P(S)), 1.94 % of area belonged to the very low hazard class (P(S) from 0∕11 to 3.5∕11), 46.61 % of area belonged to the low hazard class (P(S) from 3.5∕11 to 5.0∕11), 30.28 % of area belonged to the moderate hazard class (P(S) from 5.0∕11 to 6.5∕11), 13.71 % of area belonged to the high hazard class (P(S) from 6.5∕11 to 8.0∕11), and 7.43 % of area belonged to the very high hazard class (P(S) from 8.0∕11 to 11∕11).
Table 1Total estimated hazard (THED) scale for evaluating the susceptibility of an area to landslides across different hazard classes.
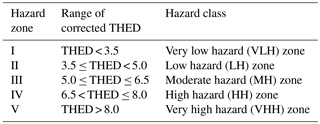
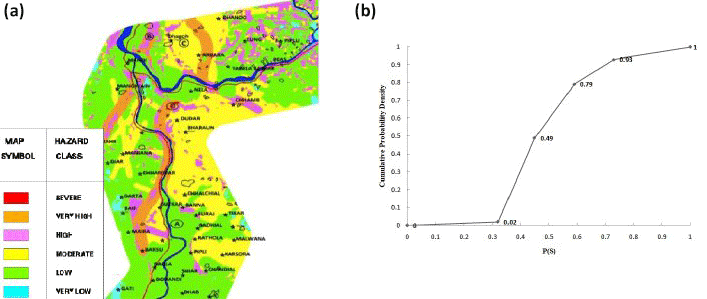
Figure 4(a) Landslide hazard map of study area. (b) The cumulative density function of the spatial probability of landslides (P(S)). The P(S) is shaped by geological and other causative factors in the study area.
In the ILS tool, using Fig. 4b, we used a randomly determined point value of the P(S) from its cumulative density function for each participant in the ILS tool (see Fig. 4b). This P(S) value stayed the same for participants across their performance in the ILS tool. Please note that this exercise was not meant to accurately determine the spatial probability of landslide in the area of interest, where more accurate and advanced methods could be used. Rather, the primary objective of this exercise was to develop an approximate model that could account for the spatial probability in the ILS based upon the LHZ map and THED scale (the ILS tool was primarily meant to improve people's understanding about landslide risks and not for physical modelling of landslides).
3.1.3 Damages due to landslides
As suggested by Chaturvedi et al. (2017), the damages caused by landslides were classified into three independent categories: property loss, injury, and fatality. These categories have their own damage probabilities. When a landslide occurs, it can be harmless or catastrophic. A landslide becomes catastrophic with damage probability value of property loss, injury, and fatality. Thus, once a uniformly distributed random number is less than or equal to the probability of the corresponding damage, the corresponding damage is assumed to occur in the ILS tool. Landslide damages have different effects on the player's wealth and income, where damage to property affects one's property wealth and damages concerning injury and fatality affect one's income level. When the landslide is harmless, then there is no injury, no fatality, and no damages to one's property. For calculation of the damage probabilities due to landslides, data of 371 landslide events in India over a period of about 300 years were used (Parkash, 2011). If we consider the entire 300-year period, then one could expect very different socio-economic conditions to prevail over this period. However, it is to be noted that, in this paper, we vary this probability in the experiment. Thus, the exact value of the probability from the literature is not required in the simulation. The exact assumptions about damages are detailed ahead in this paper.
The ILS tool (Chaturvedi et al., 2017) is a Web-based tool, and it is based upon the ILS model described above. The ILS tool was coded in open-source programming languages PHP and MySQL and is freely available for use at the following URL: https://goo.gl/aRJ7sH, last access: 8 June 2018. The ILS tool allows participants to make repeated monetary investment decisions for landslide risk-mitigation, observe the consequences of their decisions via feedback, and try new investment decisions. This way, ILS helps to improve people's understanding about the causes and consequences of landslides. The ILS tool can run for different time periods, which could be from days to months to years. This feature can be customized in the ILS tool. However, in this paper, we have assumed a daily timescale to make it match the daily probability of landslides computed in Eqs. (4a) and (4b).
The goal in the ILS tool is to maximize one's total wealth, where this wealth is influenced by one's income, property wealth, and losses experienced due to landslides. Landslides and corresponding losses are influenced by physical factors (spatial and temporal probabilities of landslides) and human factors (i.e. the past contributions made by a participant for landslide mitigation). The total wealth may decrease (by damages caused by landslides, like injury, death, and property damage) or increase (due to daily income). While interacting with the tool, the repeated feedback on the positive or negative consequences of their decisions on their income and property wealth enables participants to revise their decisions and learn landslide risks and dynamics over time.
Figure 5 represents the graphical user interface of the ILS tool's investment screen. On this screen, participants are asked to make monetary mitigation decisions up to their daily income upper bound (see panel a). The total wealth is a sum of income not invested for landslide mitigation, property wealth, and total damages due to landslides (see panel b). As shown in panel b, participants are also shown the different probabilities of landslide due to human and physical factors as well as the probability weight used to combine these probabilities into the total probability. Furthermore, as shown in panel c, participants are graphically shown the history of total probability of landslide, total income not invested in landslides, and their remaining property wealth across different days. As part of the instructions, the players are told that the mitigation measures will be taken close to the places where they reside in the district in the ILS tool.
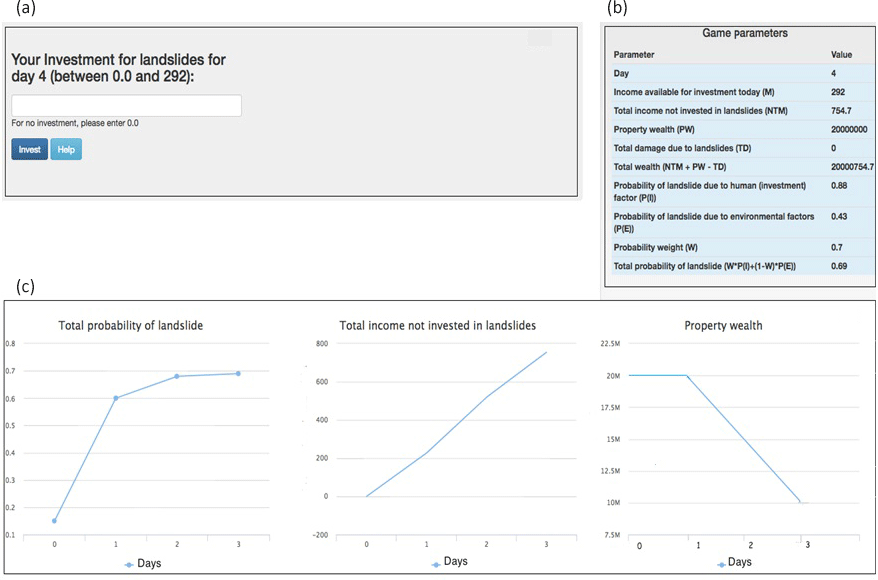
Figure 5The ILS tool's investment screen. (a) The text box where participants made investments against landslides. (b) The tool's different parameters and their values. (c) Line graphs showing the total probability of landslide, the total income not invested in landslides, and the property wealth over days. Horizontal axes in these graphs represents number of days. The goal was to maximize total wealth across a number of days of performance in the ILS tool. This figure is adapted from Chaturvedi et al. (2017).
As described above, participants, i.e. common people residing in the study area, could invest between zero (minimum) and player's current daily income (maximum). Once the investment is made, participants need to click the “invest” button. Upon clicking the invest button, participants enter the experiential feedback screen, where they can observe whether a landslide occurred or not and whether there were changes in the daily income, property wealth, and damages due to the landslide (see Fig. 6). As discussed above, the landslide occurrence was determined by the comparison of a uniformly distributed random number in [0, 1] with P(T). If a uniformly distributed random number in [0, 1] was less than or equal to P(T), then a landslide occurred; otherwise, the landslide did not occur. Furthermore, if the landslide occurred, then three uniformly distributed random numbers in [0, 1] were compared with the probability of injury, fatality, and property damage. If the values of any of these random numbers were less than or equal to the corresponding injury, fatality, or property-damage probabilities, then the landslide was catastrophic (i.e. causing injury, fatality, or property damage; all three events could occur simultaneously). In contrast, if the random numbers were more than the corresponding injury, fatality, or property-damage probabilities, then the landslide was harmless (i.e. it did not cause injury, fatality, and property damage). As shown in Fig. 6a, feedback information is presented in three formats: monetary information about total wealth, messages about different losses, and imagery corresponding to losses. Injury and fatality due to landslides cause a decrease in the daily income, and damage to property causes a loss of property wealth (the exact loss proportions are detailed ahead). If a landslide does not occur in a certain trial, a positive feedback screen is shown to the decision maker (see Fig. 6b). The user can get back to the investment decision screen by clicking on the “return to game” button on the feedback screen.
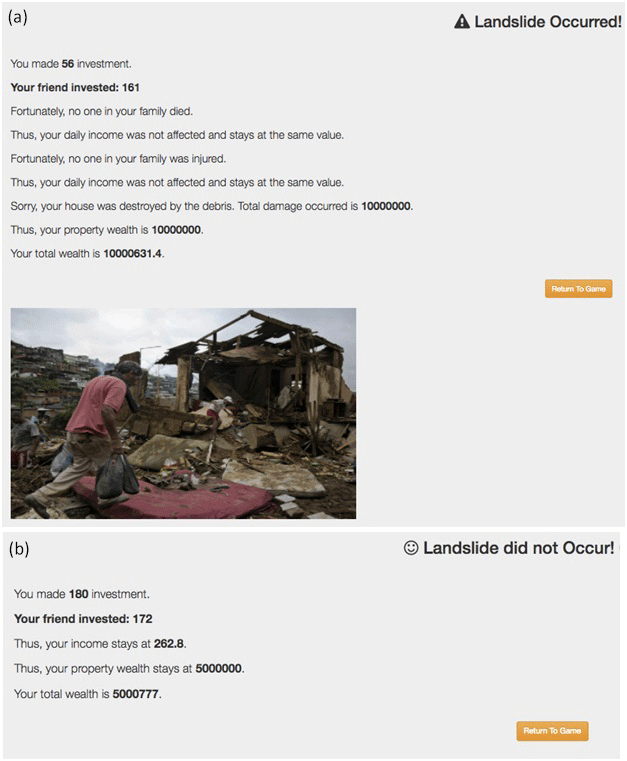
Figure 6The ILS tool's feedback screens. (a) Negative feedback when a landslide occurred, with the loss in terms of magnitude and messages, as well as associated imagery. (b) Positive feedback when a landslide did not occur.
To test the effectiveness of strength and availability of feedback, we performed a laboratory experiment involving human participants where we compared performance in the ILS tool in the presence or absence of experiential feedback about different damage probabilities. Based upon the prior literature (Baumeister et al., 2007; Dutt and Gonzalez, 2012; Finucane et al., 2000; Knutti, 2005; Reis and Judd, 2013; Wagner, 2007), we expected the proportion of investments to be higher in the presence of experiential feedback compared to those in the absence of experiential feedback. Furthermore, we expected higher investments against landslides when feedback was more damaging in ILS compared to when it was less damaging (Chaturvedi et al., 2017; Dutt and Gonzalez, 2011; Gonzalez and Dutt, 2011a).
5.1 Experimental design
Eighty-three participants were randomly assigned across four between-subject conditions in the ILS tool, where the conditions differed in the strength of experiential feedback (high damage (N= 40) or low damage (N= 43)) and availability of feedback (feedback present (N= 43) or feedback absent (N= 40)) provided after every mitigation decision. An experiment involving high-damage, feedback-present conditions (N= 20) and low-damage, feedback-present conditions (N= 23) in the ILS tool was reported by Chaturvedi et al. (2017). These data have been included in this paper with two more conditions: the high damage with feedback absent (N= 20) and low damage with feedback absent (N= 20). Data in all four conditions were collected simultaneously. They were asked to invest repeatedly against landslides over 30 days. In feedback-present conditions, participants made investment decisions on the investment screen, and then they received feedback about the occurrence of landslides or not on the feedback screen. Participants were also provided graphical displays showing the total probability of landslides, the total income not invested in landslides, and the property wealth over days. Figures 5 and 6 show the investment screen and feedback screen that were shown to participants in the feedback-present conditions. In feedback-absent conditions, participants were given a text description, and they made an investment decision; however, they were shown neither the feedback screen nor the graphical displays on the investment screen. Thus, in the feedback-absent conditions, although participants were provided with the probability of damages due to landslides and the results of 0 and 100 % investments as a text description, they were not shown the feedback screen or the graphical displays on the investment screen. The text description and investment screen shown to participants in the feedback-absent conditions is given as Appendix A. In high-damage conditions, the probability of property damage, fatality, and injury in any trial were set at 30, 9, and 90 %, respectively, over 30 days. In low-damage conditions, the probability of property damage, fatality and injury in any trial were set at 3, 1, and 10 %, respectively, over 30 days (i.e. about 1∕10th of its values in the high-damage conditions). Across all conditions, participants made one investment decision per trial over 30 days (this end point was unknown to participants). Participants' goal was to maximize their total wealth over 30 days. Across all conditions, only one landslide could occur on a particular day. The nature of functional forms used for calculating different probabilities in ILS was unknown to participants.
The proportion of damage (in terms of daily income and property wealth) that occurred in the event of fatality, injury, or property damage was kept constant over 30 days. The property wealth decreased to half of its value every time property damage occurred in the event of a landslide. The daily income was reduced by 10 % of its latest value due to a landslide-induced injury and 20 % of its latest value due to a landslide-induced fatality. The initial property wealth was fixed to EC 20 million, which is the expected property wealth in the Mandi area. To avoid the effects of currency units on people's decisions, we converted Indian National Rupees (INR) to a fictitious currency called “Electronic Currency (EC)”, where EC 1 = INR 1. The initial per-trial income was kept at EC 292 (taking into account the GDP and per-capita income of Himachal state, where Mandi is located). Overall, there was a large difference between the initial income earned by a participant and the participant's initial property wealth. In this scenario, the optimal strategy dictates that participants invest their entire income in landslide protection measures, since participants' goal was to maximize total wealth. The weight (W) parameter in Eq. (1) of the ILS model was fixed at 0.7 across all conditions. This high value of the W parameter ensured that participants' investment decisions played a dominant role in influencing the total landslide probability as per Eq. (1). To understand the effect of the W parameter on the total probability of landslide in ILS, a Monte Carlo simulation was performed in the ILS model for different investment conditions over time (see Fig. 7a and b). It can be seen from both Figs. 7a and b, in both the extreme investment conditions over 30 days (i.e. zero investments and full investments from human players), that the value of W determined the range of possible values of the total probability of landslides, P(T). For example, with a W = 1.0, zero human investments over a 30-day period caused P(T)= 1.0 (a sure landslide) and full investments caused P(T) ∼ 0.20 (landslides have a 20 % likelihood of occurring). Thus, by keeping a higher W value, we could ensure that there was a large possible change in the P(T) due to human actions, giving human participants salient feedback on how their decisions changed P(T). The W value was set to be 0.70 in the ILS tool, and it was shown to participants through the investment screen on the ILS tool's interface (see Fig. 5). Furthermore, the free return-to-mitigation parameter (M) was set at 0.8. Again the value of the M parameter ensured that probability of landslides reduced to 20 % ( from Eq. 2) when participants invested their daily income in full. Participants took part in the ILS for 30 days, starting in mid-July and ending in mid-August. This period coincided with the period of heavy monsoon rainfall in the Mandi area (see the P(R) peaks in Fig. 3). Thus, participants performing in ILS experienced an increasing probability of landslides due to environmental factors (due to an increasing amount of rainfall over days). We used the investment ratio as a dependent variable for the purpose of data analyses. The investment ratio was defined as the ratio of investment made in a trial to total investment that could have been made up to the same trial. This investment ratio was averaged across all participants in one case and averaged over all participants and days in another case. We expected the average investment ratio to be higher in the feedback-present and high-damage conditions compared to feedback-absent and low-damage conditions. We took the alpha level (the probability of rejecting the null hypothesis when it is true) to be 0.05 (or 5 %).
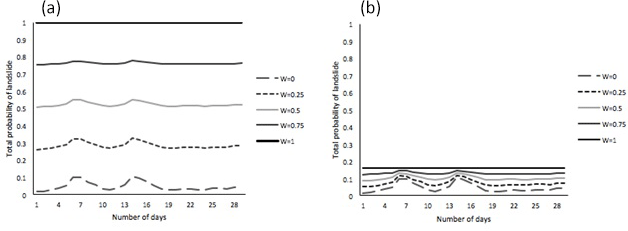
Figure 7Simulation of total probability of landslides in ILS for different values of W in zero-investment scenario (a) and full-investment scenario (b).
5.2 Participants
Participants were recruited from Mandi via an online advertisement. The research was approved by the Ethics Committee at the Indian Institute of Technology Mandi. Informed consent was obtained from each participant, and participation was completely voluntary. All participants were from science, technology, engineering, and mathematics (STEM) backgrounds, and their ages ranged between 21 and 28 years (mean = 22 years; standard deviation = 2.19 years). The following percentage of participants were pursuing or had completed different degrees: 6.0 % high school degrees; 54.3 %, undergraduate degrees; 33.7 %, master's degrees; and 6.0 %, PhD degrees. The Mandi area is prone to landslides, and most participants self-reported to be knowledgeable or possess basic understanding about landslides. The literacy rate in Mandi and the surrounding area is quite high (81.5 %) (Census, 2011), and our sample was representative of the population residing in this area. When asked about their previous knowledge about landslides, 2.4 % claimed to be highly knowledgeable, 16.8 % claimed to be knowledgeable, 57.8 % claimed to have basic understanding, 18.2 % claimed to have little understanding, and 4.8 % claimed to have no idea. All participants received a base payment of INR 50 (∼ USD 1). In addition, there was a performance incentive based upon a lucky draw. The top-10-performing participants based upon total wealth remaining at the end of the study were put in a lucky draw, and one of the participants was randomly selected and awarded a cash prize of INR 500. Participants were told about this performance incentive before they started the experiment.
5.3 Procedure
Experimental sessions were about 30 min long per participant. Participants were given instructions on the computer screen and were encouraged to ask questions before starting their study (see Appendix A for text of instructions used). Once participants had finished their study, they were asked questions related to what information and decision strategy they used on the investment screen and the feedback screen to make their decisions. Once participants ended their study, they were thanked and paid for their participation.
6.1 Investment ratio across conditions
The data were subjected to a 2 × 2 repeated-measures analysis of variance. As shown in Fig. 8a, there was a significant main effect of feedback's availability: the average investment ratio was higher in feedback-present conditions (0.53) compared to that in feedback-absent conditions (0.37) (F(1,79) = 8.86, p < 0.01, η2= 0.10). We performed analysis of variance statistical tests for evaluating our expectations. The F statistics are the ratio of between-group variance and within-group variance. The numbers in brackets after the F statistics are the degrees of freedom (K−1, N−K), where K is the total number of groups compared and N is the overall sample size. The p value indicates the evidence in favour of the null hypothesis when it is true. We reject the null hypothesis when the p value is less than the alpha level (0.05). The η2 is the proportion of variance associated with one or more main effects. It is a number between 0 and 1; a value of 0.02, 0.13, and 0.26 measures a small, medium, or large correlation, respectively, between the dependent and independent variables given a population size. The bracketed values are indicative of the F value, its significance and the size of its effect. This result is as per our expectation and shows that the presence of experiential feedback in the ILS tool helped participants increase their investments against landslides compared to investments in the absence of this feedback.
As shown in Fig. 8b, there was a significant main effect of strength of feedback: the average investment ratio was significantly higher in high-damage conditions (0.51) compared to that in low-damage conditions (0.38) (F(1,79) = 5.46, p < 0.05, η2= 0.07). Again, this result is as per our expectation and shows that high-damage feedback helped participants increase their investments against landslides compared low-damage feedback.
Furthermore, as shown in Fig. 8c, the interaction between the strength of feedback and feedback's availability was significant (F(1,79) = 8.98, p < 0.01, η2= 0.10). There was no difference in the investment ratio between the high-damage conditions (0.35) and low-damage conditions (0.38) when experiential feedback in ILS was absent; however, the investment ratio was much higher in the high-damage conditions (0.67) than in the low-damage conditions (0.38) when experiential feedback in ILS was present (Chaturvedi et al., 2017). Thus, feedback needed to be damaging in ILS to cause an increase in investments in mitigation measures against landslides.
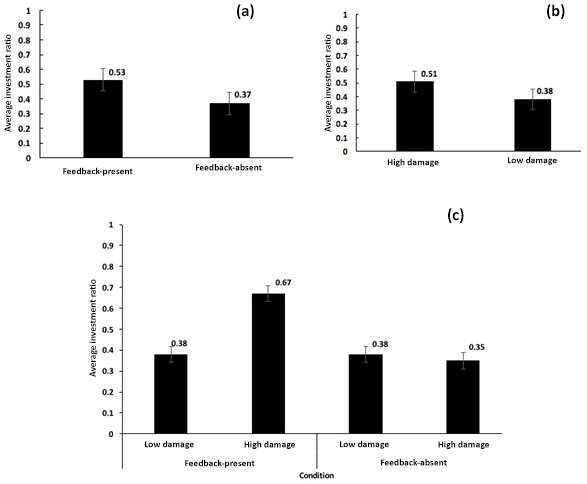
Figure 8(a) Average investment ratio in feedback-present and feedback-absent conditions. (b) Average investment ratio in low- and high-damage conditions. (c) Average investment ratio in low- and high-damage conditions with feedback present and absent. The error bars show 95 % confidence interval (CI) around the point estimate.
6.2 Investment ratio over days
The average investment ratio increased significantly over 30 days (see Fig. 9a; F(8.18,646.1) = 8.35, p < 0.001, η2= 0.10). As shown in Fig. 9b, the average investment ratio increased rapidly over 30 days in feedback-present conditions; however, the increase was marginal in feedback-absent conditions (F(8.18,646.1) = 3.98, p < 0.001, η2= 0.05). Furthermore, in feedback-present conditions, the average investment ratio increased rapidly over 30 days in high-damage conditions; however, the increase was again marginal in the low-damage conditions (see Fig. 9c; F(8.18,646.1) = 6.56, p < 0.001, η2= 0.08). Lastly, as seen in Fig. 9d, although there were differences in the increase in average investment ratio between low-damage and high-damage conditions when experiential feedback was present, such differences were non-existent between the two damage conditions when experiential feedback was absent (F(8.18,646.1) = 4.16, p < 0.001, η2= 0.05). Overall, ILS performance helped participants increase their investments for mitigating landslides when damage feedback was high compared to low in ILS.
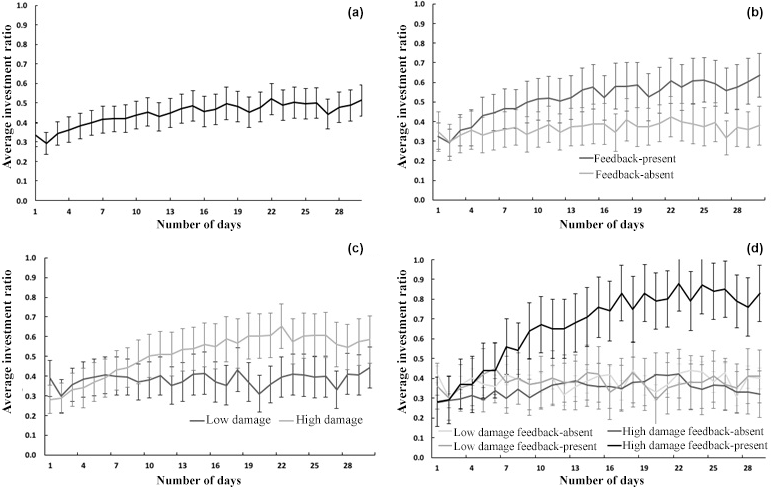
Figure 9(a) Average investment ratio over days. (b) Average investment ratio over days in feedback-present and feedback-absent conditions. (c) Average investment ratio over days in low- and high-damage conditions. (d) Average investment ratio over days in low- and high- damage conditions with feedback present or absent. The error bars show 95 % CI around the point estimate.
However, in feedback's absence in ILS, participants did not increase their investments for mitigating landslides, even when damages were high compared to low.
6.3 Participant strategies
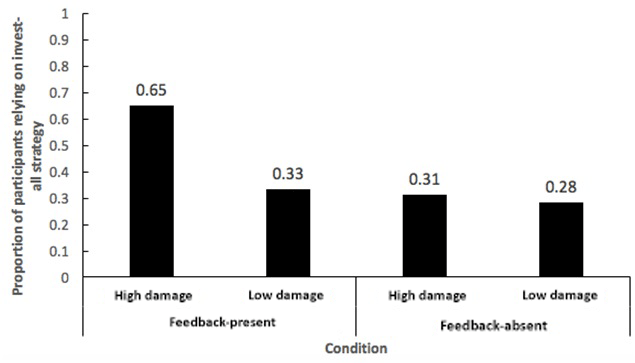
We analysed whether an “invest-all” strategy (i.e. investing the entire daily income in mitigating landslides) was reported by participants across different conditions. As mentioned above, the invest-all strategy was an optimal strategy, and this strategy's use indicated learning in the ILS tool. Figure 10 shows the proportion of participants reporting the use of the invest-all strategy. Thus, many participants learnt to follow the invest-all strategy in conditions where experiential feedback was present and damage was high, as opposed to participants in the other conditions.
In this paper, we used an existing ILS tool for evaluating the effectiveness of feedback in influencing people's decisions against landslide risks. We used the ILS tool in an experiment involving human participants and tested how the strength and availability of experiential feedback in ILS helped increase people's investment decisions against landslides. Our results agree with our expectations: experience gained in ILS enabled improved understanding of processes governing landslides and helped participants improve their investments against landslides.
First, the high-damage feedback helped increase people's investments against landslides over time compared to the low-damage feedback. Furthermore, the feedback's presence helped participants increase their investments against landslides over time compared to feedback's absence. These results can be explained by the previous lab-based research on use of repeated feedback or experience (Chaturvedi et al., 2017; Dutt and Gonzalez, 2010, 2011; Finucane et al., 2000; Gonzalez and Dutt, 2011a). Repeated experiential feedback likely enables learning by repeated trial-and-error procedures, where bounded-rational individuals (Simon, 1959) try different investment values in ILS and observe their effects on the occurrence of landslides and their associated consequences. The negative consequences due to landslides are higher in conditions where the damages are more compared to conditions where the damages are less. This difference in landslide consequences influences participants' investments against landslides. According to Slovic et al. (2005), loss-averse individuals tend to increase their contribution against a risk over time. In our case, similar to Slovic et al. (2005), participants started contributing slowly against landslides and, with the experience of landslide losses over time, they started contributing larger amounts to reduce landslide risks.
We also found that the reliance on invest-all strategy was higher in the high-damage and feedback-present conditions than in the low-damage and feedback-absent conditions. The invest-all strategy was the optimal strategy in the ILS tool. This result shows that participants learned the underlying system dynamics (i.e. how their actions influenced the probability of landslides) in ILS better in the feedback-rich conditions compared to the feedback-poor conditions. As participants were not provided with exact equations governing the ILS tool and they had to only learn from trial-and-error feedback, the saliency of the feedback due to messages and images likely helped participants' learning in the tool. In fact, we observed that the use of the optimal invest-all strategy was maximized when the experiential feedback was highly damaging. One likely reason for this observation could be the high educational levels of participants residing in the study area, where the literacy rate was more than 80 %. Thus, it seems that participants' education levels helped them make the best use of damaging feedback.
We believe that the ILS tool can be integrated in teaching courses on sustainable landslide practices in schools from kindergarten to standard 12th. These courses could make use of the ILS tool and focus on educating students about causes, consequences, and risks of hazardous landslides. We believe that the use of the ILS tool will make teaching more effective as ILS will help incorporate experiential feedback and other factors in teaching in interactive ways. The ILS tool's parameter settings could be customized to a certain geographical area over a certain time period of play. In addition, the ILS tool could be used to show participants the investment actions of other participants (e.g. society or neighbours). The presence of investment decisions of opponents in addition to one's own decisions will likely enable social norms to influence people's investments and learning in the tool (Schultz et al., 2007). These features make the ILS tool very attractive for landslide education in communities in the future.
Furthermore, the ILS tool holds a great promise for policy research against landslides. For example, in future, researchers may vary different system-response parameters in ILS (e.g. weight of one's decisions and return to mitigation actions) and feedback (e.g. numbers, text messages and images for damage) in order to study their effects on people's decisions against landslides. Here, researchers could evaluate differences in ILS's ability to increase public contributions in the face of other system-response parameters and feedback. In addition, researchers can use the ILS tool to do “what-if” analyses related to landslides for certain time periods and for certain geographical locations. The ILS tool has the ability to be customized to a certain geographical area as well as certain time periods, where spatial parameters (e.g. soil type and geology) as well as temporal parameters (e.g. daily rainfall) can be defined for the study area. Once the environmental factors have been accounted for, the ILS tool enables researchers to account for assumptions on human factors (contribution against landslides) with real-world consequences (injury, fatality, and infrastructure damage). Such assumptions may help researchers model human decisions in computational cognitive models, which are based upon influential theories of how people make decisions from feedback (Dutt and Gonzalez, 2012; Gonzalez and Dutt, 2011b). In summary, these features make the ILS tool apt for policy research, especially for areas that are prone to landslides. This research will also help test the ILS tool and its applicability in different real-world settings.
Although the ILS tool causes the use of optimal invest-all strategies among people in conditions where experiential feedback is highly damaging, more research is needed on investigating the nature of learning that the tool imparts among people. As people's investments for mitigating landslides in ILS directly influences the risk of landslides due to human and environmental factors, investments indeed have the potential of educating people about landslide risks. Still, it is important to investigate how investing money in the ILS tool truly educates people about landslides. We would like to investigate this research question as part of our future research.
Currently, in the ILS model, we have assumed that damages from fatality and injury to influence participants' daily-income levels. The reduced income levels do create adverse consequences, but one could also argue that they would be much less of concern for most people compared to the injury and fatality itself. Furthermore, people could also choose to migrate from an area when the landslide mitigation costs are too high, and adaptation becomes impossible, especially due to the differences between the landslide hazard and other hazards such as flood, drought, and general climate risks. As part of our future research, we plan to investigate the influence of feedback that causes only injuries or fatalities in ILS compared to the feedback that causes economic losses due to injuries and fatalities. Also, as part of our future research in the ILS tool, we plan to investigate people's migration decisions when the landslide mitigation costs are too high and adaptation to landslides is not possible.
In this paper, our primary objective was not to accurately predict rainfall or other landslide parameters; rather, it was to educate people about landslide disasters. Thus, we have used approximate models of real landslide phenomena in the ILS simulation tool. The use of approximate models is in line with a large body of literature on using simulation tools for improving people's understanding about natural processes like climate change and other natural disasters (Dutt and Gonzalez, 2010, 2011; Finucane et al., 2000). As part of our abstraction, we may have missed certain aspects related to the sensitivity of the different social classes to their economic and cultural resources. In future, we would like to compare the proportion of investments in different experimental conditions to people's likely socio-economic cost thresholds given that people may need to spend their wealth in other areas beyond landslide mitigation.
Furthermore, we used a linear model to compute the probability of landslides due to human factors in the ILS tool. Also, the probabilistic equations governing the physical factors in the ILS model were not disclosed to participants, who seemed to possess high education levels. One could argue that there are several other linear and non-linear models that could help compute the probability of landslides due to human factors. Some of these models may also influence the probability of landslides and the severity of consequences (damages) caused by landslides. Also, other more generic models could account for the physical factors in the ILS tool. We plan to try these possibilities as part of our future work in the ILS tool. Specifically, we plan to assume different models of investments in the ILS tool and we plan to test them with participants possessing different education levels.
In the current experiment, we assumed a large disparity between a participant's property wealth and his/her daily income. In addition, as part of the ILS model, we did not consider support from governments or insurance companies against landslide damages. In India, people mostly use their own finances to overcome the challenges put by natural disasters as insurance or other public methods have only shown limited success (ICICI, 2018). However, in certain cases, especially in developing countries, mitigation of landslide risks may often be financed by the government or international agencies. As part of our future work, we plan to extend the ILS model to include assumptions of contributions from government and other international agencies. Such assumptions will help us determine the willingness of common people to contribute against landslide disasters, which is important as the developing world becomes more developed over time.
To test our hypotheses, we presented participants with a high-damage scenario and a low-damage scenario, where the probabilities of property damage, injury, and fatality were high and low, respectively. However, such scenarios may not be realistic, where people may want to migrate from both low- and high-damage areas in even the least developed countries. In future research with ILS, we plan to calibrate the probability of damages, injury, and fatality to realistic values and then test the effectiveness of ILS in improving decision-making.
Furthermore, in our experiment, when a landslide did not occur and experiential feedback was present, people were presented with a smiling face followed by a message. The message and emoticon were provided to connect the cause-and-effect relationships for participants in the ILS tool. However, it could also be that a landslide did not occur in a certain trial due to the stochasticity in the simulation rather than participants' investment actions. Although such situations are possible over shorter time periods, over longer time periods increased investments from people will only reduce the probability of landslides. Also, there is a possibility that the participant demographics in the experiment may not be representative of the study area. Thus, as part of future research, we plan to control the participant sample in different ways and test the effects that demographics have on people's investments.
In this paper, the experiment used a daily investment setting in the ILS tool. However, the ILS tool can easily be customized to different time periods ranging from seconds to minutes, hours, days, months, and years. As part of our future research, we plan to extend the daily assumption by considering people making decisions on longer timescales ranging from months to years. In addition, in the experiment, we assumed a value of 0.7 and 0.8 for the weight (W) and return-to-mitigation (M) parameters, respectively. These W and M values indicated that landslide risks could largely be mitigated by human actions. However, this assumption may not be the case always, especially for mitigation measures like tree plantations. For example, afforestation alone may not help in reducing deep-seated landslides in hilly areas (Forbes, 2013). Thus, it would be worthwhile to investigate, as part of future research, how people's decision-making evolves in conditions where investments likely influence the landslide probability (higher values of W and M parameters) compared to conditions where investments unlikely influence the landslide probability (lower values of W and M parameters). Some of these ideas form the immediate next steps in our ongoing research programme on landslide risk communication.
It can be concluded from this preliminary research that simulation tools like ILS that provide feedback about the outcomes of landslide disasters influence people's investment decisions against landslides. Given our results, we believe that ILS could potentially be used as a landslide-education tool for increasing public understanding about landslides among the adult population.
This work forms a good preliminary example for researchers involved in gamification and participative processes in the case of landslide disasters. However, this research work is preliminary in nature, and we plan to deepen it in the near future. To examine the full potential of ILS in influencing people's perceptions of landslide risk, a lot of experiments manipulating system variables, feedback strengths, and severity of damages need to be conducted on a bigger population across several study areas. Another line of research could be to understand the people's behaviour or decision-making style in landslide scenarios by fitting computational cognitive models to the human data. The ILS tool can also be used by policymakers to do what-if analyses in different scenarios concerning landslides. However, the assumptions in the ILS tool should be evaluated in the study area before it is released for policy research.
Data used in this article have not been deposited to respect the privacy of users. The data can be provided to readers upon request.
Welcome!
You are a resident of Mandi district
of Himachal Pradesh, India, a township in the lap of the Himalayas. You live in
an area that is highly prone to landslides due to a number of environmental
factors (e.g. the prevailing geological conditions and rainfall). During the
monsoon season, due to high intensity and a prolonged period of rainfall, a
number of landslides may occur in the Mandi district. These landslides may
cause fatalities and injuries to you, your family, and your friends who
reside in the same area. In addition, landslides may also damage your
property and cause loss to your property wealth.
This study consists of a task where you will be making repetitive decisions to invest money in order to mitigate landslides. Every trial, you will earn certain money between 0 and 10 points. This money is available to you to invest against landslides. You may invest a certain amount from the money available to you; however, if you do not wish to invest anything, you may invest 0.0 against landslides in a particular trial. Based upon your investment against landslides, you will get feedback on whether a landslide occurred and whether there was an associated loss of life, injury, or property damage (all three events are independent and can occur at the same time).
Your total wealth at any point in the game is the following: sum of the amounts you did not invest against landslides over days + your property wealth – damages to you, your family, your friends, and your property due to landslides. Your property wealth is assumed to be 100 points at the start of the game. The amount of money not invested against landslides increases your total wealth. Your goal is to maximize your total wealth in the game.
Whenever a landslide occurs, if it causes fatality, then your daily earnings will be reduced by 5 % of its present value at that time; if landslide causes injury to someone, then the daily earnings will be reduced by 2.5 % of its present value at that time. Thus, the amount available to you to invest against landslides will reduce with each fatality and injury due to landslides. Furthermore, if a landslide occurs and it causes property damage, then your property wealth will be reduced by 80 % of its present value at that time; however, the money available to you to invest against landslides due to your daily earnings will remain unaffected.
Generally, landslides are triggered by two main factors: environmental factors (e.g. rainfall – outside one's control) and investment factors (money invested against landslides – within one's own control). The total probability of landslide is a weighted average of probability of landslide due to environment factors and probability of landslide due to investment factors. The money you invest against landslides reduces the probability of landslide due to investment factors and also reduces the total probability of landslides. However, the money invested against landslides is lost and cannot become a part of your total wealth.
At the end of the game, we will convert your total wealth into INR and pay you
for your effort. For this conversion, a ratio of 100 total wealth
points to INR 1 will be followed. In addition, you will be paid INR 30
as base payment for your effort in the task. Please remember that your goal
is to maximize your total wealth in the game.
Starting Game Parameters
Your wealth: 20 Million
When a landslide occurs:
If a death occurs, your daily income will be reduced by 50 % of its
current value.
If an injury takes place, your daily income will be reduced by 25 % of
its current value.
If a property damage occurs, your wealth will be reduced by 50 % of your
property wealth.
Best of luck!
AA developed the ILS tool under the guidance of PC and VD. AA and PC collected the data in the study. PC and VD analysed the data and prepared the manuscript. PC and VD revised the manuscript as per referee comments.
The authors declare that they have no conflict of interest.
This article is part of the special issue “Landslide early warning systems: monitoring systems, rainfall thresholds, warning models, performance evaluation and risk perception”. It does not belong to a conference.
This research was partially supported by the following grants to Varun Dutt:
a grant from the Himachal Pradesh State Council for Science, Technology and
Environment (grant number: IITM/HPSCSTE/VD/130); a grant from the National
Disaster Management Authority (grant number: IITM/NDMA/VD/184); and a grant
from the Defence Terrain Research Laboratory, Defence Research and Development
Organization (grant number: IITM/DRDO-DTRL/VD/179). We thank Akanksha Jain
and Sushmita Negi, Centre for Converging Technologies, University of
Rajasthan, India, for providing preliminary support for data collection in
this project. We also thank the anonymous reviewers for their useful comments
and suggestions which contributed to the improvement of the
manuscript.
Edited by: Stefano Luigi
Gariano
Reviewed by: four anonymous referees
Anbalagan, R.: Landslide hazard evaluation and zonation mapping in mountainous terrain, Eng. Geol., 32, 269–277, https://doi.org/10.1016/0013-7952(92)90053-2, 1992.
Baumeister, R., Vohs, K., and Tice, D.: The Strength Model of Self-Control, Curr. Dir. Psychol. Sci., 16, 351–355, https://doi.org/10.1111/j.1467-8721.2007.00534.x, 2007.
Becker, J., Paton, D., Johnston, D., and Ronan, K.: Salient Beliefs About Earthquake Hazards and Household Preparedness, Risk Anal., 33, 1710–1727, https://doi.org/10.1111/risa.12014, 2013.
Bossaerts, P. and Murawski, C.: From behavioural economics to neuroeconomics to decision neuroscience: the ascent of biology in research on human decision making, Curr. Opin. Behav. Sci., 5, 37–42, 2015.
Census (Census2011.co.in): Mandi District Population Census 2011, Himachal Pradesh literacy sex ratio and density, available at: http://www.census2011.co.in/census/district/233-mandi.html (last access: 18 March 2018), 2011.
Chaturvedi, P. and Dutt, V.: Evaluating the Public Perceptions of Landslide Risks in the Himalayan Mandi Town, in: Proceedings of the Human Factors and Ergonomics Society Annual Meeting, Los Angeles, USA, 26–30 October 2015, 1491–1495, 2015.
Chaturvedi, P., Dutt, V., Jaiswal, B., Tyagi, N., Sharma, S., Mishra, S., Dhar, S., and Joglekar, P.: Remote Sensing Based Regional Landslide Risk Assessment, Int. J. Emerg. Tr. Electr. Electron., 10, 135–140, 2014.
Chaturvedi, P., Arora, A., and Dutt, V.: Interactive Landslide Simulator: A Tool for Landslide Risk Assessment and Communication, in: Advances in Applied Digital Human Modeling and Simulation, AISC Reprint Series, 481, Springer, Cham, Switzerland, 231–243, 2017.
Clerici, A., Perego, S., Tellini, C., and Vescovi, P.: A procedure for landslide susceptibility zonation by the conditional analysis method, Geomorphology, 48, 349–364, https://doi.org/10.1016/s0169-555x(02)00079-x, 2002.
Dai, F., Lee, C., and Ngai, Y.: Landslide risk assessment and management: an overview, Eng. Geol., 64, 65–87, https://doi.org/10.1016/s0013-7952(01)00093-x, 2002.
De Martino, B., Kumaran, D., Seymour, B., and Dolan, R. J.: Frames, biases, and rational decision-making in the human brain, 313, 684–687, 2006.
Dutt, V. and Gonzalez, C.: Why Do We Want to Delay Actions on Climate Change? Effects of Probability and Timing of Climate Consequences, J. Behav. Decis. Making, 25, 154–164, https://doi.org/10.1002/bdm.721, 2010.
Dutt, V. and Gonzalez, C.: Human control of climate change, Climatic Change, 111, 497–518, https://doi.org/10.1007/s10584-011-0202-x, 2011.
Dutt, V. and Gonzalez, C.: Decisions from experience reduce misconceptions about climate change, J. Environ. Psych., 32, 19–29, https://doi.org/10.1016/j.jenvp.2011.10.003, 2012.
Fischer, C.: Feedback on household electricity consumption: a tool for saving energy? Energ. Effic., 1, 79–104, https://doi.org/10.1007/s12053-008-9009-7, 2008.
Finucane, M., Alhakami, A., Slovic, P., and Johnson, S.: The affect heuristic in judgments of risks and benefits, J. Behav. Decis. Making, 13, 1–17, https://doi.org/10.1002/(sici)1099-0771(200001/03)13:1<1::aid-bdm333>3.0.co;2-s, 2000.
Forbes, K. and Broadhead, J.: Forests and landslides: The Role of Trees and Forests in the Prevention of Landslides and Rehabilitation of Landslide-Affected Areas in Asia, Technical Report #2, FAO, Bangkok, Thailand, 2013.
Frodella, W., Salvatici, T., Pazzi, V., Morelli, S., and Fanti, R.: GB-InSAR monitoring of slope deformations in a mountainous area affected by debris flow events, Nat. Hazards Earth Syst. Sci., 17, 1779–1793, https://doi.org/10.5194/nhess-17-1779-2017, 2017.
Gigerenzer, G. and Selten, R. (Eds.): Bounded rationality: The adaptive toolbox, MIT press, Cambridge, MA, 2002.
Glade, T., Anderson, M., and Crozier, M.: Landslide hazard and risk, J. Wiley, Chichester, England, 2005.
Gonzalez, C. and Dutt, V.: A generic dynamic control task for behavioral research and education, Comput. Hum. Behav., 27, 1904–1914, https://doi.org/10.1016/j.chb.2011.04.015, 2011a.
Gonzalez, C. and Dutt, V.: Instance-based learning: Integrating sampling and repeated decisions from experience., Psychol. Rev., 118, 523–551, https://doi.org/10.1037/a0024558, 2011b.
Grasso, V. F. and Singh, A.: Early Warning Systems: State-of-Art Analysis and Future Directions, UNEP, Nairobi, Kenya, In Depth Report, 2009.
Hasson, R., Löfgren, Å., and Visser, M.: Climate change in a public goods game: Investment decision in mitigation versus adaptation, Ecol. Econ., 70, 331–338, https://doi.org/10.1016/j.ecolecon.2010.09.004, 2010.
Himachal (Himachal.nic.in): Compendium of Rules, Instructions and Clarifications relating to Section 118 of the H.P. Tenancy & Land Reforms Act, 1972. available at: http://himachal.nic.in/WriteReadData/l892s/13_l892s/3618435Section118-Compendium.pdf (last access: 18 March 2018), 2012.
Hong, Y., Adler, R., and Huffman, G.: Evaluation of the potential of NASA multi-satellite precipitation analysis in global landslide hazard assessment, Geophys. Res. Lett., 33, L22402, https://doi.org/10.1029/2006GL028010, 2006.
Hpsdma (Hpsdma.nic.in): District Disaster Management Plan-District Mandi, available at: http://hpsdma.nic.in/DisasterManagement/Mandi.pdf (last access: 18 March 2018), 2017.
ICICI (Icicilombard.com): Natural Disasters India, available at: https://www.icicilombard.com/insurance-information/travel-insurance-info/article/worst-natural-disasters-in-recent-times-in-india-and-their-impact (last access: 8 March 2018), 2018.
Intrieri, E., Bardi, F., Fanti, R., Gigli, G., Fidolini, F., Casagli, N., Costanzo, S., Raffo, A., Di Massa, G., Capparelli, G., and Versace, P.: Big data managing in a landslide early warning system: experience from a ground-based interferometric radar application, Nat. Hazards Earth Syst. Sci., 17, 1713–1723, https://doi.org/10.5194/nhess-17-1713-2017, 2017.
Kahlon, S., Chandel, V. B. S., and Brar, K. K.: Landslides in Himalayan mountains: a study of Himachal Pradesh, India, Int. J. IT Eng. Appl. Sci. Res., 3, 28–34, 2014.
Kahneman, D. and Tversky, A.: Prospect theory: An analysis of decisions under risk, Econometrica, 47, 263–292, https://doi.org/10.2307/1914185, 1979.
Knutti, R.: Probabilistic climate change projections for CO2 stabilization profiles, Geophys. Res. Lett., 32, L20707, https://doi.org/10.1029/2005gl023294, 2005.
Margottini, C., Canuti, P., and Sassa, K. (Eds.): Landslide Science and Practice, 1st edition, Springer-Verlag Berlin Heidelberg, Germany, 685 pp., 2011.
Mathew, J., Babu, D. G., Kundu, S., Kumar, K. V., and Pant, C. C.: Integrating intensity–duration-based rainfall threshold and antecedent rainfall-based probability estimate towards generating early warning for rainfall-induced landslides in parts of the Garhwal Himalaya, India, Landslides, 11, 575–588, https://doi.org/10.1007/s10346-013-0408-2, 2013.
Meissen, U. and Voisard, A.: Increasing the Effectiveness of Early Warning via Context-aware Alerting, in: Proceedings of the 5th International Information Systems for Crisis Response and Management Conference, Washington, USA, 431–440, 2008.
Montrasio, L., Valentino, R., and Losi, G. L.: Towards a real-time susceptibility assessment of rainfall-induced shallow landslides on a regional scale, Nat. Hazards Earth Syst. Sci., 11, 1927–1947, https://doi.org/10.5194/nhess-11-1927-2011, 2011.
Osuret, J., Atuyambe, L. M., Mayega, R. W., Ssentongo, J., Tumuhamye, N., Bua, G. M., Tuhebwe, D., and Bazeyo, W.: Coping Strategies for Landslide and Flood Disasters: A Qualitative Study of Mt. Elgon Region, Uganda, PLoS Currents, 8, 1, https://doi.org/10.1371/currents.dis.4250a225860babf3601a18e33e172d8b, 2016.
Oven, K.: Landscape, Livelihoods and Risk: community vulnerability to landslides in Nepal, PhD Thesis, Durham University, Durham, UK, 2009.
Parkash, S.: Historical records of socio-economically significant landslides in India, J. South Asia Disaster Studies, 4, 177–204, 2011.
Patra, P. and Devi, R.: Assessment, prevention and mitigation of landslide hazard in the Lesser Himalaya of Himachal Pradesh, Environmental & Socio-economic Studies, 3, 1–11, 2015.
Quansah, J. E., Engel, B., and Rochon, G. L.: Early warning systems: a review, Journal of Terrestrial Observation, 2, 5, https://docs.lib.purdue.edu/jto/vol2/iss2/art5, 2010.
Reder, A., Rianna, G., and Pagano, L.: Physically based approaches incorporating evaporation for early warning predictions of rainfall-induced landslides, Nat. Hazards Earth Syst. Sci., 18, 613–631, https://doi.org/10.5194/nhess-18-613-2018, 2018.
Reis, H. and Judd, C.: of research methods in social and personality psychology, Cambridge University Press, Handbook New York, USA, 2013.
Rogers, D. and Tsirkunov, V.: Implementing Hazard Early Warning Systems, Global Facility for Disaster Reduction and Recovery, Tokyo, Japan, Open File Rep. 11-03, 47 pp., 2011.
Schultz, P. W., Nolan, J. M., Cialdini, R. B., Goldstein, N. J., and Griskevicius, V.: The Constructive, Destructive, and Reconstructive Power of Social Norms, Psychol. Sci., 18, 429–434, https://doi.org/10.1111/j.1467-9280.2007.01917.x, 2007.
Segoni, S., Rosi, A., Lagomarsino, D., Fanti, R., and Casagli, N.: Brief communication: Using averaged soil moisture estimates to improve the performances of a regional-scale landslide early warning system, Nat. Hazards Earth Syst. Sci., 18, 807–812, https://doi.org/10.5194/nhess-18-807-2018, 2018.
Simon, H. A.: Theories of decision-making in economics and behavioral science, Am. Econ. Rev., 49, 253–283, 1959.
Slovic, P., Peters, E., Finucane, M. L., and MacGregor, D. G.: Affect, Risk, and Decision Making, Health Psychol., 24, S35–S40, 2005.
Thaler, R. H. and Sunstein, C. R.: Nudge. Improving Decisions About Health, Wealth, and Happiness, Yale University Press, New Haven, USA, 2008.
Tversky, A. and Kahneman, D.: Advances in prospect theory: Cumulative representation of uncertainty, J. Risk uncertainty, 5, 297–323, 1992.
Vaz, T., Zêzere, J. L., Pereira, S., Oliveira, S. C., Garcia, R. A. C., and Quaresma, I.: Regional rainfall thresholds for landslide occurrence using a centenary database, Nat. Hazards Earth Syst. Sci., 18, 1037–1054, https://doi.org/10.5194/nhess-18-1037-2018, 2018.
von Neumann, J. and Morgenstern, O.: Theory of games and economic behavior, 2nd ed., Princeton, NJ, Princeton University Press, 1947.
Wagner, K.: Mental Models of Flash Floods and Landslides, Risk Anal., 27, 671–682, https://doi.org/10.1111/j.1539-6924.2007.00916.x, 2007.
Wanasolo, I.: Assessing and mapping people's perceptions of vulnerability to landslides in Bududa, Uganda, M. Phil. Thesis, The Norwegian University of Science and Technology, Trondheim, Norway, 21–30, 2012.
Webb, M. and Ronan, K. R.: Interactive Hazards Education Program for Youth in a Low SES Community: A Quasi-Experimental Pilot Study, Risk Anal., 34, 1882–1893, https://doi.org/10.1111/risa.12217, 2014.
- Abstract
- Introduction
- Study area
- Computational model of landslide risk
- Interactive Landslide Simulator (ILS) tool
- Methods
- Results
- Discussion
- Limitations
- Conclusions
- Data availability
- Appendix A: Instructions of the experiment
- Author contributions
- Competing interests
- Special issue statement
- Acknowledgements
- References