the Creative Commons Attribution 4.0 License.
the Creative Commons Attribution 4.0 License.
 | 23 Aug 2018
Upgrading of an index-oriented methodology for consequence analysis of natural hazards: application to the Upper Guil catchment (southern French Alps)
Anne Puissant
Constance Dujarric
Gilles Arnaud-Fassetta
Vulnerability is a complex concept involving a variety of disciplines from both the physical and socio-economic sciences. Currently, two opposite trends exist: the physical approach in which vulnerability is analysed as a sum of potential impacts on elements at risk and the social approach in which vulnerability is mostly viewed as a combination of socio-economic variables determining people's ability to anticipate, cope with and recover from a catastrophic event. Finding a way to combine these two approaches is a key issue for a global vulnerability assessment. In this paper we propose to combine elements from these two approaches through the analysis of the potential consequences of a high-magnitude flood event (recurrence interval (RI) > 100 years) on human and material stakeholders. To perform our analysis, we choose to upgrade an existing index, the Potential Damage Index (PDI; Puissant et al., 2013), by including social criteria. The PDI was originally developed to assess the physical consequences of hazards on the elements at risk (people, building and lands). It is based on the calculation of three sub-indices representing different types of direct and indirect consequences: physical injury consequences (PIC), structural and functional consequences (SFC), indirect functional consequences (IC). Here, we propose to add a fourth sub-index representing the social consequences. This new sub-index, called social consequences (SC) is obtained by combining criteria derived from INSEE French census data and a risk-perception survey conducted in the field. By combining the four indices (PIC, SFC, IC and SC), we managed to create a new index called the Potential Consequences Index (PCI). The new PCI was tested on the Upper Guil catchment to assess the consequences of a high-magnitude flood event (RI > 100 years). Results of the PDI were compared with the PCI and show significant differences. The upgrade to the PDI method provided us with many inputs. The introduction of elements from social vulnerability added an extra dimension to the total consequence map. It allowed us to qualify the potential physical consequences (physical injury, structural and functional consequences) on elements at risk by considering the global resilience of local communities.
- Article
(5153 KB) -
Supplement
(791 KB) - BibTeX
- EndNote


In Europe, small Alpine communities are particularly exposed to natural hazards due to characteristics inherent to the physical and the socio-economic environment (Zingari and Fiebiger, 2002). Alpine areas are generally characterised by step gradient, tectonic activity and harsh climates resulting in dynamic gravitational and torrential processes causing hazards (Keiler and Fuchs, 2016; Papathoma-Köhle et al., 2011). They are also characterised by a high level of vulnerability caused by scattered populations and resources (Hewitt and Metha, 2012), limited accessibility (Leone et al., 2014) and strong dependencies to seasonal tourism activities (Elsasser and Bürki, 2002; Muhar et al., 2007). In addition, the lack of building zones leads to a concentration of stakeholders in areas exposed to natural hazards (debris fans, floodplains, unstable terrains, etc.), causing risk (Arnaud-Fassetta et al., 2005; Puissant et al., 2013). For communities with limited resources, risk management leads to important costs and has a significant impact on public opinion (Barroca et al., 2005). As the global climatic and socio-economic environment changes drastically, this concern is increasing (Pachauri et al., 2014; Papathoma-Köhle et al., 2011, 2016; Aitsi-Selmi et al., 2015; Alcántara-Ayala et al., 2015). The alpine environment is, in fact, very sensitive to global changes (IPCC, 2012). The impact of such changes on hazard magnitudes and frequencies will be significant and may increase the probability of occurrence of a catastrophic event (Schoeneich and De Jong, 2008; Keiler et al., 2010; Lafaysse, 2011; IPCC, 2012; Papathoma-Köhle et al., 2016).
However, studies on risk assessment on a regional or local scale are frequently hazard centred. As a consequence, the vulnerability component is often limited (Reghezza, 2006; Reghezza and Rufat, 2015; Zahran et al., 2008; Jeffers, 2013). It is now recognised that risk assessment cannot be reduced by focusing solely on hazards (Birkmann et al., 2013). Vulnerability is also an essential part of the risk assessment (Varnes, 1984; Fuchs et al., 2017). Vulnerability assessment related to natural hazards is a relatively recent research field (Totschnig and Fuchs, 2013). There is still no consensus on a single definition of vulnerability (Fuchs et al., 2007; Birkmann et al., 2013). It is a complex concept involving a variety of disciplines from both the physical and socio-economic sciences (Fuchs, 2007; Fuchs et al., 2009; Birkmann et al., 2013; Papathoma-Köhle et al., 2017). If the number of vulnerability components is also debated (Tapsell et al., 2010; Ciurean et al., 2013), two main research approaches dominate: the “physical approach” and the “social approach”. For environmental researchers and engineers, vulnerability is defined as “a degree of loss to a given element within the area affected by a hazard” (UNDRO, 1984). Vulnerability is considered to be the total potential consequences of a process impacting human interests (Glade, 2003; Fuchs et al., 2007; Puissant et al., 2013). Social scientists define vulnerability as “the characteristics of a person or group in terms of their capacity to anticipate, cope with, resist and recover from impacts of a hazard” (Blaikie et al., 1994; Cutter et al., 2003; Steinführer et al., 2009). It refers to socio-economic and demographic factors that may affect the resilience of communities (Clark et al., 1998; Cutter et al., 2003; Wu et al., 2002; Chakraborty et al., 2005; Flanagan et al., 2012). These two theories must be combined in order to reduce susceptibility to hazard and to create disaster-resilient communities (Fuchs, 2009; Fuchs et al., 2012; Birkmann et al., 2013). Recently, significant efforts were made to combine social and physical vulnerability. For example, Ebert et al. (2009) combined social vulnerability indicators with physical characteristics derived from airborne imagery and GIS data. Armas and Gavris (2013) and Armas et al. (2017) combined social and economic vulnerability with housing quality. Koks et al. (2015) combined hazard and exposure with a social vulnerability index to assess flood risk in the Netherlands. In the same way, Chang et al. (2015) used vulnerability indicators considering the economic, social, built and natural capital. Karagiorgos et al. (2016) used vulnerability function and socio-economic variables to assess physical and social vulnerability of the elements at risk face to a flash-flood event in East Attica, Greece. Eidsvig et al. (2017) used a physical vulnerability indicator together with a social vulnerability indicator to assess the risk induced by natural hazards to infrastructure.
Currently, three different methods are commonly used to assess vulnerability: (1) vulnerability matrices, (2) vulnerability functions and (3) vulnerability indicators (Messner et al., 2007; Papathoma-Köhle et al., 2017). (1) Vulnerability matrices are a qualitative method which provides some advantages. The relationship between the process and consequence is clearly expressed and easy to understand by non-experts. The information on the exact intensity of the processes is not needed and the costs of the exact damages expressed in monetary value are not requested (Fuchs et al., 2007; Papathoma-Köhle et al., 2017). The main default of matrices remains in the description of damages. They may be very subjective, making it difficult to replicate in another sector. By contrast, vulnerability functions (i.e. damage curves and fragility functions), (2) express vulnerability in a quantitative way, by translating damage into monetary value (Fuchs et al., 2007; Messner et al., 2007; Tarbotton et al., 2015). As a result, the vulnerability function allows us to establish a clear relation between financial losses and hazard intensity and perform a cost–benefit analysis (Tarbotton et al., 2015; Papathoma-Köhle et al., 2017). On the other hand, vulnerability functions are dependent on the quality and the quantity of the data collected. They require a large number of the elements at risk to be efficient and they cannot be transferred to areas with different housing types. Last but not least, important characteristics of the elements at risk are not taken into account (Papathoma-Köhle et al., 2017). For Rygel et al. (2006), Birkmann (2006) and Kappes et al. (2012) the more effective way to assess vulnerability is to create an index from a suite of indicators. (3) This approach provides many advantages: it includes the analysis of all the relevant types of consequences without monetary measures (Meyer et al., 2009), no empirical data are needed (Papathoma-Köhle et al., 2017), it considers the different characteristics of the elements at risk (Puissant et al., 2013) and it is flexible enough to be adjusted to different hazards and places (Kappes et al., 2012). Furthermore, the improvement of GIS technology with the ability to integrate information from various fields makes it easy to develop a high-resolution vulnerability index with an operative perspective (Wood and Good, 2004; Nelson et al., 2015).
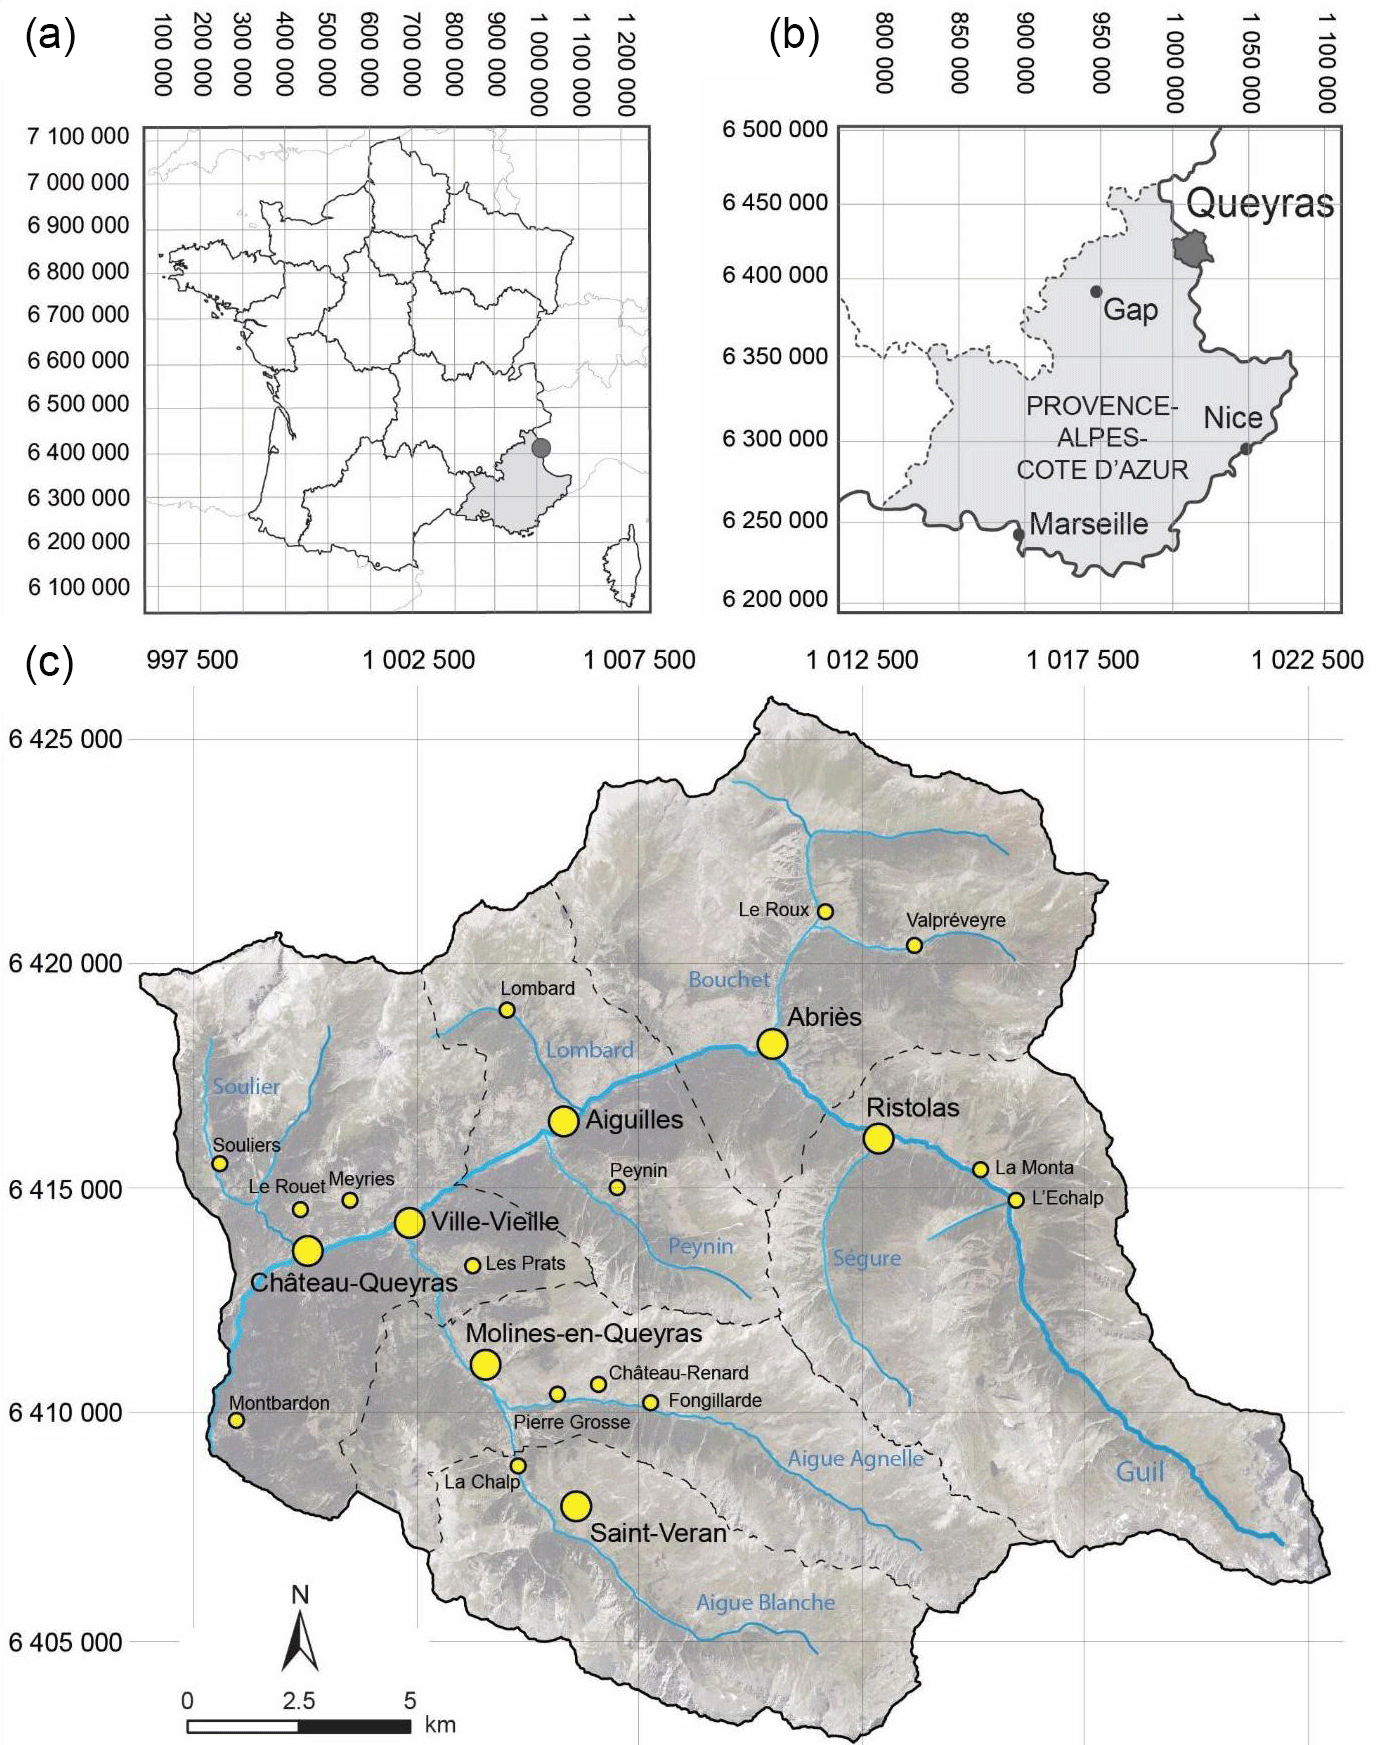
In the context of the French-funded ANR project SAMCO (Society Adaptation for coping with Mountain risks in a global change COntext), a comparative analysis on the topic of mountain risks was engaged on three representative mountain case studies: the Upper Guil catchment (southern French Alps), prone to torrential floods; the Ubaye catchment (southern French Alps), predisposed to landslides; and the Cauterets Valley (French Pyrenees), affected by rockfalls. The aim of the project was to develop methodological tools to characterise and measure societal resilience with an operative perspective (http://www.anr-samco.com/, last access: 1 July 2018, SAMCO ANR project, 2017). In this regard, studies were conducted with consideration to the different steps of risk analysis – i.e. hazard analysis, exposure analysis and consequence analysis (Bründl et al., 2009). The final product of the SAMCO project is a GIS-based demonstration platform for elected officials and local stakeholders. The present paper is focused on a new method that assesses physical and social vulnerability together. This method was developed to assess the vulnerability of elements at risk in the Upper Guil catchment (Fig. 1) in front of a high-magnitude flood event (recurrence interval (RI) > 100 years). To perform this work, we opted for an indicator-based vulnerability approach. The proposed indicator, called the Potential Consequences Index (PCI) is oriented on a potential consequences assessment. According to Fell et al. (2008), consequences may be defined as “the potential outcomes arising from the occurrence of a hazard expressed qualitatively or quantitatively in terms of loss, disadvantage or gain, damage, injury or loss of life”. Consequence analysis is, together with hazard evaluation, one of the major steps of flood risk assessment (Bründl et al., 2009; Kappes et al., 2012; Puissant et al., 2013).
The PCI consists of upgrading an existing index called the Potential Damage Index (PDI). The PDI was developed and improved by Puissant et al. (2006, 2013) to estimate the potential consequences of a natural hazard on elements at risk (building, network and land occupation). It is obtained by combining three indices representing direct physical injury, structural and functional consequences, and indirect consequences – indirect functional consequences – of hazards on the element at risk. These three indices are built with data representing the characteristics of each element at risk (material, age, number of occupied floors, etc.). In the PCI we added a fourth index called Social Consequences Index (SCI) representing the socio-economic consequences of a hazard on the community resilience. SCI variables are derived from French national census data at community level (INSEE) and data from a risk-perception survey conducted in the six municipalities of the Upper Guil catchment (Ristolas, Abriès, Aiguilles, Château-Ville-Vieille, Molines-en-Queyras and Saint-Véran). The PCI is obtained by combining the new Social Consequences Index (SCI) with the Physical Injury Index (PII), the Structural and Functional Index (SFI) and the Indirect Functional Index (IFI) from the PDI. Results obtained for the PCI are then applied to the Upper Guil catchment and compared to those obtained with the PDI.
The area of interest is the Upper Guil catchment, a 366 km2 area covering six small municipalities (<400 inhabitants): Ristolas, Abriès, Aiguilles, Château-Ville-Vieille, Molines-en-Queyras and St-Véran. It broadly corresponds to the historic territory of Queyras, a landlocked area located in the Hautes-Alpes French department, near the Italian border (Fig. 1). The altitude ranges from 1200 m a.s.l. at the outflow of the River Guil to over 3300 m a.s.l. along the highest summits surrounding the catchment.
2.1 Physical context
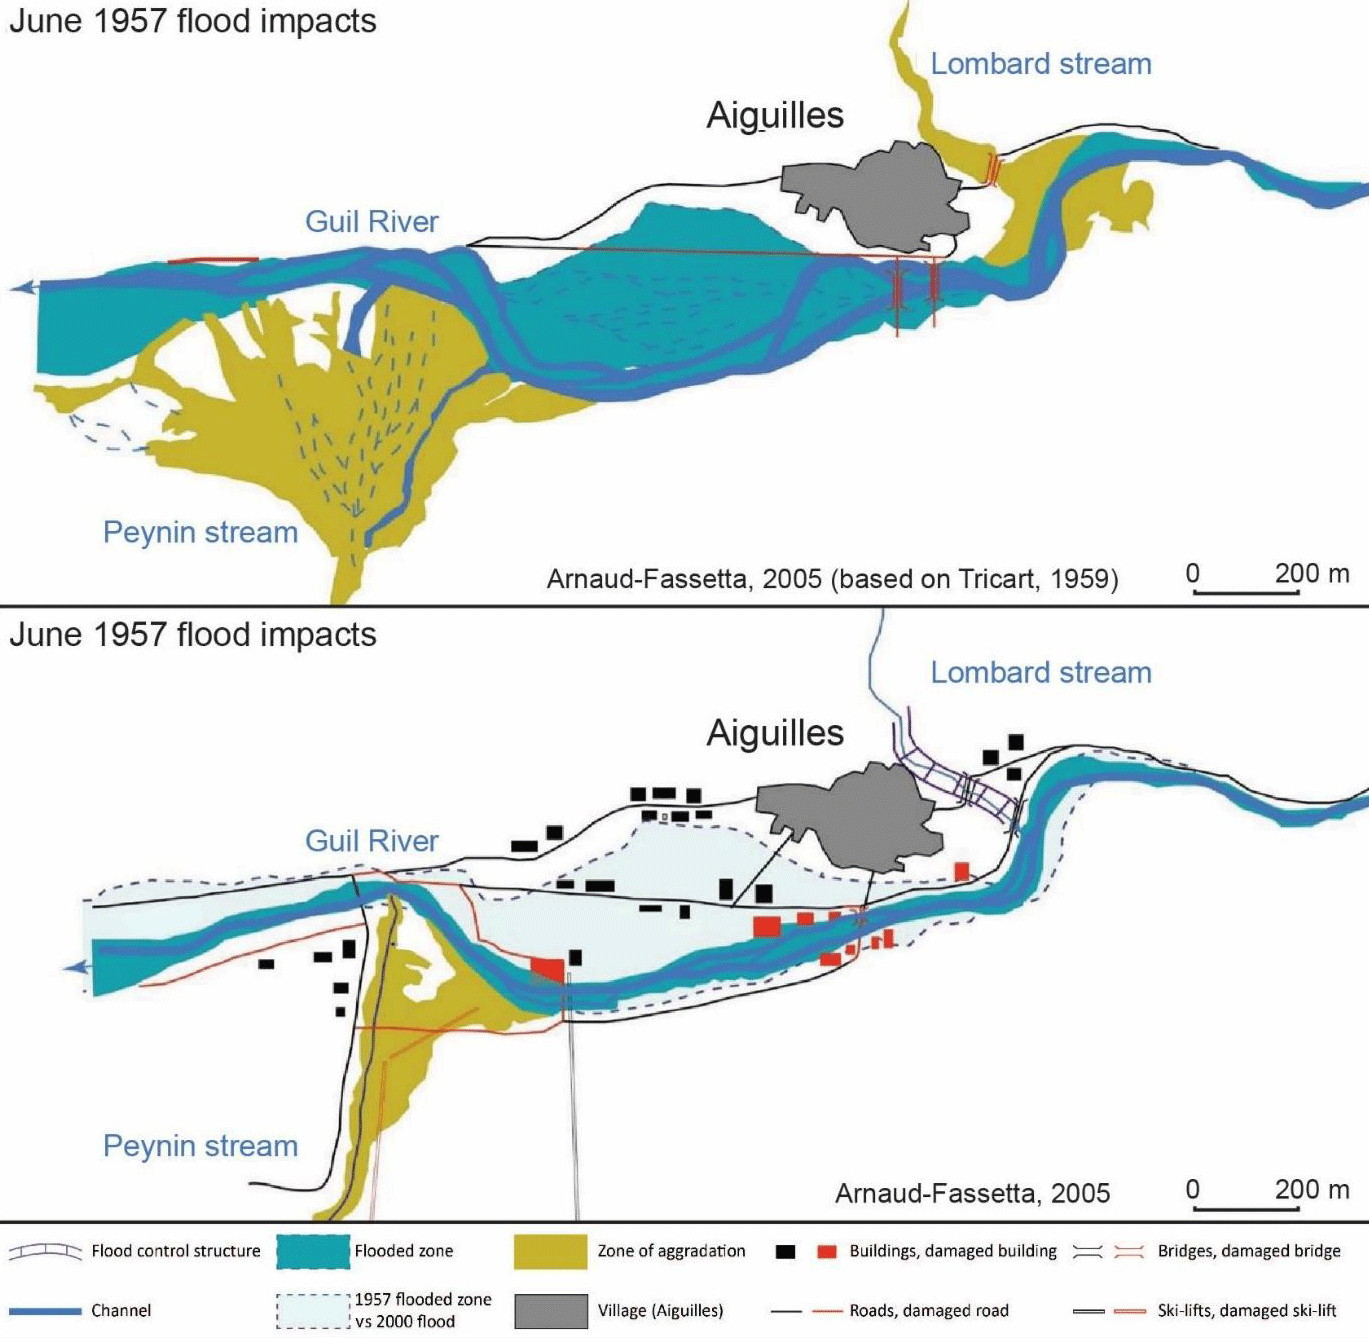
Due to some predisposing (schist bedrock supplying abundant debris, structural opposite slopes, strong hillslope channel connectivity) and triggering (summer and winter Mediterranean rainstorms) factors, the Upper Guil catchment is particularly prone to hydrogeomorphic hazards such as torrential floods, debris flows, landslides, rockfalls or avalanches (Fort et al., 2002, 2014; Arnaud-Fassetta et al., 2004, 2005, 2014). These hazards frequently impact the local population (fatalities, destruction of buildings and infrastructure, loss of agricultural land, road closures) causing difficulties for local managers, who also have to cope with the legislation and management procedures of the Parc Naturel Régional du Queyras (PNRQ) (Arnaud-Fassetta et al., 2004, 2005). Most catastrophic episodes are related to torrential floods as in 1957, 2000, 2002, 2008 and 2011 (PNRQ, 2016). The two main events described in the literature took place in June 1957 (>100 year RI, EUR 15 million damage) and June 2000 (30 year RI, ≈ EUR 5 million damage) (Arnaud-Fassetta et al., 2004; Tricart, 1958). These catastrophic episodes have severely impacted the mentalities and entailed considerable expenses in terms of risk management and protective structures (dykes, embankments, thresholds, etc.) (Fig. 2). Due to the obsolescence of protective measures and local planner requirements in new studies, it was necessary to assess vulnerability in this area.
2.2 Socio-economic context
Today, the area counts 1770 inhabitants (INSEE, 2012), making it one of France's less densely populated districts (<5 inhabitants by km2). However, during the peak of the touristic season (summer and winter holidays), the resident population can be multiplied by a factor of 10 (INSEE, 2008). Since the second half of the 20th century, Alpine territories have experienced significant changes on their land cover/uses and economic activities (Fuchs et al., 2013). In the Queyras, the progressive decline of agro-pastoralism and the development of skiing tourism activities led to a concentration of human stakeholders in areas that are particularly exposed to several natural hazards (torrential fans and valley bottom). The current land cover/use is the result of a combination of these important changes in human activities together with the impacts of past catastrophic events. Actually, land cover classes are 29 % forest, around 30 % bare rocks and alluvial deposits, 38 % grassland, 3 % agricultural lands and less than 1 % building areas. Apart from houses, major stakeholders are public and administrative services (city hall, schools, hospital, fire station, etc.), industrial and artisanal warehouses and, of course, touristic infrastructure (shops, hotels, museum, ski resorts, etc.). The departmental road (D947) is the most important lifeline ensuring the link with the nearest urban centres (Guillestre, Embrun, Gap). These relatively recent stakeholders are mostly located in areas exposed to natural hazards (Arnaud-Fassetta et al., 2004).
Table 1Detail of weights assigned to the criteria used in PDI calculation.
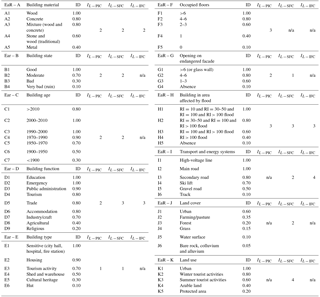
Table 2Matrix used to combine hazard exposure with PDI and PCI.
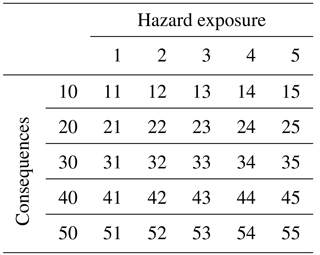
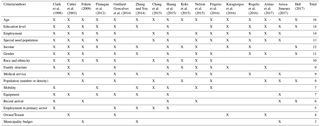
Table 3Synthesis of the criteria usually used for the social vulnerability assessment.
PCI is used to assess the physical and social consequences of a hazard on elements at risk (people, buildings, networks and land cover/uses). It consists of an upgrade of the PDI developed by Puissant et al. (2006, 2013). To better understand the method, we will first describe the PDI methodology and then take a look at the upgrade used to obtain the PCI.
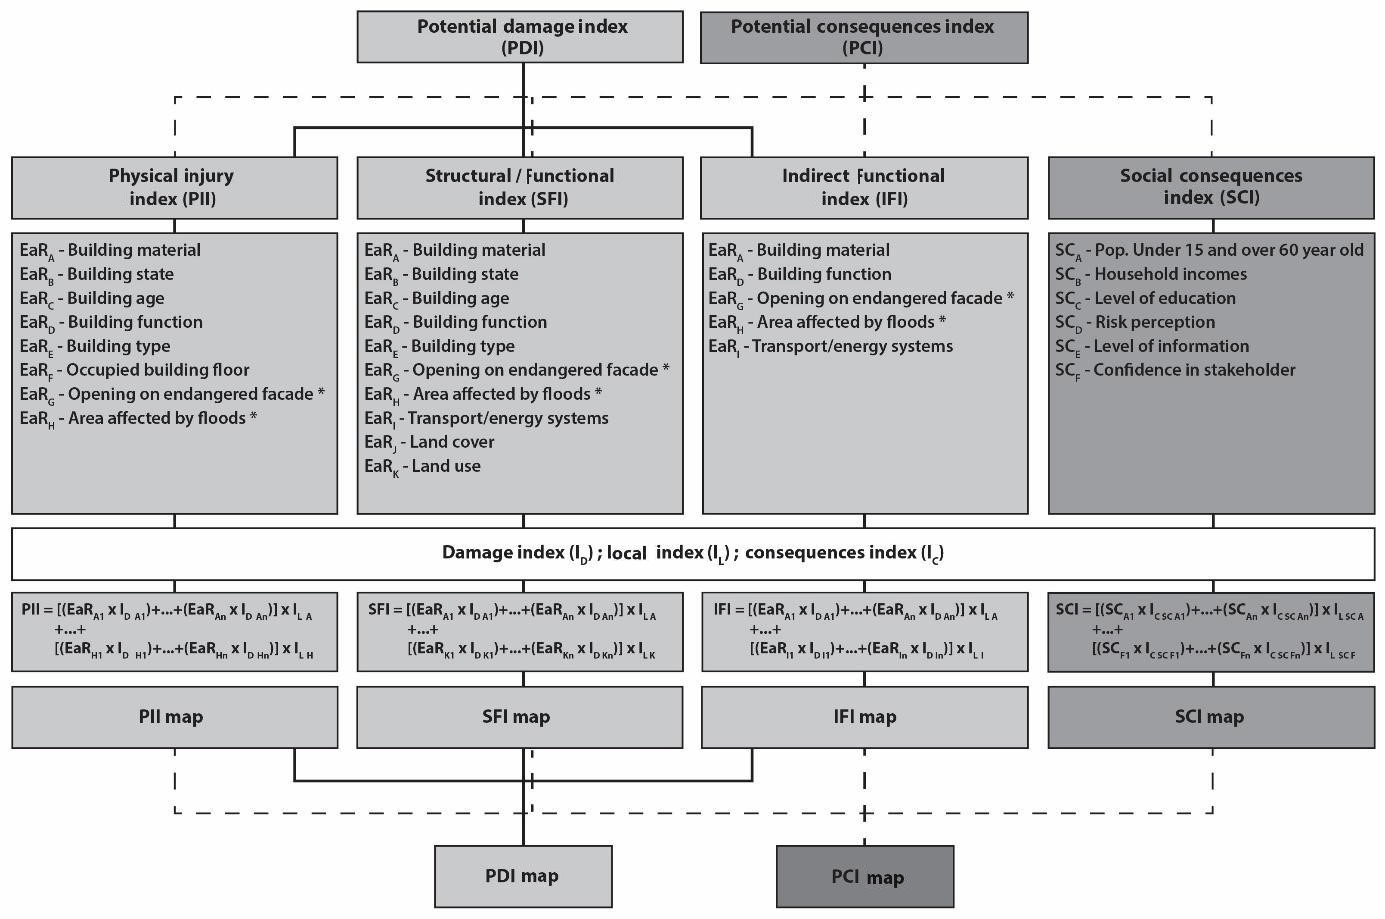
Figure 3Framework of the Potential Damage Index (PDI) compared to the Potential Consequences Index (PCI).
3.1 General framework of the Potential Damage Index (PDI)
The PDI methodology is indicator oriented. To be used in practice, it is based on the use of commercial databases, aerial imagery and GIS technologies. In the PDI, consequences are expressed in a semi-quantitative way through an index called Total Consequences Index (CTI). CTI is obtained by combining three sub-indices representing the direct and indirect consequences of a hazard on elements at risk (Fig. 3): (1) the PII represents the consequences on people in their physical integrity, (2) the direct SFI expresses the direct and short-term effects on buildings, infrastructure and human activities, and (3) the IFI illustrates the long-term effects on socio-economic activities (Puissant et al., 2013). To obtain these indices and compute the TCI, three steps are required (Puissant et al., 2006). First, the element at risk and its relevant attribute are identified and compiled into a complete database. Then, each modality of the attribute compiled is ranked through an expert weighting (Fig. 3 and Table 1). The value applied is called the Damage Index (di). It is standardised on a scale from zero to one, with higher index values indicating higher potential consequences (Table 1). In the third step, direct (PII and SFI) and indirect (IFI) consequences are modelled using a linear combination. In this step, a coefficient is assigned to each variable with respect to the socio-economic context of the region and the type of consequence assessed (direct or indirect) (Fig. 3 and Table 1). The coefficient, called the local index (Li) varies from 1 to 4. To finish, the three sub-indices are combined to obtain the PDI. In order to be used in a risk analysis, PDI is reclassified in five classes and mapped. With a matrix, PDI map is then combined with a hazard map (reclassified in five classes as well) to obtain a type 1957 flood risk map (Table 2). As support for this work, data sets from Institut National de l'Information Géographique et forestière (IGN BD ORTHO/BD TOPO, 2009) were used. To complete our database, an intensive field investigation was carried out in association with the use of Google Street View® and OpenStreetMap® software. Land cover and land uses maps were produced on GIS by combining photo interpretative work with data on natural protected areas (DREAL PACA, 2016), agricultural land (PRG, 2012) and touristic infrastructure (prospectuses, touristic maps, etc.).
Table 4First set of criteria selected for the calculation of SCI and their impacts on social vulnerability.
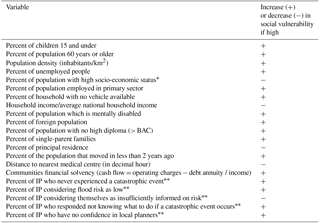
IP: investigated population. *Artisants, Commerçants et Chefs d'Entreprise ou Cadres et Professions Intellectuelle Supérieur. Data from SAMCO risk-perception survey.
Table 5Details of weights assigned to the criteria used in SCI calculation. Criteria with an * are those derived from the risk-perception survey.
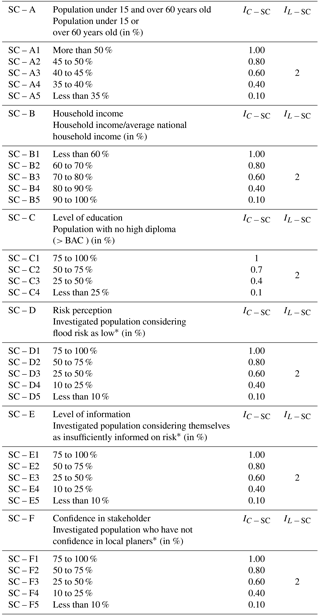
*Data from SAMCO risk-perception survey.
3.2 General framework of the Potential Consequences Index (PCI)
In the proposed PCI, PDI methodology has been modified to assess both physical and social consequences. The upgrade consists of the addition of a fourth sub-index in the calculation of the TCI (Fig. 3). This sub-index, called the SCI, is built to represent the social consequences of a hazard on community resilience. The use of an indicator to assess social consequences requires the selection of specific criteria that unequivocally represent the different aspects of social vulnerability (Cutter et al., 2003; Rygel et al., 2006). Literature on vulnerability identifies many elements that contribute to different abilities to cope with hazards (Table 3). Today, the majority of the analyses produced use data from national census to build social vulnerability indices (Cutter et al., 2000, 2008; Wu et al., 2002; Chakraborty et al., 2005; Fekete, 2009; Guillard-Gonçalves et al., 2014, Zhang and You, 2014; Huang et al., 2015; Koks et al., 2015; Nelson et al., 2015; Frigerio et al., 2016; Karagiorgos et al., 2016; Rogelis et al., 2016; Aroca-Jimenez et al., 2017; Heß, 2017). Some indicators repeatedly appear in these analyses such as poverty, age, education or disabilities (Table 3). In agreement with these existing published references, socio-economic data were collected for the six municipalities of the Upper Guil catchment. A set of 21 criteria was first selected (Table 4). Sixteen of them come from the open-access French national statistical database of the Institut National de la Statistique et des Etudes Economiques (INSEE) (INSEE, 2006, 2012, 2015). Five others were selected in a risk-perception survey taken during the SAMCO project. This survey consisted in a questionnaire (38 questions) carried out during autumn 2014 and summer 2015 and 2016 on the six municipalities of the Upper Guil catchment (Fig. 1). It is focused on three main issues: (1) inhabitant perception of the different risks (torrential floods, avalanches, landslides and rockfalls), (2) inhabitant knowledge of preventive and protective measures and (3) inhabitant confidence in stakeholders. A hundred questionnaires were collected (about 5 % of the total population): 8 in Ristolas (10.53 %), 22 in Abriès (6.85 %), 22 in Aiguilles (4.95 %), 16 in Château-Ville-Vieille (4.58 %), 17 in Molines-en-Queyras (5.45 %) and 15 in St-Véran (5.86 %). People were interviewed in-person or by paper questionnaires that were delivered and recovered in person. Special attention was given to a representative view of the socio-economic characteristics of the local population. Indeed, in the second and third campaigns, the surveyed people were selected for their demographic and socio-economic characteristics according to INSEE census data (INSEE, 2012, 2015).
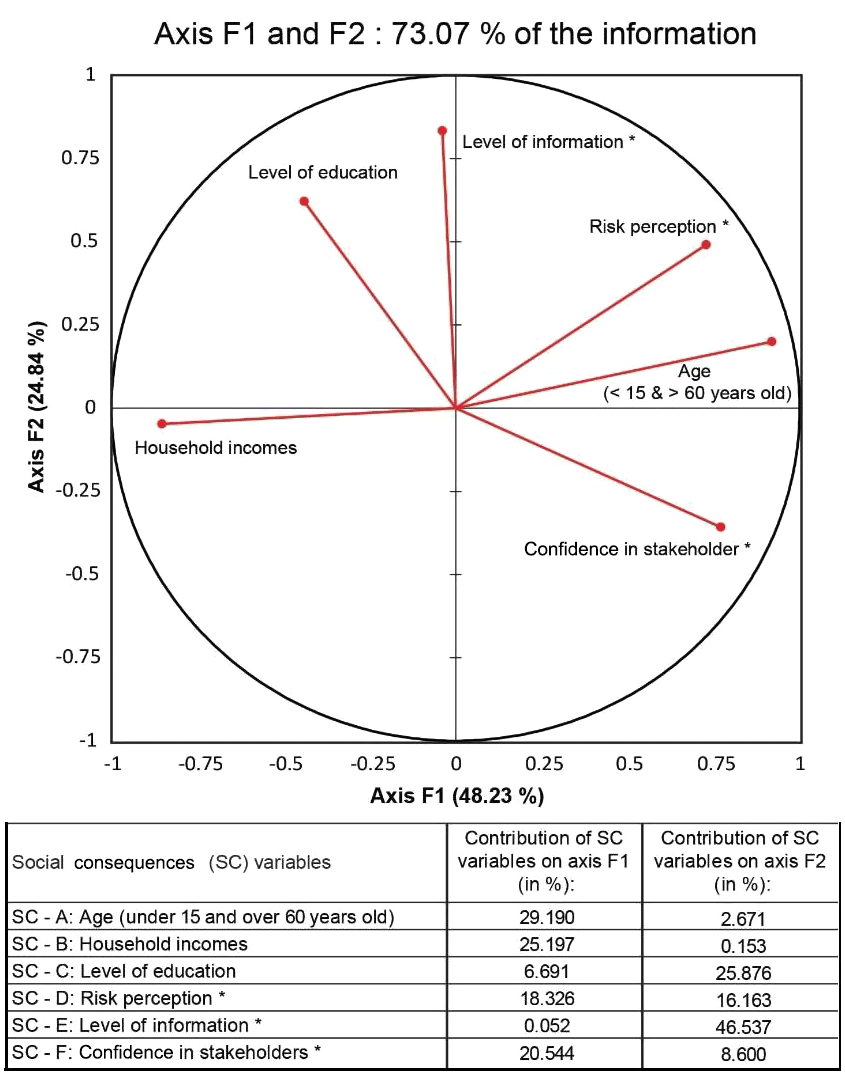
To reduce the number of variables and avoid useless repetition we performed a principal component analysis (PCA) on our data set. We conserved only the criteria containing the highest percentage of information on axis F1 and F2 (Fig. 4). There were six: (1) age, (2) household income, (3) level of education, (4) flood risk perception, (5) level of information on flood risk and (6) confidence in stakeholders (Fig. 4). With respect to PDI methodology, the modalities of the six selected criteria were ranked and a value of 0 to 1 was assigned to them (Table 5). In PCI methodology the term of the consequence index (ci) is preferred to the damage index (id) from PDI. A local index (il) is then assigned to the six criteria with respect to their relative importance in the PCA produced. SCI is calculated using linear combinations on GIS (raster calculator tool on ArcGIS) and applied to each building of the six studied municipalities. Due to the lack of data on a building scale, SCI is equally applied for all the buildings of a same community. The PCI is then calculated by adding the index scores of the four sub-indices (SCI, PII, SFI and IFI) (Fig. 3). PCI is finally reclassified in five classes and mapped. Using a matrix, PCI map is combined with a flood hazard map (in five classes) to obtain a type 1957 flood risk map (Table 2).

3.3 Flood hazard mapping
Several hazard maps were produced in the SAMCO project. To focus on the new method found to assess physical and social consequences, a single scenario of flooding is considered in this paper. The selected scenario represents a flood type 1957 (RI > 100 years). We voluntarily selected a scenario with the more important spatial extent to highlight the differences between the PDI and the PCI. The type 1957 flood map was made using the hydraulic modelling software HecRAS®. Fifteen cross sections representing a linear stream of 58.2 km were characterised (Table 6). Due to the lack of accurate data for all the streams of the subcatchment, only eight of them were taken into account in our model (Table 6). Geometry (stream, river banks and flood plains) was extracted from a DEM (digital elevation model) at 1 m resolution. This DEM was produced with lidar data provided by the Regional Natural Park of Queyras (PNRQ). Flooded surfaces (extent, depth, speed) were extrapolated using 371 sections, extracted from our DEM. To take into account the protection along the reaches, dykes and artificial channels were incorporated into the model. The generated flooded surface has an extension of 2.88 km2. This envelope provides a good overview of the water flows and allows a quick and clear visualisation of the potentially flooded areas. The flood map used in this paper was reclassified into five classes considering water elevation (Fig. 5).
Table 6Additional information on the hydrological model produced with HecRAS® software.
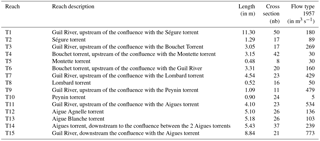
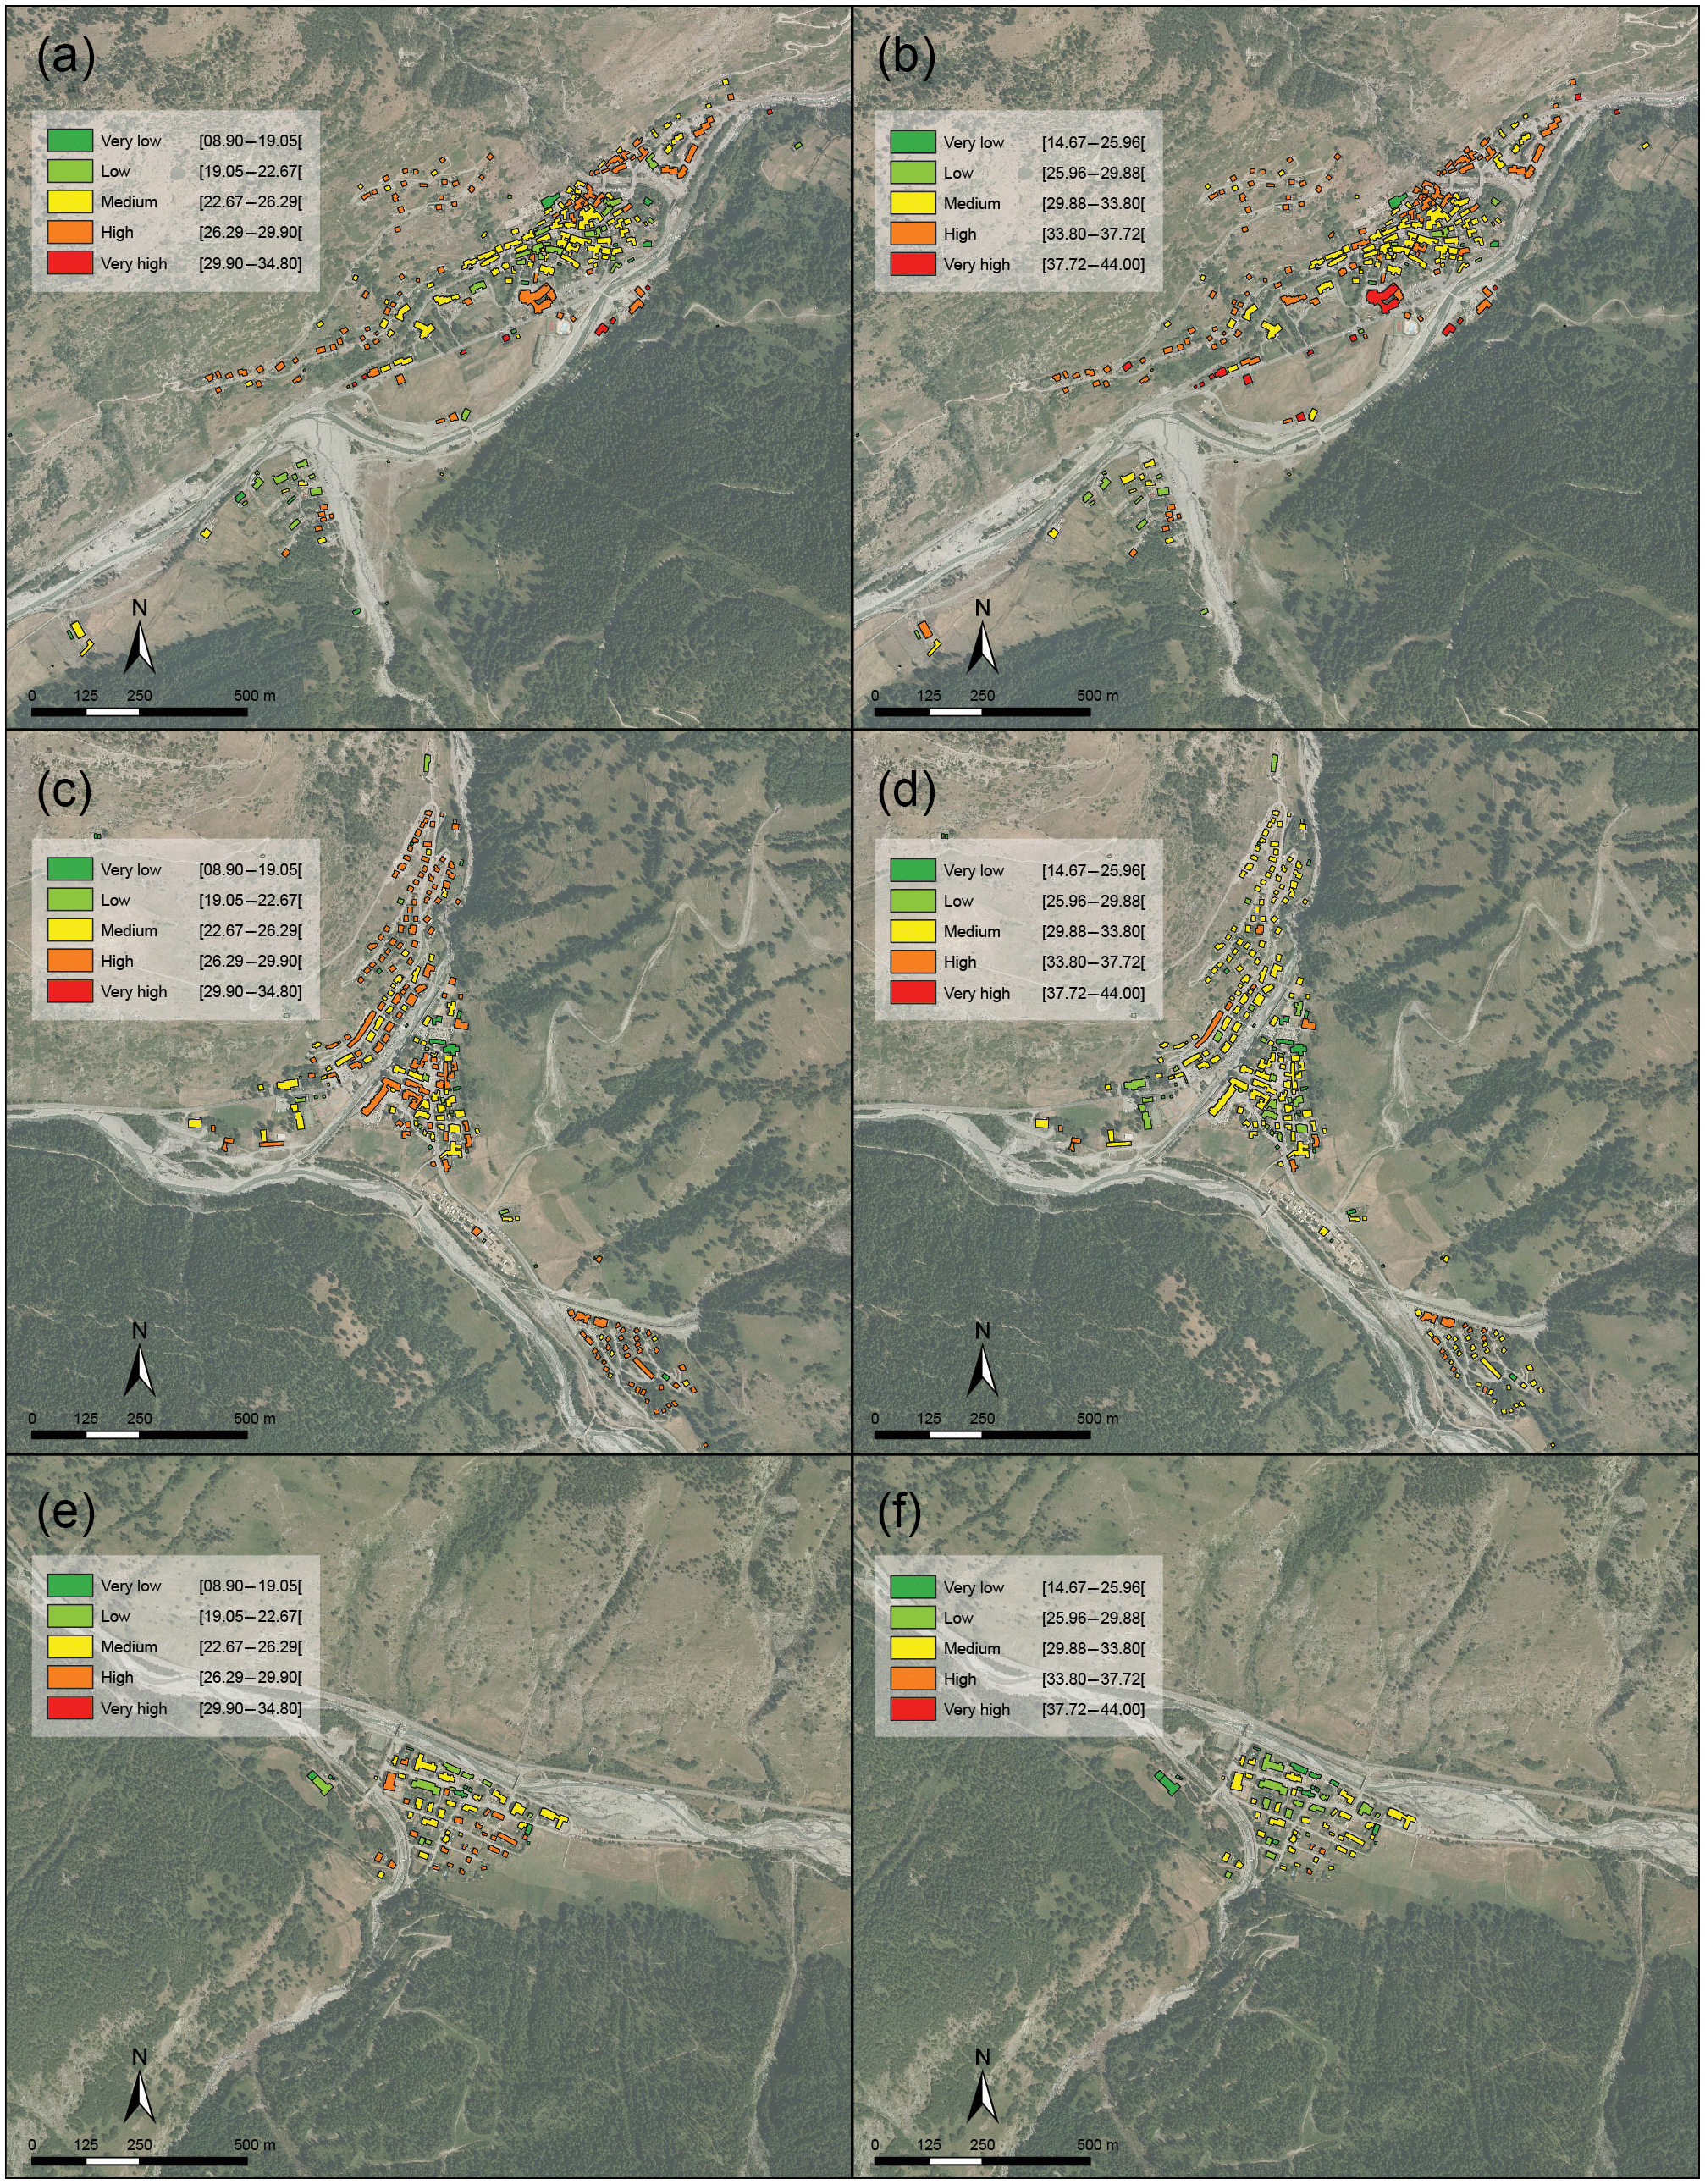
Figure 6Comparison between PDI and PCI maps. (a) Close-up of PDI map produced for the village of Aiguilles; (b) close-up of PDI map produced for the village of Abriès; (c) close-up of PDI map produced for the village of Ristolas; (d) close-up of PCI map produced for Aiguilles; (e) close-up of PCI map produced for Abriès (f) close-up of PCI map produced for Ristolas.

Figure 7Comparison between type 1957 flood risk maps produced using PDI and those using PCI. (a) Flood risk map produced using PDI. (b) Flood risk map produced using PCI.
Using the methods previously described, PDI and PCI were calculated and mapped for the six municipalities of the Upper Guil catchment. The distribution of the values calculated for both PDI and PCI are symmetric. As a consequence we chose to classify all the maps in five classes using averaging and standard deviation. To get a better understanding, PDI results are described before PCI results. Then, a complete comparison between PDI and PCI results is proposed. To highlight differences between the two models, networks and land cover/uses are ignored in this part of the analysis.
4.1 Description of the PDI results
The PDI map for flooding is obtained for the Upper Guil catchment by summing the direct PII, SFI and IFI (Fig. 3). CTI scores for buildings ranging between 8.9 and 34.8 (mean: 24.5) (Fig. 7a, b and c). For the sub-indices, the highest scores are generally observed for the PII (mean: 10.9) and the lowest for the Socio-Economic Index (mean: 4.1). SFI scores are the average of them (mean: 9.5). Close-up of Aiguilles, Abriès and Ristolas villages are shown in Fig. 6a, b and c. The produced map displays a majority of buildings with moderate to high scores of total potential consequences for the all studied communities. Buildings with the highest scores are mainly located in the vicinity of the Guil River or one of its main tributaries (Fig. 6a, b and c). Major stakeholders such as rescue centres (hospital, fire station, etc.), town halls and schools are also classified with a high degree of potential consequences. This is due to their important function in local life. Conversely, churches, sheds and warehouses have a low degree of potential consequences. In town centres, buildings with trading or touristic functions are generally in the “high” consequence class, whereas those which only have a housing function are classified as “moderate”. Sparse housing areas (mostly located on the heights) have a high degree of total potential consequences because they were not constructed to resist floods (large opening on ground floor, less resistant building materials, etc.). In most cases, these houses have virtually no chance of being impacted by a flood because they are located away from the torrential streams.
4.2 Description of the PCI results
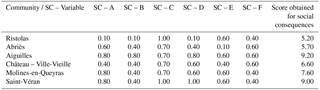
The PCI is obtained by summing the direct PII, the direct SFI, the IFI and the new SCI (Fig. 3). PCI scores calculated for building range from 14.7 to 44 (mean: 31.8) (Fig. 7d, e and f). SCI scores calculated for the six municipalities ranged between 5.2 and 9.2 (mean: 7.2) (Table 7). They are in the same order of magnitude than those of the three other indices used in PCI calculation (PII, SFI and IFI). The PCI map produced for the Upper Guil catchment displays a majority of buildings classified with moderate degree of total potential consequences. (Fig. 6d, e, f). At the community level, buildings classified with high or very high degree of potential consequences are mainly located near the Guil River or one of its main tributaries. Collective housing and major stakeholders (hospital, town halls, schools, etc.) are generally classified with higher potential consequences (Fig. 6d, e, f) than individual housing. In most cases, churches, sheds and warehouses are classified with a low or very low degree of potential consequences. Despite these general tendencies, we observe differences from one community to another. At the Upper Guil catchment level, the studied communities can be divided into three groups (Fig. 6 and Table 7). The first group is made up of communities with a large number of buildings classified with a high and very high degree of total potential consequences: Aiguilles and Saint Véran. A second one is formed by communities with most of their buildings being classified with moderate potential consequences: Château-Ville-Vieille and Molines-en-Queyras. The third group is composed of communities with buildings classified with low to moderate total potential consequences: Abriès and Ristolas. These differences between communities are directly related to SCI scores. The comparison between Ristolas and Aiguilles communities speaks for itself (Fig. 6d, f). The Ristolas community has the lowest SCI score (Table 7). People living here have a good perception of flood-related risks, indicating a high level of preparedness. They have confidence in local managers and there are only a few dependent people (children or elderly people) to care for when an unexpected situation arises. This suggests a high capacity to react when confronted to a catastrophic episode. In addition, they are globally wealthier than the other studied communities. They theoretically have a better ability to quickly recover after a material loss. By contrast, the Aiguilles community has high CTI and SCI scores indicating a lower ability to cope with hazards (Table 7). Compared to other communities, Aiguilles have more dependant people to care for. In addition, people have a lack of information on flood risks and tend to underestimate the danger represented by floods. Aiguilles citizens earn less and have less confidence in their local managers. In the case of Ristolas, CSI tends to reduce the total potential consequences, contrary to Aiguilles. In other words, a community with a resilient population can qualify results obtained for physical consequences.
Table 7SCI scores calculated for the six municipalities of the Upper Guil catchment.
4.3 Comparison between PDI and PCI maps
The PCI is developed as an upgrade of the PDI method. As a consequence, we can observe some similarities between PDI and PCI maps produced (Fig. 6). In most cases, buildings classified with the highest level of potential consequences are buildings considered essential in local life (city hall, hospital, police and fire stations, etc.). In both maps, buildings located in a previously inundated area are also classified with a high degree of total potential consequences (Fig. 6a, b, d, e). Likewise, buildings classified with low or very low potential consequences are generally buildings with no essential function in local life like churches, sheds, warehouses or empty buildings. Moreover, buildings constructed in the last 20 years (mostly individual housing) generally have a higher degree of potential consequences than older buildings. With the PCI method, the influence of the physical consequences indices (PII, SFI and IFI) is thus globally preserved at the community level. The introduction of SCI allows us to qualify the total potential consequences of the elements at risk with regard to the ability of each community to cope with hazards. Ristolas and Abriès have low SCI scores. Floods will have less of an impact on these communities. As a result, elements at risk are classified with lower total potential consequences in comparison with PDI. By contrast Aiguilles and Saint Véran communities have high SCI scores indicating a low ability to cope with hazards. The buildings of these two communities are thus classified with higher total potential consequences in the PCI map and higher potential risk in the risk map produced (Fig. 7). As SCI is equally applied to all the buildings of a community, it tends to homogenise PCI scores at the community level. In comparison with the PDI map, the minimum score values are uplifted, resulting in a partial loss of information. This is particularly true in the communities with the highest SCI scores (Aiguilles and Saint-Véran). This partial loss has, however, a positive impact on the readability of the maps. The global level of potential consequences of each community is evident and allows us to compare each community with one another. This is not so clear with the PDI method. In addition, the smoothing of the results tends to highlight the most vulnerable stakeholders. As a result, the PCI map is easier to understand for local managers than the PDI map.
In the present paper we explored the possibility to assess the physical and the social vulnerability together through an indicator-based method. To perform this study, we opted for an upgrade of the PDI method, which was originally developed to assess the physical consequences of defined hazards on elements at risk. After an intensive review of the existing published reference on social vulnerability we selected six criteria derived from national French census data and a risk perception survey carried out in the field. These criteria were combined to produce a new sub-index representing the ability of communities to cope with hazards. The new Social Consequence Index was integrated into the PDI methodology to obtain the PCI. The PCI is then tested on the six municipalities of the Upper Guil catchment to assess the potential consequences of a high-magnitude flood event on elements at risk (RI > 100 years).
The upgrade to the PDI method provides many benefits. First, the new SCI introduces criteria providing information on the three phases of risk management: preparedness, crisis management and recovery. By using data derived from a survey, the PCI method also displays information on the perception of the inhabitants regarding risk management. The introduction of elements from social vulnerability thus adds an extra dimension to the total consequence map. It allows us to qualify the potential physical consequences (physical injury, structural and functional consequences) on element at risk considering the global resilience of local communities. Then, with the PCI method the level of potential consequences of each community is clearly displayed and the most vulnerable elements at risks are easy to identify. Therefore, the PCI method allows us to quickly compare communities in their ability to cope with hazards. The PCI map is consequently easily understood by risk managers or local decision makers and will help them set up adapted mitigation measures in the most vulnerable areas. Another benefit of the method results in the data used. Because it is mostly based on national data, it is easy to transpose to other places.
The main limitation of the PCI method is that a unique value of the SCI is applied to the overall building of a community. By proceeding so, SCI tends to homogenise PCI by uplifting minimum values. For the communities with high SCI scores, this may simplify the information displayed. This scaling issue can imply a loss of information, which may affect the distribution of PCI scores, and thus, the choices in mapping classes. The amount of data required to perform this kind of analysis represents another limit. The method is based on the utilisation of many different criteria. Collecting them requires consequent fieldwork and must be time consuming. This is especially true for criteria derived from a risk perception survey. Consequently, the use of the PCI model on a large scale will be quite difficult.
Some elements which may improve the PCI model will be investigated in future work. First of all, we will expand the scale of our study by including other communities of the southern French Alps studied in the SAMCO project. Located in the Ubaye valley, near our study area, these communities display similar physical and socio-economic characteristics. Their inclusion will provide a more representative selection of statistical investigations. Another lead will be an adaptation of the survey protocol in order to get data on a smaller scale such as a district scale. Another solution for increasing precision will be the use of a desegregation model to distribute PCI on a building scale.
The method presented in this paper will be a source of significant progress for vulnerability assessment. By considering the two main components of vulnerability, the physical one and the socio-economic one, this work may be an important tool for local authorities. The PCI will help them to better understand their strengths and weaknesses and will be useful in developing appropriate mitigation measures at local and regional levels.
This work was carried out as part of the ANR SAMCO project. The ANR (Agence nationale de la recherche) is a French governmental agency which provides funding for research projects. The data produced are confidential in accordance with the attached ANR Charter. http://www.agence-nationale-recherche.fr/fileadmin/user_upload (Agence National de la Recherche, 2009).
The supplement related to this article is available online at: https://doi.org/10.5194/nhess-18-2221-2018-supplement.
BC and AP designed and carried out the experiments. BC developed the model and performed the simulations. BC and CD carried out the questionnaire survey. GAF supervised BC and CD. BC prepared the manuscript with contributions from all co-authors.
The authors declare that they have no conflict of interest.
This paper is part of a larger research project (SAMCO project ANR-12-SENV-0004.) bringing together research centres (BRGM, IPGS, IRSTEA), laboratories (LIVE-UMR7362, PRODIG-UMR8586, GEODE-UMR5602) and a technologically advanced SME (GEO-HYD) to evaluate mountain risk in a context of global changes (i.e. socio-economic and climatic).
This research is a part of the PhD research work of Benoît Carlier (Evaluation, cost and management of torrential and gravitational risk in mountainous environment; defence thesis in 2018).
We would like to thank Bérengère Charnay from the Parc Naturel
Régional du Queyras and the municipality councils of Ristolas,
Abriès, Aiguilles, Château-Ville-Vieille, Molines-en-Queyras and St
Véran for their hospitality, their help and their interest in our
works.
Edited by: Sven Fuchs
Reviewed by: two anonymous referees
Aitsi-Selmi, A., Egawa, S., Sasaki, H., Wannous, C., and Murray, V.: The Sendai Framework for Disaster Risk Reduction: Renewing the Global Commitment to People's Resilience, Health, and Well-being, Int. J. Disast. Risk Sc., 6, 164–176, https://doi.org/10.1007/s13753-015-0050-9, 2015.
Alcántara-Ayala, I., Altan, O., Baker, D., Briceño, S., Cutter, S., Gupta, H., Holloway, A., Ismail-Zadeh, A., Jiménez Díaz, V., Johnston, D., McBean, G., Ogawa, Y., Paton, D., Porio, E., Silbereisen, R., Kuniyoshi, T., Valsecchi, G., Vogel, C., Wu, G., and Zhai, P.: Disaster Risks Research and Assessment to Promote Risk Reduction and Management, ICSU-ISSC AD-HOC Group on Disaster Risk Assessment, Paris, ICSU, 12 March 2015, 1–47, available at: https://www.preventionweb.net/files/43219 (last access: 1 July 2018), 2015.
Agence National de la Recherche (ANR): Charte de déontologie, DIR-REG-090309-L-01-01, p. 6, available at: http://www.agence-nationale-recherche.fr/fileadmin/user (last access: 1 July 2018), 2009.
Armas, I. and Gavriş, A.: Social vulnerability assessment using spatial multi-criteria analysis (SEVI model) and the Social Vulnerability Index (SoVI model) – a case study for Bucharest, Romania, Nat. Hazards Earth Syst. Sci., 13, 1481–1499, https://doi.org/10.5194/nhess-13-1481-2013, 2013.
Armas, I., Toma-Danila, D., Ionescu, R., and Gavris, A.: Vulnerability to Earthquake Hazard: Bucharest Case Study, Romania, Int. J. Disast. Risk Sc., 8, 182–195, https://doi.org/10.1007/s13753-017-0132-y, 2017.
Arnaud-Fassetta, G. and Fort, M.: La part respective des facteurs hydro-climatiques et anthropiques dans l'évolution récente (1956–2000) de la bande active du Haut-Guil, Queyras, Alpes françaises du Sud, Géosystèmes méditerranéens et montagnards, Un mélange offert à Maurice Jorda, Méditerranée, 1–2, 143–156, https://doi.org/10.3406/medit.2004.3350, 2004.
Arnaud-Fassetta, G. and Fort, M.: Hydro-bio-morphological changes and control factors of an upper Alpine valley bottom since the mid-19th century, Case study of the Guil River, Durance catchment, southern French Alps, The Little Ice Age in the Mediterranean, Méditerranée, 122, 159–182, https://doi.org/10.4000/mediterranee.7245, 2014.
Arnaud-Fassetta, G., Cossart, E., and Fort, M.: Hydro-geomorphic hazards and impact of man-made structures during the catastrophic flood of June 2000 in the Upper Guil catchment (Queyras, French Alps), Geomorphology, 66, 41–67, https://doi.org/10.1016/j.geomorph.2004.03.014, 2005.
Aroca-Jimenez, E., Bodoque, J. M., Garcia, J. A., and Diez-Herrero, A.: Construction of an integrated social vulnerability index in urban areas prone to flash flooding, Nat. Hazards Earth Syst. Sci., 17, 1541–1557, https://doi.org/10.5194/nhess-17-1541-2017, 2017.
Barroca, B., Pottier, N., and Lefort, E.: Analyse et évaluation de la vulnérabilité aux inondations du bassin de l'Orge aval, Septièmes Rencontres de Théo Quant, janvier 2005, 1–12, 2005.
Birkmann, J.: Measuring Vulnerability to Natural Hazards: Towards Disaster Resilient Societies, United Nations Publications, New York, 2, 55–77, 2006.
Birkmann, J., Cardona, O. D., Carreño, M. L., Barbat, A. H., Pelling, M., Schneiderbauer, S., Kienberger, S., Keiler, M., Alexander, D., Zeil, P., and Welle, T.: Framing vulnerability, risk andbsocietal responses: the MOVE framework, Nat. Hazards, 67, 193–211, https://doi.org/10.1007/s11069-013-0558-5, 2013.
Blaikie, P., Cannon, T., Davis, I., and Wisner, B.: At Risk: Natural Hazards, Peoples' Vulnerability and Disasters, Routledge, London, p. 134, 1994.
Bründl, M., Romang, H. E., Bischof, N., and Rheinberger, C. M.: The risk concept and its application in natural hazard risk management in Switzerland, Nat. Hazards Earth Syst. Sci., 9, 801–813, https://doi.org/10.5194/nhess-9-801-2009, 2009.
Chakraborty, J., Tobin, G. A., and Montz, B. E.: Population Evacuation: Assessing Spatial Variability in Geophysical Risk and Social Vulnerability to Natural Hazards, Nat. Hazards, 6, 23–33, https://doi.org/10.1061/(ASCE)1527-6988(2005)6:1(23), 2005.
Chang, S. E., Yip, J. Z. K., Van Zijll de Jong, S. L., Chaster, R., and Lowcock, A.: Using vulnerability indicators to develop resilience networks: a similarity approach, Nat. Hazards, 78, 1827–1841, https://doi.org/10.1007/s11069-015-1803-x, 2015.
Ciurean, R. L., Schröter, D., and Glade, T.: Conceptual Frameworks of Vulnerability Assessments for Natural Disasters Reduction, in: Approaches to Disaster Management – Examining the Implications of Hazards, Emergencies and Disasters, Social Sciences, edited by: Tiefenbacher, J., 228 pp., https://doi.org/10.5772/55538, 2013.
Clark, G. E., Moser, S. C., Ratick, S. J., Dow, K., Meyer, W. B., Emani, S., Jin, W., Kasperson, J. X., Kasperson, R. E., and Schwarz, H. E.: Assessing the vulnerability of coastal communities to extreme storms: the case of Revere, MA, USA, Mitigation and Adaptation Strategies for Global Change, 3, 59–82, https://doi.org/10.1023/A:1009609710795, 1998.
Cutter, L. S. and Finch, C.: Temporal and spatial changes in social vulnerability to natural hazards, P. Natl. Acad. Sci. USA, 107, 2301–2306, https://doi.org/10.1073/pnas.0710375105, 2008.
Cutter, L. S., Boruff, B. J., and Lynn Shirley, W.: Social Vulnerability to Environmental Hazards, Soc. Sci. Quart., 84, 242–260, https://doi.org/10.1111/1540-6237.8402002, 2003.
DREAL PACA : Reseau Natura 2000 – Documents d'objectifs, http://www.paca.developpement-durable.gouv.fr (last access: 1 July 2018), 2016.
Ebert, A., Kerle, N., and Stein, A.: Urban social vulnerability assessment with physical proxies and spatial metrics derived from air- and spaceborne imagery and GIS data, Nat. Hazards, 48, 275–294, https://doi.org/10.1007/s11069-008-9264-0, 2009.
Eidsvig, U. M. K., Kristensen, K., and Vangelsten, B. V.: Assessing the risk posed by natural hazards to infrastructures, Nat. Hazards Earth Syst. Sci., 17, 481–504, https://doi.org/10.5194/nhess-17-481-2017, 2017.
Elsasser, H. and Bürki R.: Climate change as a threat to tourism in the Alps, Clim. Res., 20, 253–257, https://doi.org/10.3354/cr020253, 2002.
Fekete, A.: Validation of a social vulnerability index in context to river-floods in Germany, Nat. Hazards Earth Syst. Sci., 9, 393–403, https://doi.org/10.5194/nhess-9-393-2009, 2009.
Fell, R., Corominas, J., Bonnard, C., Cascini, L., Leroi, E., and Savage, W. Z.: Guidelines for landslide susceptibility, hazard and risk zoning for land use planning, Eng. Geol., 102, 85–89, https://doi.org/10.1016/j.enggeo.2008.03.022, 2008.
Flanagan, B. E., Gregory, E. W., Hallisey, E. J., Heitgerd, J. L., and Lewis, B.: A Social Vulnerability Index for Disaster Management, J. Homel. Secur. Emerg., 8, 1547–7355, https://doi.org/10.2202/1547-7355.1792, 2012.
Fort, M., Arnaud-Fassetta, G., Cossart, E., Beaudouin, B., Bourbon, C., Debail, B., and Einhorn, B.: Impacts et signification hydromorphologique de la crue du Guil de juin 2000 (Haut Queyras), Geomorphology: from Expert Opinion to Modelling, A tribute to Professor Jean-Claude Flageollet, Proceedings of the Symposium held in Strasbourg, France, 26–27 April 2002, CERG Editions, 159–166, 2002.
Fort, M., Arnaud-Fassetta, G., Bétard, F., Cossart, E., Madelin, M., Lissak, C., Viel, V., Bouccara, F., Carlier, B., Sourdot, G., Tassel, A., Geai, M-L., Bletterie, X., and Charnay, B.: Sediment dynamics and channel adjustments following torrential floods in an upper Alpine valley (Guil River, Southern French Alps), Engineering Geology for Society and Territory, Vol. 3: River Basins, Reservoir Sedimentation and Water Resources, chap. 65, Springer, Cham, Heidelberg, New York, Dordrecht, London, 313–317, https://doi.org/10.1007/978-3-319-09054-2_65, 2014.
Frigerio, I., Ventura, S., Strigaro, D., Mattavelli, M., De Amicis, M., Mugnano, S., and Boffi, M.: A GIS-based approach to identify the spatial variability of social vulnerability to seismic hazard in Italy, Appl. Geogr., 74, 12–22, https://doi.org/10.1016/j.apgeog.2016.06.014, 2016.
Fuchs, S.: Susceptibility versus resilience to mountain hazards in Austria – paradigms of vulnerability revisited, Nat. Hazards Earth Syst. Sci., 9, 337–352, https://doi.org/10.5194/nhess-9-337-2009, 2009.
Fuchs, S., Heiss, K., and Hübl, J.: Towards an empirical vulnerability function for use in debris flow risk assessment, Nat. Hazards Earth Syst. Sci., 7, 495–506, https://doi.org/10.5194/nhess-7-495-2007, 2007.
Fuchs, S., Birkmann, J., and Glade, T.: Vulnerability assessment in natural hazard and risk analysis: current approaches and future challenges, Nat. Hazards, 64, 1969–1975, do:10.1007/s11069-012-0352-9, 2012.
Fuchs, S., Keiler, M., Sokratov, S., and Shnyparkov, A.: Spatiotemporal dynamics: the need for an innovative approach in mountain hazard risk management, Nat. Hazards, 68, 1217–1241, https://doi.org/10.1007/s11069-012-0508-7, 2013.
Fuchs, S., Röthlisberger, V., Thaler, T., Zischg, A. P., and Keiler, M.: Natural hazard management from a co-evolutionary perspective: exposure and policy response in the European Alps, Ann. Am. Assoc. Geogr., 107, 382–392, https://doi.org/10.1080/24694452.2016.1235494, 2017
Glade, T.: Vulnerability assessment in landslide risk analysis, Die Erde, Beitrag zur Erdsystemforschung, 134, 123–146, 2003.
Guillard-Gonçalves, C., Cutter, S. L., Emrich, C. T, and Zêzere, J. L.: Application of Social Vulnerability Index (SoVI) and delineation of natural risk zones in Greater Lisbon, Portugal, J. Risk. Res., 18, 651–674, https://doi.org/10.1080/13669877.2014.910689, 2014.
Heß, V. D. C.: Weigh(t)ing the dimensions of social vulnerability based on a regression analysis of disaster damages, Nat. Hazards Earth Syst. Sci. Discuss., https://doi.org/https://doi.org/10.5194/nhess-2017-74, 2017.
Hewitt, K. and Metha, M.: Rethinking risk and disasters in mountain areas, Journal of Alpine Research, 100, p. 13, https://doi.org/10.4000/rga.1653, 2012.
Huang, J., Su, F., and Zhang, P.: Measuring Social Vulnerability to Natural Hazards in Beijing-Tianjin-Hebei Region, China, Chin. Geogra. Sci., 25, 472–485, https://doi.org/10.1007/s11769-015-0769-7, 2015.
IGN BD ORTHO/BD TOPO: Hautes-Alpes, 2009.
INSEE: Recensement de la Population 2006, Hautes-Alpes, exploitation principal, 2008.
INSEE: Recensement de la Population 2012, Hautes-Alpes, exploitation principal, 2014.
INSEE: Recensement de la Population 2014, Hautes-Alpes, exploitation principal, 2014.
IPCC: Managing the Risks of Extreme Events and Disasters to Advance Climate Change Adaptation, A Special Report of Working Groups I and II of the Intergovernmental Panel on Climate Change, edited by: Field, C. B., Barros, V., Stocker, T. F., Qin, D., Dokken, D. J., Ebi, K. L., Mastrandrea, M. D., Mach, K. J., Plattner, G.-K., Allen, S. K., Tignor, M., and Midgley, P. M., Cambridge University Press, Cambridge, UK, and New York, NY, USA, 582 pp., 2012.
Jeffers, J. M.: Integrating vulnerability analysis and risk assessment in flood loss mitigation: An evaluation of barriers and challenges based on evidence from Ireland, Appl. Geogr., 37, 44–51, https://doi.org/10.1016/j.apgeog.2012.10.011, 2013.
Kappes, M. S., Papathoma-Köhle, M., and Keiler, M.: Assessing physical vulnerability for multi-hazards using an indicator-based methodology, Appl. Geogr., 32, 577–590, https://doi.org/10.1016/j.apgeog.2011.07.002, 2012.
Karagiorgos, K., Thaler, T., Hübl, J., Maris, F., and Fuchs, S.: Multi-vulnerability analysis for flash flood risk management, Nat. Hazards, 82, 63–87, https://doi.org/10.1007/s11069-016-2296-y, 2016.
Keiler, M. and Fuchs, S.: Vulnerability and Exposure to Geomorphic Hazards: Some Insights from the European Alps, in: Geomorphology and Society, Advances in Geographical and Environmental Sciences, edited by: Meadows, M. and Lin, J. C., Springer, Tokyo, Japan, 165–180, https://doi.org/10.1007/978-4-431-56000-5_10, 2016.
Keiler, M., Knight, J., and Harrison, S.: Climate change and geomorphological hazards in the eastern European Alps, Philos. T. R. Soc. A., 368, 2461–2479, https://doi.org/10.1098/rsta.2010.0047, 2010.
Koks, E. E., Jongman, B., Husby, T. G., and Botzen, W. J. W.: Combining hazard, exposure and social vulnerability to provide lessons for flood risk management, Environ. Sci. Policy, 47, 42–52, https://doi.org/10.1016/j.envsci.2014.10.013, 2015.
Lafaysse, M.: Changement climatique et régime hydrologique d'un basin alpin, Génération de scénarios sur la Haute-Durance, méthodologie d'évaluation et incertitudes associées, Thesis, University Toulouse III – Paul Sabatier, Toulouse, France, 2011.
Leone, F., Colas, A., Garcin, Y., Eckert, N., Jomelli, V., and Gherardi, M.: The snow avalanches risk on Alpine roads network: Assessment of impacts and mapping of accessibility loss, Journal of Alpine Research, 102, p. 19, https://doi.org/10.4000/rga.2491, 2014.
Messner, F., Penning-Roswell, E., Green, C., Meyer, V., Tunstall, S., and van der Veen, A.: Evaluating flood damage: guidance and recommendations on principles and methods, FLOOD Site Project Report, p. 128, available at: http://www.floodsite.net/ (last access: 1 July 2018), 2007.
Meyer, V., Scheuer, S., and Haase, D.: A multicriteria approach for flood risk mapping exemplified at the Mulde River, Germany, Nat. Hazards, 48, 17–39, https://doi.org/10.1007/s11069-008-9244-4, 2009.
Muhar, A., Schauppenlehner, T., Brandenburg, C., and Arnberger, A.: Alpine summer tourism: The mountaineers' perspective and consequences for tourism strategies in Austria, For. Snow Landsc. Res., 81, 7–17, https://www.researchgate.net/profile/Thomas_Schauppenlehner (last access: 1 July 2018), 2007.
Nelson, K. S., Abkowitz, M. D., and Camp, J. V.: A method for creating high resolution maps of social vulnerability in the context of environmental hazards, Appl. Geogr., 63, 89–100, https://doi.org/10.1016/j.apgeog.2015.06.011, 2015.
Pachauri, R. K., Allen, M. R., Barros, V. R., Broome, J., Cramer, W., Christ, R., Church, J. A., Clarke, L., Dahe, Q., Dasgupta, P., Dubash, N. K., Edenhofer, O., Elgizouli, I., Field, C. B., Forster, P., Friedlingstein, P., Fuglestvedt, J., Gomez-Echeverri, L., Hallegatte, S., Hegerl, G., Howden, M., Jiang, K., Jimenez Cisneroz, B., Kattsov, V., Lee, H., Mach, K. J., Marotzke, J., Mastrandrea, M. D., Meyer, L., Minx, J., Mulugetta, Y., O'Brien, K., Oppenheimer, M., Pereira, J. J., Pichs-Madruga, R., Plattner, G. K., Pörtner, H. O. , Power, S. B., Preston, B., Ravindranath, N. H., Reisinger, A., Riahi, K., Rusticucci, M., Scholes, R., Seyboth, K., Sokona, Y., Stavins, R., Stocker, T. F., Tschakert, P., van Vuuren, D., and van Ypserle, J. P.: Climate Change 2014: Synthesis Report. Contribution of Working Groups I, II and III to the Fifth Assessment Report of the Intergovernmental Panel on Climate Change, edited by: Pachauri, R. and Meyer, L., Geneva, Switzerland, IPCC, p. 151, 2014.
Papathoma-Köhle, M., Kappes, M., Keiler, M., and Glade, T.: Physical vulnerability assessment for alpine hazards: state of the art and future needs, Nat. Hazards, 58, 645–680, https://doi.org/10.1007/s11069-010-9632-4, 2011.
Papathoma-Köhle, M., Promper, C., and Glade, T.: A Common Methodology for Risk Assessment and Mapping of Climate Change Related Hazards – Implications for Climate Change Adaptation Policies, Climate, 4, p. 23, https://doi.org/10.3390/cli4010008, 2016.
Papathoma-Köhle, M., Gems, B., Sturm, M., and Fuchs, S.: Matrices, curves and indicators: A review of approaches to assess physical vulnerability to debris flows, Earth-Sci. Rev., 171, 272–288, https://doi.org/10.1016/j.earscirev.2017.06.007, 2017.
PNRQ (Parc Naturel Régional du Queyras): Diagnostic de vulnérabilité du bassin versant du Guil aux inondations, Rapport définitif, Avril 2016, 1–48, 2016.
PRG 2012: Registre Parcellaire Graphique 2012 – Département Hautes-Alpes (05), availabel at: https://www.data.gouv.fr/fr/datasets/r/ (last access: 1 July 2018), 2012.
Puissant, A., Malet, J. P., and Maquaire, O.: Mapping landslide consequences in mountain areas: a tentative approach with a semi-quantitative procedure, SAGEO, Strasbourg, France, 1–16, 2006.
Puissant, A., Van Den Eeckhaut, M., Malet, J. P., and Maquaire, O.: Landslide consequence analysis: a region-scale indicator-based methodology, Landslides, 11, 843–858, https://doi.org/10.1007/s10346-013-0429-x, 2013.
Reghezza, M.: Vulnérabilité et risques: L'approche récente de la vulnérabilité, Responsabilité et environnement, 43, 9–13, 2006.
Reghezza, M. and Rufat, S.: The Resilience Imperative: Uncertainty, Risks and Disasters, Elsevier-ISTE, London, p. 262, 2015.
Rogelis, M. C., Werner, M., Obregón, N., and Wright, N.: Regional prioritisation of flood risk in mountainous areas, Nat. Hazards Earth Syst. Sci., 16, 833–853, https://doi.org/10.5194/nhess-16-833-2016, 2016.
Rygel, L., O'Sullivan, D., and Yarnal, B.: A method for constructing a social vulnerability index: an application to hurricane storm surges in a developed country, Mitig. Adapt. Strat. Gl., 11, 741–764, https://doi.org/10.1007/s11027-006-0265-6, 2006.
SAMCO ANR project: available at: http://www.anr-samco.com (last access: 1 July 2018), 2017.
Schoeneich, P. and De Jong, C.: Changes in the Alpine environment, Journal of Alpine Research, 96, 65–76, https://doi.org/10.4000/rga.603, 2008.
Steinführer, A., Kuhlicke, C., De Marchi, B., Scolobig, A., Tapsell, S., and Tunstall, S.: Local communities at risk from flooding: social vulnerability, resilience and recommendations for flood risk management in Europe, Report, Helmholtz Center for Environmental Research–UFZ, Leipzig, 2009.
Tapsell, S., McCarthy, S., Faulkner, H., and Alexander, M.: Social vulnerability and natural hazards, Flood Hazard Research Centre-FHRC, CapHaz-Net WP4 Report, Middlesex University, London, p. 87, available at: http://citeseerx.ist.psu.edu/viewdoc/download? (last access: 1 July 2018), 2010.
Tarbotton, C., Dall'osso, F., Dominey-Howes, D., and Goff, J.: The use of empirical vulnerability functions to assess the response of buildings to tsunami impact: comparative review and summary of best practice, Earth-Sci. Rev., 142, 120–134, https://doi.org/10.1016/j.earscirev.2015.01.002, 2015.
Totschnig, R. and Fuchs, S.: Mountain torrents: Quantifying vulnerability and assessing uncertainties, Eng. Geol., 155, 31–44, https://doi.org/10.1016/j.enggeo.2012.12.019, 2013.
Tricart, J.: Etude de la crue de la mi-Juin 1957 dans la vallée du Guil, de l'Ubaye et de la Cerveyrette, Revue de géographie Alpine, 4, 565–627, https://doi.org/10.3406/rga.1958.1846, 1958.
UNDRO: Disaster prevention and mitigation – a compendium of current knowledge, vol. 11, Preparedness Aspects, Office of the United Nations Disaster Relief Coordinator, New York, 1984.
Varnes, D. J.: Landslide Hazard Zonation: A Review of Principles and Practice, UNESCO, Paris, Nat. Hazards, 3, 63 pp., 1984.
Wood, N. J. and Good, J. W.: Vulnerability of Port and Harbor Communities to Earthquake and Tsunami Hazards: The Use of GIS in Community Hazard Planning, Coast. Manage., 32, 243–269, https://doi.org/10.1080/08920750490448622, 2004.
Wu, S. Y., Yarnal, B., and Fisher, A.: Vulnerability of coastal communities to sea-level rise: a case study of Cape May County, New Jersey, USA, Clim. Res., 22, 255–270, https://doi.org/10.3354/cr022255, 2002.
Zahran, S., Brody, S. D., Peacock, W. G., Vedlitz, A., and Grover, H.: Social vulnerability and the natural and built environment: a model of flood casualties in Texas, Disasters, 32, 537–560, https://doi.org/10.1111/j.1467-7717.2008.01054.x, 2008.
Zhang, Y. L. and You, W. J.: Social vulnerability to floods: a case study of Huaihe River Basin, Nat. Hazards, 71, 2113–2125, https://doi.org/10.1007/s11069-013-0996-0, 2014.
Zingari, P. C. and Fiebiger, G.: Mountain risks and hazards, Unasylva, 53, 71–77, 2002.