the Creative Commons Attribution 4.0 License.
the Creative Commons Attribution 4.0 License.
 | 23 Oct 2018
Spatial consistency and bias in avalanche forecasts – a case study in the European Alps
Christoph Mitterer
Elisabetta Ceaglio
Cécile Coléou
Samuel Morin
Francesca Rastelli
Ross S. Purves
In the European Alps, the public is provided with regional avalanche forecasts, issued by about 30 forecast centers throughout the winter, covering a spatially contiguous area. A key element in these forecasts is the communication of avalanche danger according to the five-level, ordinal European Avalanche Danger Scale (EADS). Consistency in the application of the avalanche danger levels by the individual forecast centers is essential to avoid misunderstandings or misinterpretations by users, particularly those utilizing bulletins issued by different forecast centers. As the quality of avalanche forecasts is difficult to verify, due to the categorical nature of the EADS, we investigated forecast goodness by focusing on spatial consistency and bias, exploring real forecast danger levels from four winter seasons (477 forecast days). We describe the operational constraints associated with the production and communication of the avalanche bulletins, and we propose a methodology to quantitatively explore spatial consistency and bias. We note that the forecast danger level agreed significantly less often when compared across national and forecast center boundaries (about 60 %) than within forecast center boundaries (about 90 %). Furthermore, several forecast centers showed significant systematic differences in terms of more frequently using lower (or higher) danger levels than their neighbors. Discrepancies seemed to be greatest when analyzing the proportion of forecasts with danger level 4 – high and 5 – very high. The size of the warning regions, the smallest geographically clearly specified areas underlying the forecast products, differed considerably between forecast centers. Region size also had a significant impact on all summary statistics and is a key parameter influencing the issued danger level, but it also limits the communication of spatial variations in the danger level. Operational constraints in the production and communication of avalanche forecasts and variation in the ways the EADS is interpreted locally may contribute to inconsistencies and may be potential sources for misinterpretation by forecast users. All these issues highlight the need to further harmonize the forecast production process and the way avalanche hazard is communicated to increase consistency and hence facilitate cross-border forecast interpretation by traveling users.
- Article
(8752 KB) -
Supplement
(373 KB) - BibTeX
- EndNote


In the European Alps, public forecasts of avalanche hazard are provided throughout the winter. These forecasts – also called advisories, warnings, or bulletins1 – provide information about the current and forecast snow and avalanche conditions in a specific region. In contrast to local avalanche forecasting, e.g., for a transportation corridor or ski area, a regional forecast does not provide information regarding individual slopes or specific endangered objects.
a The avalanche-prone locations are described in greater detail in the avalanche bulletin (altitude, slope aspect, type of terrain): moderately steep terrain: slopes shallower than about 30∘; steep slopes: slopes steeper than about 30∘; very steep, extreme terrain: particularly adverse terrain related to slope angle (more than about 40∘), terrain profile, proximity to ridge, and smoothness of underlying ground surface. b Additional loads: low: individual skier/snowboarder riding softly and not falling, snowshoer, group with good spacing (minimum 10 m); high: two or more skiers/snowboarders without good spacing (or without intervals), snowmobile, explosives; natural: without human influence.
One of the key consumer groups are those undertaking recreational activities, such as off-piste riding and backcountry touring in unsecured terrain. The importance of clearly communicating to this group is underlined firstly by avalanche accident statistics – with on average 100 fatalities each winter in the Alps (Techel et al., 2016), most of which occurring during recreational activities. Secondly, very large numbers of individuals recreate in unsecured winter terrain, with for example Winkler et al. (2016) reporting that more than 2 million winter backcountry touring days were undertaken in 2013 in Switzerland alone. An additional consumer group is local, regional, and national risk management authorities, who base risk reduction strategies such as avalanche control measures, road closures, and evacuation procedures. in part on information provided in regional avalanche forecasts.
In all Alpine countries (Fig. 1), forecasts are disseminated throughout the entire winter, for individual warning regions, together forming a spatially contiguous area covering the entire Alpine region. Furthermore, in all of these countries the European Avalanche Danger Scale (EADS; EAWS, 2018), introduced in 1993 (SLF, 1993), is used in the production and communication of forecasts (EAWS, 2017c).
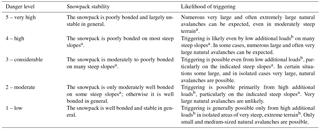
The EADS is an ordinal, five-level scale focusing on avalanche hazard, with categorical descriptions for each danger level describing snowpack (in)stability, avalanche release probability, expected size and number of avalanches, and the likely distribution of triggering spots (Table 1). The EADS describes not only situations with spontaneous avalanches but also conditions where an additional load – such as a person skiing a slope – can trigger an avalanche. These categorical descriptions of each danger level aim to inform users on the nature of avalanche hazard at hand. However, individual danger levels capture a wide range of differing avalanche conditions (e.g., EAWS, 2005; Lazar et al., 2016; EAWS, 2017a; Statham et al., 2018a) and therefore, in isolation, are too basic to be used as a stand-alone decision-making tool (e.g., Météo France, 2012). Additionally, and in order to describe the avalanche hazard in more detail and to provide better advice to the end users on how to manage these hazards, the European Avalanche Warning Services (EAWS) introduced a set of five typical avalanche problems (EAWS, 2017d). Nonetheless, the EADS provides a consistent way of communicating avalanche hazard. Furthermore, the EADS often serves as an important input into basic avalanche education on planning or decision-making heuristics as practiced by many recreationists (e.g., Munter, 1997).
However, the EADS is not only a means of communicating to forecast users. It also impacts on the forecasting process itself, as all forecasters are working to an agreed, common, and at least nominally binding definition of avalanche hazard.
Forecast validation and evaluation is a problem not only in avalanche forecasting but also more generally in forecasting. Murphy (1993), in his classic paper on the nature of a good (weather) forecast, discussed three key elements which he termed consistency, quality and value. Consistency in Murphy's model essentially captures the degree of agreement between a forecaster's understanding of a situation and the forecast they then communicate to the public. Quality captures the degree of agreement between a forecast and the events which occur, and value the benefits or costs incurred by a user as a result of a forecast.
In avalanche forecasting, two key problems come to the fore. Firstly, the target variable is essentially categorical, since, although the EADS is an ordinal scale, a real evaluation of a forecast would compare the forecast danger level, qualitatively defined in the EADS, with the prevailing avalanche situation. Secondly, since the target variable captures a state which may or may not lead to an (avalanche) event, verification of forecast quality is only possible in some circumstances and for some aspects of the EADS, such as the following:
-
At higher danger levels, the occurrence of natural avalanches can sometimes be used to verify the danger level (e.g., Elder and Armstrong, 1987; Giraud et al., 1987; Schweizer et al., 2018).
-
At lower danger levels, the occurrence of avalanches triggered by recreationists or the observation of signs of instability requires users being present.
-
Since the absence of avalanche activity is not alone an indicator of stability, verifying associated danger levels is only possible through digging multiple snow profiles and performing stability tests (Schweizer et al., 2003).
Thus, avalanche danger cannot be fully measured or validated (Föhn and Schweizer, 1995). This in turn means that, at least at the level of the EADS, it is conceptually difficult to directly measure forecast quality. However, Murphy's notion of considering goodness of forecasts in terms of not only their quality but also consistency and value suggests a possible way forward.
Although Murphy defines consistency with respect to an individual forecaster, we believe that the concept can be extended to forecast centers, in terms of the degree to which individual forecasters using potentially different evidence reach the same judgment (LaChapelle, 1980), and across forecast centers, in terms of the uniformity of the forecast issued by different forecast centers in neighboring regions. This reading of consistency is, we believe, true to both Murphy's notion (how reliably a forecast corresponds with a forecaster's best judgment) and broader notions of consistency stemming from work on data quality and information science (Ballou and Pazer, 2003; Bovee et al., 2003).
Inconsistencies in the use of the danger levels between neighboring warning regions and forecast centers may be a potential source of misinterpretations to users traveling from one region to another, unless these differences are only due to avalanche conditions. The main goal of this study is therefore to investigate if such spatial inconsistencies and biases exist. We do so by quantifying bias between neighboring forecast centers and warning regions in time and space. While we do not expect spatial homogeneity, a stronger bias and a lower agreement rate in neighboring warning regions of different forecast centers than within forecast domains may indicate such inconsistencies. To do so, we first describe the operational constraints under which avalanche forecasts are produced and communicated. Then, we present methods appropriate for exploring spatial consistency and bias in the use of EADS given the operational constraints described above. We address the following three research questions:
-
Does bias between forecast centers exist?
-
Can operational constraints (such as the size of the warning regions) or the elevation of warning regions explain these differences?
-
What implications do the biases identified have for users of avalanche forecasts?
In the following, we introduce the most important standards, concepts, and definitions used in avalanche forecast products in the European Alps. We describe the situation during the winters 2011/2012 until 2014/2015, as these are the years we explore quantitatively in this study.
2.1 Avalanche warning services and forecast centers
Avalanche warning services (AWSs) are national, regional, or provincial agencies in charge of providing publicly available forecasts of avalanche hazard (EAWS, 2017c). AWSs also have voting rights at the General Assembly of the EAWS. An AWS may be a service either with a single forecast center (e.g., the national service in Switzerland or the regional AWS of the federal states in Austria) or with several forecast centers at different locations (e.g., the AWS Météo-France in France with four forecast centers in the Alps or the two AWSs in Italy (Associazione Interregionale Neve e Valanghe (AINEVA) and Meteomont Carabinieri) with their provincial and regional centers.
Generally, albeit with the exception of Italy, a single forecast covering a (number of) warning region(s) is issued by the respective forecast center (Table 2, Fig. 1). In the case of Italy, forecast centers belonging to AINEVA and Meteomont Carabinieri independently provide forecasts covering the same Alpine regions, while in Livigno (LIV in Fig. 1) a regional forecast is also issued by the municipality. Even though the forecast products provided by the individual forecast centers may differ in their structure, we assume they adhere to the principles defined by the European Avalanche Warning Services (EAWS, 2017c).
Table 2Overview of the forecast centers considered in this study. Italian forecast centers refer to AINEVA, except those indicated in italic for Meteomont Carabinieri. Forecast centers and warning regions outside the Alps are not shown. Three-letter abbreviations indicate forecast centers. For countries, we use English names; for forecast centers, we use the names in their original language.
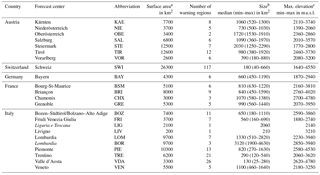
a Rounded to nearest 100 km2. b Rounded to nearest 10 km2. c Rounded to nearest 10 m. The size, as shown here and in Fig. 3a, was calculated using the R package raster (Hijmans, 2016). The range of the maximum elevations describes the range of the highest elevation calculated using a digital elevation model with 90×90 m cell resolution (Jarvis et al., 2008; SRTM, 2017) per warning region and forecast center (Fig. 3b).
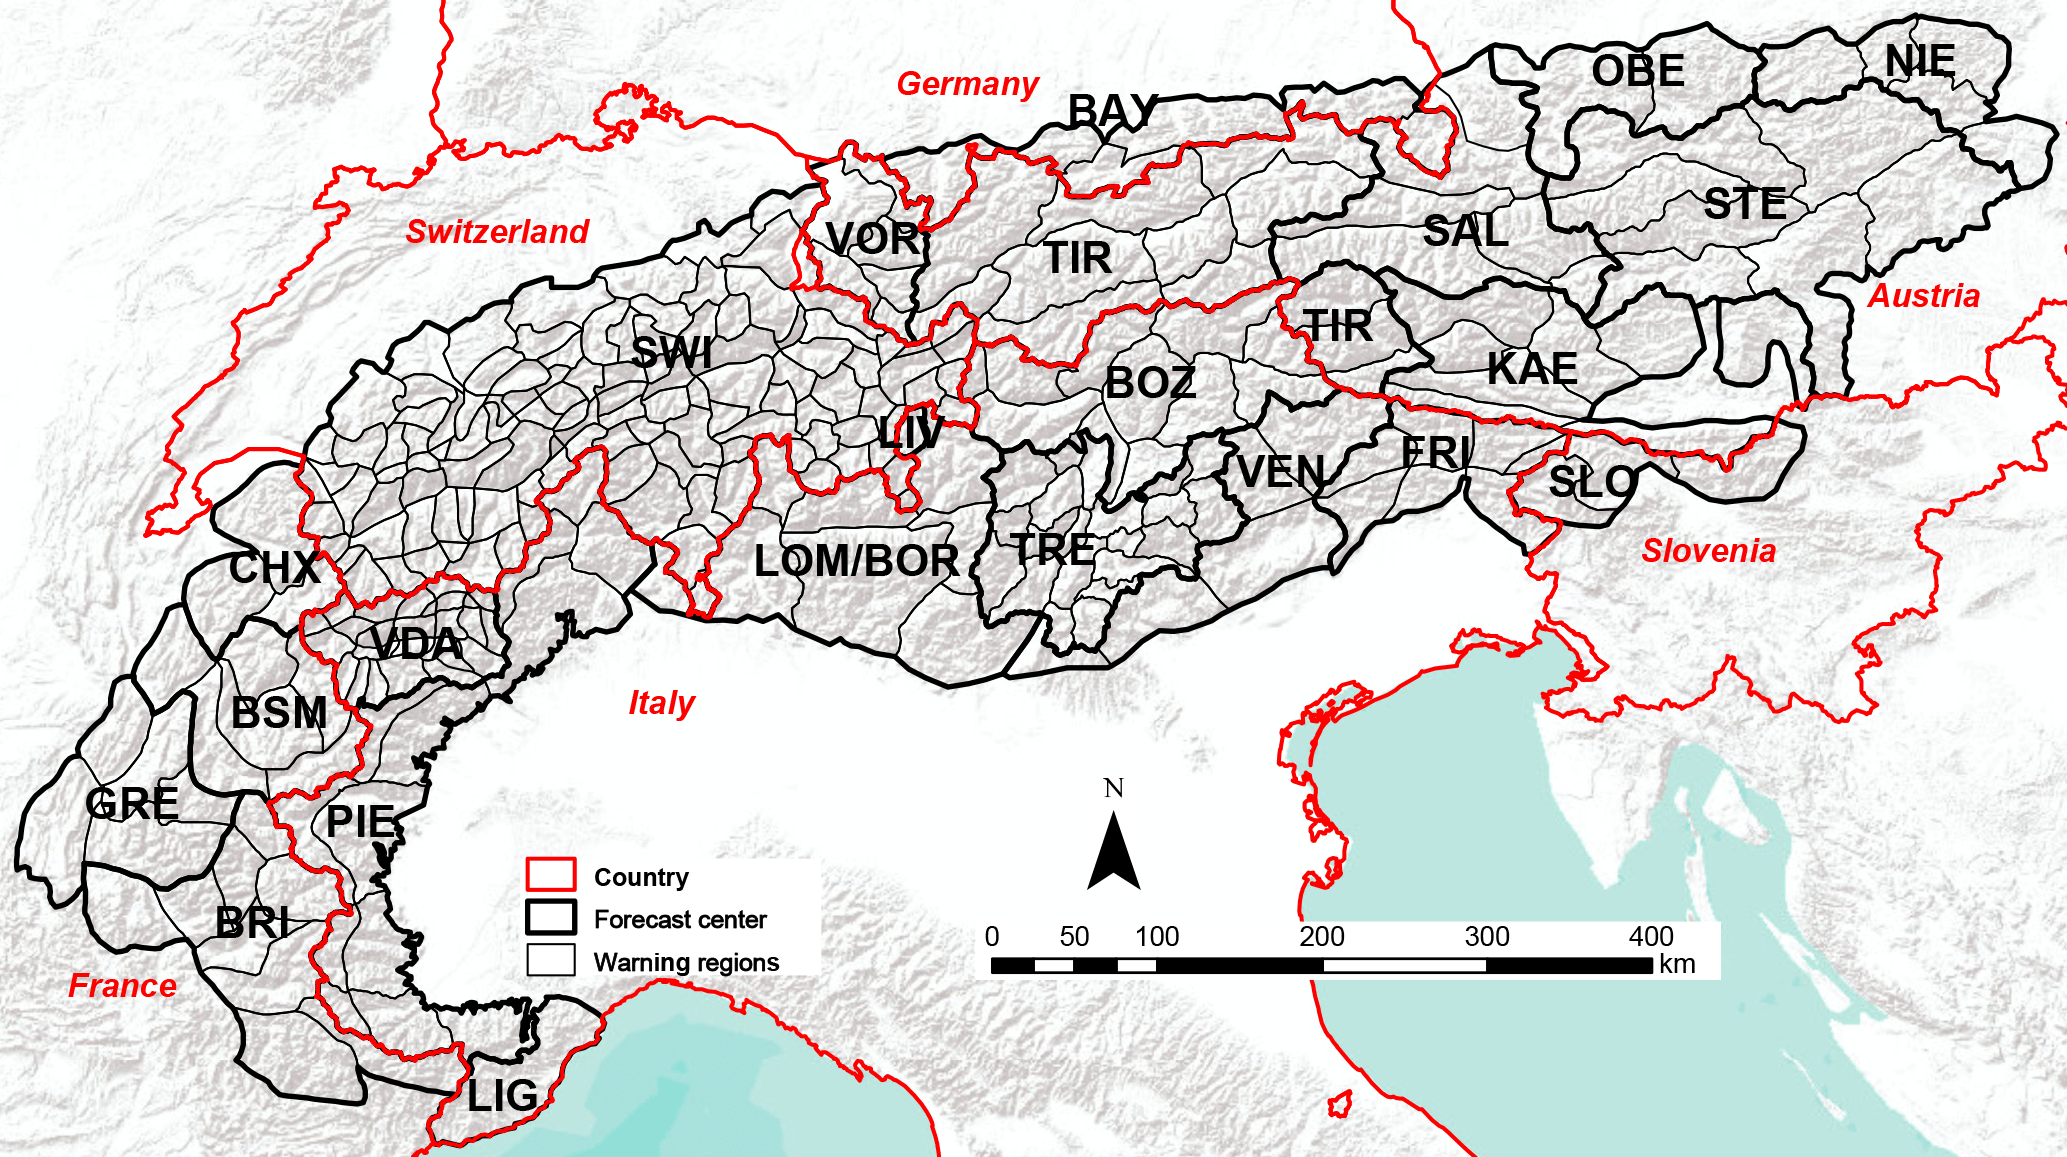
Figure 1Map showing the relief of the European Alps (gray shaded background) with the outlines of the individual forecast centers (bold black polygons, three-letter abbreviations) and the warning regions, the smallest geographically defined regions, used in the respective avalanche forecasts (black polygons). The borders of the Alpine countries are marked red. In the Italian Alps, where two avalanche warning services provide forecasts (Associazione Interregionale Neve e Valanghe (AINEVA) and Meteomont Carabinieri), the warning regions generally follow AINEVA. An exception is Liguria e Toscana (LIG, Meteomont Carabinieri). The forecast domains of LOM (AINEVA) and BOR (Meteomont Carabinieri) are identical; however, the three warning regions for BOR are not shown on the map. The forecast domain LIV is superposed onto parts of LOM/BOR (map source: ESRI, 2017). Note that the map captures the situation and partitioning during the period under study.
2.2 Avalanche forecasts
Avalanche forecasts are the primary means for avalanche warning services to provide publicly available information about current and forecast snow and avalanche conditions in their territory. They may take the form of a single advisory, describing the current situation, or an advisory and forecast for one or more days. Typically, avalanche forecasts contain the following information, ranked according to importance (information pyramid; EAWS, 2017b):
-
avalanche danger level according to the EADS (Table 1);
-
most exposed terrain – defining the terrain where the danger is particularly significant (see Sect. 2.5);
-
typical avalanche problems – describing typical situations encountered in avalanche terrain (EAWS, 2017d);
-
hazard description – a text description providing information concerning the avalanche situation;
-
information concerning snowpack and weather.
In this study, we exclusively explore the forecast regional avalanche danger level. However, we also describe how the danger level is communicated in relation to the most exposed terrain (by elevation) and to its temporal evolution during the day, as this differs between forecast centers and could influence the results.
2.3 Temporal validity and publication frequency
The issuing time, temporal validity, and publication frequency of the forecasts vary between forecast centers. For the four explored winters, these can roughly be summarized in five groups (the “normal” cases are described, though exceptions exist; see also Fig. 2):
-
Bulletins are published daily in the morning (generally around 07:30 CET2) and are normally valid for the day of publication (typical for bulletins in Austria, Germany, and LIV (Italy)).
-
Forecasts are published daily in the afternoon (16:00 CET) and are valid until the following day (France).
-
During the main winter season (often from early December until after Easter), forecasts are published twice daily. The main forecast, published at 17:00 CET and valid until 17:00 CET the following day, is replaced by an update the following morning at 08:00 CET (Switzerland).
-
Bulletins are published several times a week (at least on Monday, Wednesday, and Friday). Bulletins are issued between 11:00 and 17:00 CET and describe the avalanche conditions on the day of publication, the following day, and the day after (typically forecast centers belonging to AWS AINEVA). In more recent years, publication frequency has increased towards becoming daily.
-
Bulletins are published at 14:00 CET, describing the current situation and the forecast for the next day(s). Forecasts are published daily, except on public holidays (AWS Meteomont Carabinieri).
Most of the forecast centers can update their forecast product when conditions change significantly.
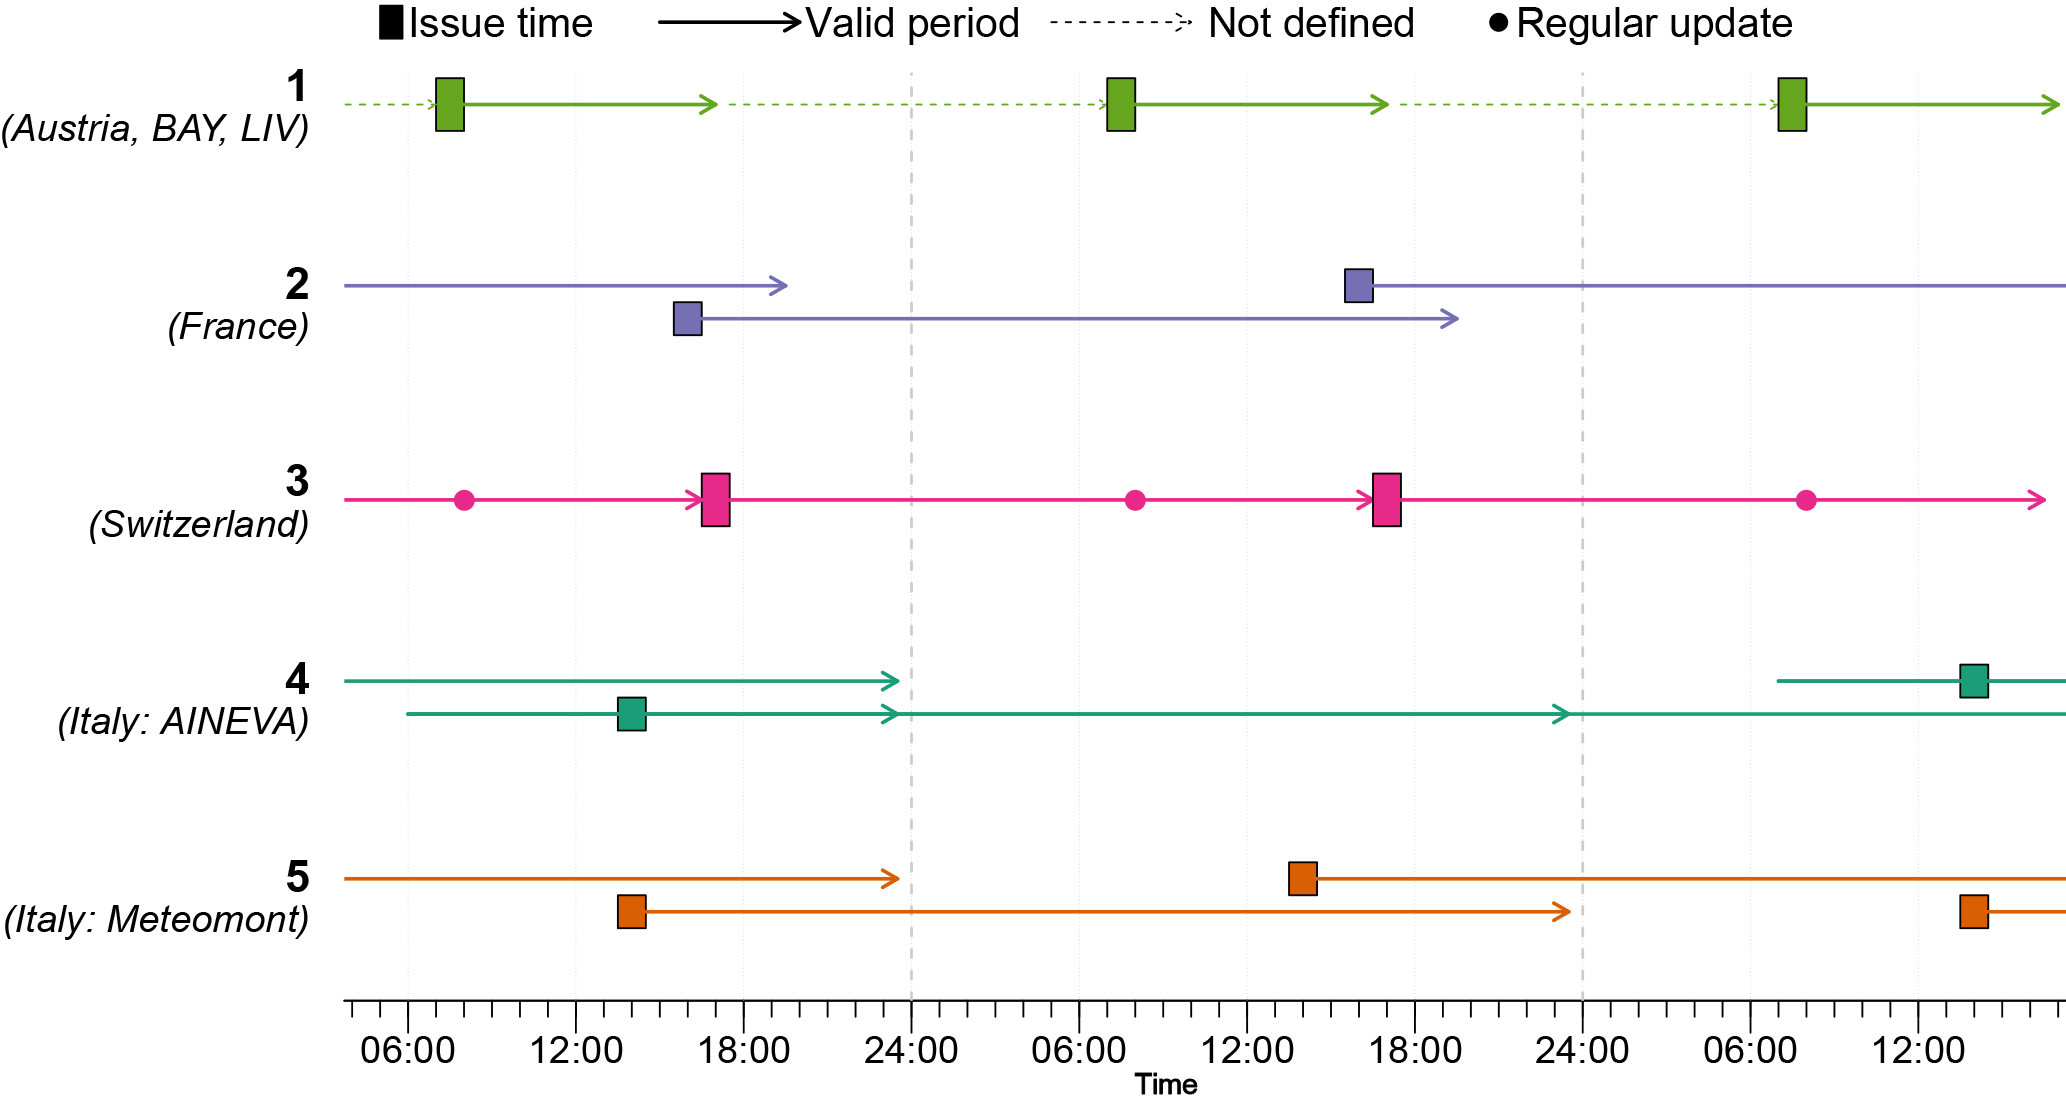
Figure 2Schematic summary of the different bulletin publication frequencies, issuing times, and periods of validity. In special circumstances, updates during the morning were possible in most forecast centers. Particularly for Italy (AINEVA), it is of note that the exact publication times, valid periods, and publication frequencies may differ between forecast centers, but changes may also have been introduced from one season to the next. Forecast centers are labeled according to Table 2.
2.4 Warning regions
Warning regions are geographically clearly specified areas permitting the forecast user to know exactly which region is covered by the forecast. They may be delineated by administrative boundaries (e.g., between countries, federal states, or regions and provinces); describe climatologically (e.g., in France; Pahaut and Bolognesi, 2003), hydrologically, or meteorologically homogeneous regions; or may be based on orographic divisions (e.g., Italy; Marazzi, 2005) or a combination of these (e.g., Valle d'Aosta (VDA); Burelli et al., 2012). Generally, warning regions are larger than the minimal spatial resolution of a regionally forecast avalanche danger level, and they are therefore recommended to have a size of about 100 km2 or larger (EAWS, 2017c).
The median size of the warning regions is 350 km2 with considerable variations (Fig. 3a, Table 2). Twenty-five percent of the smallest warning regions (size < 160 km2, all located in Switzerland (SWI), Trentino (TRE), and VDA) are almost 10 times smaller than 10 % of the largest regions (size > 1310 km2). Particularly large spatial units are used by the forecast centers covering the region of Lombardia (BOR) and the Ligurian Alps (LIG, both AWS Meteomont Carabinieri, Italy) and in Oberösterreich (OBE, Austria; size > 1900 km2, Table 2).
The size of the warning regions depends on the approach used by an AWS to define the warning regions and to externally communicate avalanche danger. In its simplest case (see variations introduced in next section), a single danger level either is explicitly communicated for each warning region (e.g., in Austria, France, Germany, and often Italy) or may be communicated for an aggregation of warning regions (SWI, TRE, and VDA).
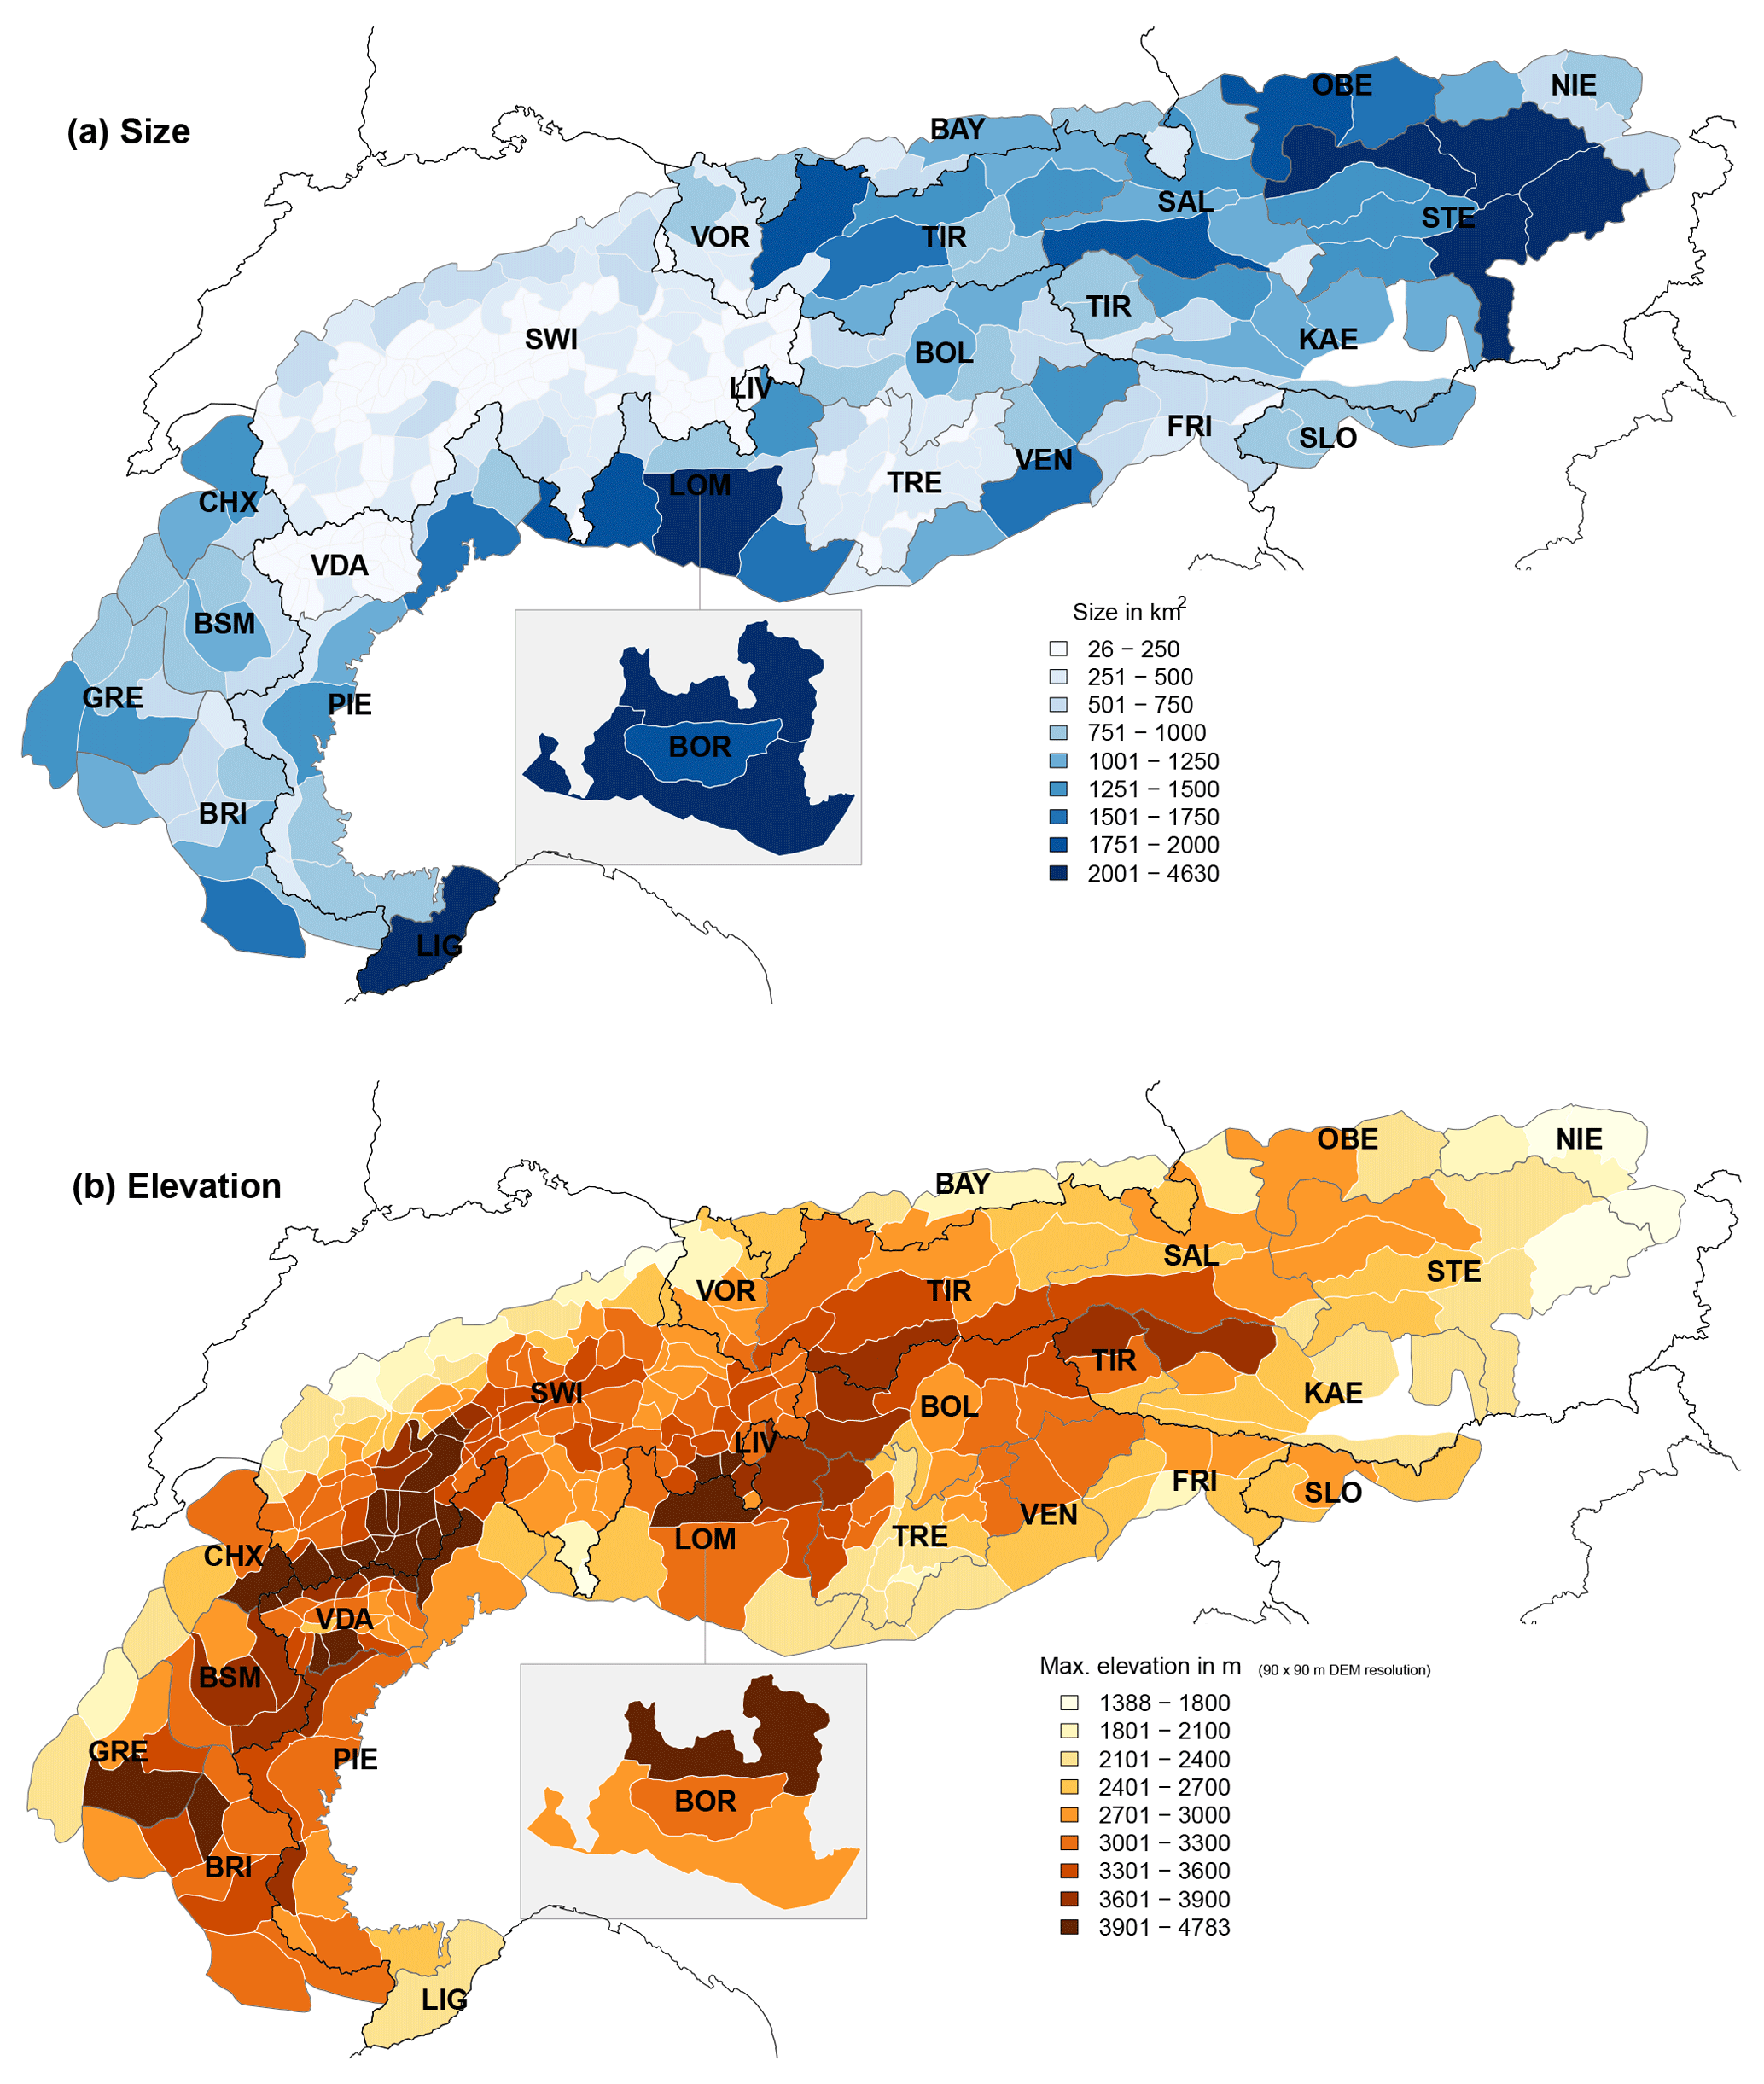
Figure 3Map showing the European Alps with the individual warning regions (white polygon outlines) and (a) their size (color shading of polygon) and (b) their maximum elevation (color shading of polygon). Additionally, national (black lines) and forecast center boundaries (gray polygon outlines) are shown. To visualize the (at least partially) overlapping forecast regions in the Italian region of Lombardia, LIV is superposed onto parts of LOM, while BOR is placed as an inset to the south of LOM. Forecast centers are labeled according to Table 2.
2.5 Concepts for communicating temporal changes and elevational gradients in danger level
The communication of the most exposed elevations and slopes and expected temporal changes is important information provided in avalanche forecasts.
2.5.1 Temporal differences in danger rating within forecast period
All forecast centers communicate significant changes (increasing or decreasing danger level) during the valid period of a forecast. In most cases, this is done graphically using either icons or two maps, and only rarely using text.
In cases when two danger levels are indicated, the first time step often refers to the avalanche danger in the morning, and the second time step indicates a significant change during the day. Changing danger ratings may refer to either changes in dry- or wet-snow avalanche hazard, or changes from dry to wet snow (or vice versa). However, exceptions to these generalizations exist: in France, but occasionally in forecasts of other forecast centers too, the two time steps may refer to day and night, morning and afternoon, or before and after a snowfall. Switzerland is the only warning service where an increase in danger rating for wet-snow situations (typically in spring conditions) is presented using a map product if the wet-snow rating is higher than the dry-snow rating in the morning, but an increase in dry-snow avalanche hazard during the day is exclusively conveyed in text form within the danger description.
2.5.2 Elevational differences in danger rating
All forecast centers provide information concerning the most exposed elevations, often in graphical form using icons. The elevational threshold indicated in the bulletin may relate to a difference in danger rating (for instance higher above a certain elevation), to differences in the avalanche problem and the most likely type of avalanche expected (e.g., wet-snow avalanches below and dry-snow avalanches above the indicated elevation), or to a combination thereof.
The forecast centers use three different ways to communicate elevational differences in the danger rating. In Switzerland and Italy, the danger rating refers to the most exposed elevations, with no indication of the (lower) danger rating at other elevations. In France, Germany, and some regions in Austria, two separate danger ratings are often provided (one above and one below a certain elevation level), while the forecast center LIV in northern Italy assigns a danger rating to the three elevation bands below tree line, tree line, and alpine (as done in North American avalanche forecasts).
We approached all the warning services in the Alps concerning the forecast danger level for each warning region and day for the 4 years from 2011/2012 to 2014/2015 and received data from 23 of the 30 forecast centers (data set: Techel, 2018).
3.1 Avalanche danger level data
In most cases, data were provided directly from the warning services or forecast centers. Exceptions include the following:
-
Kärnten (KAE, Austria), where data were extracted from the annual reports ÖLWD (2012)–ÖLWD (2015);
-
Bayern (BAY, Germany), where data were collected from the web archive of the Bavarian warning service;
-
AINEVA forecast centers Friuli Venezia Giulia (FRI), Lombardia (LOM), and Veneto (VEN) in Italy, where data were provided by M. Valt/VEN (extracted from the central AINEVA database).
The most relevant information concerning differences in raw data analyzed is displayed in Table 3. The danger level was generally valid for the day of publication (day+0) in Austria, Germany, and LIV (scenario 1 in Sect. 2.3), represented essentially a 1-day forecast (day+1) in France and Switzerland (although the valid period started already on the afternoon of publication; scenarios 2 and 3 in Sect. 2.3), and was a mix of current-day assessments and forecasts with a lead time of 1 or 2 days (day+2) in Italy. In Italy (AWS AINEVA), the most recently published valid danger level was used (e.g., an afternoon update valid for the current day (day+0) replaced a forecast with a lead time of 2 days (day+2)). Furthermore, publication frequency increased during the explored time period in some of the AINEVA forecast centers (i.e., in Piemonte (PIE) to weekdays and in Bozen–Südtirol/Bolzano–Alto Adige (BOZ) additionally on Saturdays). Similarly, the validity of the bulletin on the issuing day changed at some Italian forecast centers from a current-day assessment to a 1-day forecast (i.e., BOZ changed in 2014 from day+0 to day+1), or vice versa (AWS Meteomont Carabinieri: Lombardia (BOR) and LIG changed in 2014 from day+1 to day+0).
Temporal differences in danger level within the forecast period were available for all forecasts except those by BOR and LIG (Italy) and KAE (Austria). In both cases, only the highest danger level per day was available. The data extracted from the AINEVA database (forecast centers FRI, LOM, and VEN) indicated not only the danger level but also whether the danger rating increased, stayed the same, or decreased.
In France spatial variations in the danger level within the same warning region (Dspatial) were sometimes indicated (e.g., in a bulletin this could read “2 – moderate in the west, 3 – considerable in the east” of a region).
Table 3Overview of the data used in this study. Forecast centers are summarized according to data source, format, and content. Dt1 and Dt2 – danger level time step 1 and 2, respectively; De – concept of elevational danger ratings; Dspatial – more than one rating per warning region referring to spatial differences. Danger levels may refer to the day of publication (day + 0), the following day (day + 1), or the day after (day + 2). Forecast centers are labeled according to Table 2.
* (yes): AINEVA database provided information on whether danger level changed, but not to which danger level; De: concept of assigning 1, 2, or 3 danger ratings (Sect. 2.5); data source: ÖLWD – from Austrian winter reports ÖLWD (2012)–ÖLWD (2015); directly – directly from respective forecast center; website – from website of Bavarian Avalanche Warning Service; AINEVA – extracted from central AINEVA database (M. Valt (VEN)).
The quantitative part of this study is twofold: first, we make pairwise comparisons of neighboring warning regions, and second, we visualize and detect patterns at larger scales than individual warning regions.
4.1 Topological neighbors
We defined warning regions i and j as topological neighbors whenever they shared more than one point of their polygon boundary with each other (rook mode; Dale and Fortin, 2014; R package spdep: Bivand et al., 2013; Bivand and Piras, 2015). For this purpose, the shapes of the warning regions had to be slightly adjusted so that the coordinates of joint borders matched. This also reflects challenges of working across borders, with different map projections and simplified outlines of warning regions. For the particular case of the three forecast centers in Lombardia (BOR, LIV, and LOM), we defined them as neighbors if they shared either a common polygon boundary or at least partially the same territory (shapefiles in data by Techel, 2018).
4.2 Avalanche danger level statistics
We refer to danger levels D either using their integer value (e.g., D=1 for 1 – low) or by integer value and signal word combination 1 – low. Similarly to previous studies (e.g., Jamieson et al., 2008; Techel and Schweizer, 2017), we use the integer value of danger levels to calculate proportions and differences.
4.2.1 Data preparation
We explored the forecast danger levels at the spatial scale of the individual geographically clearly delineated warning regions. The following cases were treated separately.
Austria, Germany, France – occasional updates during the morning. In special circumstances, bulletins were updated during the day and the danger level was adjusted. These cases were rare (for instance in BAY and TIR twice during the explored four winters). These updates were not considered in the analysis. The data provided by France, where morning updates are also possible until 10:00 CET, already included such updates.
France – spatial gradients within the same warning region. In France, forecasters sometimes communicated two danger ratings for the same warning region expressing a spatial gradient. These cases were rare (0.4 % of warning regions and days; Bourg-St-Maurice (BSM): 1 %; Briançon (BRI): 0.3 %: Chamonix (CHX): 0.1 %; Grenoble (GRE): 0 %). For these forecasts, we randomly picked one of the two danger levels. The remainder of the forecasts expressed no spatial gradients.
Switzerland (SWI) – evening forecast; danger ratings communicated in text form only. We used the forecast issued at 17:00 CET, rather than the updated forecast the next morning (08:00 CET) as, until the winter 2012/2013, the daily morning update was issued only for parts of the Swiss Alps. Furthermore, we only analyzed the danger ratings published in the map product, and not those only described in the forecast text (Sect. 2.5).
Italy (AINEVA forecast centers FRI, LOM, and VEN) – forecast danger level changed during valid bulletin period. Data extracted from the AINEVA database provided the danger level valid in the morning, and whether the danger level changed during the day (increase, no change, decrease), but not which danger level was forecast following the change. To supplement this information, we utilized the distributions of the four AINEVA forecast centers which consistently provided the second danger rating (BOZ, PIE, TRE, VDA). In these forecasts, danger level changed by one level in 85 % of cases and by two levels in 15 % of cases. For the bulletins in FRI, LOM, and VEN we assumed a one-level difference for days with changing conditions, and hence a somewhat more conservative value than in the other Italian bulletins.
Standardizing the length of the forecasting period during the season. The length of the main forecasting season is considered as being between 14 December and 16 April. During this time, and with the exception of the 2014/2015 winter (28 December–16 April), there was a danger rating in at least 95 % of the warning regions in the Alps (477 days, 4 winters).
4.2.2 Danger ratings Dmax and Dmorning
We created two subsets of data (Dmax and Dmorning) to accommodate the different ways avalanche danger ratings are communicated in forecasts and stored in databases, and to ascertain that no bias was introduced by these differences.
We defined Dmax as the highest danger rating valid during a forecast period, regardless of whether this was the only rating provided, whether this was for a first or second time step, or whether it corresponded to a difference in danger level by elevation. It is of note that Dmax is sometimes only valid for part of the day or part of the elevation range.
In contrast, Dmorning refers to the maximum danger rating for the first of the two time steps, which in many cases would be considered valid for the morning. Here, it is of note that exact time when a change occurs is never provided in the published forecasts and is only categorically described within the danger description. This was calculated for all forecast centers except Lombardia (BOR), LIG, and KAE, where this information was not available.
4.2.3 Summary statistics
Warning-region-specific summary statistics. For each warning region, we calculated the proportion of forecasts issuing a specific danger level (i.e., forecasts with danger level D=4). Furthermore, for each warning region we calculated the surface area, which we refer to as the size of a warning region, using the R package raster (Hijmans, 2016) and the maximum elevation (ArcGIS software). The latter is based on a 90×90 m digital elevation model (ESRI, 2017).
Pairwise comparison of immediately neighboring warning regions. We compare the forecast danger level in two neighboring warning regions i and j by calculating the difference in the forecast danger level ΔD for each day for all days with Di≥1 and Dj≥1, where D may refer to Dmax or Dmorning. The proportion of days when the forecast danger levels agreed (Pagree) is then
Pagree may be interpreted as an indicator of spatial correlation or measure of spatial continuity in avalanche conditions.
For neighboring warning regions i and j, we calculated a bias ratio Bij similar to Wilks (2011, p. 310):
where N(ΔD+) is the number of days with Di≥Dj and N(ΔD−) the number of days with Di≤Dj. Bij>1 indicates region i more frequently having higher danger levels than region j, Bij=1 indicates a perfectly balanced distribution, and indicates Bij < 1 a skew towards more often higher danger levels in region j compared to i. We tested whether the bias Bij was significantly unbalanced, by comparing the observed distribution of the two outcomes (N(ΔD+), N(ΔD−)) to a random distribution using the binomial test (R: binom.test; R Core Team, 2017). The resulting p value depends on the deviation of Bij from 1 and on the number of days N(ΔD≠0). In general, bias values Bij<0.95 or Bij>1.05 were statistically significant (p < 0.05).
The distance between warning regions refers to the distance between the center points of the respective warning regions.
Sensitivity and correlation. We tested whether removing subsets of the data (for instance individual years) or using Dmorning compared to Dmax influenced the rank order of the warning regions using the Spearman rank order correlation coefficient ρ. Similarly, we used ρ to explore whether the frequency at which a specific danger level was issued correlated with differences in the size (Δsize) or in the maximum elevation (Δelevation) of two warning regions: i and j.
We compared populations using the Wilcoxon rank-sum test (Wilks, 2011, pp. 159–163). We consider p≤0.05 as significant.
5.1 Forecast danger levels
Figure 4 summarizes the distribution of issued danger levels across the Alps during the 4 years (477 forecast days, 281 warning regions). Danger levels 2 – moderate and 3 – considerable are forecast about 80 % of the time, regardless of whether we consider the forecast danger level valid in the first time step, often corresponding to the situation in the morning (Dmorning; Fig. 4a), or the highest danger level issued (Dmax; Fig. 4b). Particularly in spring situations, when avalanche hazard often increases with daytime warming, the afternoon rating is higher than the morning one; hence these two distributions differ significantly (p < 0.01). However, as often the results obtained using Dmax and Dmorning were very similar, in the following we only present results if these differed significantly.
In order to address research questions 1 and 2, we explore agreement and bias (Sect. 5.2), the proportion of forecasts at the upper and lower end of the EADS (Sects. 5.3 and 5.4), and the proportion of changing danger ratings during the day (Sect. 5.5). Additionally, we explore the influence of the size of the warning regions on the spatial variability in danger ratings and on the proportion of forecasts with danger levels 4 – high and 5 – very high (Sect. 5.6). Finally, we present two case studies to illustrate different aspects of these results in practical situations (Sect. 5.7).
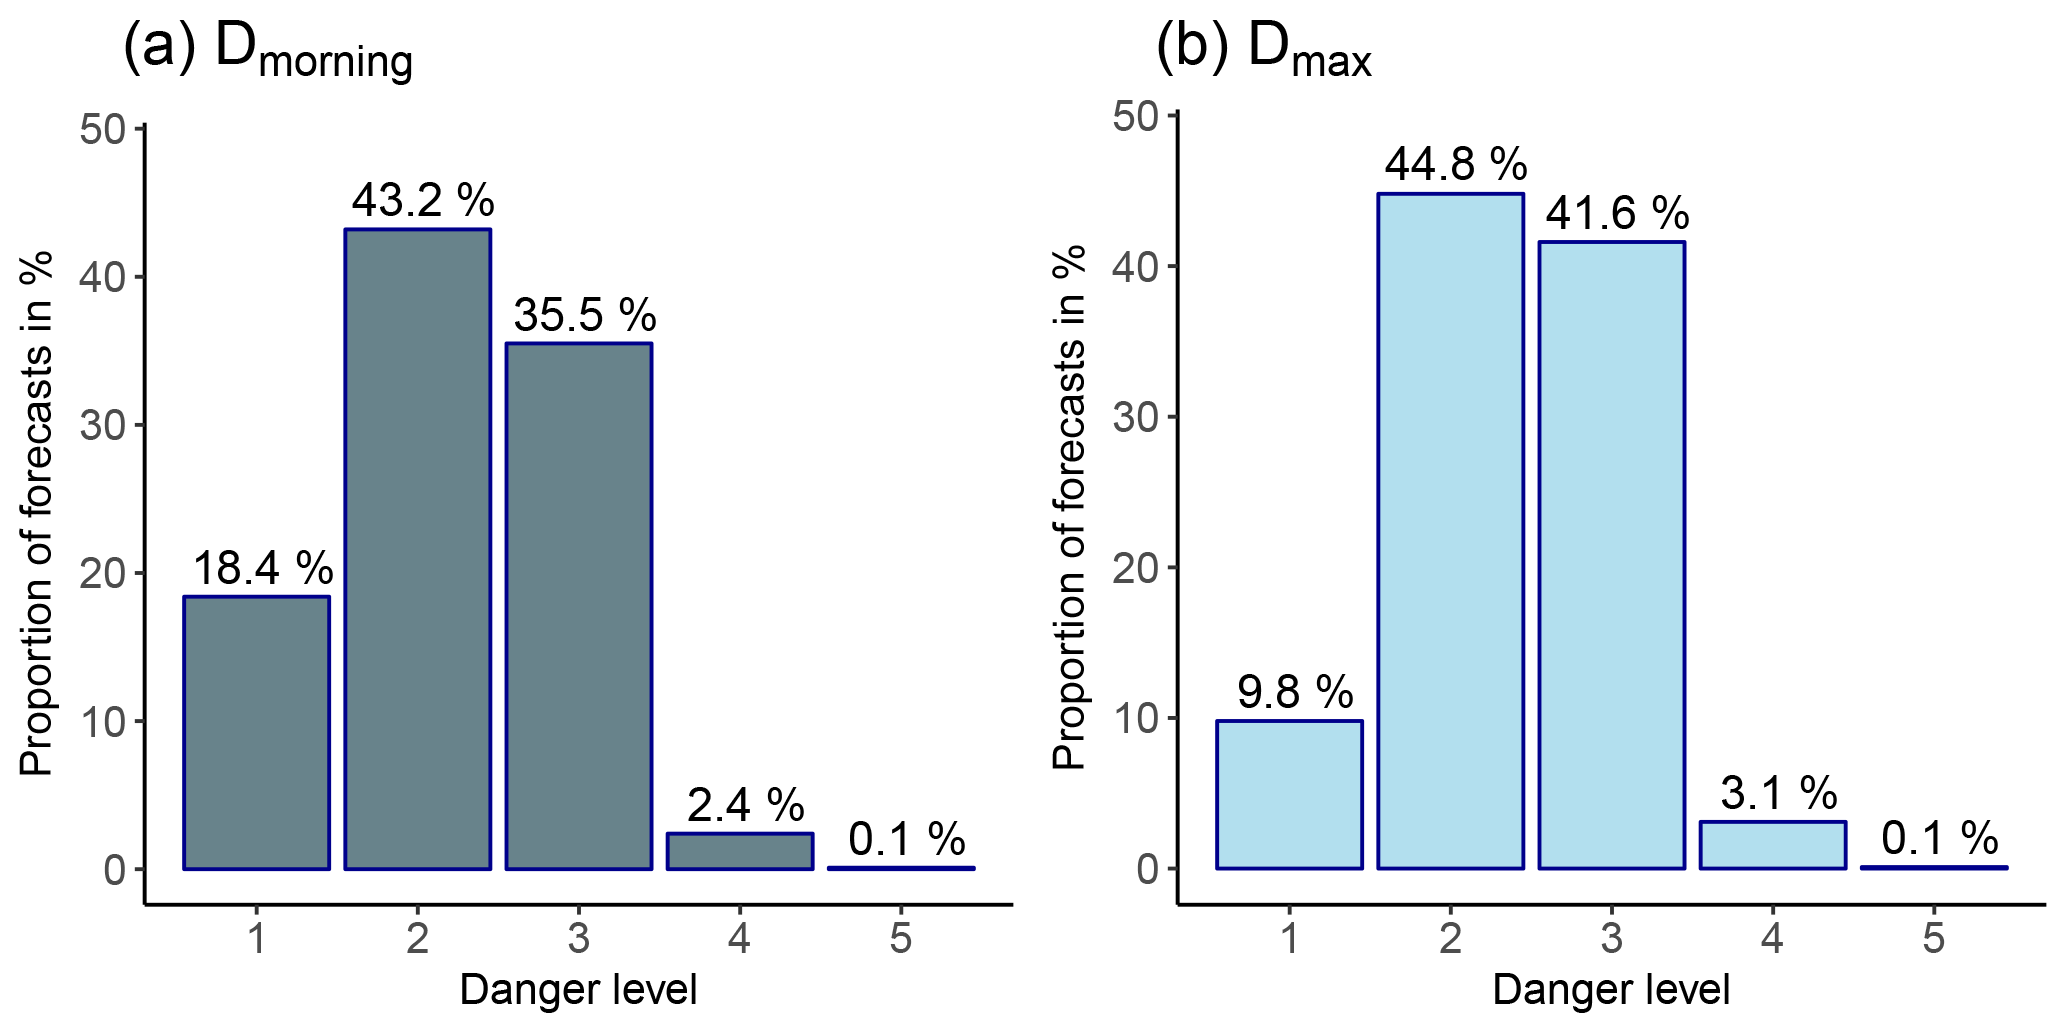
Figure 4Distribution of forecast danger levels, for (a) Dmorning (danger level valid during first time step) and (b) Dmax (highest danger level). Mean values are shown for all the warning regions in the Alps taken together.
5.2 Comparing immediately neighboring warning regions: agreement and bias
The forecast danger level agreed in 83 % of the cases (median Pagree) between two neighboring warning regions.
Pagree was significantly higher when comparing warning regions within forecast center boundaries (91 %; interquartile range (IQR): 83 %–96 %) compared to those across forecast center boundaries (63 %; IQR: 58 %–70 %; p < 0.001), or across national borders (62 %; IQR: 58 %–66 %; p < 0.001). The latter values were not significantly different. Exploring the agreement rate graphically on a map by emphasizing borders with Pagree ≤ 80 % essentially captures almost all forecast center boundaries and comparably few boundaries within forecast center domains (Fig. 5). This result is confirmed when using only a subset of the warning region pairs, with Δelevation < 250 m and the size of the larger region being less than 1.5 times the size of the smaller region (Fig. 6). For this subset, the median agreement Pagree is about 30 % lower across forecast center boundaries than within those (Pagree (same forecast center) = 93 %; Pagree(different forecast center) = 63 %; p < 0.001; Fig. 6). Even when removing the data of the forecast centers in SWI, TRE, and VDA, with median Pagree values of 95 %, the difference remains highly significant (Pagree(within forecast center domain) = 87 %; Pagree(across forecast center domains) = 63 %; p < 0.001).
Similar results are noted for the special case of the three forecast centers in the Italian region of Lombardia (BOR, LIV, LOM). For these partially overlapping warning regions Pagree was 63 % and thus similar to Pagree across national borders or forecast centers neighboring each other.
Within the boundaries of forecast centers, there was a weak but significant correlation between Pagree and differences in the elevation of two neighboring regions (; p<0.001), with larger differences in elevation corresponding to a lower agreement rate. There was also a weak correlation between Pagree and differences in the size of the warning regions (; p < 0.001), where agreement increases as the size difference between warning regions decreases.
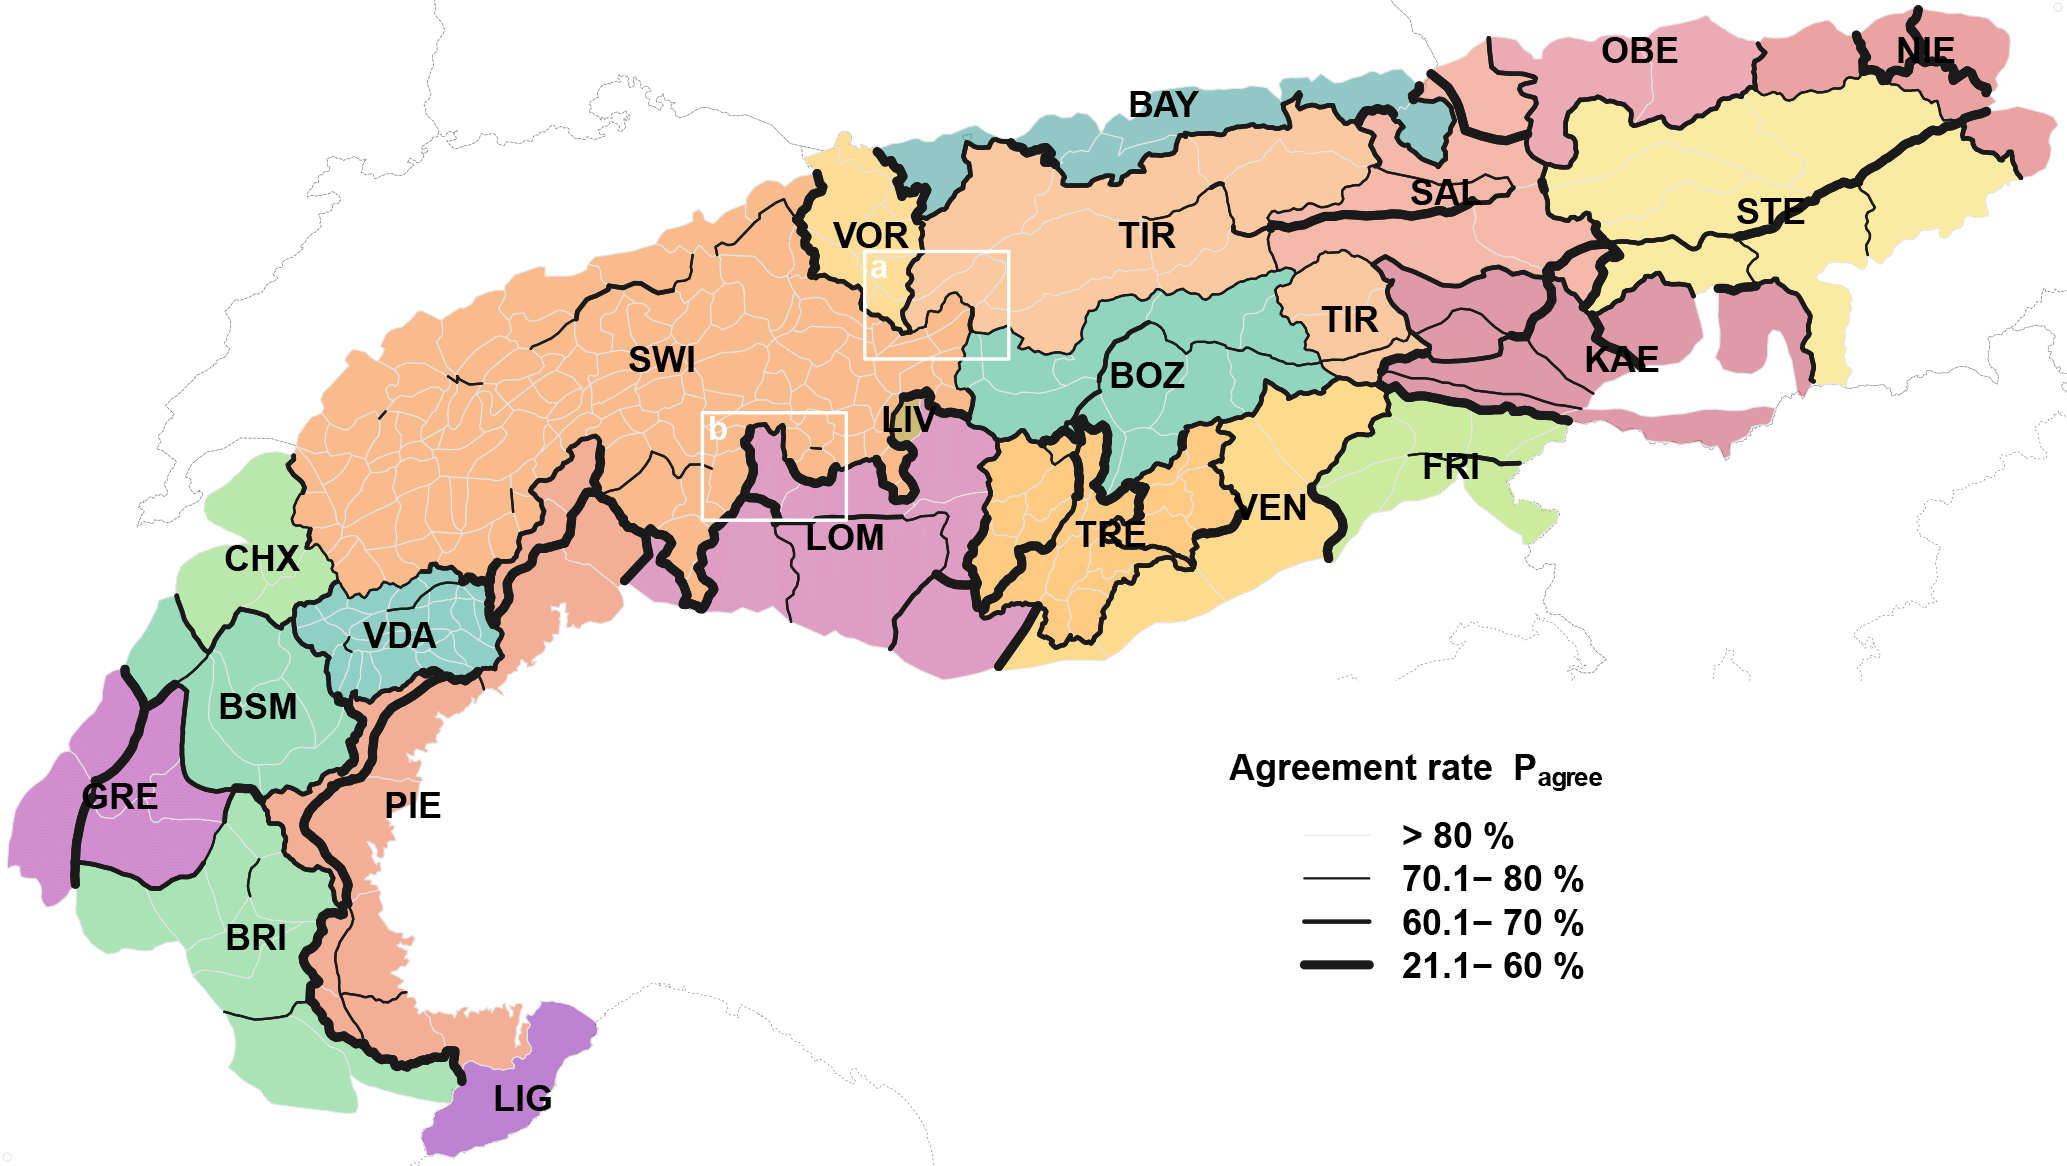
Figure 5Map showing the individual forecast center domains in the European Alps (different colors, three-letter abbreviations; see Table 2). The borders between warning regions are highlighted depending inversely on the agreement rate Pagree, with thicker lines corresponding to more frequent disagreements. The two white boxes (a, b) mark the two regions discussed in more detail in Sect. 5.7.
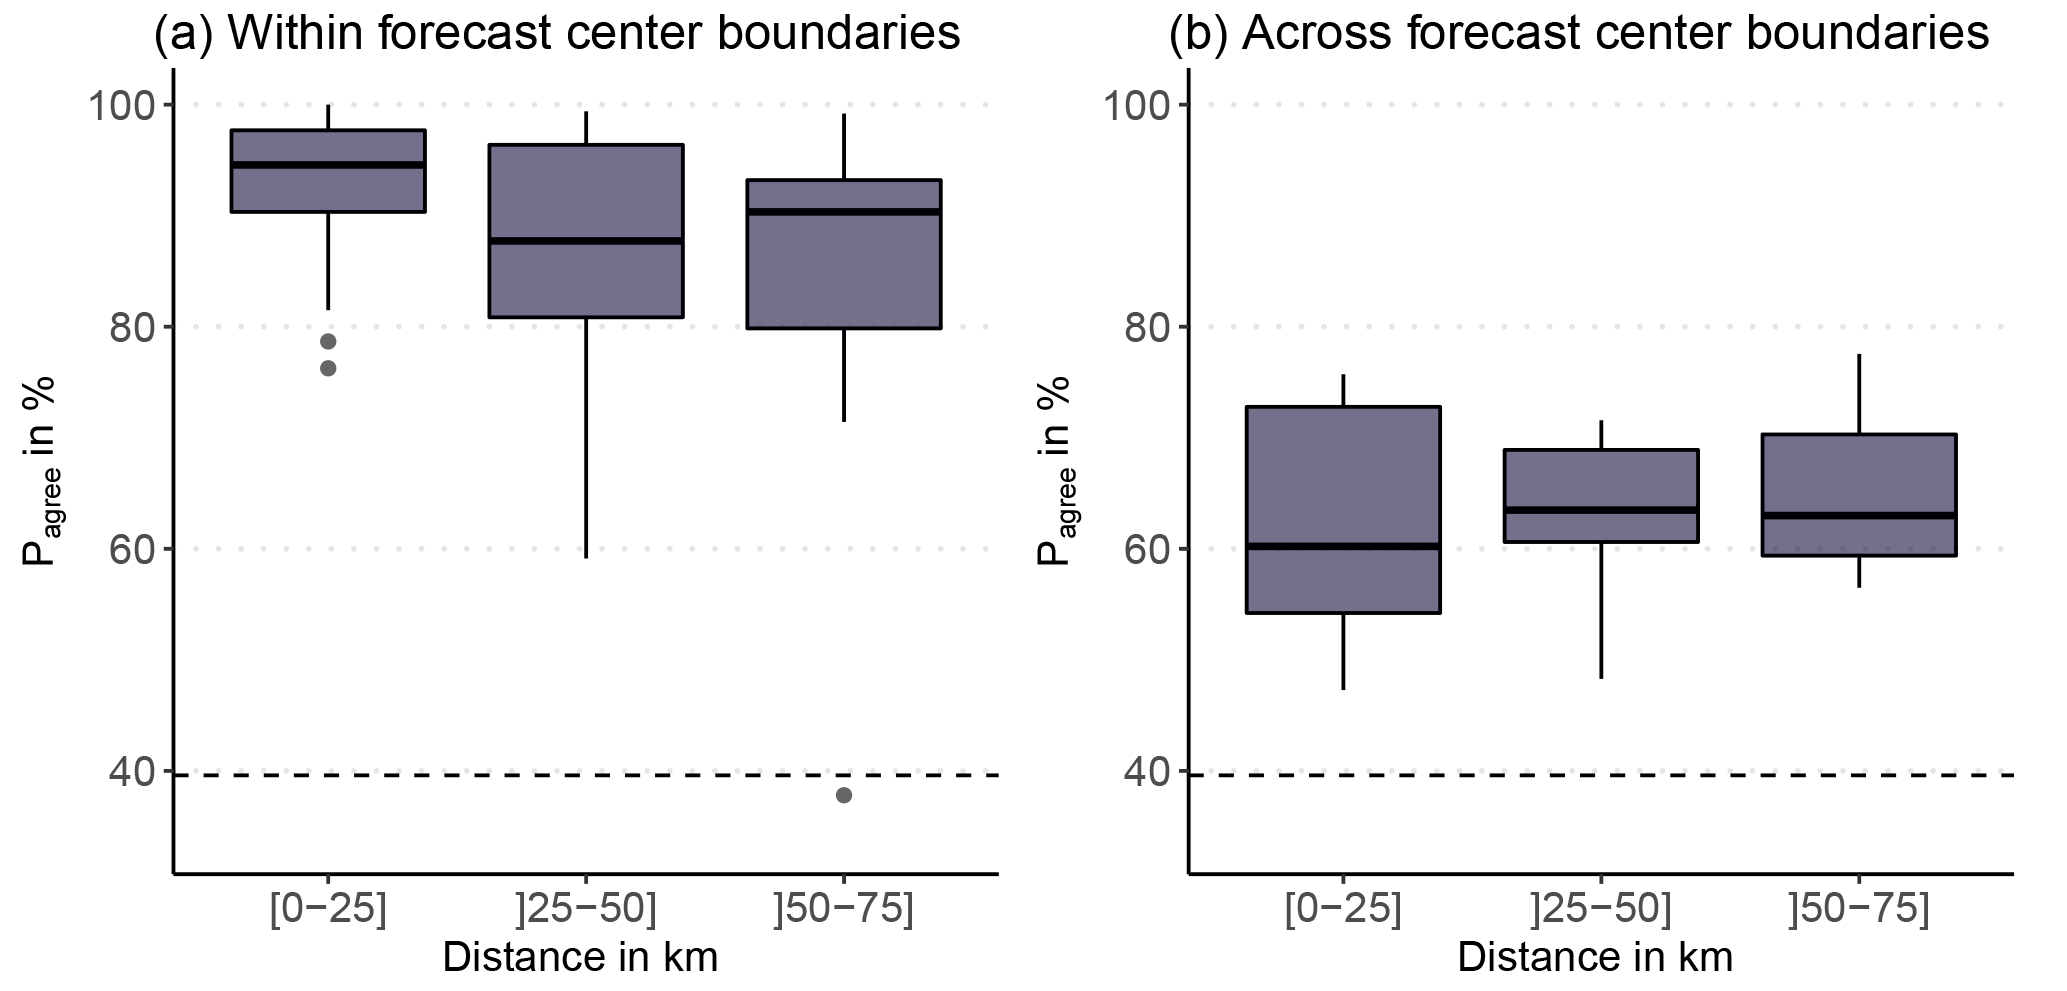
Figure 6Box plot showing the agreement rate (Pagree) for neighboring warning region pairs (a) within and (b) across forecast center boundaries, stratified by the distance between the center points of warning regions, with similar maximum elevation (Δ elevation < 250 m) and size (the size of the larger warning region is less than 1.5 times the size of the smaller warning region; N(within) = 108, N(across) = 37). The dashed line represents Pagree when randomly drawing 10 000 danger levels for neighboring warning regions using the distributions shown in Fig. 4a (discussed in Sect. 6.2). The box plots show the median (bold line), the interquartile range (boxes), 1.5 times the interquartile range (whiskers), and outliers outside this range (dots).
Within forecast center domains, the bias ratio Bij correlated weakly with differences in the size (; p<0.01) and elevation (; p < 0.01), indicating that generally the forecast danger level increased not only with elevation but also with the size of the warning region. For the warning region pairs shown in Fig. 6, a significant bias existed in 76 % of the pairs across forecast center boundaries, compared to 51 % within those boundaries.
Compared to warning regions in neighboring forecast centers, the forecast centers Niederösterreich (NIE), SWI, and BAY had the lowest median bias ratios (Bij≤0.84), indicating that lower danger levels were used more frequently. This is in contrast to LOM, BRI, and Salzburg (SAL), with median bias ratios Bij≥1.19. For days and regions where danger levels differed, this corresponded to Dmax being lower in more than two-thirds of the pairwise comparisons for NIE, SWI, and BAY, and similarly for LOM, BRI, and SAL, with more than 60 % of forecasts with ΔD≠0 being higher.
5.3 Very critical avalanche conditions D≥4
Danger level 5 – very high was rarely forecast (less than 0.1 % of days and regions, mostly during 2013/2014 in the southern part of the Alps; Fig. 4). Therefore, we explore forecasts with a very critical avalanche situation (D=4) or a disaster situation (D=5) combined. For a specific warning region, the proportion of forecasts with very critical conditions is
where N is the number of forecasts.
Forecasts with forecast danger levels 4 – high or 5 – very high were generally rare (median: 2.5 %; IQR: 1.1 %–4 %; Fig. 7) but were considerably more frequently forecast in the warning regions belonging to the four forecast centers in France (BRI, BSM, CHX, GRE) and the Italian forecast centers PIE and LOM. Visually exploring spatial patterns (Fig. 7a) shows several forecast center borders which coincide with large gradients in Pv.crit values. These differences are most obvious when comparing SWI with its neighbors CHX, PIE, LOM, and TIR, where a difference of two (or more) classes often occurs. In contrast, and with some exceptions, comparably similar values can be noted between many of the forecast centers in Austria; Germany; Switzerland; and the Italian provinces and regions of VDA, BOZ, and TRE. Variations are also confirmed,when considering only warning regions with a maximum elevation greater than 2500 m (N=222). Median values for warning regions in BOZ, SWI, Vorarlberg (VOR), VDA, and SAL (1.6 %–2.3 %) are significantly lower than those for FRI, BSM, PIE, GRE, and BRI (7.6 %–12 %). This can be partly attributed to more frequent occurrence of multi-day continuous periods with D≥4. Extended periods with D≥4 were comparably frequent in BRI or PIE (more than 17 % of these periods had a length of ≥3 days), compared to SWI and CHX (≥3 days: 4 %). Pv.crit in BRI was in many cases two or three classes higher compared not only to its immediate neighbors in Italy (PIE, LIG) but also to those in France (BSM, GRE). The 12 regions with the highest Pv.crit were clustered in the southwest of the Alps (nine in BRI, two in PIE, and one in GRE; %; max =15.3 %).
Pv.crit correlated very weakly with maximum elevation of a warning region (ρ=0.19; p < 0.01). This correlation, however, was much stronger when exploring the proportion of days with D≥3 (ρ=0.7) as well as D=3 by itself (ρ=0.72); see also Supplement S1).
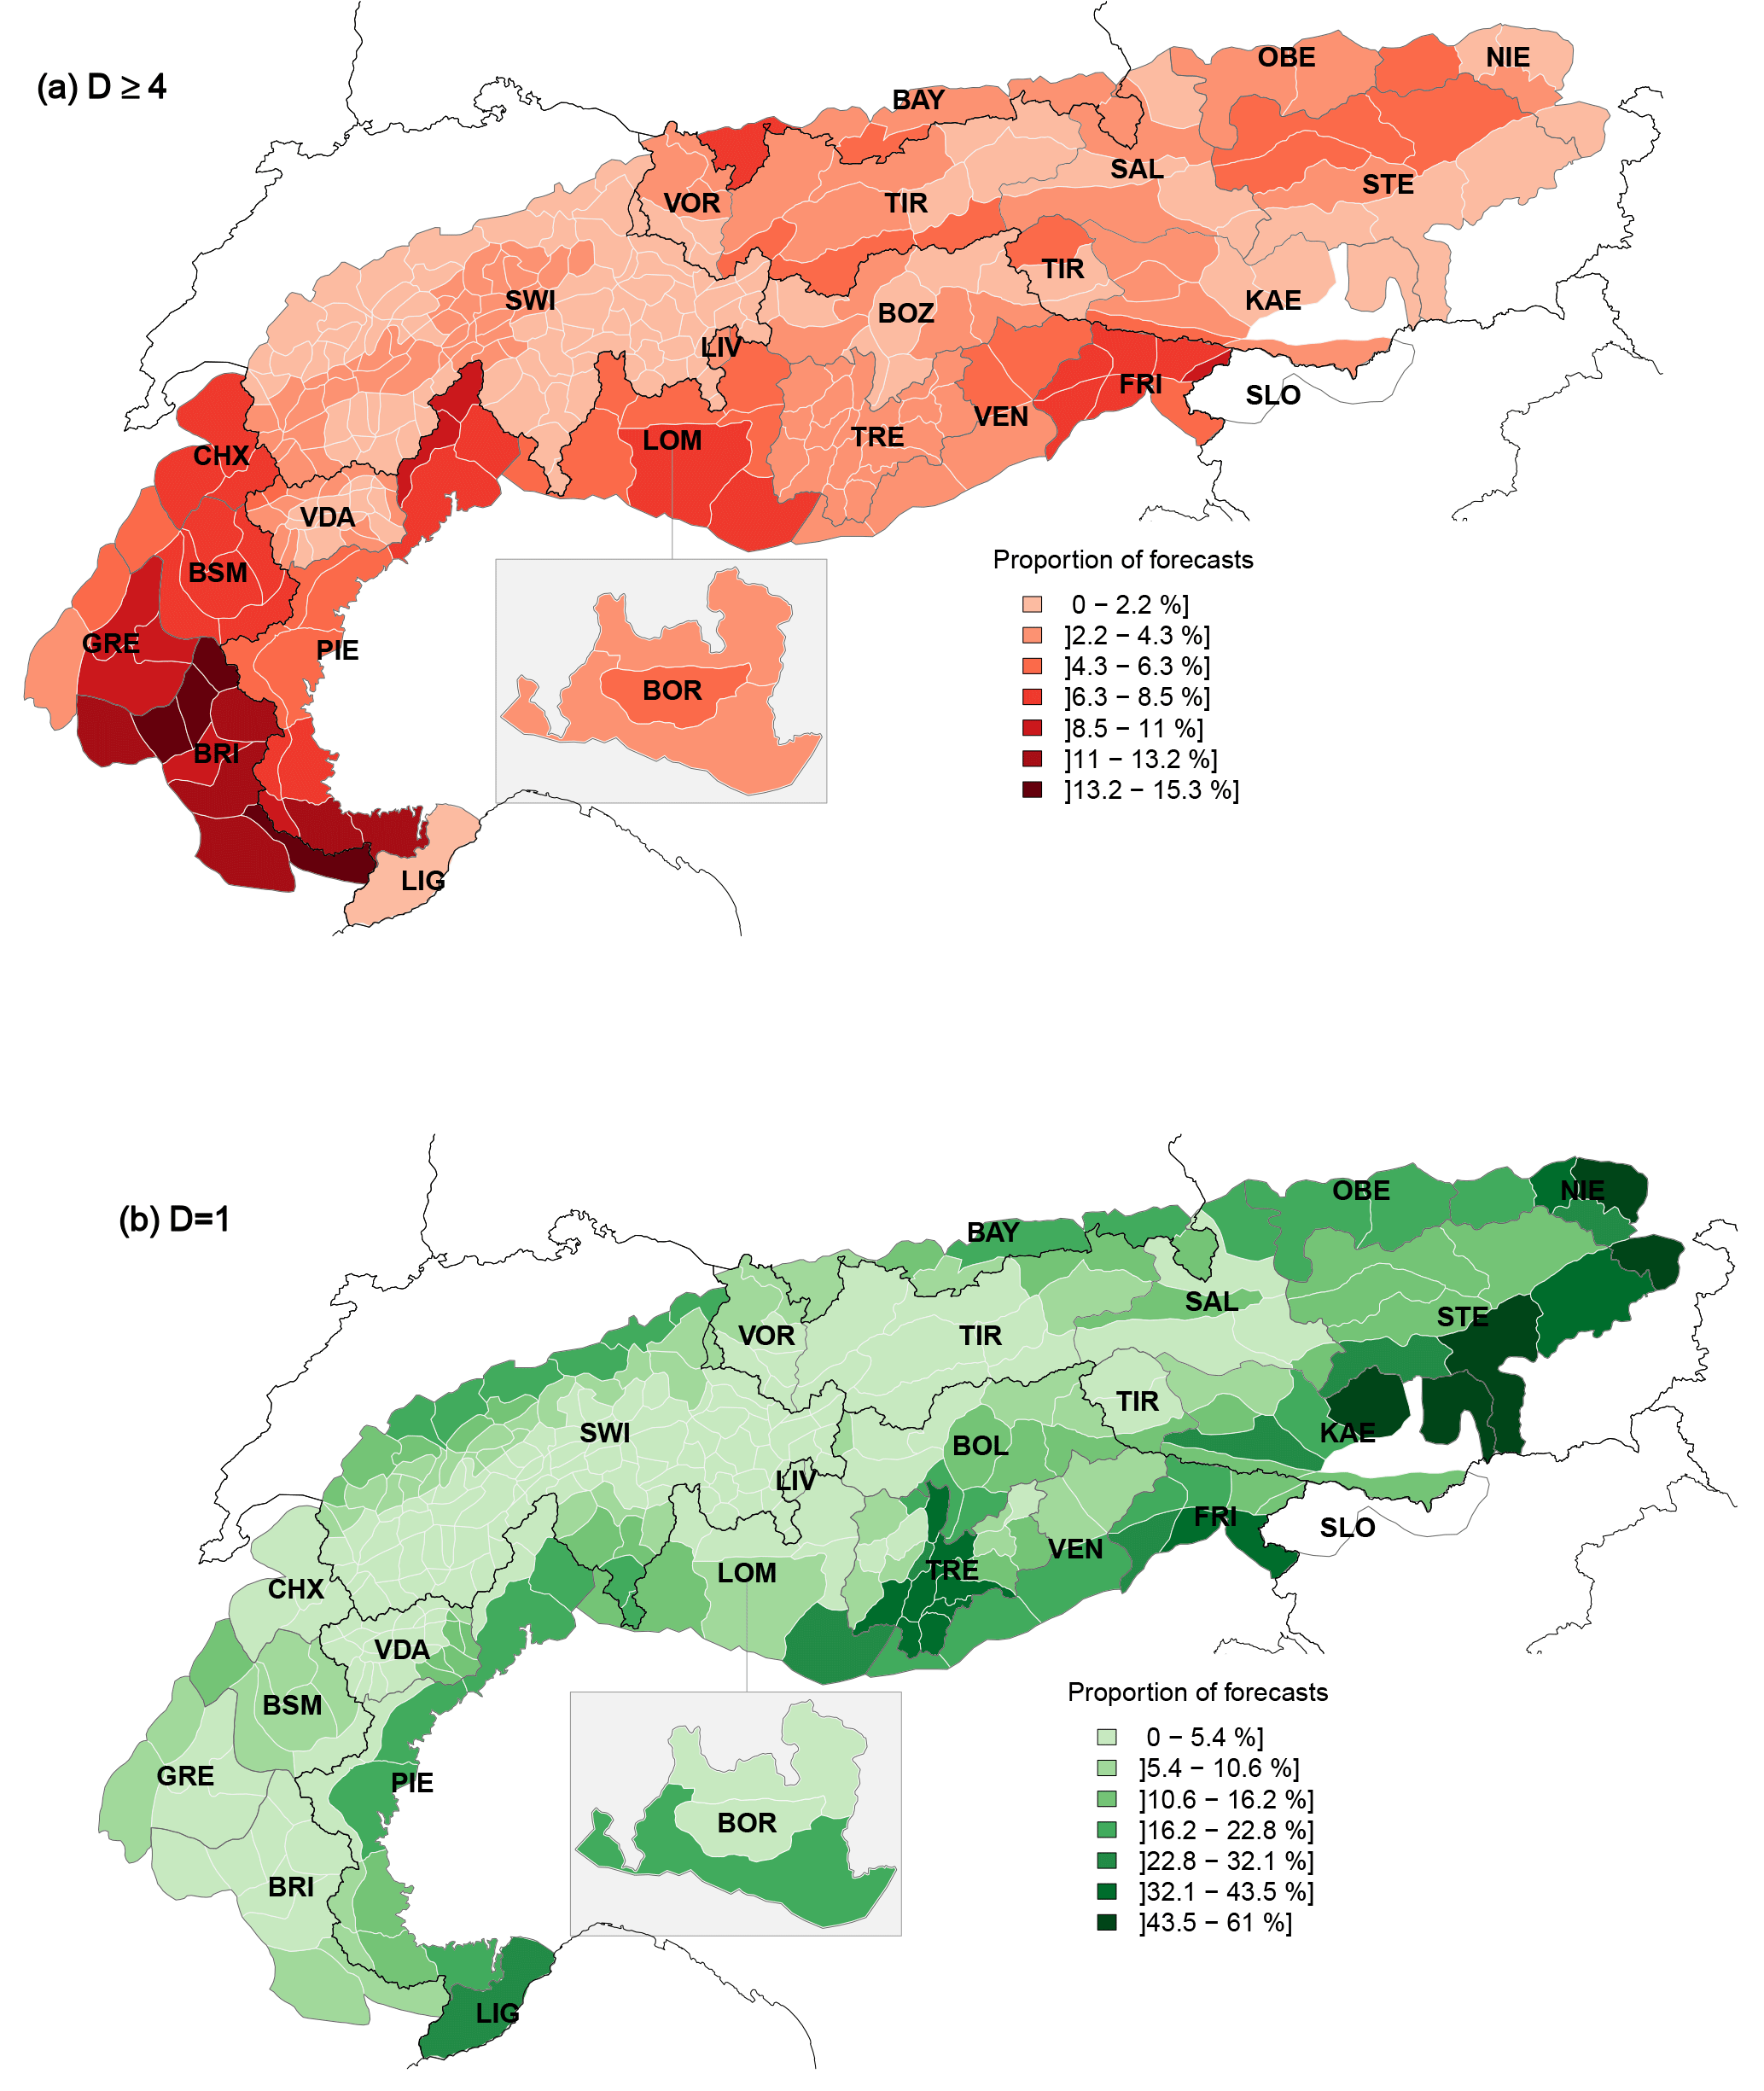
Figure 7Map showing the European Alps with the proportion of days (a) with very critical forecast conditions (Pv.crit, Dmax≥4) and (b) with a forecast danger level of 1 (Pfavor; Dmax=1). The color shading of the individual warning regions (white borders) corresponds to the values of Pv.crit and Pfavor, respectively. Forecast centers are labeled according to Table 2 and marked with dark gray polygon borders; national borders are marked with black lines. To visualize the (at least partially) overlapping forecast regions in the Italian region of Lombardia, LIV is superposed onto parts of LOM, while BOR is placed as an inset to the south of LOM. Thresholds for the color classes were defined using the Fisher–Jenks algorithm minimizing within-class variation (Slocum et al., 2005; R package classInt: Bivand, 2017).
5.4 Generally favorable avalanche situation D = 1
The proportion of days with a generally favorable avalanche situation Pfavor is
Median Pfavor across the Alps was 5.3 % (IQR: 3.4 %–13.8 %), with two regions in NIE having more than 50 % of the forecasts with D=1. The northern, southern, and eastern rim of the Alps, generally regions with lower elevation (Fig. 3b), often have a larger proportion of days with favorable conditions (Fig. 7b). For regions with higher elevations, this proportion is lowest. This is also confirmed when correlating the maximum elevation of each warning region with Pfavor (). In contrast, the correlation between Pfavor and the size of the warning regions is much weaker (, p < 0.001).
Another obvious difference was the strong gradient between the easternmost regions, where more than one-third of the forecast period had generally favorable conditions, and those in the western and central parts of the Alps with comparably low values of Pfavor.
5.5 Elevational gradients and temporal changes within the forecast period
Different approaches are used to communicate elevational gradients in danger ratings (Sect. 2.5). Forecast centers issuing two ratings – mostly in France, Austria, and BAY – seldom indicated the highest hazard at lower elevations. This is in line with the correlations observed between the maximum elevation of a warning region and Pv.crit (or Pfavor, Sects. 5.3 and 5.4). The same danger rating was issued for all elevations by French forecast centers in two-thirds of the forecasts, compared to 60 % of the forecasts with an elevational gradient in TIR (Table 4).
All forecast centers which were technically able to graphically communicate changes in danger level during the forecast period used this option. Most frequently, forecasts indicated no change during the forecast period (median: 83 %). Increasing danger levels (Dt2>Dt1) were communicated regularly by all the forecast centers (median: 16 %). However, the frequency varied considerably, between 26 % in VOR and less than 10 % in NIE and OBE (Table 5). Of particular note is SWI, the only warning service where increases in danger rating related to dry-snow avalanches were communicated exclusively in the textual danger description. A decrease in danger level during the forecast period was very rarely indicated (median: 0.3 %). Some forecast centers like SWI never used this option. Notable exceptions were the forecasts by VOR and LOM, where more than 6 % of the forecasts indicated a decreasing danger rating within the forecast period.
Table 4Elevational differences in danger rating with De1, the danger level above an indicated level, and De2, the danger rating below this elevation level. Example distributions are provided for some forecast centers.
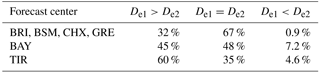
Table 5Temporal differences in danger rating within forecast period with Dt1, the danger rating valid for the first time step, and Dt2, the danger rating valid for the second time step. Example distributions are provided for some forecast centers.
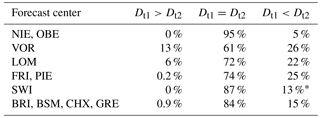
* For Switzerland, the proportion of changing danger ratings which are exclusively communicated in the danger description is 2.7 %.
5.6 Size of the warning regions, Pv.crit, and spatial variation in danger level
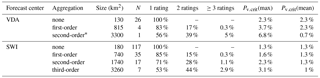
As outlined in Sect. 2.4 and shown in Fig. 3, varying spatial scales and approaches are used to produce the forecast and communicate a danger level. One of these approaches relies on a comparably fine spatial resolution of the warning regions in the bulletin production process, as is the case in VDA (Italy), SWI, and TRE.
The forecast center VDA uses 26 warning regions (median size: 130 km2; Table 2, Fig. 3). Each of these regions belongs to one of four larger snow–climate regions (median size: 815 km2; Burelli et al., 2016, p. 27). In Switzerland, the forecaster aggregates the 117 warning regions in the Swiss Alps (median size: 180 km2) to (generally) three to five regions with the same danger description (with an average size per aggregated region of 5000–7000 km2; Ruesch et al., 2013; Techel and Schweizer, 2017). Similar to VDA, each of the Swiss warning regions can be linked to a higher-order spatial hierarchy (SLF, 2015, p. 41) 3. In either case, these predefined regional aggregations are not of great importance anymore in the communication of a regional danger level, due to the flexibility with which the forecaster can assign danger ratings to regions (VDA) or aggregate regions (SWI). However, here we use these spatial hierarchy levels – three for VDA and four for SWI4 – to explore the variability of the forecast danger level within regions of increasing size and the potential implication for summary statistics like the proportion of the most critical forecasts (Pv.crit, Sect. 5.3).
As shown in Table 6, the larger a region, the higher the variability within it (more than one danger level forecast). In other words, a forecaster would not have been able to communicate the spatial variability in danger levels without describing these in text form if warning regions were 5 times larger (about 800 km2, corresponding to the median size in NIE or in France) in about 15 % of the forecasts, as compared to the currently implemented spatial resolution. Assuming even larger warning regions at the communication level – for instance when considering VDA as one single region (3300 km2) or the seven snow–climate regions in SWI (3260 km2) – and communicating a single danger rating only would have resulted in about half of the forecasts not reflecting the spatial variability within the respective region.
This shows that variations in the expected avalanche hazard at spatial scales smaller than the size of the spatial units used in the production and communication of the forecast are to be expected, particularly if regions are large. In these situations, a forecaster must decide whether to communicate the highest expected danger level, regardless of its spatial extent, or the danger level representative for the largest part of a region. Note that currently the EADS lacks a definition in that respect. Taking the proportion of forecasts with very critical conditions Pv.crit shows that communicating the highest danger level within a region Pv.crit(max) increases the absolute values of Pv.crit (Table 6). Communicating the spatially most widespread danger rating instead (Pv.crit(mean)) has relatively little influence for smaller regions but reduces Pv.crit values significantly on the largest-size regions (Table 6).
At the current spatial resolution, Pv.crit values for SWI and VDA are comparable, particularly along their joint border (Fig. 7a). However, Pv.crit(max) values at the first-order aggregation are already considerably higher for VDA and rather similar to those in neighboring warning regions in CHX, BSM, or PIE.
Table 6Variability in danger ratings and the proportion of forecasts with danger levels 4 – high or 5 – very high (Pv.crit) assuming different aggregation levels as the given spatial resolution for danger level communication. The aggregation level none indicates the currently used spatial resolution. The aggregated median size and number (N) of regions within the forecast domain are indicated. Pv.crit(max) assumes the communication of the highest danger rating per region, and Pv.crit(mean) the spatially most relevant danger rating.
* Considering the entire VDA forecast domain as one region.
5.7 Case studies
To make the results more tangible, we present two case studies (Fig. 8): the Silvretta mountain range, at the border between Austria (VOR and TIR) in the north and Switzerland (SWI) in the south (Fig. 8a), is split into six warning regions, all including Silvretta and/or Samnaun in their region name. These have similar maximum elevations (between 3200 and 3340 m) but differ in size (SWI ≤180 km2; TIR = 490 km2). According to Schwarb et al. (2001), there is a precipitation gradient during the three winter months December to February, with total precipitation amounts decreasing from about 250–300 mm in VOR to about 150–200 mm in the easternmost part of the region in TIR.
The agreement rate is high between the Swiss Silvretta regions (93 %) but considerably lower across forecast center boundaries (SWI–TIR: 73 %; SWI–VOR: 64 %). Note further that between the Swiss Silvretta and Samnaun Pagree equals 100 %. Additionally, there is a significant bias present between SWI and its two Austrian neighbors (p<0.001), with the danger level in Switzerland being lower more often than higher. In contrast, despite a low agreement rate (67 %) there is no significant bias between TIR and VOR, implying that differences in forecast avalanche danger are balanced. Note further that Pagree between VOR and its neighbors in SWI or TIR is 5 to 10 % higher when considering Dmorning rather than Dmax. Danger level 4 was least often forecast in the Swiss warning regions ( %) and most often in the largest of the five regions: Tirol (4.7 %). In comparison, D=1 was forecast between 2.4 % in Tirol and 4.7 % in the two westernmost regions in Vorarlberg and Switzerland.
Turning to a location south of the main Alpine divide, where the Italian Alpi Retiche occidentale warning region in LOM (size: 510 km2; elevation: 3200 m) lies embedded between three Swiss warning regions (SWI; size: 120–370 km2; elevation: 2900–3300 m). It is an area which receives most precipitation from southerly air currents. Winter precipitation is generally more abundant in the southwest (200–250 mm) compared to the north and east of these regions (150–200 mm; Schwarb et al., 2001). This pattern is more pronounced in spring (March–May). The agreement rate between the three Swiss warning regions was between 79 % and 90 %, despite them sometimes being separated by the Lombardian warning region. The agreement rate between the Swiss and Lombardian region ranged between 47 % and 59 %. The bias was very pronounced, with Swiss forecasts often being lower than the ones in LOM (p<0.001). This also shows when comparing Pv.crit (Pv.crit(LOM) = 5.2 % vs. Pv.crit(SWI) < 1.2 %) or Pfavor (Pfavor(LOM) = 1.8 % vs. Pfavor(SWI) > 3.8 %).

Figure 8Example regions: (a) Silvretta mountain range with the Silvretta warning regions in Vorarlberg (VOR) and Tirol (TIR) and three Swiss warning regions (SWI, from west to east: western Silvretta, eastern Silvretta, and Samnaun). (b) the Alpi Retiche occidentale warning region (forecast center Lombardia (LOM)) and the three Swiss warning regions Alto Moesano, Basso Moesano, and Bregaglia. Here, the main Alpine divide runs right to the north of the dark-colored regions. The percentage values show the agreement rate between warning regions (Dmax). The maps show an area of 83 by 45 km. The location of these two example regions in the Alps is marked in Fig. 5.
We explored the spatial consistency and bias of published forecast avalanche danger levels by using a comparably large number of real forecasts rather than a small number of hypothetical scenarios, as in the experiment conducted by Lazar et al. (2016). However, using actual forecasts in such a diverse setting as the European Alps comes at the cost of many confounding factors. Differences between forecast centers in the forecast production and danger level communication required us to make some assumptions prior to data analysis.
In this discussion, we first summarize the main quantitative findings, which we then put into perspective given the data (Sect. 6.1) and our methodology (Sect. 6.2). Furthermore, we discuss sources for inconsistencies and bias (Sect. 6.3) and potential implications to forecast users (Sect. 6.4). The main results are as follows:
-
The agreement rate Pagree was significantly lower across national and forecast center boundaries (about 60 %) compared to within forecast center boundaries (about 90 %, Figs 5 and 6).
-
Significant bias was often observed across national and forecast center boundaries, with several forecast centers showing systematic differences towards lower (or higher) danger levels than their neighbors (Sect. 5.2).
-
The proportion of forecasts with danger levels 4 – high and 5 – very high showed considerable spatial variability (Fig. 7a), with pronounced differences across some forecast center boundaries, and was influenced by the size of warning regions (Sect. 5.6).
6.1 Dataset: four winter seasons
We explored avalanche forecasts published during four winter seasons (477 forecast days). These included not only the 2011/2012 winter with extended periods of heavy snowfalls affecting particularly the regions north of the main Alpine divide (northern French Alps, large parts of Switzerland and Austria, Bavarian Alps; Coléou, 2012; ÖLWD, 2012; Techel et al., 2013), but also the 2013/2014 winter, which was one of the snowiest winters on record in the southern Alps (Italy, southern parts of Switzerland; Goetz, 2014; ÖLWD, 2014; Techel et al., 2015a; Valt and Cianfarra, 2014). These two winters, or removing one of them during data analysis, had an effect particularly on the absolute values of the proportion of forecasts with D≥4 (Pv.crit), while the overall rank order remained comparably similar, regardless of which subset was analyzed (Supplement S2). Removing individual winters also had no significant influence on the agreement rate (Pagree) or bias (Bij) between neighboring warning regions. By comparing with long-term statistics of forecast danger levels (e.g., France, Switzerland, Steiermark; Mansiot, 2016; Techel et al., 2013; Zenkl, 2016), we conclude that our data are generally representative and that the 4 years analyzed cover a typical range of conditions encountered in the European Alps.
6.2 Methodology
Danger levels were communicated in different ways in the forecasts (Sect. 2.5). Therefore, we generalized by defining two data subsets which could be applied to most forecast products: Dmax, describing the highest danger rating within a forecast period, valid for (part of) the day and the most exposed elevations, and Dmorning, where we assumed that time step 1 generally referred to the morning, and time step 2 to the afternoon.
Using Dmax or Dmorning for analysis influenced absolute values of Pv.crit (Sect. 5.3), albeit less so for the rank order, and had little influence on Pagree or Bij (Sect. 5.2).
We introduced Pagree as a measure of spatial consistency (or correlation). As shown in Fig. 4, on four of five days D= 2 or D= 3 was forecast. Thus, by chance alone, a minimal agreement rate can be expected. We estimated this minimal agreement rate by simulating 10 000 danger levels for two neighboring regions using the danger level distributions shown in Fig. 4. In doing so, we obtained values of Pagree=40 % for Dmax and Pagree=36 % for Dmorning. Thus, levels of agreement reported in this paper, and in any future work, should be compared with a minimal agreement rate based on realistic values derived from observed danger level distributions.
Similarly, total agreement (Pagree=100 %) between neighboring regions implies that subdivisions may be superfluous. Nonetheless, we found 100 % agreement for a total of 14 warning region pairs in Switzerland, Italy, and Austria. To confirm whether this agreement indicates regions which could be merged would require further investigation as to, for example, the nature of typical avalanche problems found, and not only the forecast danger levels.
The spatial resolution of the warning regions (Table 2, Fig. 3a), and how these are used in the communication of the forecasts, varied greatly between forecast centers. As we have shown for the forecasts in SWI and VDA (Sect. 5.6), this may in turn influence the danger rating communicated to the public. As a consequence, it has an impact on all summary statistics, most notably Pv.crit and Bij.
We explored a mix of forecasts for the day of publication, the following day, or even the day after. However, forecast accuracy generally decreases with lead time (Jamieson et al., 2008; Statham et al., 2018b). Forecast accuracy may also vary within forecast center domains, as shown by Techel and Schweizer (2017) for the case of Switzerland. We suspect that these may primarily affect the agreement rate Pagree, except if the forecast bias differs temporally or spatially.
Within forecast center domains, differences in the frequency of the danger levels, the agreement rate Pagree, or the bias Bij may indicate differences in snow avalanche climate. In all other situations, that is to say when looking at differences between forecast centers, operational constraints must be considered as much as snow and climate when exploring consistency and bias.
6.3 Understanding differences between avalanche warning regions
Our aims in exploring spatial consistency and bias were threefold: firstly to investigate whether differences existed between forecasting centers, secondly to understand potential factors influencing these biases, and finally to consider the influence of these biases on forecast users. Our results clearly demonstrate that spatial inconsistencies and biases exist, above all across forecast center boundaries. In the following we briefly discuss three possible reasons for such differences, two of which suggest limitations in current forecasting approaches.
The size of the warning regions differed considerably between forecast centers (Fig. 3, Table 2) and had an impact on the issued danger level in general, particularly on Pv.crit (Sect. 5.6). Coarser spatial resolutions of warning regions not only lead to more forecasts with higher danger levels but also increase variability within warning regions. Such variability cannot be captured with a single value and thus, though it may be expressed within the forecast text, is ignored by our approach. Since differences in warning region size were correlated with both bias and agreement rate, we recommend exploring whether more heterogeneous warning regions – from an avalanche winter regime perspective – might be divided into smaller ones to reduce such bias. We also found correlations between avalanche danger levels, bias, agreement rate, and elevation. While higher elevations and higher avalanche dangers are often associated with one another, we suggest the relationship between bias and elevation may result from different ways of communicating avalanche danger for a warning region. In particular, the EADS does not specify whether the highest or the spatially most representative danger level should be communicated for a warning region. We therefore suggest that the EAWS consider whether being more specific in defining how avalanche danger should be assigned to a warning region may reduce bias.
This lack of specificity in the EADS with respect to avalanche danger is an example of potential differences in the application of the EADS at different forecast centers, which may in turn explain some aspects of inconsistency and bias. Simply put, forecasters must assign a categorical value to a complex forecast, which typically also contains uncertainty. This assignment of an avalanche danger level is not only influenced by conditions but may also emerge from cultural differences in forecasting practices (McClung, 2000; Greene et al., 2006; Lazar et al., 2016) and explicit or implicit internalization by forecasters of the use and implication of danger levels by local, regional, and national risk management authorities. The need to increase consistency in the application of the EADS has been recognized. Efforts made by the EAWS include improvements in the EAWS matrix, a tool assisting forecasters in assigning danger levels (Müller et al., 2016; EAWS, 2017a), and the provision of clear definitions of key contributing factors, such as the distribution of dangerous locations and the likelihood of avalanche release. Nonetheless, it is important to recognize that, even if the EAWS strive to harmonize practices and production, externalities such as the consequences of danger levels for users, and the perception of forecasters of this impact, may alter the homogeneity of the product. Furthermore, as observed by LaChapelle (1980) and summarized very recently by Statham et al. (2018a), avalanche forecasts are produced by a forecaster making subjective judgments based on the available data and evidence. Reducing these forecasts to a categorical value neither removes the subjectivity in the process nor allows the forecaster to communicate uncertainty.
A third possible reason for differences between warning regions lies not in bias or inconsistency in the use of the EADS, but rather in real differences in the avalanche winter regime (Haegeli and McClung, 2007). Many of the warning region boundaries, especially along national borders, follow the main Alpine divide, which also serves as a main weather divide. Where large differences in avalanche winter regime are observed, a lower correlation in danger ratings would therefore be expected. However, we relied exclusively on forecast danger levels and cannot compare the agreement rate or bias with differences in avalanche winter regime. This is an important limitation in our study. Incorporating avalanche winter regimes in this study, and/or typical avalanche problems if these were used consistently, would clearly be beneficial for the interpretation of our findings. Such an analysis would require, besides meteorological data, a common database containing snow structure and avalanche information for the entire Alpine mountain range, as already exists for the US and Canada (Mock and Birkeland, 2000; Haegeli and McClung, 2007; Shandro and Haegeli, 2018).
6.4 Inconsistencies: implications for forecast users
A final key question is the implications of the potential spatial inconsistencies and biases in the use of danger levels for forecast users. Even though there may be good reasons for such differences, such as the difference in size of warning regions and therefore a need to communicate different information, users are unlikely to appreciate or understand such nuances.
Regional avalanche forecasts are considered an important source of information for backcountry users, particularly during the planning stage, but also on the day of the tour (Winkler and Techel, 2014; LWD Steiermark, 2015; Baker and McGee, 2016). A key advantage of the introduction of the EADS in 1993 was seen as the provision of consistent information across the European Alps (Meister, 1995). Forecast danger level has been shown to be the part of the forecast most known and used in the Alps (Winkler and Techel, 2014; LWD Steiermark, 2015; Procter et al., 2014), influencing backcountry destinations (Techel et al., 2015b) and local decision-making by recreationists (Furman et al., 2010). Many users of avalanche forecasts are typically active within warning regions where forecasts are produced by a single regional avalanche forecast center (e.g., in VOR or TIR). Such users are likely to become accustomed and calibrated to “their” forecast. Thus, issues are likely to arise when users travel from one forecast center domain to another. For instance, a frequent user of French forecasts traveling to Switzerland may experience some Swiss forecasts with D=3 as a missed alarm, while the opposite may happen when a Swiss user recreates in France. In both cases this reduces the credibility of the forecasts, as they are perceived to be less accurate (Williams, 1980). We suggest that harmonization efforts should therefore focus not only on the product – an avalanche forecast – but also on how this product is used and interpreted by different users and their requirements (Murphy, 1993).
In this study, we explored the avalanche forecast products, and specifically the forecast danger level, during 4 years with 477 forecast days from 23 forecast centers in the European Alps. For the first time,
- i.
we qualitatively described the operational constraints in the production and communication of danger level in avalanche forecast products in the Alps;
- ii.
we developed a methodology to explore spatial consistency and bias in avalanche forecasts;
- iii.
we quantified spatial consistency and bias in forecast danger levels, given operational constraints and the selected methods;
- iv.
we discuss the implications of spatial consistency and bias for forecasting and forecast users.
We noted considerable differences in the operational constraints associated with forecast products. Most notably the spatial resolution of the warning regions underlying the forecasts had an impact on biases observed and the agreement rate, but it also limits at what spatial scale a regional danger level can be communicated in map products. Furthermore, we detected discrepancies in the use of the higher danger levels, as well as a comparably large proportion of forecasts with different danger levels across forecast center boundaries. These findings indicate a need to further harmonize the production process and communication of avalanche forecast products, not just across the Alps but throughout Europe. Harmonization should consider
- i.
similar approaches regarding the size of warning regions and their aggregation, with a preference towards using a finer spatial resolution;
- ii.
focusing not only on forecast products but also on user requirements;
- iii.
the consistent use of EADS by incorporating the EAWS matrix and further developments, and developing a consistent workflow, similar to the approach suggested by Statham et al. (2018a) into the production process.
To carry out our study, we had to collect and harmonize data across the Alps. We recommend a development of a centralized system for collecting data which would enable further studies of forecast properties in the future.
The data are freely available at https://www.envidat.ch/dataset/forecast-avalanche-danger-level-european-alps-2011-2015 (https://doi.org/10.16904/envidat.53; last access: 20 October 2018; Techel, 2018).
The supplement related to this article is available online at: https://doi.org/10.5194/nhess-18-2697-2018-supplement.
FT coordinated and designed this collaborative study. All co-authors repeatedly provided in-depth feedback regarding previous versions of the manuscript.
The authors declare that they have no conflict of interest.
This study would not have been possible without the contributions of numerous
avalanche forecasters and researchers who provided data and/or feedback on
the manuscript (in alphabetical order): Igor Chiambretti, Jean-Louis Dumas,
Mattia Faletto, Thomas Feistl, Elisabeth Hafner, Fabiano Monti, Patrick
Nairz, Bernhard Niedermoser, Andreas Pecl, Evelyne Pougatch, Jürg
Schweizer, Luca Silvestri, Florian Stifter, Thomas Stucki, Arnold
Studeregger, Lukas Rastner, Mauro Valt, Romeo Vincenzo, Alec van Herwijnen,
and Gernot Zenkl. We greatly appreciate the detailed and constructive
comments by the three reviewers: Karsten Müller, Rune Engeset, and Karl
Birkeland. The statistical analysis was performed using the open-source
software R, version 3.4.3 (R Core Team, 2017).
Edited by: Joaquim G. Pinto
Reviewed by:
Karsten Müller, Rune Engeset,
and Karl W. Birkeland
Baker, J. and McGee, T.: Backcountry snowmobiler' avalanche-related information-seeking and preparedness behaviors, Soc. Nat. Resour., 29, 345–356, https://doi.org/10.1080/08941920.2015.1103387, 2016. a
Ballou, D. and Pazer, H.: Modeling completeness versus consistency tradeoffs in information decision contexts, IEEE T. Knowl. Data En., 15, 240–243, https://doi.org/10.1109/TKDE.2003.1161595, 2003. a
Bivand, R.: classInt: Choose univariate class intervals, available at: https://CRAN.R-project.org/package=classInt, r package version 0.1-24, last access: 1 September 2017. a
Bivand, R. and Piras, G.: Comparing implementations of estimation methods for spatial econometrics, J. Stat. Softw., 63, 1–36, https://doi.org/10.18637/jss.v063.i18, 2015. a
Bivand, R., Pebesma, E., and Gómez-Rubio, V.: Applied spatial data analysis with R, Springer Science + Business Media New York 2013, 2 edn., https://doi.org/10.1007/978-1-4614-7618-4, 2013. a
Bovee, M., Srivastava, R., and Mak, B.: A conceptual framework and belief-function approach to assessing overall information quality, Int. J. Intell. Syst., 18, 51–74, https://doi.org/10.1002/int.10074, 2003. a
Burelli, G., Ceaglio, E., Contri, G., Debernardi, A., Frigo, B., and Pivot, S.: Rendiconto nivometeorologico. Inverno 2011–2012, Tech. rep., Regione Autonome Valle d'Aosta e Fondazione Montagna sicura, 184 pp., 2012. a
Burelli, G., Ceaglio, E., Contri, G., Debernardi, A., and Pivot, S.: Rendiconto nivometeorologico. Inverno 2015–2016, Tech. rep., Regione Autonome Valle d'Aosta e Fondazione Montagna sicura, 152 pp., 2016. a
Coléou, C.: Enneigement dans les massifs françaises dans l'hiver 2011–2012, Neige et Avalanche, 139, 28–29, 2012. a
Dale, M. and Fortin, M.-J.: Spatial analysis: a guide for ecologists, Cambridge University Press, 2 edn., 2014. a
EAWS: Bavarian matrix, available at: http://www.avalanches.org/eaws/en/main_layer.php?layer=basics&id=5 (last access: 11 December 2017), 2005. a
EAWS: EAWS Matrix, Tech. rep., available at: http://www.avalanches.org/eaws/en/main_layer.php?layer=basics&id=4 last access: 11 December 2017a. a, b
EAWS: Content and structure of public avalanche bulletins, Tech. rep., available at: https://lawine.tirol.gv.at/data/eaws/ContentAndStructureAvalancheBulletin.pdf, (last access: 18 October 2018) 2017b. a
EAWS: Memorandum of understanding for the European Avalanche Warning Services (EAWS), Tech. rep., available at: https://lawine.tirol.gv.at/data/eaws/MoU_EAWS.pdf (last access: 2 September 2018), 2017c. a, b, c, d
EAWS: Typical avalanche problems, Tech. rep., available at: https://lawine.tirol.gv.at/data/eaws/typical_problems/EAWS_avalanche_problems_EN.pdf, approved by General Assembly of EAWS, Munich, last access: 1 December 2017d. a, b
EAWS: European Avalanche Danger Scale (2018/19), avalable at: http://www.avalanches.org/eaws/en/main_layer.php?layer=basics&id=1, last access: 18 october 2018. a, b
Elder, K. and Armstrong, B.: A quantitative approach for verifying avalanche hazard ratings, in: Symposium at Davos 1986 on Avalanche Formation, Movement and Effects, vol. 162 of International Association of Hydrological Sciences Publication, 593–603, 1987. a
ESRI: ArcGIS online basemap: world topo map, 2017. a, b
Föhn, P. and Schweizer, J.: Verification of avalanche danger with respect to avalanche forecasting, in: Les apports de la recherche scientifique à la sécurité neige, glace et avalanche. Actes de Colloque, Chamonix, 162, 151–156, Association Nationale pour l'Étude de la Neige et des Avalanches (ANENA), 1995. a
Furman, N., Shooter, W., and Schumann, S.: The roles of heuristics, avalanche forecast, and risk propensity in the decision making of backcountry skiers, Leisure Sci., 32, 453–469, https://doi.org/10.1080/01490400.2010.510967, 2010. a
Giraud, G., Lafeuille, J., and Pahaut, E.: Evaluation de la qualité de la prévision du risque d'avalanche, Int. Ass. Hydrol. Sci. Publ., 162, 583–591, 1987. a
Goetz, D.: Bilan nivo-météorologique de l'hiver 2013–2014, Neige et Avalanche, 147, 12–14, 2014. a
Greene, E., Wiesinger, T., Birkeland, K., Coléou, C., Jones, A., and Statham, G.: Fatal avalanche accidents and forecasted danger level: patterns in the United States, Canada, Switzerland and France, in: Proceedings ISSW 2006, International Snow Science Workshop, Telluride, Co., 640–649, 2006. a
Haegeli, P. and McClung, D.: Expanding the snow-climate classification with avalanche-relevant information: initial description of avalanche winter regimes for southwestern Canada, J. Glaciol., 53, 266–276, 2007. a, b
Hijmans, R.: raster: Geographic data analysis and modeling, available at: https://CRAN.R-project.org/package=raster (last access: 1 June 2017), r package version 2.5-8, 2016. a, b
Jamieson, B., Campbell, C., and Jones, A.: Verification of Canadian avalanche bulletins including spatial and temporal scale effects, Cold Reg. Sci. Technol., 51, 204–213, https://doi.org/10.1016/j.coldregions.2007.03.012, 2008. a, b
Jarvis, A., Reuter, H., Nelson, A., and Guevara, E.: Hole-filled seamless SRTM data V4, Tech. rep., International Centre for Tropical Agriculture (CIAT), available at: http://srtm.csi.cgiar.org (last access: 1 October 2017), 2008. a
LaChapelle, E.: The fundamental process in conventional avalanche forecasting, J. Glaciol., 26, 75–84, 1980. a, b
Lazar, B., Trautmann, S., Cooperstein, M., Greene, E., and Birkeland, K.: North American avalanche danger scale: Do backcountry forecasters apply it consistently?, in: Proceedings ISSW 2016, International Snow Science Workshop, Breckenridge, Co., 457–465, 2016. a, b, c
LWD Steiermark: Ergebnisse der Online-Umfrage des LWD Steiermark 2015, available at: http://www.lawine-steiermark.at/images/uploads/cms/Bericht_Stmk.pdf (last access: 17 October 2018), 2015. a, b
Mansiot, O.: Indices de risque 2 et 3: utilise-t-on correctement les informations du bulletin d'estimation du risque d'avalanche?, Neige et Avalanches, 155, 8–10, 2016. a
Marazzi, S.: Atlante orografico delle Alpi: SOIUSA – suddivisione orografica internazionale unificata del Sistema Alpino, Pavone Canavese: Priuli & Verlucca, 2005. a
McClung, D.: Predictions in avalanche forecasting, Ann. Glaciol., 31, 377–381, https://doi.org/10.3189/172756400781820507, 2000. a
Meister, R.: Country-wide avalanche warning in Switzerland, in: Proceedings ISSW 1994. International Snow Science Workshop 1994, Snowbird, UT, 58–71, 1995. a
Météo France: Guide avalanche, Météo France, Saint-Mandé Cedex, édition 2012–2013 edn., 2012. a
Mock, C. and Birkeland, K.: Snow avalanche climatology of the Western United States mountain ranges, B. Am. Meteorol. Soc., 81, 2367–2392, https://doi.org/10.1175/1520-0477(2000)081<2367:SACOTW>2.3.CO;2, 2000. a
Müller, K., Stucki, T., Mitterer, C., Nairz, P., Konetschny, H., Feistl, T., Coléou, C., Berbenni, F., and Chiambretti, I.: Towards an improved European auxiliary matrix for asessing avalanche danger levels, in: Proceedings ISSW 2016. International Snow Science Workshop, Breckenridge, CO, USA, 2016. a
Munter, W.: 3×3 Lawinen, Agentur Pohl und Schellhammer, Garmisch-Partenkirchen, 1st edn., 1997. a
Murphy, A. H.: What is a good forecast? An essay on the nature of goodness in weather forecasting, Weather Forecast., 8, 281–293, https://doi.org/10.1175/1520-0434(1993)008<0281:WIAGFA>2.0.CO;2, 1993. a, b
ÖLWD: Saisonbericht der österrreichischen Lawinenwarndienste 2011/2012, Arbeitsgemeinschaft der österreichischen Lawinenwarndienste, 180 pp., 2012. a, b, c, d
ÖLWD: Saisonbericht der österrreichischen Lawinenwarndienste, 2012/2013, Arbeitsgemeinschaft der österreichischen Lawinenwarndienste, 222 pp., 2013.
ÖLWD: Saisonbericht der österrreichischen Lawinenwarndienste 2013/2014, Arbeitsgemeinschaft der österreichischen Lawinenwarndienste, 236 pp., 2014. a
ÖLWD: Saisonbericht der österrreichischen Lawinenwarndienste 2014/2015, Arbeitsgemeinschaft der österreichischen Lawinenwarndienste, 272 pp., 2015. a, b
Pahaut, E. and Bolognesi, R.: Prévisions régionale et locale du risque d'avalanches, in: Guide Neige et avalanche. Connaissances, Pratiques, & sécurité, edited by Ancey, C., ISSN 2-85744-797-3, chap. 7, 161–178, Édisud, Aix-en-Provence, France, 3 edn., electronic version, based on second edition, 2003. a
Procter, E., Strapazzon, G., Dal Cappello, T., Castlunger, L., Staffler, H., and Brugger, H.: Adherence of backcountry winter recreationists to avalanche prevention and safety practices in northern Italy, Scand. J. Med. Sci. Sports, 24, 823–829, https://doi.org/10.1111/sms.12094, 2014. a
R Core Team: R: A language and environment for statistical computing, R Foundation for Statistical Computing, Vienna, Austria, available at: https://www.R-project.org/, last access: 1 June 2017. a, b
Ruesch, M., Egloff, A., Gerber, M., Weiss, G., and Winkler, K.: The software behind the interactive display of the Swiss avalanche bulletin, in: Proceedings ISSW 2013. International Snow Science Workshop, Grenoble – Chamonix-Mont Blanc, France, 406–412, 2013. a
Schwarb, M., Frei, C., Schär, C., and Daly, C.: Hydrologischer Atlas der Schweiz, chap. 2.7 – Mean Seasonal Precipitation throughout the European Alps 1971–1990, Geographisches Institut der Universität Bern – Hydrologie, 2001. a, b
Schweizer, J., Kronholm, K., and Wiesinger, T.: Verification of regional snowpack stability and avalanche danger, Cold Reg. Sci. Technol., 37, 277–288, https://doi.org/10.1016/S0165-232X(03)00070-3, 2003. a
Schweizer, J., Mitterer, C., Techel, F., Stoffel, A., and Reuter, B.: Quantifiying the obvious: the avalanche danger level, in: Proceedings ISSW 2018, International Snow Science Workshop, Innsbruck, Austria, 2018. a
Shandro, B. and Haegeli, P.: Characterizing the nature and variability of avalanche hazard in western Canada, Nat. Hazards Earth Syst. Sci., 18, 1141–1158, https://doi.org/10.5194/nhess-18-1141-2018, 2018. a
SLF: Interpretationshilfe zum Lawinenbulletin des Eidgenössischen Institutes für Schnee- und Lawinenforschung Weissfluhjoch, Davos, in: Mitteilung des Eidgenössischen Institutes für Schnee- und Lawinenforschung, 49, p. 24, Eidgenössischen Institutes für Schnee- und Lawinenforschung, 1993. a
SLF: Avalanche bulletins and other products, Interpretation guide, Edition 2015, WSL Institute for Snow and Avalanche Research SLF, Davos, available at: http://www.slf.ch/lawineninfo/zusatzinfos/interpretationshilfe/interpretationshilfe_e.pdf (last access: 4 July 2016), 16th revised edition, 50 pp., 2015. a
Slocum, T., McMaster, R., Kessler, F., and Howard, H.: Thematic cartography and geographic visualization, Prentice Hall Series in Geographic Information Science, Pearson/Prentice Hall, Upper Saddle River, NJ, 2 edn., 2005. a
SRTM: SRTM data V4, Website, available at: http://www.cgiar-csi.org, last access: 19 April 2017. a
Statham, G., Haegeli, P., Greene, E., Birkeland, K., Israelson, C., Tremper, B., Stethem, C., McMahon, B., White, B., and Kelly, J.: A conceptual model of avalanche hazard, Nat. Hazards, 90, 663–691, https://doi.org/10.1007/s11069-017-3070-5, 2018a. a, b, c
Statham, G., Holeczi, S., and Shandro, B.: Consistency and accuracy of public avalanche forecasts in Western Canada, in: Proceedings ISSW 2018, Inteernational Snow Science Workshop, Innsbruck, Austria, 2018b. a
Techel, F. and Schweizer, J.: On using local avalanche danger level estimates for regional forecast verification, Cold Reg. Sci. Technol., 144, 52–62, https://doi.org/10.1016/j.coldregions.2017.07.012, 2017. a, b, c
Techel, F., Pielmeier, C., Darms, G., Teich, M., and Margreth, S.: Schnee und Lawinen in den Schweizer Alpen. Hydrologisches Jahr 2011/12, WSL-Institut für Schnee- und Lawinenforschung SLF Davos, 118 pp., (WSL Ber. 5), 2013. a, b
Techel, F.: Forecast avalanche danger level European Alps 2011–2015, Natural Hazards Earth System Sciences, https://doi.org/10.16904/envidat.53, 2018. a
Techel, F., Stucki, T., Margreth, S., Marty, C., and Winkler, K.: Schnee und Lawinen in den Schweizer Alpen. Hydrologisches Jahr 2013/14, WSL-Institut für Schnee- und Lawinenforschung SLF Davos, 87 pp., (WSL Ber. 31), 2015a. a
Techel, F., Zweifel, B., and Winkler, K.: Analysis of avalanche risk factors in backcountry terrain based on usage frequency and accident data in Switzerland, Nat. Hazards Earth Syst. Sci., 15, 1985–1997, https://doi.org/10.5194/nhess-15-1985-2015, 2015b. a
Techel, F., Jarry, F., Kronthaler, G., Mitterer, S., Nairz, P., Pavšek, M., Valt, M., and Darms, G.: Avalanche fatalities in the European Alps: long-term trends and statistics, Geogr. Helv., 71, 147–159, https://doi.org/10.5194/gh-71-147-2016, 2016. a
Valt, M. and Cianfarra, P.: La stagione invernale 2013/2014. Innevamento e attivitá valanghiva sulle Alpi, Neve e Valanghe, 81, 10–19, 2014. a
Wilks, D.: Statistical methods in the atmospheric sciences, vol. 100 of em International Geophysics Series, Academic Press, San Diego CA, USA, 3rd edn., 2011. a, b
Williams, K.: Credibility of avalanche warnings, J. Glaciol., 26, 93–96, https://doi.org/10.1017/S0022143000010625, 1980. a
Winkler, K. and Techel, F.: Users rating of the Swiss avalanche forecast, in: Proceedings ISSW 2014, International Snow Science Workshop, Banff, Canada, 437–444, 2014. a, b
Winkler, K., Fischer, A., and Techel, F.: Avalanche risk in winter backcountry touring: status and recent trends in Switzerland, in: Proceedings ISSW 2016. International Snow Science Workshop, Breckenridge, CO, 270–276, 2016. a
Zenkl, G.: 10 Jahre Lawinenwarndienst Niederösterreich, Saisonbericht der österrreichischen Lawinenwarndienste 2015/2016, 192–193, 2016. a
We use these terms synonymously.
All times indicated may refer to either CET or CEST.
As an example, the warning region “1121 – Freiburger Alpen” belongs at its highest hierarchy level to the snow–climate region “1 – western part of the northern flank of the Alps”.
No higher hierarchy exists for the warning regions in TRE.