the Creative Commons Attribution 4.0 License.
the Creative Commons Attribution 4.0 License.
 | 23 Oct 2018
Reconstruction and simulation of an extreme flood event in the Lago Maggiore catchment in 1868
Peter Stucki
Moritz Bandhauer
Ulla Heikkilä
Ole Rössler
Massimiliano Zappa
Lucas Pfister
Melanie Salvisberg
Paul Froidevaux
Olivia Martius
Luca Panziera
Stefan Brönnimann
Heavy precipitation on the south side of the central Alps produced a catastrophic flood in October 1868. We assess the damage and societal impacts, as well as the atmospheric and hydrological drivers using documentary evidence, observations and novel numerical weather and runoff simulations.
The greatest damage was concentrated close to the Alpine divide and Lago Maggiore. An atmospheric reanalysis emphasizes the repeated occurrence of streamers of high potential vorticity as precursors of heavy precipitation. Dynamical downscaling indicates high freezing levels (4000 m a.s.l.), extreme precipitation rates (max. 270 mm 24 h−1) and weather dynamics that agree well with observed precipitation and damage, and with existing concepts of forced low-level convergence, mid-level uplift and iterative northeastward propagation of convective cells. Simulated and observed peak levels of Lago Maggiore differ by 2 m, possibly because the exact cross section of the lake outflow is unknown. The extreme response of Lago Maggiore cannot be attributed to low forest cover. Nevertheless, such a paradigm was adopted by policy makers following the 1868 flood, and used to implement nationwide afforestation policies and hydraulic structures.
These findings illustrate the potential of high-resolution, hydrometeorological models – strongly supported by historical methods – to shed new light on weather events and their socio-economic implications in the 19th century.
- Article
(9809 KB) - Full-text XML
- BibTeX
- EndNote


Floods are natural hazards with potentially disastrous impacts on built structures and landscapes: in many parts of Europe and the Alps, they represent the most damaging and expensive hydrometeorological hazard (Hilker et al., 2009). A number of heavy precipitation events producing severe floods have occurred on the southern side of the central Alps (SA hereafter) in recent decades. The most extreme of these recent events occurred in October 2000 and in September 1993 (Bundesamt für Wasser und Geologie, 2002; Grebner, 1993, 2000; Stucki et al., 2012). These events have been analyzed thoroughly in several studies and administrative reports, e.g., regarding impacts, damage and hydrometeorological processes (Boudevillain, 2009; Bundesamt für Wasser und Geologie, 2002; Buzzi et al., 1998; Buzzi and Foschini, 2000; Cassandro Cremonini et al., 2001; Fehlmann et al., 2000; Grebner, 1993, 2001; Massacand et al., 1998; Röthlisberger, 1994; Rotunno and Houze, 2007; Schlemmer et al., 2010; Stucki et al., 2012, 2013; Tonzani and Troisi, 1993).
These two extreme floods were perceived as “centennial”, with unpredictable impacts (e.g., Bundesamt für Wasser und Geologie, 2002). However, they also led to a scientific, political and societal rediscovery of the most disastrous flood event on the SA in centuries: the extreme flood from 27 September to 4 October 1868 on Lago Maggiore and adjacent regions (Lago Maggiore region; LMR hereafter; Fig. 1; see also labels in Fig. 2). For instance, Maugeri et al. (1998) provided a reconstruction of air pressure, temperature, wind and cloudiness over Italy for 3 October 1868, based on sparse meteorological observations. Petrascheck (1989) collected and mapped the flood damage and compared them to a severe flood in 1987. Pfister (1999, 2002), Pfister and Summermatter (2004) and Summermatter (2005, 2007, 2012) analyzed the societal impacts and political ramifications based on documentary sources such as the hydrometeorological and impact reports by Coaz (1869) and Arpagaus (1870). They found that the event had far-reaching consequences regarding flood protection measures in Switzerland. In general, the scientific reports found that the 1868 flood occurred during a period of almost persistent precipitation between 14 September and 9 October 1868; and from 4 October 1868, relevant precipitation amounts fell as snow at higher elevations (Coaz, 1869).
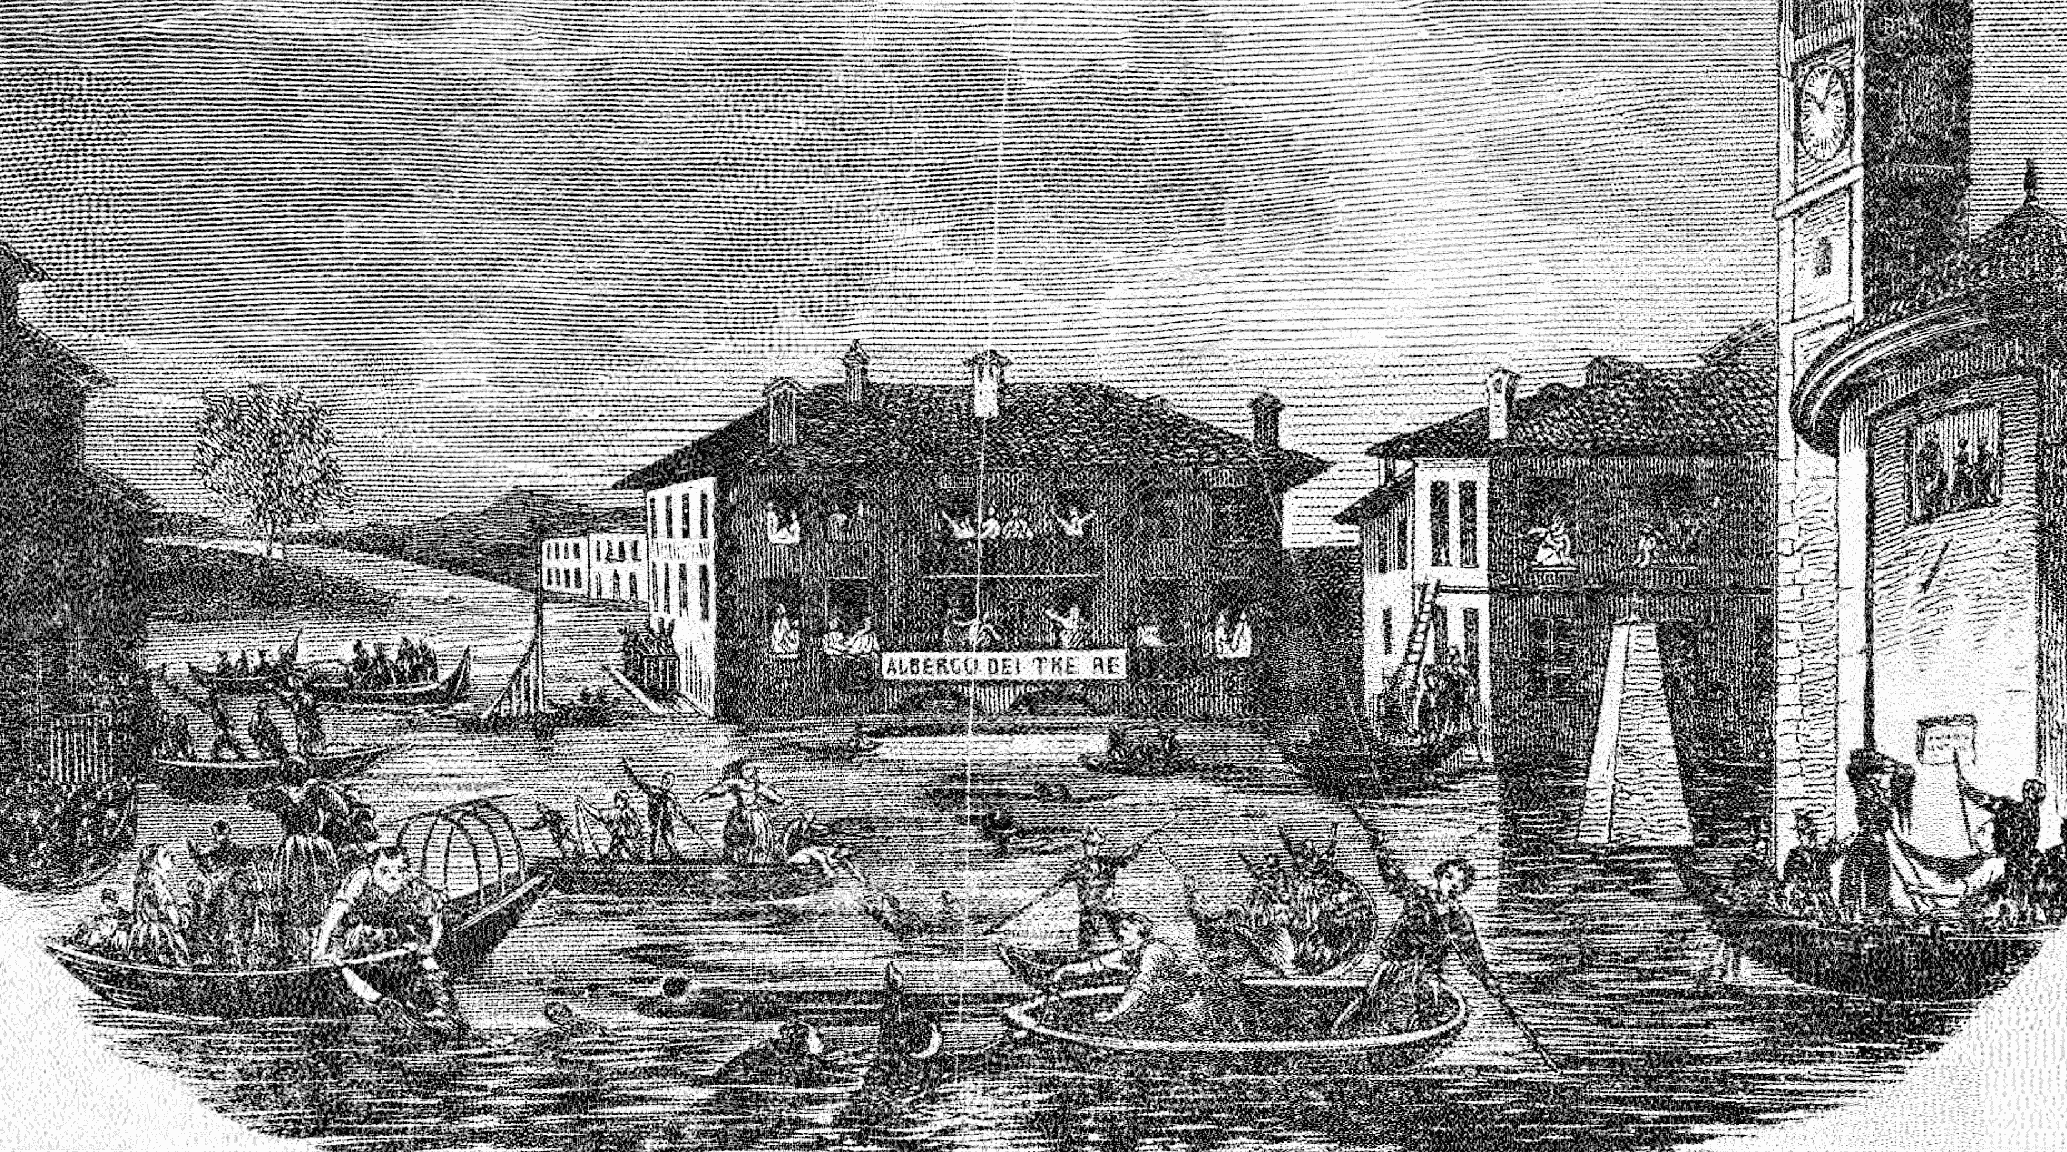
Figure 1Engraving showing the historical center of Sesto Calende, located at the southern end of Lago Maggiore (see label in Fig. 2), during the 1868 flood event. Taken from Bogni (1869).
Such traditional reconstructions are typically based on documentary evidence and observations. Although remarkable achievements can be made with these methods, it is desirable to complement the results with highly resolved spatial and temporal information, which is needed for applications like risk assessments and damage modeling.
In the first step, we aim to extend existing knowledge using recently digitized hydrometeorological observations from national projects (Füllemann et al., 2011) and from our own research. We also aim to provide a better understanding of the ensuing policy regarding natural hazards in Switzerland using recent historical studies. Specifically, we describe the damage extent, intensities and societal impacts, and reconstruct the flood and the associated precipitation using available observations.
In the second step, we make use of a global atmospheric reanalysis dataset that has recently been extended to the year 1851. This dataset facilitates analyses of the large-scale (synoptic) weather conditions during the 1868 flood and allows for dynamical downscaling, i.e., the nesting of a limited-area weather model, which in turn provides highly resolved information for local-scale weather analyses (cf. Michaelis and Lackmann, 2013 for a blizzard simulation in 1888; Welker et al., 2015 for historic high-impact windstorms). We analyze hydrometeorological atmospheric conditions (e.g., moisture flux, precipitation rates and the height of the freezing level) on synoptic scales and mesoscales, and we compare the model output to the observations and historical sources.
In a third step, we make use of a novel analog sampling method for hydrometeorological simulations (Rössler and Brönnimann, 2018). Specifically, we explore the use of the simulated precipitation and other variables (including the role of forested areas) to assess the hydrological response of the Lago Maggiore water level.
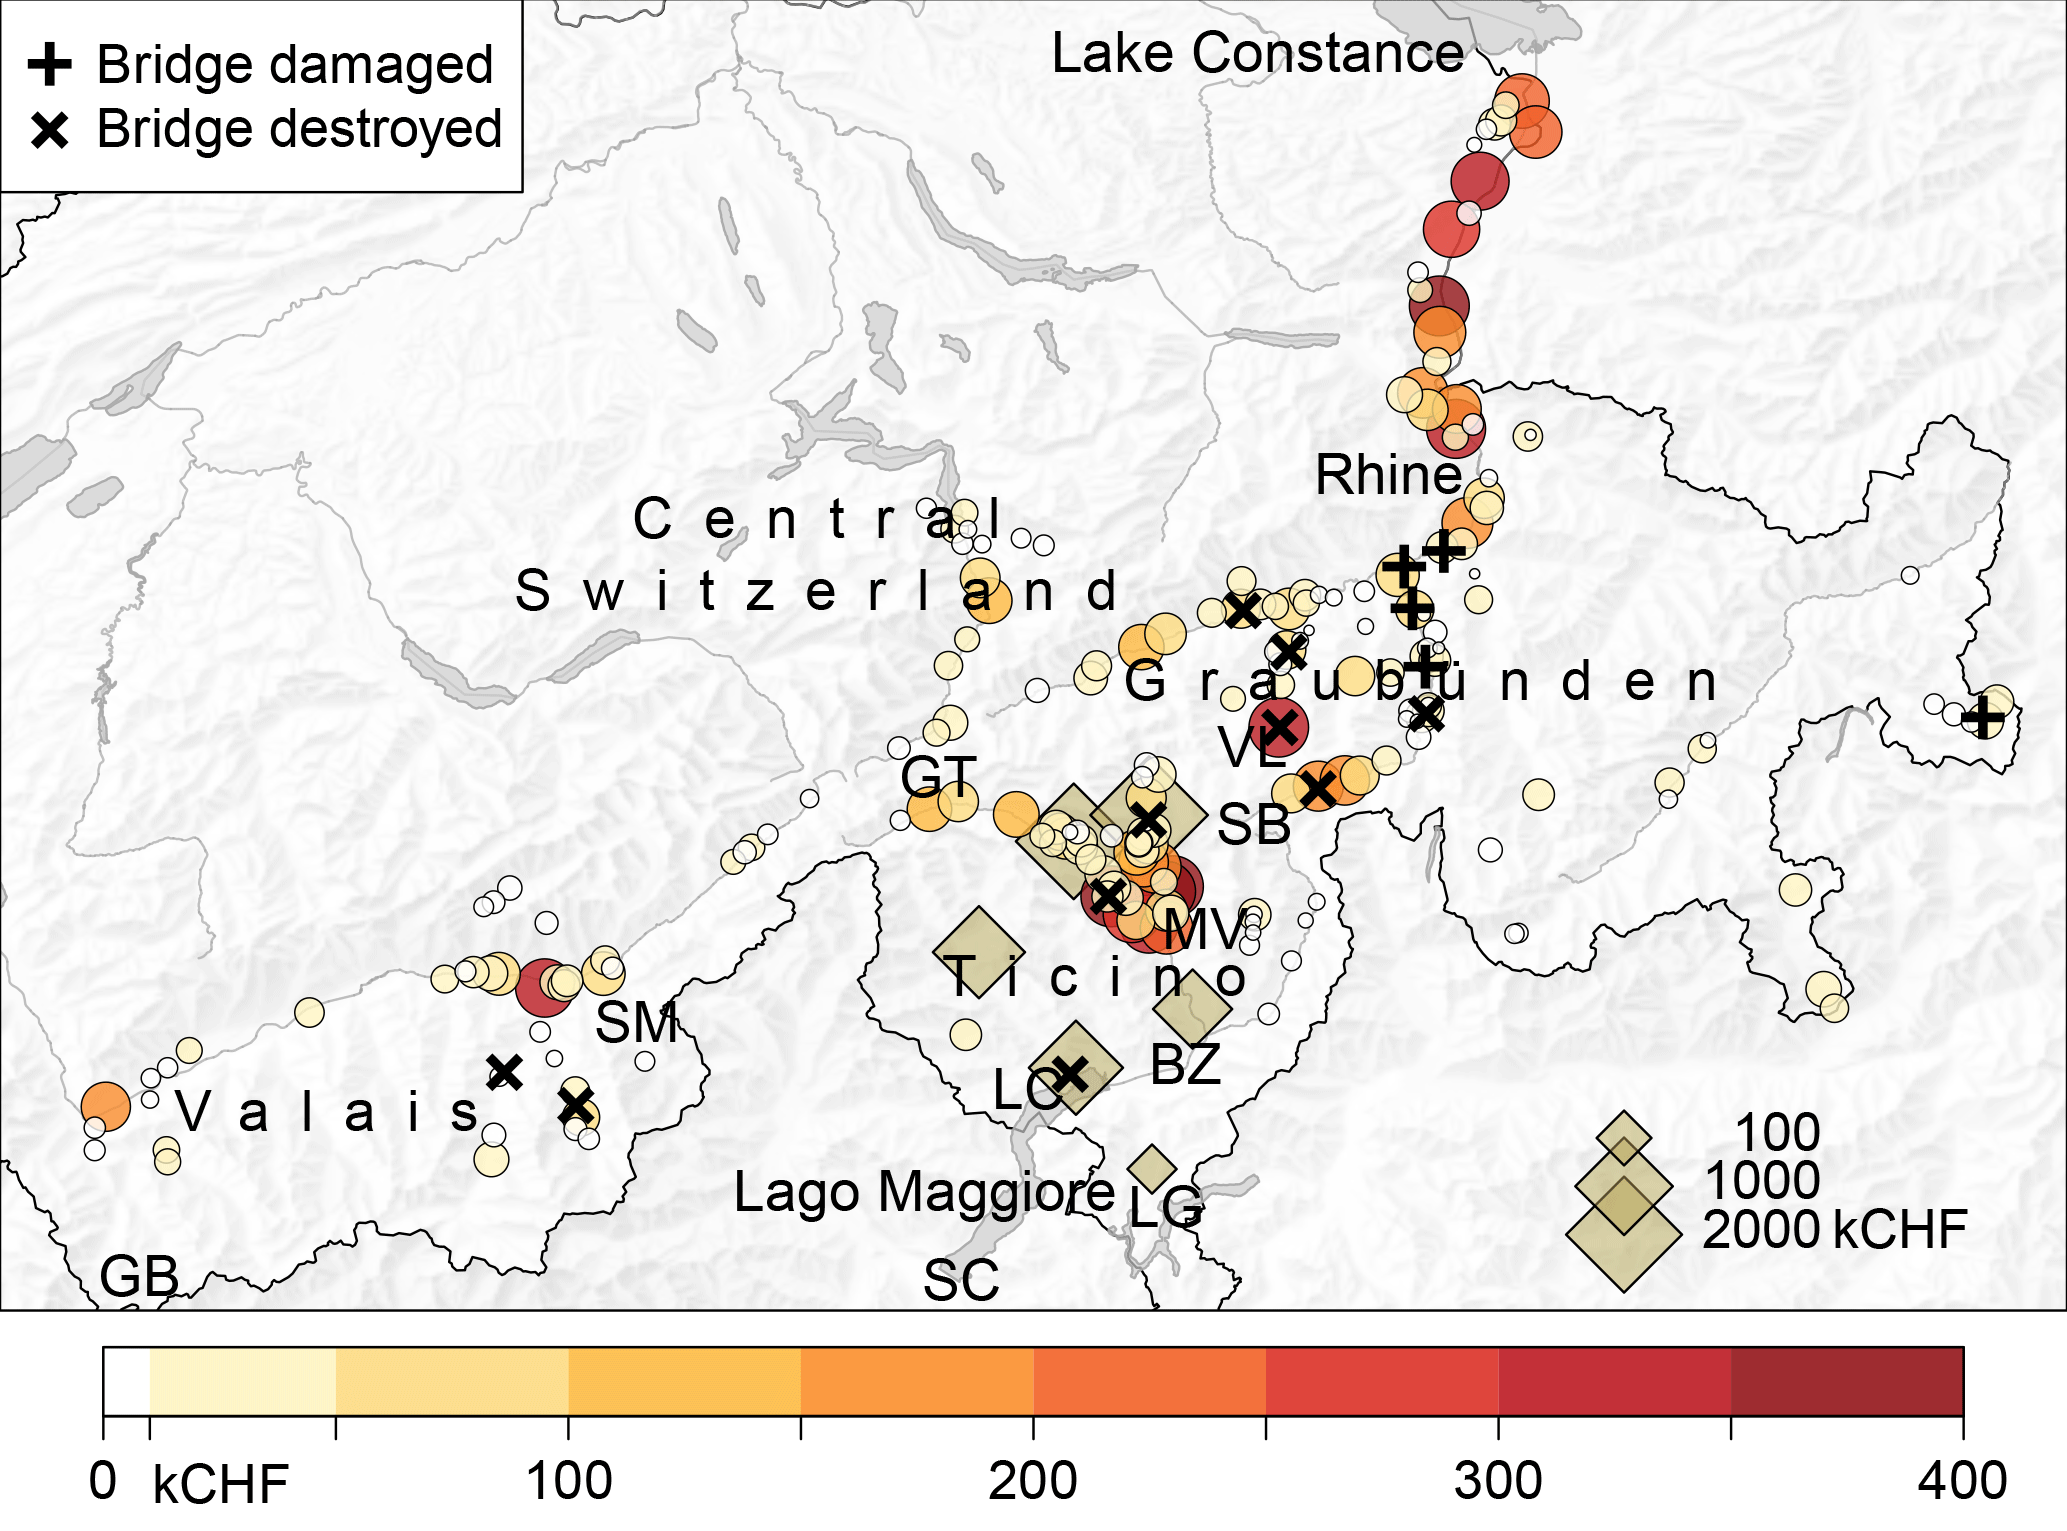
Figure 2Amounts of damage (in thousands of Swiss Francs, kCHF) as collected from contemporary surveys in five Cantons in southeastern Switzerland. Filled circles and diamonds refer to amounts of damage per municipality and administrative region, respectively, where available. Note that both regional and municipality-level values are plotted where possible. Crosses indicate reported damage to bridges. Labels refer to locations mentioned in the text: BZ Bellinzona, GB Grand St. Bernard, GT Gotthard, LC Locarno, LG Lugano, MV Malvaglia, SB San Bernardino, SM Simplon, VL Vals.
As in many mountainous regions, typical hydrometeorological ingredients associated with heavy and sustained precipitation over the central Alps include conditionally unstable layers in the troposphere, sustained and intense advection of moist low-level air masses and an orographically forced ascent (Doswell et al., 1996; Lin et al., 2001).
On a synoptic scale, extreme precipitation events on the SA are linked to upper-level troughs, i.e., regions of deep layers of relatively cool air masses located over southwestern Europe (e.g., Boudevillain, 2009; Buzzi and Foschini, 2000; Malguzzi et al., 2006; Stucki et al., 2012). In a so-called potential vorticity (PV) perspective, they correspond to the presence of meridionally elongated intrusions of stratospheric air, which denote streamers of high potential vorticity (PV) extending southwards from polar regions in the Northern Hemisphere (Appenzeller and Davies, 1992; Martius et al., 2006; Massacand et al., 1998). A number of studies have identified such PV-streamers over western Europe as precursors of heavy precipitation events on the SA (Fehlmann et al., 2000; Hoinka et al., 2006; Massacand et al., 1998). Typically, these streamers are accompanied by reduced static stability and by a southerly and ascending flow of moist air on their eastern side. Hence, a PV-streamer located west of the Alps will likely produce a large moisture flux (hereafter represented by the vertically integrated water vapor transport; IVT) towards the Alps, which is a necessary ingredient for heavy precipitation and floods over the SA (Froidevaux and Martius, 2016; Hoinka et al., 2006; Martius et al., 2006; Schlemmer et al., 2010).
On smaller scales, the complex orography of the SA further modulates the moisture flow, potentially generating heavy rainfall (Gheusi and Davies, 2004; Panziera and Germann, 2010; Rotunno and Houze, 2007). The SA is particularly prone to severe floods due to its characteristic topography, with large elevation differences, steep slopes and the concave form of the Alpine barrier, which forces southerly moist air flow to converge, rise and condensate (e.g., Bougeault et al., 2001; Frei and Schmidli, 2006; Schneidereit and Schär, 2000). For flash floods in the LMR, Panziera et al. (2015) found repeated northeastward propagation of convective cells that produce a spatially elongated area with very large precipitation amounts (for a hydrological application, see Liechti et al., 2013).
Once the precipitation falls, the hydrological response in the LMR is quick, due to the steep terrain, shallow soils and a land cover that is approximately 40 % non-forested (Andres et al., 2016). Very high runoff can form within hours, resulting in high runoff variability for SA river systems. Those rivers (i.e., Ticino, Toce, Maggia, Verzasca and Moesa) all discharge into the Lago Maggiore, which – at least to some degree – has a dampening effect on the flood wave propagation to downstream areas. At the same time, this strong concentration of river systems leads to a high disposition of the LMR to lake level rise and flooding. One advantage of the steep topography relates to the zero-degree line that is likely present during colder storm events, resulting in snow deposit rather than direct runoff. We will look at the presence and representation of all these processes in historical data, a reanalysis product and a high-resolution simulation covering the 1868 event. The study is organized as follows. Observational data and models are presented in Sect. 2. Results and discussion regarding damage and societal impacts, the chronology of the heavy precipitation, the simulated atmospheric conditions and the hydrological response of the LMR catchment are all provided in Sect. 3. A summary and conclusions are given in Sect. 4.
2.1 Meteorological and hydrological observations
Digitized series of daily rates of precipitation (05:40 to 05:40 LT of the following day, in mm) are provided by the Swiss Federal Office of Meteorology and Climatology MeteoSwiss (Füllemann et al., 2011). Additional observations are digitized from the Annals of the SchweizerischeMeteorologischeZentralanstalt (Wolf, 1868), the precursor organization of MeteoSwiss, and from Coaz (1869), although some information is redundant. Information about two Italian locations (Pallanza and Como) come from Luino et al. (2005).
Information about historical water levels is taken from Di Bella (2005) and from Stucki and Luterbacher (2010). The first series has sporadic estimations of annual maxima of the Lago Maggiore water level reaching back to 1177; the second goes back to 1500 and includes categorical information on severe or moderate floods. Systematic measurements of annual maxima of the Lago Maggiore water level are available for Sesto Calende since 1839 (taken from Di Bella, 2005), and for Locarno since 1868 (provided by the Swiss Federal Office for the Environment FOEN).
2.2 Global and regional models, dynamical downscaling
The Twentieth Century Reanalysis dataset (Compo et al., 2011) version 2c (20CR in the following) is used for synoptic-scale analyses of the 1868 flood. The 20CR is a global, three-dimensional atmospheric dataset that is based on surface pressure observations from the International Surface Pressure Databank (ISPD; Cram et al., 2015) version 3.2.9. Monthly sea surface temperature and sea ice concentrations provide the boundary conditions. Data assimilation is performed with an ensemble Kalman filter. In this study, we consider an ensemble mean of 56 members (see Sect. 3.3 for details about this choice). 20CR has a spatial grid size of 2∘ latitude × 2∘ longitude (approx. 200 km over central Europe), 31 pressure levels in the vertical, and a temporal resolution of 6 h. 20CR reaches back to 1851 and is the only global reanalysis to cover the 1868 flood event.
Regional simulations of flood-inducing weather are done by dynamical downscaling. Dynamical downscaling is a method used to obtain regional weather and climate information by nesting regional climate or weather models into global-scale models. That is, the global model drives the regional model from the regional model domain boundaries and for the temporal initialization (Dickinson et al., 1989; Giorgi et al., 1990; Giorgi and Bates, 1989). Dynamical downscaling is employed over the core period of the 1868 flood event between 26 September 00:00 UTC and 5 October 00:00 UTC. The relatively short spin-up time used here (6–12 h) allows for a good reproduction of the event, although the model might not reach full equilibrium within this span (e.g., regarding soil moisture; cf. Messmer et al., 2017; they use a spin-up of 6 h for a comparable experiment). The regional model used is the Weather Research and Forecasting model WRF-ARW (Advanced Research WRF; Skamarock et al., 2008). The downscaling from 20CR is performed in four nested model domains with grid sizes of 54, 18, 6 and 2 km. All domains contain 40 vertical levels. The time step is 11 s in the innermost domain and output frequency is 1 h. With regard to physics parameterizations, we use Ferrier (eta levels) for microphysics, Kain Fritsch for convection, Noah for the land surface, revised MM5 for the surface layer, YSU for the planetary boundary layer and Dudhia and RRTM for short- and long-wave radiation (see the WRF ARW user guide at http://www2.mmm.ucar.edu/wrf/users/docs/user_guide_V3/contents.html, last access: 9 October 2018). The convection parameterization is turned off for the innermost domain because deep convection is resolved explicitly by the model at this scale. In order to maintain the large-scale information in WRF close to 20CR during the entire simulation, we apply spectral nudging to horizontal wind, temperature and geopotential height in the outermost domain. We nudge only wavelengths >1000 km with a relaxation time scale of 1 h. Nudging is switched off in the planetary boundary layer and starts from the 10th model level upwards. Although relatively weak nudging is applied, we need to keep in mind that the results cannot be considered as stemming from a pure hindcast experiment.
2.3 Analog resampling method and hydrological model
An analog resampling method (see Flückiger et al., 2017; Rössler and Brönnimann, 2018, for details) is used to reconstruct daily weather patterns of precipitation and temperature during the 12 months before the extreme flood in early October 1868. With this method, we select analog days in the modern period from 1961 to 2015 that are most similar (in terms of observed pressure fields, temperature and precipitation amounts) to the historical period between 1 October 1867 and 31 October 1868. For physical consistency, analog days must have the same weather type and be within the same season as the days to be reconstructed. Here, the CAP7 weather types from Schwander et al. (2017) are used. The analog selection is based on station data from Lugano and Zurich provided by MeteoSwiss and the instrumental series of Milano and Padova, taken from the IMPROVE project (Camuffo and Jones, 2002). Additionally, time series of precipitation and temperature are extracted from 20CR at the grid point 46∘ N, 6∘ E. The data are standardized and the Euclidean distance is applied as a similarity measure for analog days. For the best analog day, we extract temperature and precipitation from the MeteoSwiss RhiresD 2.2 km gridded dataset (Frei, 2014; Frei et al., 2006; Frei and Schär, 1998), as well as from the E-OBS dataset (Haylock et al., 2008). E-OBS provide meteorological fields of temperature and precipitation that were generated by interpolating station data. Hofstra et al. (2009) showed – despite some inhomogeneity stemming from the underlying station data – that correlations with observations recorded for a denser stations network are high overall. Larger differences can be found for precipitation with E-OBS, showing a bias towards lower values. To correct for this bias, we calculated the bias between the RhiresD 2.2 km dataset and the E-OBS data for the fraction of the LMR in which both datasets are available. We found a mean bias of −30 % for the E-OBS dataset that is very likely topography-induced, and we corrected all E-OBS precipitation data with this empirical value. Finally, the two products (RhiresD and E-OBS) are merged such that RhiresD represents the Swiss part of LMR and corrected E-OBS the non-Swiss part of LMR. Temperature values are not adjusted.
The hydrological simulations in this study are accomplished using the semi-distributed rainfall-runoff model PREVAH (Gurtz et al., 1999; Viviroli et al., 2009), previously calibrated for the LMR hydrological system until the Ticino–Sesto Calende (SC in Fig. 2) gauge at the outflow of the Lago Maggiore (Andres et al., 2016). The original model version by Andres et al. (2016) runs at hourly time steps and considers the numerous regulations and hydropower plants present today by coupling with a routing model RS (Jordan et al., 2012). As we are interested in the unregulated hydrological system of 1868, we simulate removed regulations by only applying the hydrological model. The entire catchment is subdivided into 37 headwater catchments that are routed using a simplified scheme, aggregating runoffs to daily sums. This approach seems valid because the concentration time for all catchments upstream of the lake is shorter than 1 day. For the semi-distributed hydrological model, the meteorological fields inform 100 m elevation bands in each sub-catchment. For this project, the data from Arealstatistik 1992/1997 (southern Ticino, available at https://www.bfs.admin.ch/bfs/de/home/statistiken/raum-umwelt/erhebungen/area/geschichte/area-1992-97.html, last access: 9 October 2018) and Arealstatistik 2004/2009 (northern Ticino; available at https://www.bfs.admin.ch/bfs/de/home/statistiken/raum-umwelt/erhebungen/area/geschichte/area-2004-09.html, last access: 9 October 2018) are used. The domain in Italy is covered by CORINE Land Cover data 2006 (taken from https://www.eea.europa.eu/data-and-maps/data/clc-2006-raster-4, last access: 9 October 2018). The outflow of Lago Maggiore is displayed by a lake level–outflow relationship that is derived from recent observations and riverbed topography. These observations do not represent the discharge and lake-level conditions in 1868, as a regulatory dam has been operational since 1943. To validate the quality of this adjusted model, we compare simulated against observed lake levels for the time period 1970–2010 (Fig. A1 in the Appendix). Today, Lago Maggiore is heavily regulated. Especially during winter, water is retained to provide irrigation water for downstream lowlands. Consequently, the comparison of long-term means (1980–2010) shows a good representation of lake levels for the summer. For the winter months (November–April), simulations only match when considering a temporal storage of water. As true regulations are unknown, we assume a monthly storage factor between 5 % and 12 % of the inflow.
3.1 Spatial extent and intensities of damage, societal impact
Information regarding damage locations and intensity, as well as about the weather during the flood event, mainly comes from two contemporary reports (Arpagaus, 1870; Coaz, 1869). They focus on damage in the Swiss Canton of Graubünden in the eastern part of Switzerland, and particularly on flooding along the Alpine Rhine between its sources and Lake Constance (see labels in Fig. 2). However, some damage information for other Cantons is also available from these sources. The financial information from these reports coincides with the official damage lists found in the Swiss Federal Archives (Schweizerisches Bundesarchiv, 1868a, b, c).
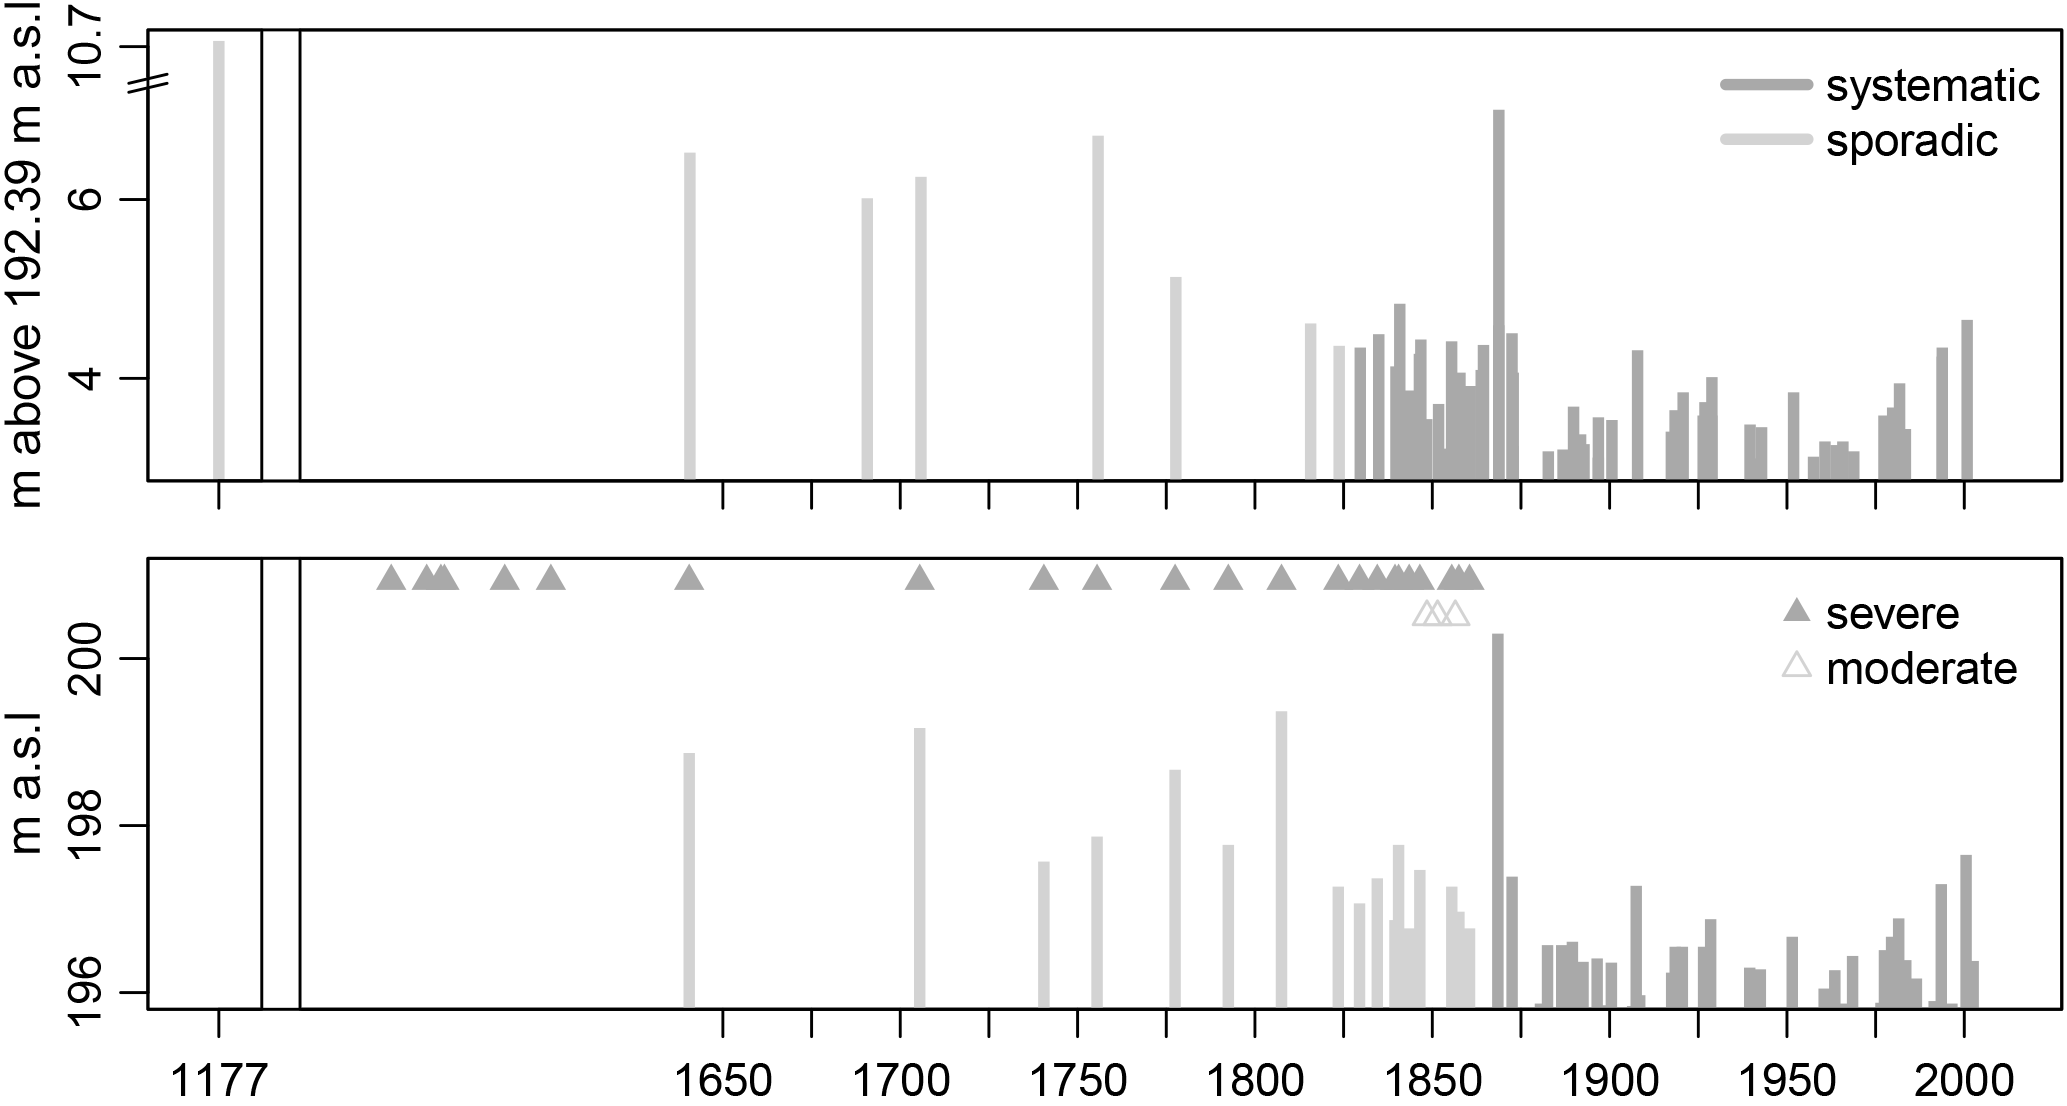
Figure 3Reconstructed (light grey bars) and measured (dark grey bars) lake levels at Sesto Calende (top; data from Di Bella, 2005) and Locarno–Lago Maggiore (bottom; data from Stucki and Luterbacher, 2010). In addition, reconstructed flood events classified as “severe” (dark grey triangles) and “moderate” (light grey triangles) are shown for Lago Maggiore.
Figure 2 maps the reported damage intensities in terms of Swiss Francs (CHF) on the municipality or regional administrative level where available, and includes information on damaged or destroyed bridges in the area. Overall, the flood of 1868 resulted in CHF 14 million in damage, of which CHF 6.5 million accrued in the Canton of Ticino. In the year 2000, these numbers would be equivalent to CHF 915 million and 425 million, respectively (adjusted for inflation, not including changes in assets, vulnerability or exposure; Summermatter, 2012); that is, they would have increased by a factor of 65. Along with material losses, a high number of fatalities occurred: in total, 50 people were killed by the floods and landslides, 42 of whom were in the Canton of Ticino (Landolt, 1869). One of the most affected municipalities was Malvaglia (label MV in Fig. 2), where 20 people lost their lives and the damage costed an estimated CHF 400 000. The highest amounts of damage were found in the northern part of the Canton of Ticino, with values between 100 000 and CHF 400 000 per municipality, amounting to approx. CHF 4.1 million for the two related administrative regions. The reports indicate that nearly every bridge in Locarno (label LC) was damaged, adding > CHF 500 000 in costs in this municipality alone. In the Canton of Graubünden, nearly all municipalities along the river Rhine were affected by flooding, and several very severe mud flows occurred. For example, the village of Vals (label VL) was virtually covered with mud and damage amounted to around CHF 350 000. Further downstream, water masses accumulated such that four temporary lakes developed near Lake Constance, leading to damage of approximately CHF 1.2 million in six municipalities. In addition, the breakdown of transport infrastructure had severe ramifications. Many bridges were completely destroyed along the Rhine. Although the Alpine valleys in the easternmost part of Switzerland were spared, severe costs accrued in the Canton of Valais (e.g., with > CHF 300 000 in costs along the main valley of the Rhone and to the south) and in several Cantons in central Switzerland.
Of the overall damage of CHF 14 million, more than half occurred on cultivated land and thus had to be borne by private individuals. The water and bedload not only destroyed the harvests, but also made it impossible to cultivate the fields for years. This endangered the livelihoods of the predominantly agricultural population in the poor Alpine regions. As no insurance existed at that time, affected people were reliant on the generosity of their neighbors and fellow citizens. In the days and weeks following the flood event, numerous collections of donations took place, coordinated by the Swiss federal government. They turned out to be a huge success: Pfister (2003) estimates that more than half of all households in Switzerland participated by contributing a large quantity of natural produce and a total of CHF 3.6 million, more than ever before.
Given the extreme magnitude of the damage, the question of the cause of the flood and of protection measures came up immediately. The federal government assigned Carl Culmann, Elias Landolt and Arnold Escher von der Linth, professors of engineering, forestry and geology, respectively (all three at the Swiss Federal Institute of Technology in Zürich), to furnish an expert opinion. The same three experts had already delivered reports on potential flood protection measures in the early 1860s. In these reports, they criticized the selective protection methods and, amongst other things, asserted that deforestation in the upper reaches was responsible for the floods in the valley floors (Culmann, 1864; Landolt, 1862). This explanation was not new: first stated by French engineers in the late 18th century, the theory that deforestation resulted in more severe flooding had spread widely. In Switzerland, where large areas were deforested as populations expanded during the late 18th and early 19th century, the connection between floods and deforestation also seemed a plausible explanation for the frequent and severe flood events (e. g. in the years 1834, 1839 and 1852). Lobbying by the Swiss Forestry Society contributed significantly to the dissemination and success of this idea at the federal level (Pfister and Brändli, 1999).
In their reports, dated 1862 and 1864, respectively, the three experts spoke in favor of establishing forest protection measures, a federal legislation and subsidies for river corrections and reforestation projects. Although the Federal Council took note of the statements, they did not take action until the flood of 1868. The extent of the event showed the urgency for protection measures and coordinated action on a national level. In their second assessment, Landolt, Culmann and Escher von der Linth noted that the large amount of precipitation and the saturated soils were the main reason for the flooding. However, they also pointed out the poor conditions of the forests and the insufficient hydraulic structures. Accordingly, they emphasized their recommendations and presented more detailed concepts. The few critical views questioning the generalized correlation between forests and floods (e.g., Blotnitzky, 1869) were not discussed publicly because the Swiss Forestry Society feared losing political momentum (Summermatter, 2012).
This time, the government heeded the proposals of Culmann, Landolt and Escher von der Linth. Only three years after the catastrophic flood, the parliament accepted a federal decree on subsidization for protective structures and reforestation measures. The consequential laws – the Forest Act and the Hydraulic Engineering Act – came into effect in 1876 and 1877, respectively. With these laws, the federal state committed to financially supporting flood protection measures. This had far-reaching impacts: in the following decades, numerous rivers and streams were modified and hundreds of hectares were afforested.
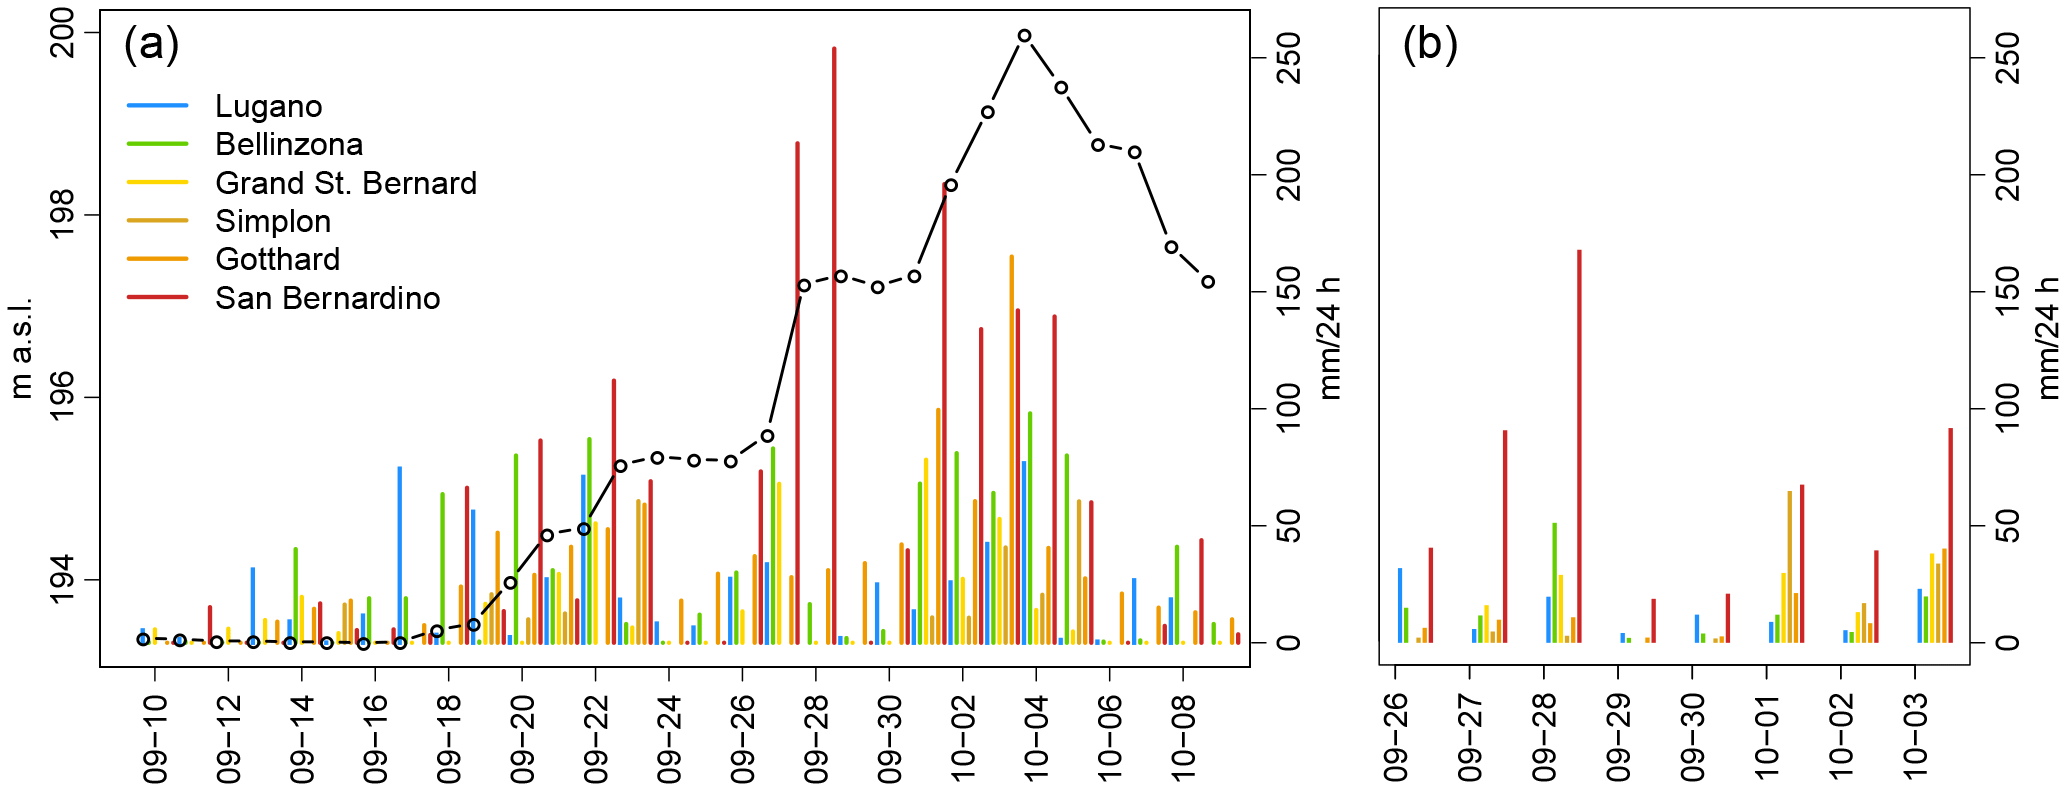
Figure 4(a) Mean daily lake level of Lago Maggiore (m a.s.l.; black line) and observed daily precipitation (mm 24 h−1; from 05:40 to 05:40 LT the following day) at six rain gauge stations between 10 September 1868 and 10 October 1968. (b) Simulated daily precipitation (mm 24 h−1; from 06:00 to 06:00 UTC the following day) at the locations of panel (a). Note that the Simplon Pass observations have missing data, and that the time axis and spacing differ between panels (a) and (b).
3.2 Reconstruction of water level and precipitation from observations
The water levels of the Ticino river at the outflow from Lago Maggiore in Sesto Calende (label SC in Fig. 2) have been recorded systematically since 1829, and a number of reconstructed water levels are available for the Lago Maggiore area (Fig. 3). It can be inferred from the available information that water levels of the Lago Maggiore during the 1868 flood event were arguably the highest since 1177. They are by far the highest in the instrumental period, exceeding the flood levels of October 2000 and September 1993 by >2.5 m (Stucki et al., 2012, 2013; and references therein). In Sesto Calende, flood levels 6.9 m above the zero-measure level were observed.
Measurements at Locarno show a gradual increase in the water level (daily mean; Fig. 4a) from below 194 m a.s.l. before 19 September 1868 to approximately 195 m a.s.l. in the period of 23–26 September 1868, to about 197 m a.s.l. around the end of September 1868. Over the period 3–5 October 1868, water levels peaked at values above 199 m a.s.l. These marked increases were associated with four distinct periods of heavy precipitation on 17–20, on 22–23, on 26–28 September 1868 and on 1–5 October 1868 (e.g., shown by >50 mm 24 h−1 at >=1 gauge station in Fig. 4). In the following, these periods are called episodes 09-17, 09-22, 09-27 and 10-03, respectively. The measurement stations in the lowland LMR (Lugano, Bellinzona) and on the western part of the Swiss Alpine divide (Grand St. Bernard pass; see labels in Fig. 2) recorded precipitation rates of up to 100 mm 24 h−1 during all periods. The gauge stations on the central and eastern parts of the Swiss Alpine divide reached values of >150 mm 24 h−1 (at Gotthard pass; label GT in Fig. 2) or even up to >250 mm 24 h−1 (San Bernardino pass on 28 September 1868; label SB in Fig. 2). All available observations of daily precipitation amounts are mapped in Fig. 5 for 2 days within the episodes 09-27 and 10-03, respectively. On 27 September 1868, heavy precipitation was mostly restricted to the SA. The following day, heavy precipitation reached across the Alpine divide in southeastern Switzerland and achieved higher values than elsewhere the day before. Large differences in precipitation amounts over short distances persisted, and no dependence of precipitation intensity on elevation was observed. This indicates convective and potential thunderstorm activity over the SA and southwestern Switzerland (see Stucki et al., 2012). On 3 October 1868, a similar distribution occurred with more and less precipitation along the Alpine divide and northwestern Switzerland, respectively. On 4 October 1868, the precipitation rates were generally lower, and the highest daily precipitation was observed in the southern parts of Graubünden.
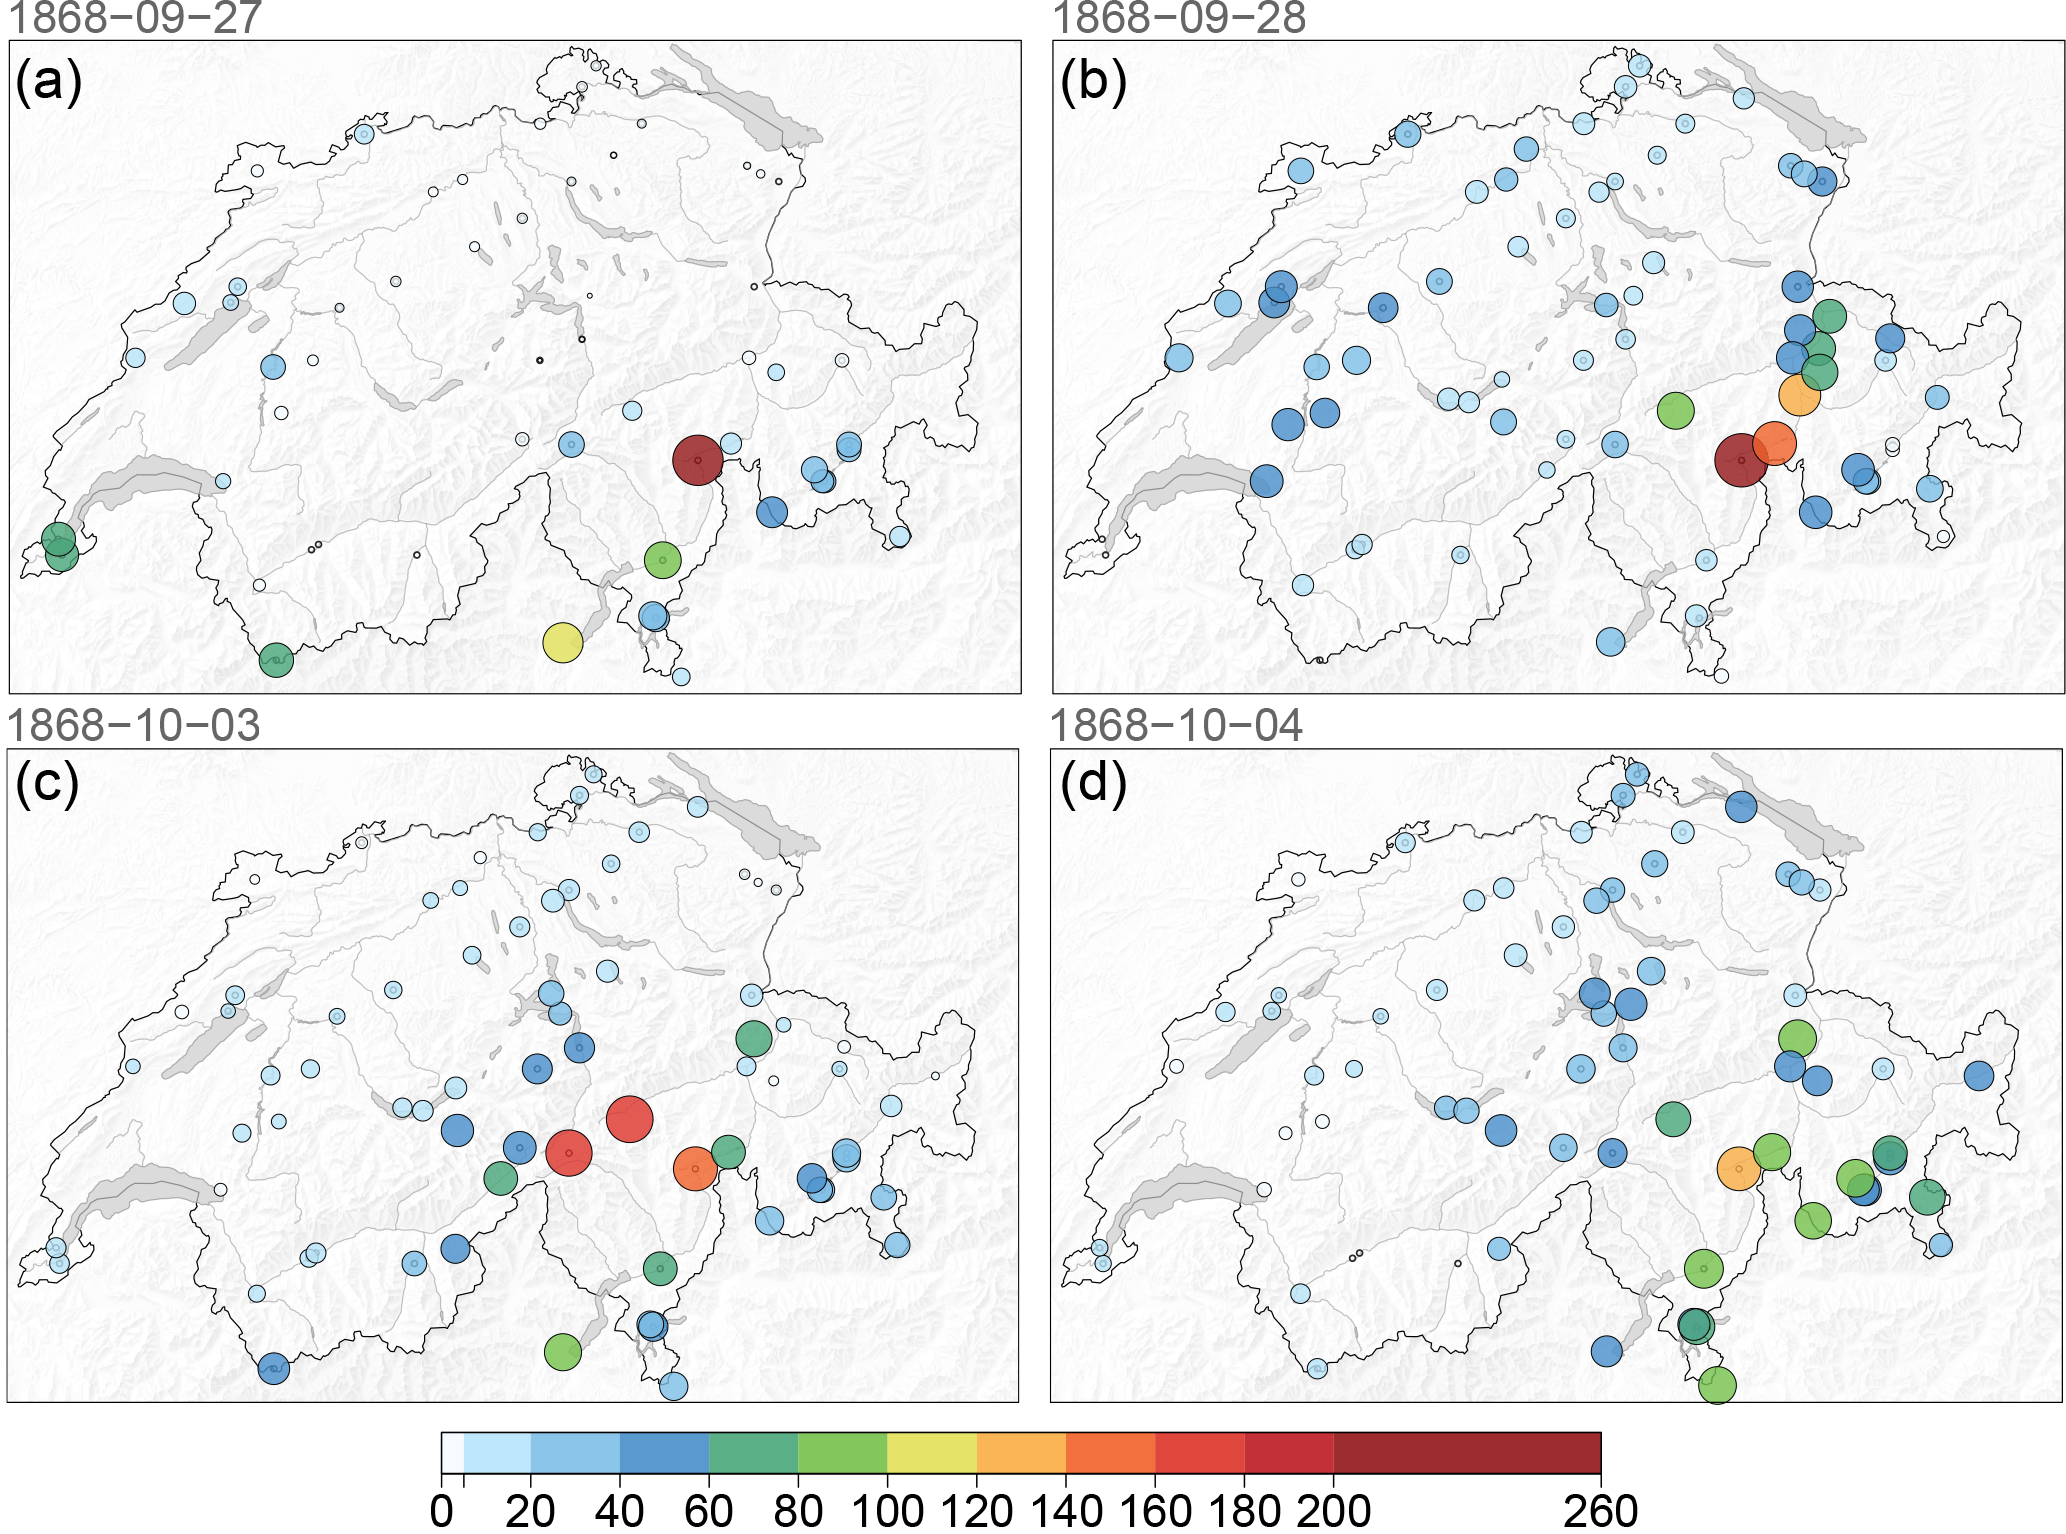
Figure 5Observations of daily precipitation (mm 24 h−1 from 05:40 LT) for (a) 27 September 1868, (b) 28 September 1868, (c) 3 October 1868 and (d) 4 October 1868 as collected from Wolf (1868), Coaz (1869) and Luino et al. (2005). Note that not all daily values are available for all stations.
In summary, the spatial heterogeneity of precipitation indicates heavy thunderstorm activity during the episodes 09-27 and 10-03. The analyses show a local concentration of extreme precipitation over the SA that reached across the Alpine divide into (central) Graubünden for episodes 09-27 and 10-03. Very high precipitation amounts of up to 100 mm 24 h−1 or more were also observed at stations located across the central Swiss Alps (Cantons of Valais and central Switzerland), particularly during the 10-03 episode. The observed spatial distribution and intensities of heavy precipitation correspond well with the observed amounts of damage in Fig. 2. As an exception, the damage reported for the western part of the Canton of Ticino cannot be verified due to unavailable precipitation measurements in this region.
3.3 Synoptic-scale atmospheric conditions
The synoptic-scale atmospheric conditions are analyzed using the 20CR dataset. A particular feature of 20CR is that it presents a range of potential solutions resulting from the uncertainty of the measurements and the distribution of the assimilated data. This range is represented by an ensemble of 56 members, all of which are equally likely. The range of outcomes from analyzing the ensemble members can be exploited for risk assessment studies (e.g., Welker et al., 2015). For studies that do not have the objective or the means for such a procedure, like the present study, the ensemble mean is a natural and preferred choice (e.g., Caillouet et al., 2016; Carillo et al., 2017; Michaelis and Lackmann, 2013; Parodi et al., 2017).
In our case, the selection is based on comparisons of pressure fields in the 20CR ensemble mean and members. Figure A2 depicts all 56 solutions for the 1008 hPa isobars and for four time steps during the 1868 event. Over central and southwestern Europe, the isobars remain within a narrow band. The ensemble mean represents a middle scenario; it runs always within the bulk of the members. This small bandwidth is also manifest in the standard deviation (the “spread” in terms of 20CR; see Compo et al., 2011) of the pressure fields, which is mostly below 1 hPa in the region of interest for all time steps. At the three points in time where the low-pressure system is located over central Europe, the pressure minima of the 56 ensemble members are mostly co-located within a small number of grid points, and the interquartile range spans 5 hPa or less. The minimum pressure values in the ensemble mean lie between the 54th and 57th percentile of the ensemble members. This illustrates that there is hardly any smoothing effect in the pressure fields of the ensemble mean, that is, over the region of interest. In contrast, the uncertainties become much larger over Africa or the North Atlantic. On 28 September 1868, for instance, the low-pressure system is only well-defined along the European continent.
To further assess the uncertainty of 20CR in the region and time of interest, we analyzed specific diagnostics for each observation that went into the assimilation (see the ISPD; Cram et al., 2015). Specifically, we analyzed the background departure (observation minus first guess). Figure A2 shows that the observations reduce the ensemble spread by a factor of 0.5 to 0.75 at almost all locations. Observation departures are relatively small and no clear pattern of deepening or weakening the pressure fields appears. This means that there are no outlier weather stations that dominate the field.

Figure 6Synoptic analyses for 17 September 1868 12:00 UTC (a, c, e) and 22 September 1868 12:00 UTC (b, d, f). (a, b) PV units at the 330 Kelvin isentrope, and wind speed (in ≥50 knots according to wind barbs) at 250 hPa. (c, d) Integrated water vapor transport (shade and vectors; kg m−1 s−1). (e, f) Moisture flux divergence (g kg−1 s−1; shade; negative values indicate flow convergence) and transport (m s−1 kg kg−1, vectors) at 850 hPa levels, geopotential height (bold and dashed black isolines; decameters) at 500 hPa, and precipitable water for the entire atmosphere (red contours indicate 25 kg m−2).
Overall, the relatively small uncertainty ranges in our analyses show that the 20CR ensemble mean is able to deduce the large-scale physical parameters for this area of the world and for our case in a physically consistent way. As such, the 20CR ensemble mean represents a “minimum-error estimate” of the true state (following Compo et al., 2011). Of course, with so little available station data for 1868, this “minimum error” may be large in comparison to more recent cases. Still, it is the best we have to date while improvements of the 20CR are on the way. In conclusion, we regard the 20CR ensemble mean as a well-reasoned and valid choice for further analyses. In the following, only the ensemble mean is used for synoptic-scale analyses and dynamical downscaling.
To start with, we employ a PV- and IVT-perspective to look at the upper-level dynamics during all four episodes of heavy precipitation. The first episode (episode 09-17; see Sect. 3.2) was characterized by the amplification of an upper-tropospheric wave (i.e., a meridionally undulating upper-level wind field) and the development into a PV-streamer that reached northern Africa (on the 330-K isentrope) on 16 September 1868 (not shown). During this time, this trough and a subsequent trough moving in from upstream merged into one broad trough associated with a very strong moisture flux reaching the SA from the southwest (Fig. 6a, c and e).
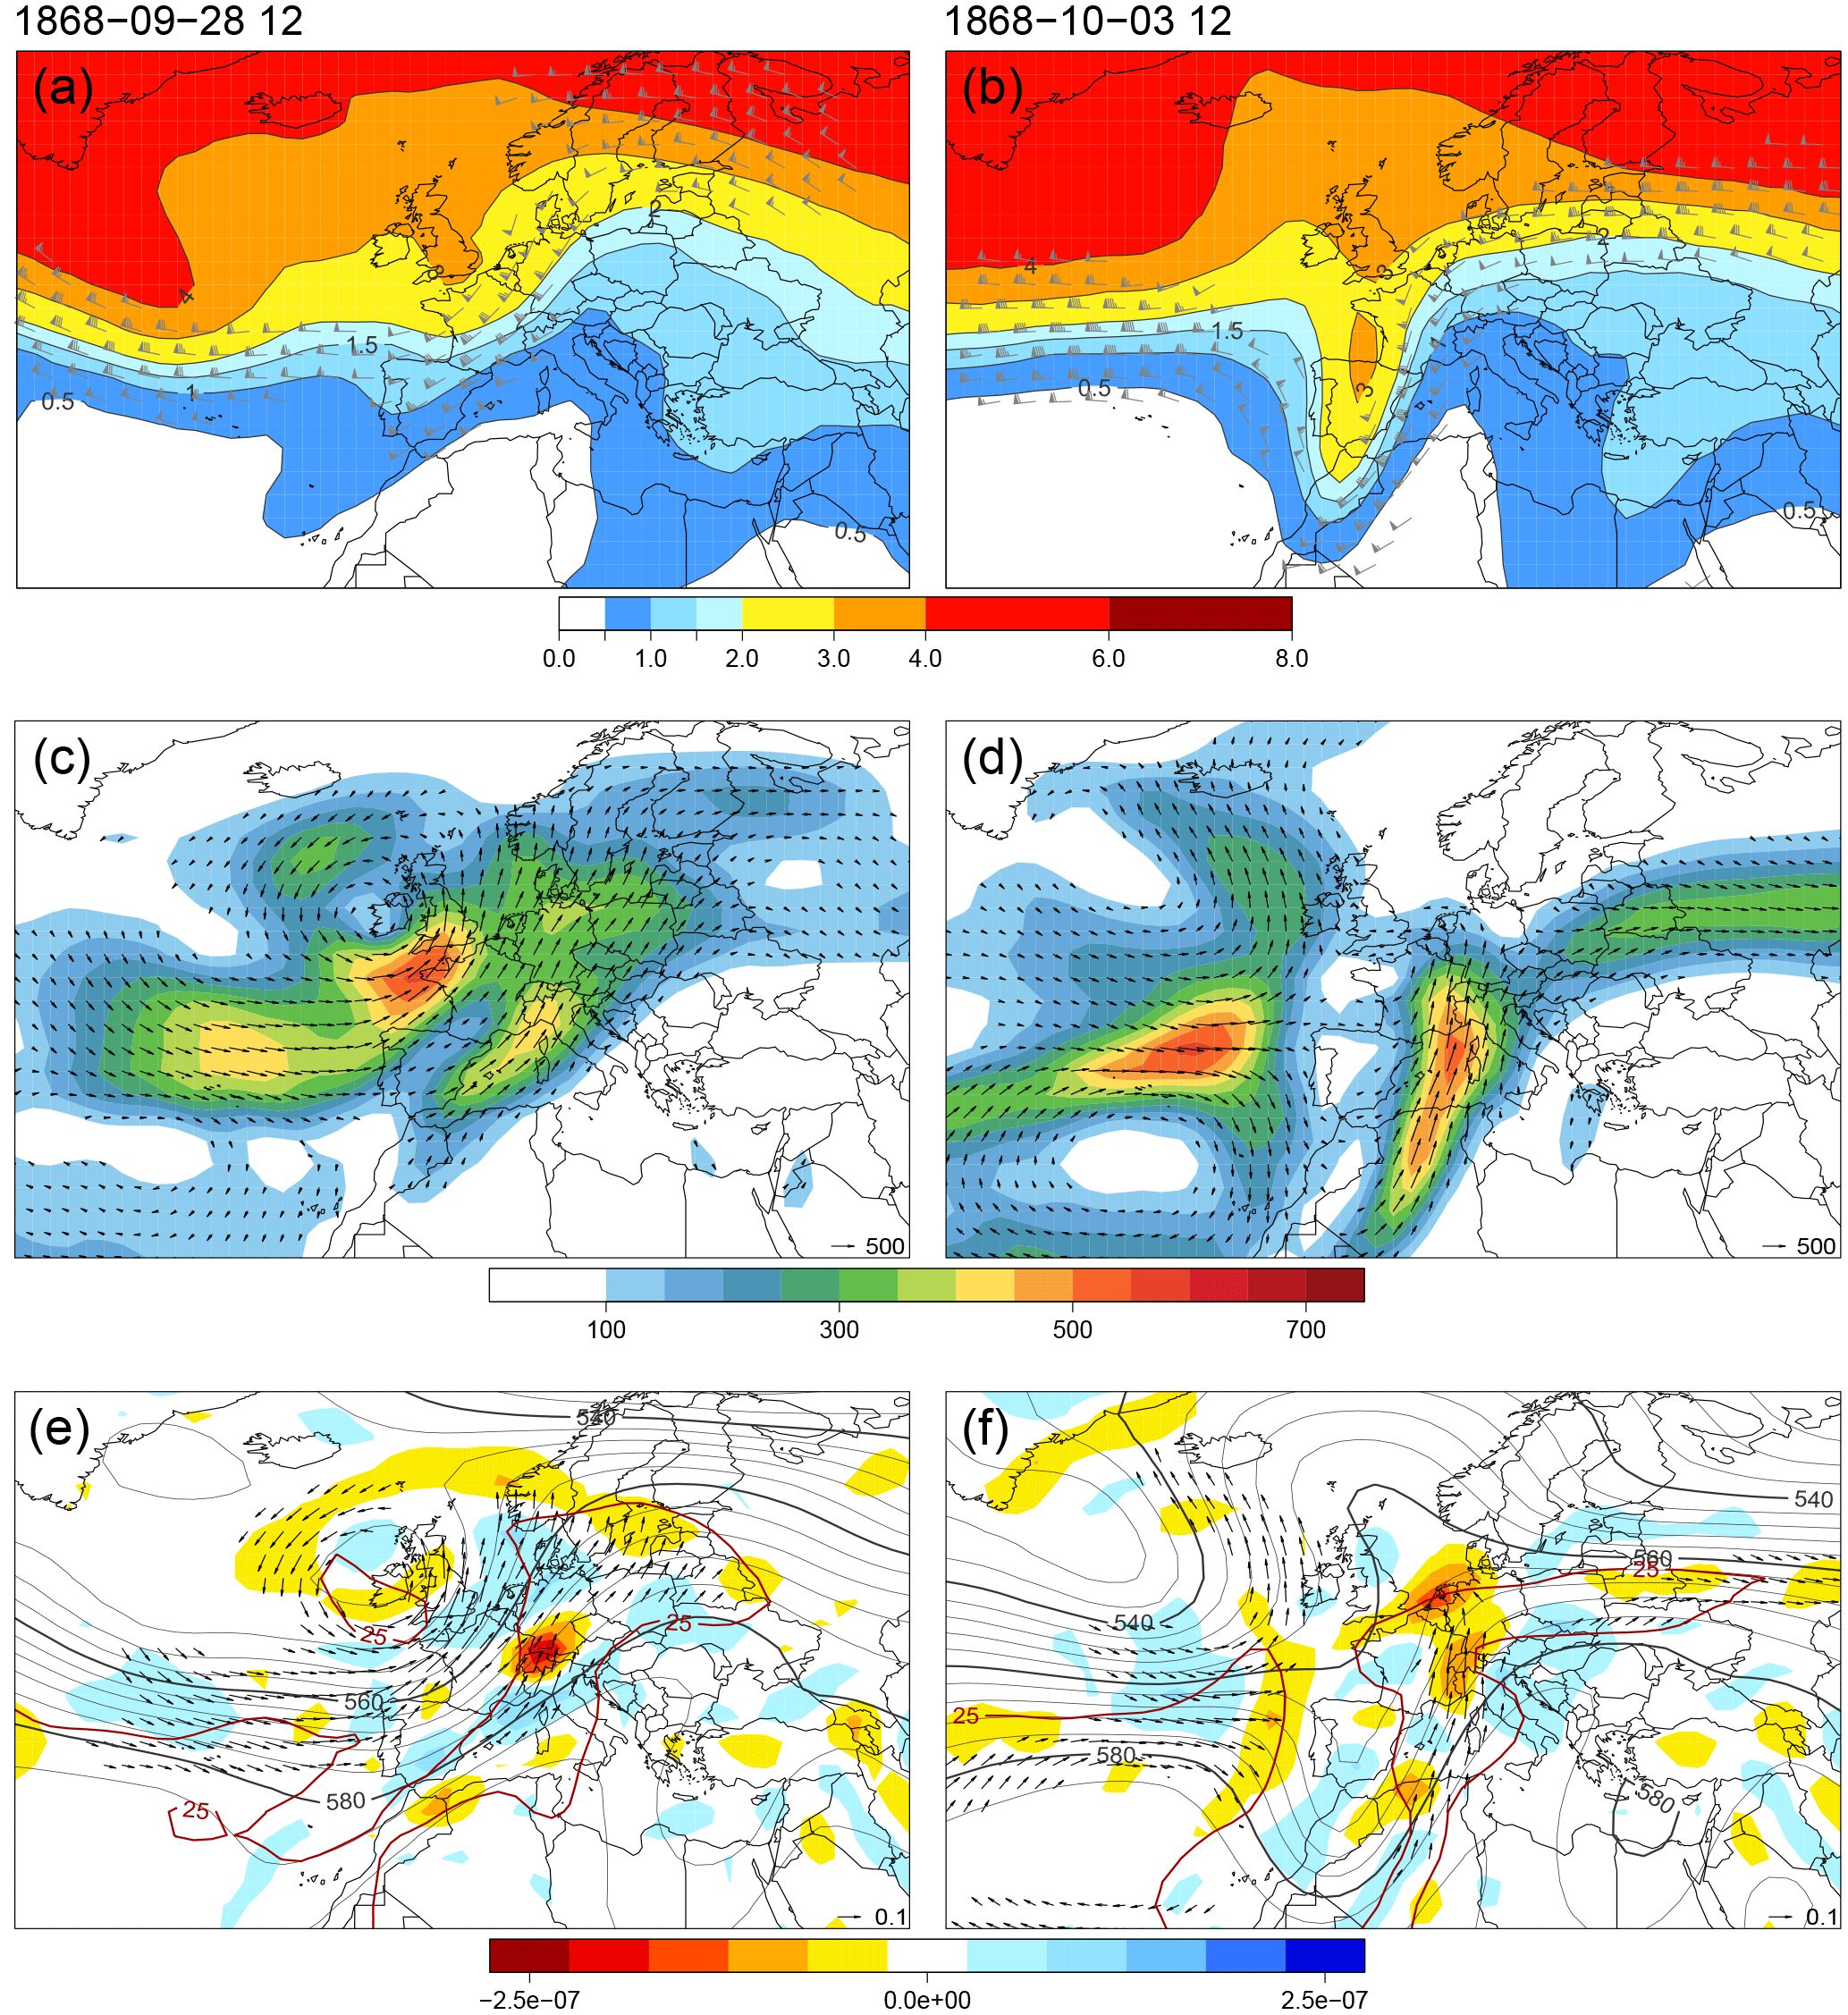
Figure 7As in Fig. 6, but for 28 September 1868 12:00 UTC (a, c, e) and 3 October 1868 12:00 UTC (b, d, f).
At the beginning of the second episode (09-22), another trough formed over western Europe on 21 September 1868 and cyclonical Rossby wave breaking occurred on 22 September 1868 (detectable as an S-form in the PVU contours over the western Alps in Fig. 6b). The associated, very strong southwesterly flow brought moist air towards the SA (Fig. 6d and f). A strong ridge, located downstream of the trough, persisted through 23 September 1868.
The third episode (09-27) started with a subsequent trough over the central Atlantic that reached equator-ward to 30∘ N on 26 September 1868, an associated jet stream passing just north of Switzerland, and persistently strong southwesterly moisture flux on the SA (IVT almost constantly 300 kg m−1 s−1) between 25 and 29 September 1868 (Fig. 7c and e). The trough then moved slowly eastward and underwent anticyclonic wave breaking on 28 October 1868 (Fig. 7a).
A following, meridionally extended high-PV trough reached western Europe on 30 September, remained stationary due to a strong ridge downstream (not shown), then amplified and turned into a PV-streamer over the next days (the fourth episode; 10-03; Fig. 7b) until its decay on 4 October. The episode was accompanied by strong and persistent moisture flux from the southwest (IVT >300 kg m−1 s −1) to the SA (Fig. 7d and f), but shifted slightly from southwesterly to southerly this time. Maximum IVT values on the southwestern SA were reached on 3 October 1868.
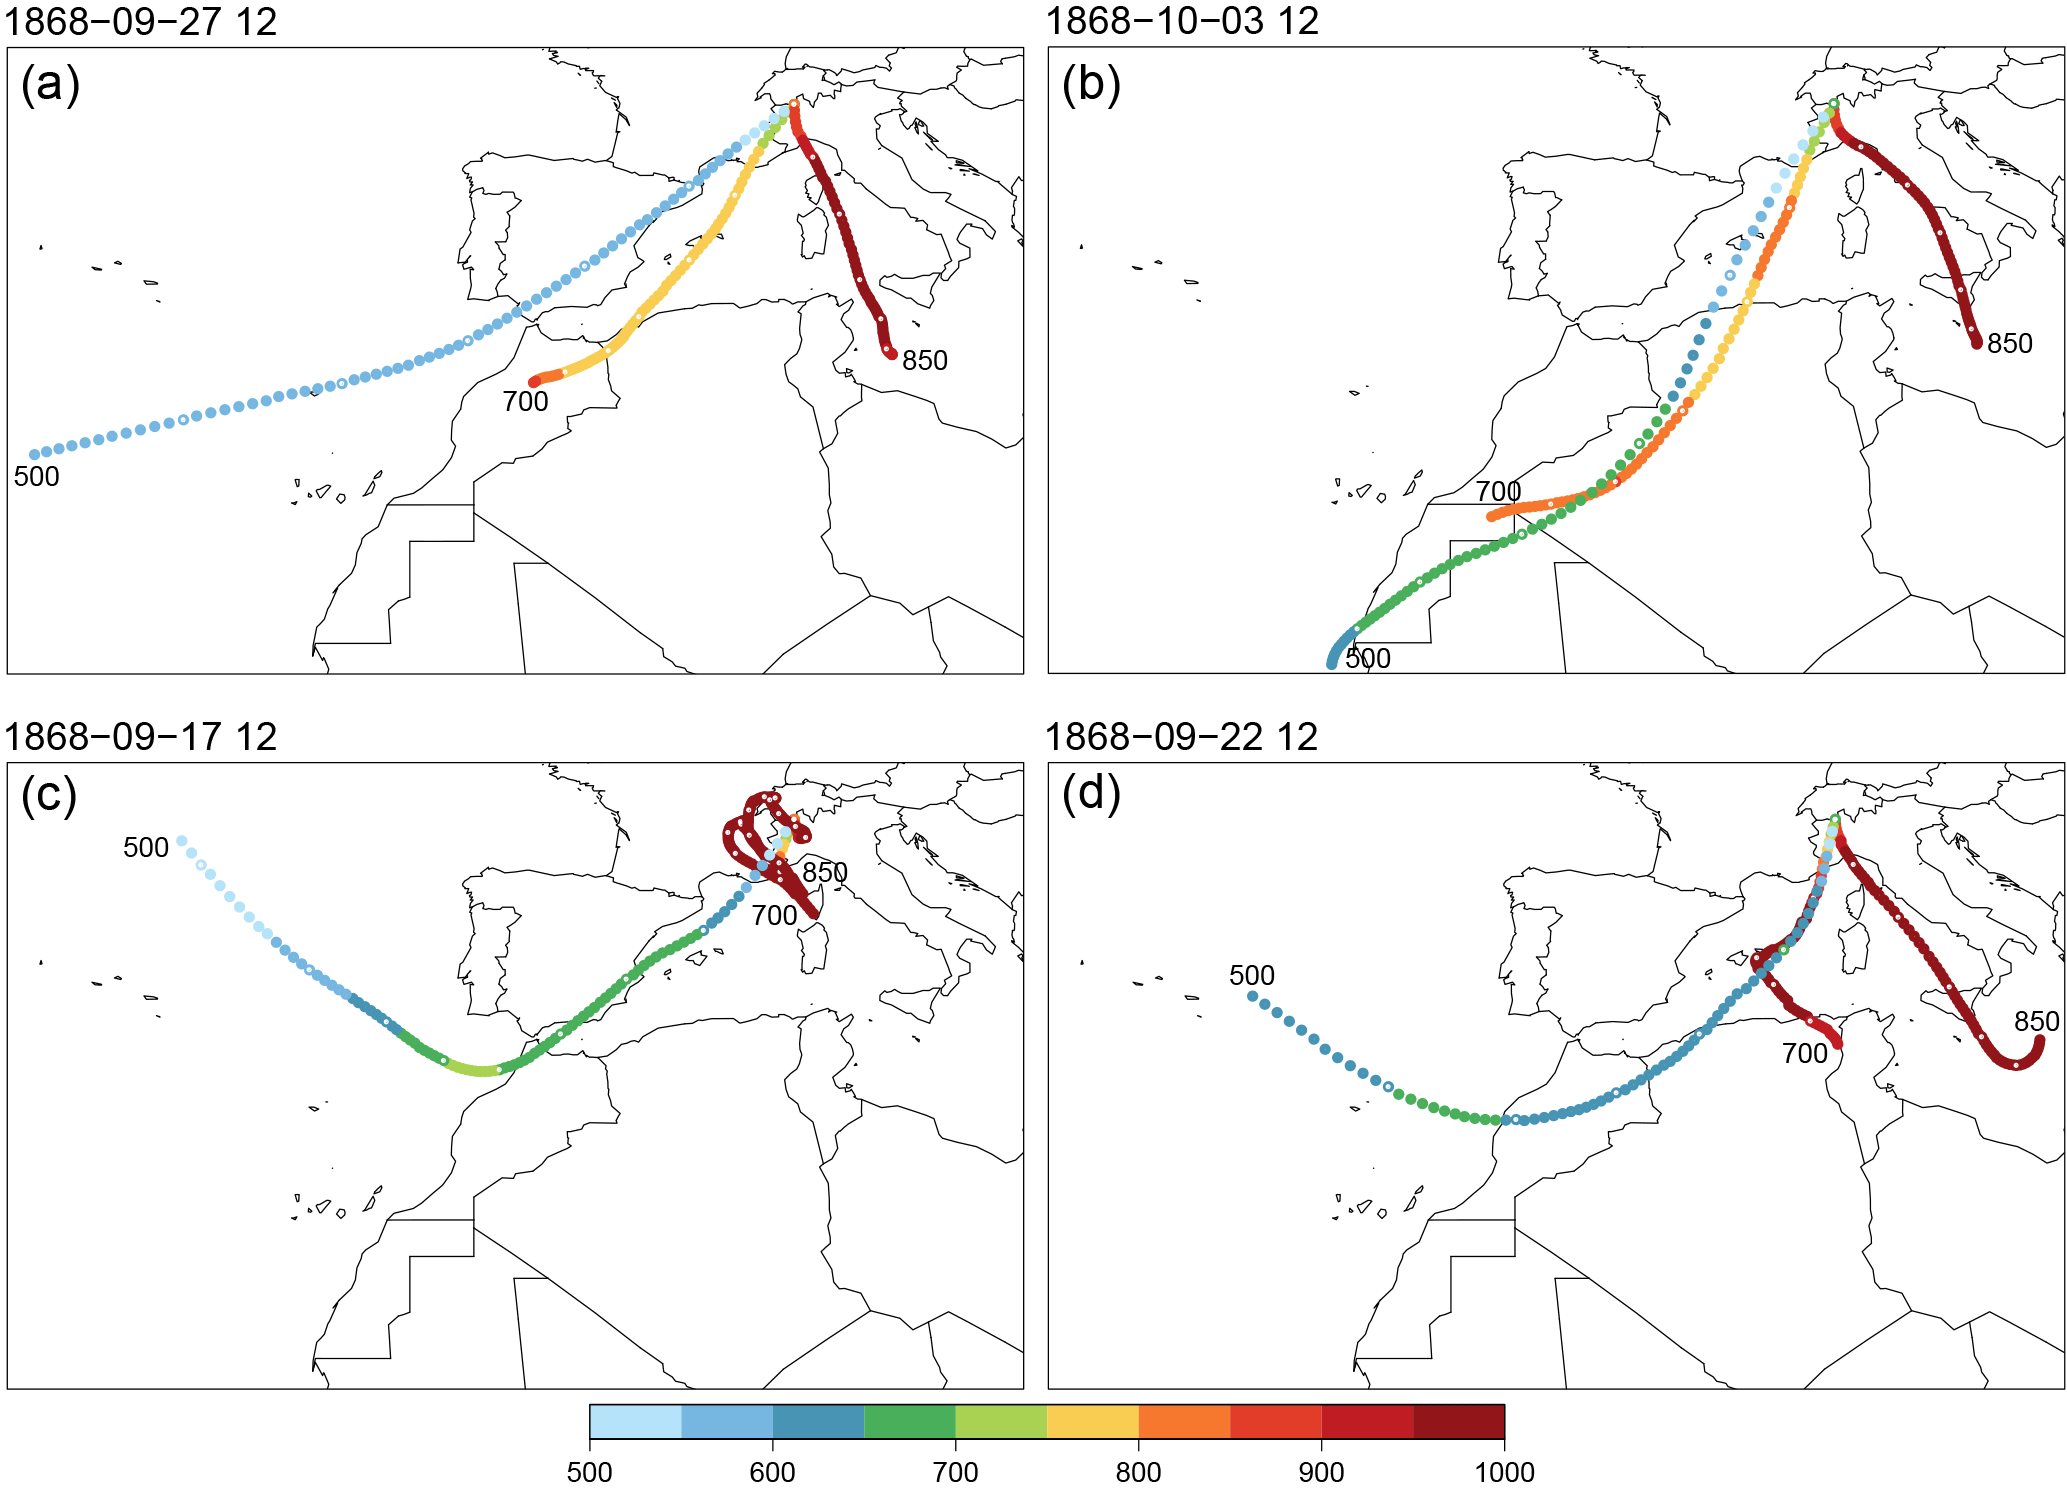
Figure 8Backward trajectories of 3 days (5 days for panel c) ending at 850, 700 and 500 hPa levels over the grid point 8∘ N, 46∘ E in 20CR on (a) 27 September 1868 12:00 UTC, (b) 3 October 1868 12:00 UTC, (c) 17 September 1868 12:00 UTC and (d) 22 September 1868 12:00 UTC. Color segments indicate pressure levels in hPa along the trajectories. Time steps of 12 h are indicated by white dots. The 20CR data are provided by the NOAA-ESRL Physical Sciences Division, Boulder, Colorado via their web site at http://www.esrl.noaa.gov/psd/ (last access: 9 October 2018), and produced using the parcel trajectory software (traj3d) available from the University of Melbourne at http://www.cycstats.org/trajectories/trajhome.htm (last access: 9 October 2018).
In summary, the synoptic-scale analyses reproduce the well-known features of a strong, elongated and meridional PV-streamer just west of the Alps. Strikingly, the large-scale atmospheric conditions during the antecedent episodes 09-17 and 09-22 evolved in parallel to the episodes 09-27 and 10-03 (Figs. 6 and 7) with only small differences: on 17 September 1868, the moisture flux was slightly more southerly compared to 28 September 1868, and the center of convergence was further to the west. On 22 September 1868, the PVU contours and the 500 hPa isolines show potential cyclonical wave breaking just west of the Alps, while breaking is more uncertain for 3 October 1868.
Backward trajectories from a 20CR grid point over the Alpine divide just west of the LMR (at 8∘ N, 46∘ E) further illustrate the almost parallel development of the four episodes. Furthermore, the trajectories are similar to the ones calculated by Bertò et al. (2004) for a comparable case over northeastern Italy in November 2002. They indicate that air parcels ending on the respective key days of all four episodes (Fig. 8) took very similar paths over time scales of a few days before arrival. In all four episodes, air parcels arriving at 850 hPa (700 and 500 hPa) had propagated northwestward and northeastward from the central and western Mediterranean Sea, respectively, and only episode 09-17 is less consistent due to slow propagation at lower levels. Over all levels, advection seems more tilted towards sector southwest and southeast for the episodes 09-17 and 09-27, and the episodes 09-22 and 10-03, respectively.
In conclusion, the repeated occurrence of flood-inducing atmospheric patterns over almost three weeks set the synoptic-scale atmospheric conditions for the record water level of Lago Maggiore and a devastating flood event. The upper-level dynamics over the North Atlantic during late September and early October 1868 as portrayed in 20CR are compatible with the formation of heavy precipitation episodes on the SA. They are in very good agreement with similar, more recent cases such as the severe flood on Lago Maggiore in September and October 2000 (e.g., Froidevaux and Martius, 2016). During this recent event, several episodes of heavy precipitation occurred in close succession (Barton et al., 2016). The final episode lasted for several days with a downstream blocking anticyclone over central and eastern Europe, preventing an eastward progression of the breaking wave and PV-streamer (Lenggenhager et al., 2018).
Even so, several recurving tropical cyclones in the Atlantic were crucial for the meridional amplification of the mid-latitude flow during the 2000 case, and hence the formation of PV-streamers over western Europe. However, no such cyclone is visible in 20CR for the 1868 case. A cyclone may not have existed, or this absence points to potential flaws in 20CR over the western (sub-) tropical Atlantic for this period, at least in the ensemble mean (cf. Brönnimann et al., 2013; DiNapoli and Misra, 2012). In addition, some of the troughs over the Atlantic tend to have decreasing phases in 20CR between the precipitation episodes (not shown), whereas one would expect a continuous intensification and then breaking.
3.4 Mesoscale atmospheric conditions
Given the coarsely resolved 20CR dataset, the analyses above also cannot explain local phenomena like the observed patches of precipitation in the LMR and across the Alpine divide. For this, we use the regional weather model WRF. A large number of setups are available. For instance, simulated precipitation patterns may differ according to the choice of microphysics schemes (e.g., Pieri et al., 2015, and references therein). For our study with restricted resources, most parameters are as they are in an operational setup for weather forecasting, with the exception of large-scale nudging to keep the model in basic agreement with the reanalysis (see Sect. 2.2). Hence, the simulation output must be regarded as a well-reasoned proposal of how the weather evolved on a local scale during the 1868 event. Verification and validation of the simulation results is made in two ways: by comparisons of the simulation output to observations and eyewitness reports where available, and by comparisons of the simulated weather patterns and dynamics to analyses of comparable modern events.
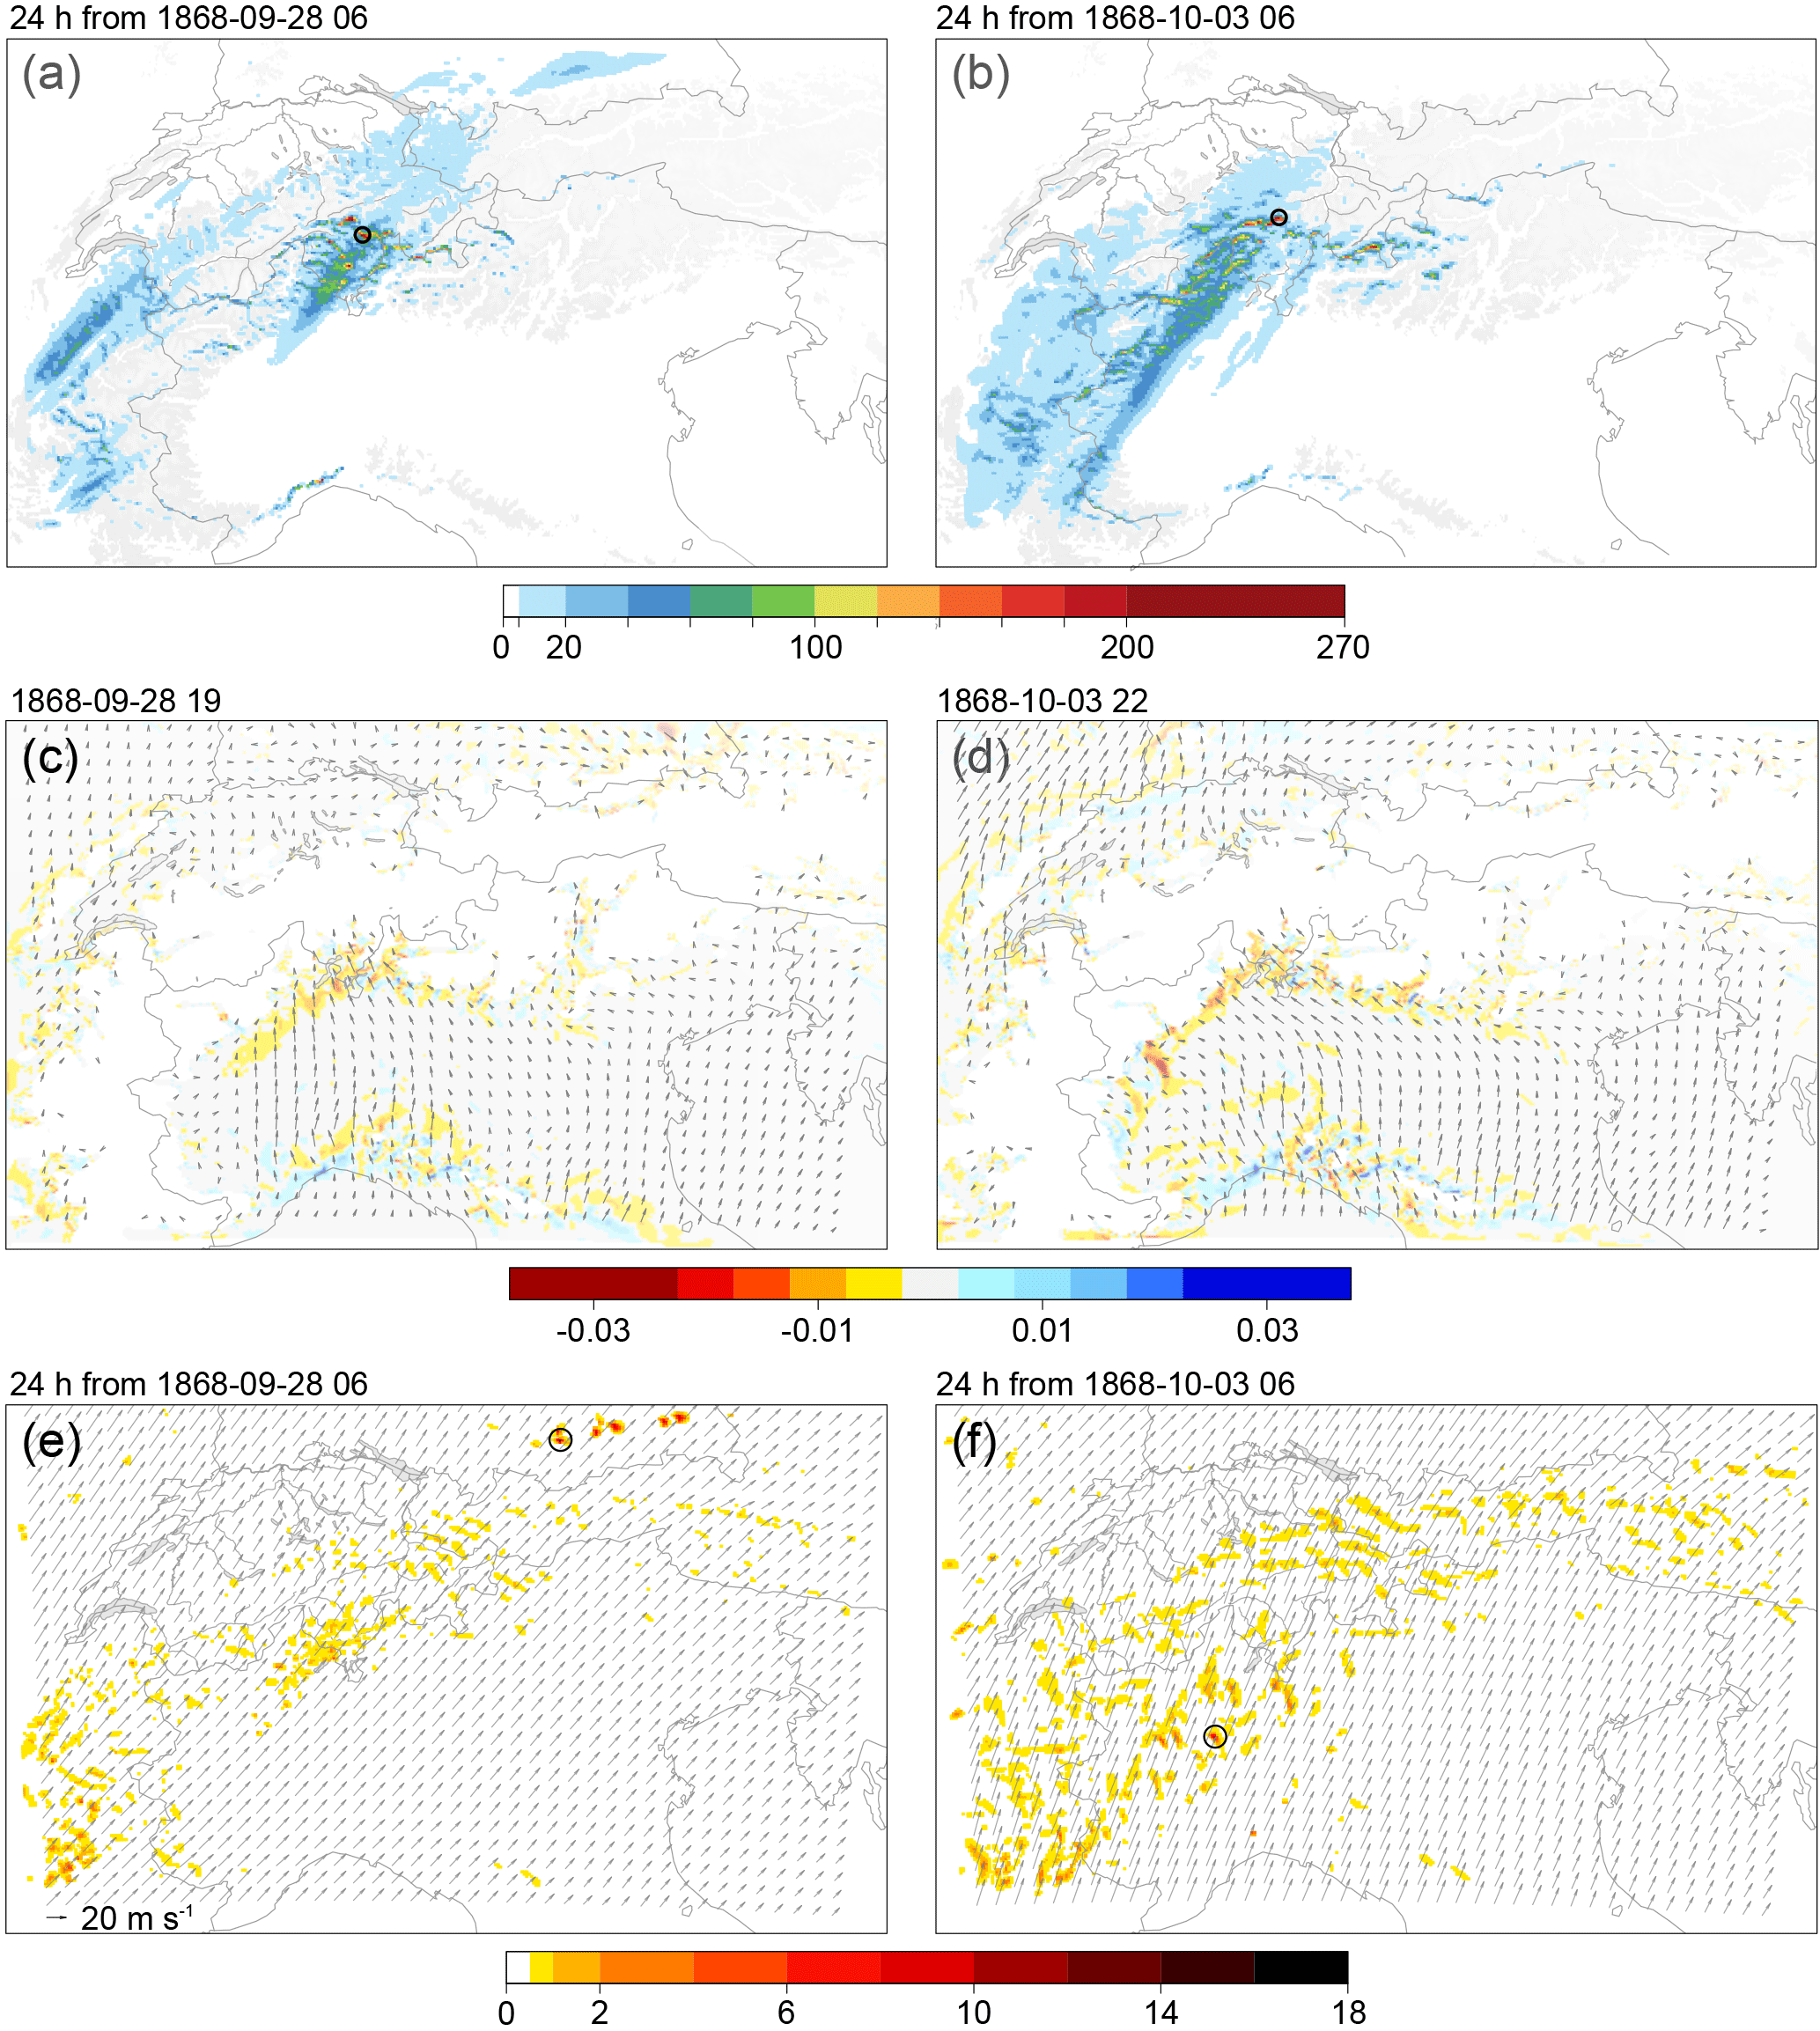
Figure 9Weather variables for 28 September 1868 (a, c, e) and 3 October 1868 (b, d, f) as simulated in the innermost WRF model domain. (a, b) Cumulated precipitation (mm 24 h−1; shade) starting at 06:00 UTC. Orography is shown above 1000 m a.s.l. (c, d) Moisture flux divergence (g kg−1 s−1; shade; negative values indicate flow convergence) and transport (m s−1 kg kg−1; vectors) at 900 hPa at two specific time steps. (e, f) Mean vertical wind (uplift w; m s−1) and mean horizontal wind speed at 600 hPa over 24 h starting at 06:00 UTC. Circles mark the grid cells with the highest values.
In the following, we look at a number of simulated atmospheric variables on local to regional scales, i.e., from the innermost WRF domain (see Sect. 2.2). A first comparison of simulated and observed precipitation rates (Fig. 4) at six rain gauge stations shows generally lower absolute rates in the simulation. Nevertheless, the observed temporal evolution is well reflected, as is the topographic repartition of extreme amounts at the high-elevation mountain passes and lower values in the lowlands.
To expand the spatial perspective, we compare maps of simulated precipitation sums for 28 September and 3 October 1868 (Fig. 9a and b) with the observed precipitation sums at measurement stations for the same days (Fig. 5b and c). For both days, the simulated and observed precipitation correspond well and the simulation correctly places distinct maximum intensities on mountain ridges and tops in or close to the LMR, i.e., in the vicinity of the observed maxima. The main area of precipitation is simulated as a southwest–northeast-oriented narrow triangle that starts just southwest of the LMR. In the simulation, this triangle is more elongated on 3 October than on 28 September 1868 and reaches further across the Alpine divide towards the western, northern and eastern parts of Switzerland.
While the simulation works very well in the core area of precipitation on the SA, it performs less well in other areas. For instance, the very high amounts of precipitation observed in central Graubünden are not fully simulated for 28 September 1868. For 3 October, some of the secondary regions of intense precipitation are well simulated (e.g., the scattered precipitation over northwestern Switzerland, over central Switzerland and over Graubünden), but mostly underestimated. This indicates that in reality, intense precipitation has arguably reached further into northern Switzerland.
Overall, the simulated precipitation not only corresponds with observations, but also with the damage reported in the documented areas of the SA (Fig. 2). Although there are no observations in the southwestern part of the precipitation triangles, we infer from this satisfactory correspondence that the high amounts of damage documented in this region were directly linked to high precipitation rates. In addition, the WRF model is able to reproduce the observed intensities on the SA, just not at the exact grid point or with the exact timing. Despite some underestimation of precipitation on the other side of the Alpine divide, we infer that the ingredients and processes necessary to form the episodes of heavy precipitation are represented in the WRF model, at least for the SA. In turn, this inspires confidence for a more detailed formulation of the flow modulation in this region.
While the reanalysis data show large-scale, strong moisture flux convergence over and across the Alps (Figs. 6 and 7), the downscaled data show small-scale patterns of both convergence and divergence near the surface. As an example, Fig. 9c and d show two instances of moisture flux over the Po plain (south of the masked Alpine orography) towards the concave topography on the SA. In the LMR, moisture is primarily advected from easterly to southeasterly directions. During both episodes, there is strong low-level moisture convergence along the foothills west, north and east of Lago Maggiore, with a slightly enhanced easterly and westerly component during the first and second episodes, respectively. Winds veer to more southerly and southwesterly directions in the mid-troposphere (600 hPa level; Fig. 9e and f). The mean flow on 28 September 1868 is clearly southwesterly over the Alps, while it has a more southerly component on 3 October 1868. In addition, patches of strong vertical uplift are simulated in the triangle-shaped area of heavy precipitation. Obviously, the WRF simulation is able to reflect the production of convective cells upstream of the strongest precipitation intensities.
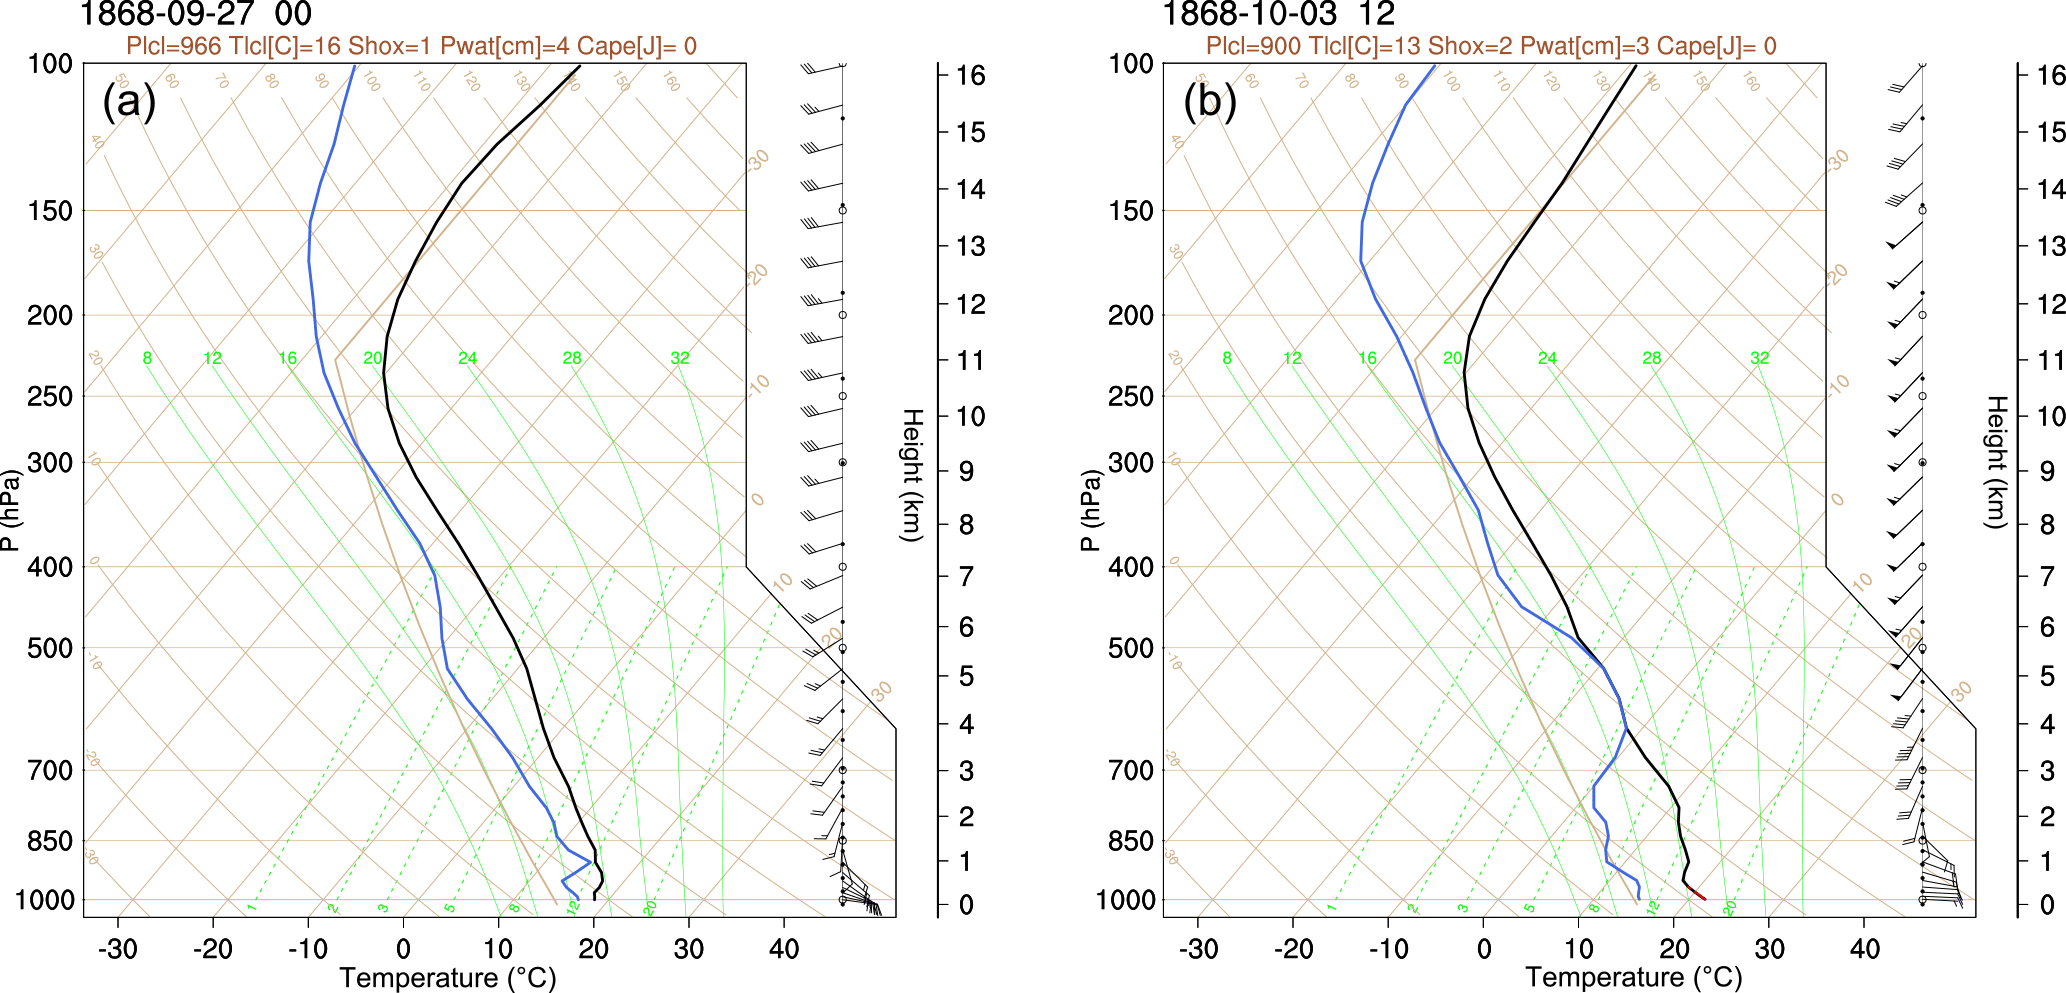
Figure 10Simulated sounding from WRF model output at Milano Linate Airport (LIML; see Fig. 11b for location) for (a) 27 September 1868 12:00 UTC and (b) 3 October 1868 12:00 UTC.
All these dynamics are consistent with the observed precipitation patterns in Switzerland (Fig. 5), as well as with recent high-precipitation events, where the precipitation patterns were found to be related to moisture flux that reaches western Ticino and eastern Graubünden from sector SW and the Gotthard region from sector S (Froidevaux and Martius, 2016). Furthermore, they are consistent with the orientation of the upper-level trough (Fig. 7; see also Stucki et al., 2012): Heavy precipitation concentrated in the western and eastern LMR is prevalent with PV-streamers that adopt a southeast–northwest and southwest–northeast tilt, respectively (Martius et al., 2006).
To further investigate the vertical structure of the simulated troposphere, two WRF model soundings are taken at the present location of Milano Linate Airport (LIML; Fig. 10), the first for 27 September 1868 12:00 UTC and the second for 3 October 1868 12:00 UTC. The soundings show similarities with real soundings taken at the same location during flood-producing weather situations in the LMR, e.g., during the 24 September 1993 and 14 October 2000 floods (not shown here; see Panziera et al., 2015; and http://weather.uwyo.edu/upperair/sounding.html, last access: 9 October 2018; see also Malguzzi et al., 2006, for a comparable event over northeastern Italy in 1966). Both soundings reproduce the veering of the wind with height, that is, from easterly directions within the planetary boundary layer to southwesterly in the mid-troposphere. In addition, two observations at Milan and Mantua confirm low-level easterly winds over the Po plain (Maugeri et al., 1998).
In summary, the wind velocities, low-level convergence, mid-level uplift and northeastward transport shown in Fig. 9 and the two model soundings are in line with real soundings during recent events and the low-level jet concept by Panziera et al. (2015; their Fig. 21). The higher wind velocities of the 03-10 sounding compared to those of the 09-27 sounding, especially at high altitudes, are a plausible cause for the wider spatial extension of the heavy rainfall reaching into the inner Alpine regions (Fig. 9; see also Fig. 5). Further similarities to Panziera et al. (2015) include the relatively large spread between surface temperature (around 23 ∘C) and dew point temperature (approx. 17–18 ∘C), the lifting condensation level at approximately 900 hPa and fully saturated, conditionally unstable to neutral, air layers between 3.5 and 5.5 km above sea level. A significant low-level spread (between ambient and dew point temperature) is typical for a Po valley sounding, even during heavy precipitation events on the SA. Nevertheless, the spread seems to be too large on 27 September 1868 in the model sounding compared to the real soundings during the 1993 and 2000 cases. Convective available potential energy (CAPE) is rather low (approx. 200–300 J; maximum approx. 800 J during the episodes 09-27 and 10-03) most of the time. In nearly moist-neutral conditions, deep convection can develop in a low-CAPE environment, especially if forced orographic lifting helps to initiate updrafts (cf. Panziera et al., 2015; especially their Fig. 15). Rotunno and Houze (2007; and references therein) noted cases where forced uplift in a strong cross-barrier flow controls much of the condensation, but where intermittent convective cells also occur despite rather low values of CAPE,
Instead of such a scenario of persistent precipitation, with intermittent occurrences of thunderstorms, is compatible with the heterogeneous precipitation patterns in both simulations and observations. It is also in good agreement with eyewitness reports by Coaz (1869) and observer remarks in Wolf (1868). For the episode 09-27, both authors reported a core area of very intense and persistent thunderstorms along the Alpine divide near San Bernardino, accompanied by hail, while thunderstorms were arguably less severe in other places, e.g., towards the western parts of Graubünden / central Switzerland. For the episode 10-03, very high thunderstorm activity was again reported, even combined with hail in some places, and they inferred a larger thunderstorm-affected area than in the previous episode.
In summary, the mesoscale simulations are able to reproduce the main characteristics described by Panziera et al. (2015) regarding the structure and dynamics of elongated precipitation bands that are triggered in or southwest of the LMR and stretch well across the Alpine rim, and that can be maintained from many hours to a couple of days. More generally, the mesoscale flow patterns agree well with findings from the Mesoscale Alpine Programme (relative to the convective IOP2b case, see Rotunno and Houze, 2007; or relative to the low-level flow, see Rotunno and Ferretti, 2001), where southeasterly low-level winds in the Po Valley, together with synoptic-scale southerlies at higher levels, lead to enhanced confluence in the LMR and thus increase precipitation intensity in this region.
Besides precipitation intensity, the associated freezing level is a decisive factor for runoff formation. For instance, the Bundesamt für Wasser und Geologie (2002) and Grebner (1993, 2000) found a freezing level above 3500 m a.s.l. for the 1993 flood, and a freezing level that was persistently above 3000 m a.s.l. during the 2000 flood. Malguzzi et al. (2006) report 3700 m a.s.l. during the 1966 extreme flood in northeastern Italy. In our simulation, the freezing level in the atmospheric column over LIML reaches approximately 3800 m a.s.l. on 27 September 1868 12:00 UTC and 3 October 1868 12:00 UTC, and reaches up to >4000 m a.s.l. over the Alpine divide during these two episodes (Figs. 10 and 11).
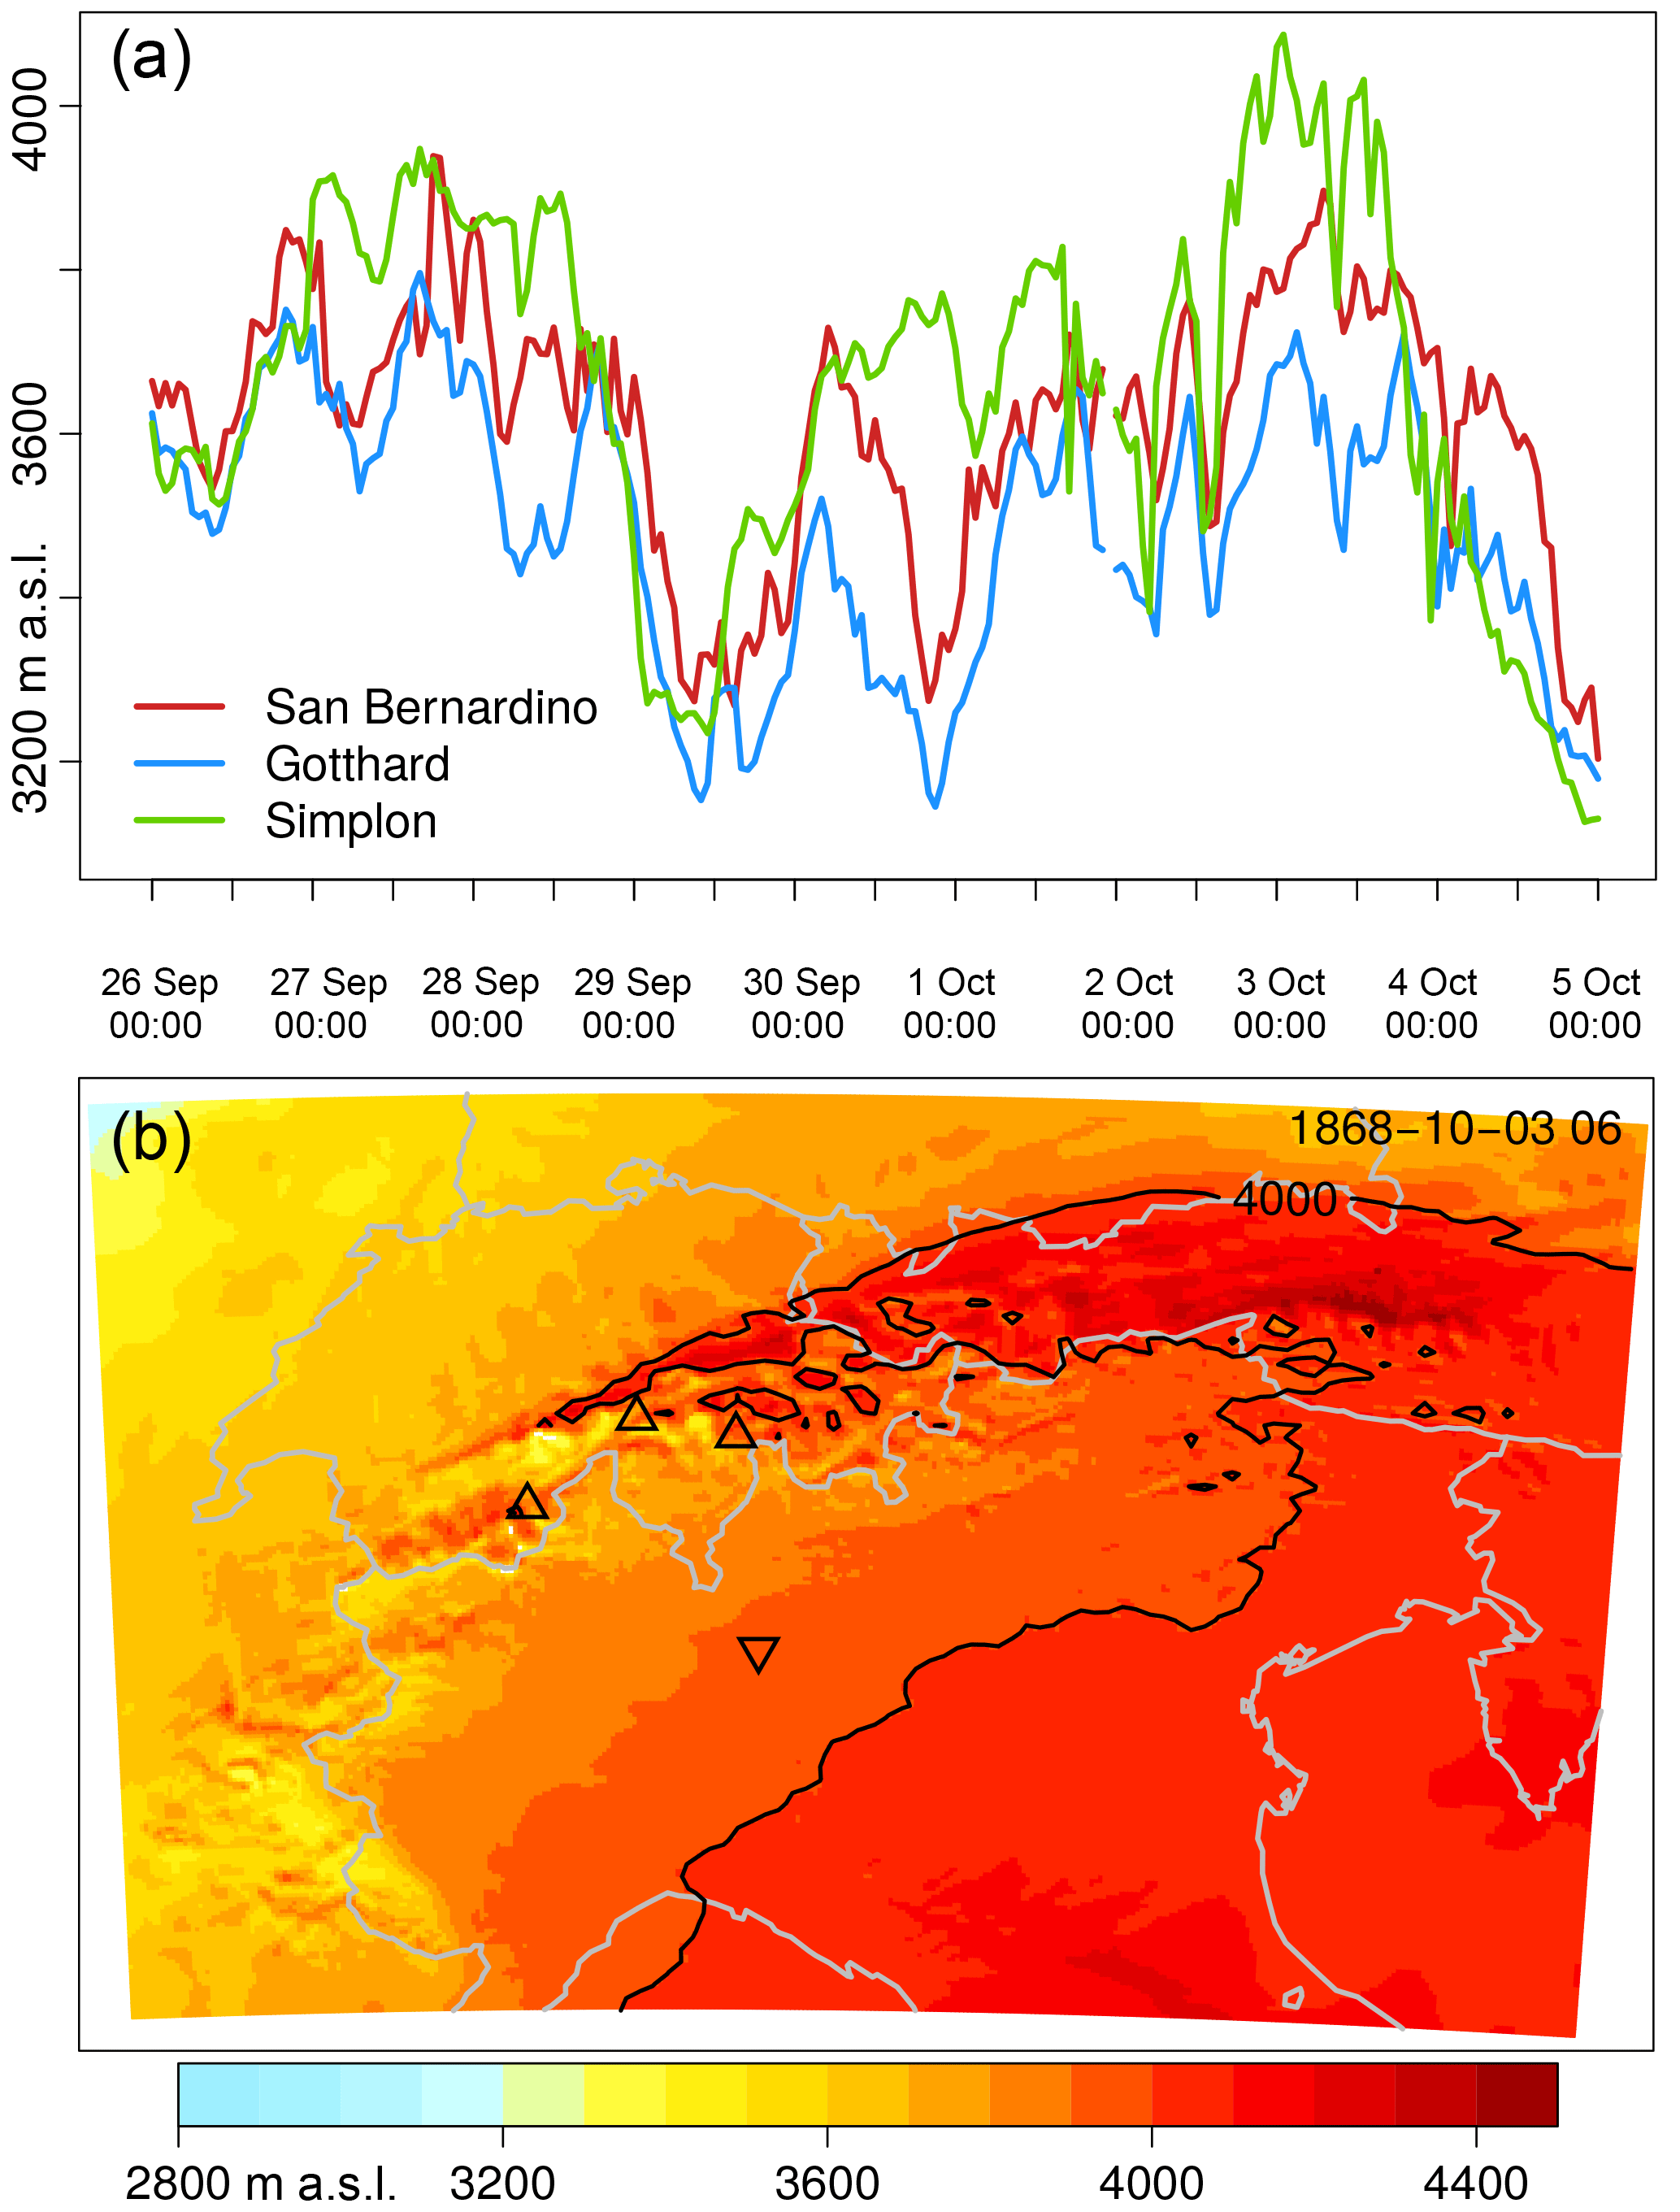
Figure 11(a) Freezing level at San Bernardino, Gotthard and Simplon passes between 26 September 1868, 00:00 UTC and 5 October 1868, 00:00 UTC (x axis; day of the month and hours UTC are given), as calculated for the closest grid point in the WRF simulation. (b) Height of the freezing level (shade and contour at 4000 m a.s.l.) for 3 October 1868 06:00 UTC. Small white spots indicate orography reaching above the freezing level height. Triangles pointing upwards indicate the locations of the San Bernardino, Gotthard and Simplon passes from east to west; the triangle pointing downwards indicates the location of the Milano Linate Airport.
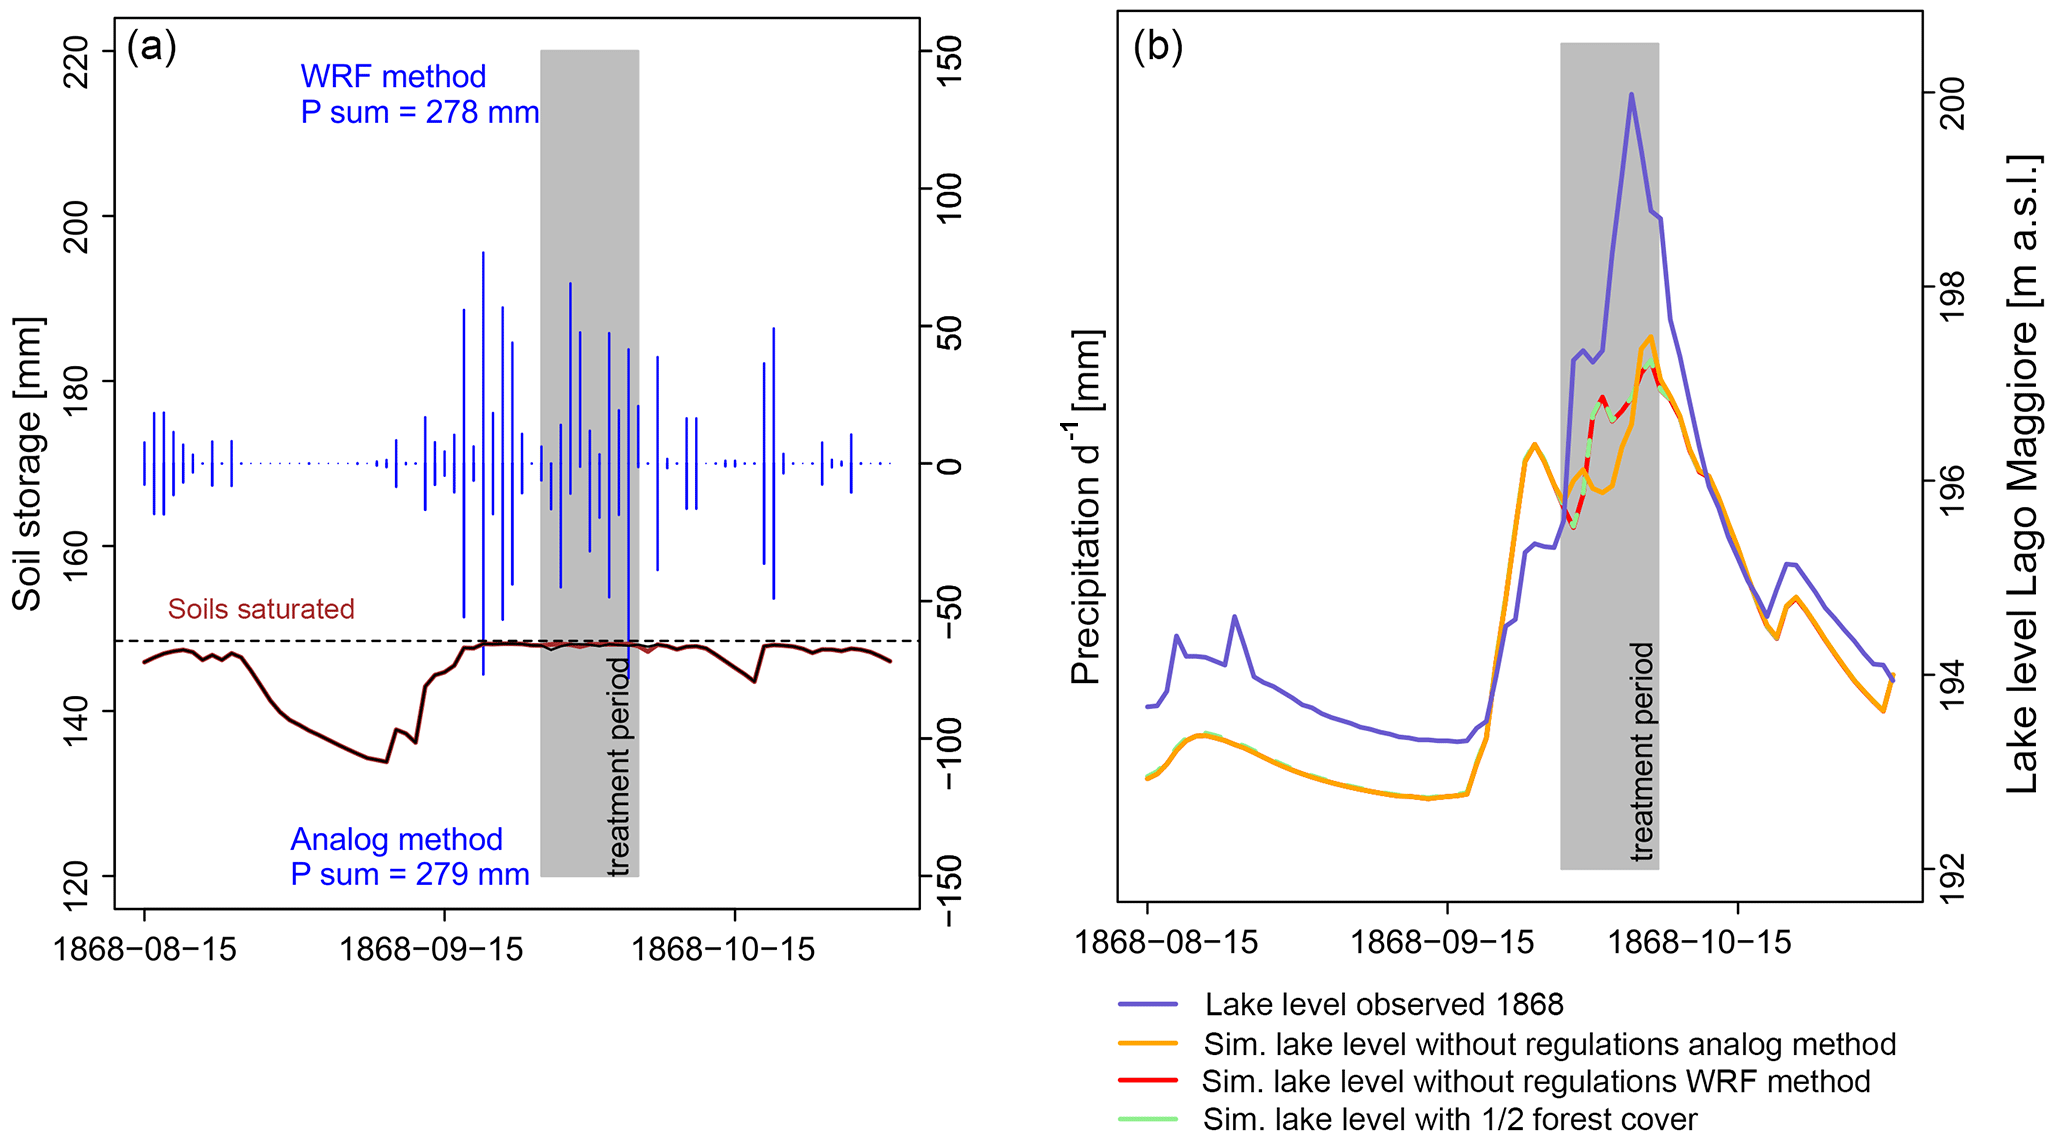
Figure 12Hydrological simulation of the 1868 flood event in the LMR. Panel (a) displays the precipitation input to the system (area averages in mm) for the WRF downscaling simulation (positive values) and the analog resampling method (negative values), as well as mean areal soil storage. Panel (b) shows the observed (blue lines) and simulated (colored lines) lake levels from August to October 1868. WRF scenarios are only simulated for the treatment period shaded in grey. The deforestation scenario was computed for a full hydrological year from 1 October 1867 to 31 October 1868.
In the WRF model, substantial growth of the snow layer is only simulated for the Monte Rosa range in the westernmost tip of the Lago Maggiore catchment (daily accumulated snow between 12 cm on 27 September 1868 and 85 cm on 4 October 1868; not shown). This means that almost all precipitation in the LMR fell as liquid water, with hardly any snow storage that would delay runoff. It is only between these episodes that the freezing level drops towards 3200 m a.s.l. in the simulation. This is also in good agreement with Coaz (1869): reportedly, the daily maximum temperature at San Bernardino Pass (2100 m a.s.l.; on the Alpine divide) was 8.2 ∘C on 27 September 1868. On the same day, the temperature was 13.5 ∘C at Splügen (1500 m a.s.l.; cf. 16 ∘C in Petrascheck, 1989). It was still 4 ∘C on 28 September 1868 on San Bernardino pass, and snow was only reported near the mountain tops, (i.e., >3000 m a.s.l.) on 29 September. On 3 October 1868, the temperature was 14 ∘C on San Bernardino Pass, and 18 ∘C at Splügen (Petrascheck, 1989). Assuming (nearly) saturated air layers and moist-adiabatic lapse rates in the region, these temperature observations point to freezing levels near or even above 4000 m a.s.l. (cf. Stucki et al., 2012). It is only on 4 October 1868 that snow was reported for the high-elevation stations (e.g., 5 cm at Grand St. Bernard).
3.5 Hydrological response: simulated runoff and lake levels
The hydrological simulations for the period between October 1867 and November 1868 are driven by the meteorological fields derived from an analog resampling method as a base scenario (Fig. 12). Two further scenarios are nested in this simulation: one comprising the higher level of detail from the WRF downscaling simulation over the full available period of 10 days (26 September to 5 October 1868), and one that reflects the deforestation present in 1868, with 50 % less forest cover compared to today.
Regarding our region of interest, three sources of uncertainty in hydrological modeling were quantified by Zappa et al. (2011) for flood forecasting in the Verzasca basin, a contributory river to Lago Maggiore. They found that the spread of the forecast attributed to the hydrological model parameters is four times smaller than the contribution of uncertain rainfall fields by the weather radar; numerical weather forecast has by far the largest contribution to the forecast spread. In addition, they found a very small contribution of flood-peak simulations to the overall uncertainty. This low sensitivity to initial conditions is owed to the fact that soils are rather shallow in this area, thus rapidly saturated and prone to runoff generation. We infer that for the 1868 extreme event with intense runoff generation, the flood peak is not very sensitive to uncertainties of the model parameters. Furthermore, one should consider that the key factor for the Lago Maggiore flood was the flood volume rather than the peak, the volume is far less parameter dependent. One source of uncertainty affecting the flood volume might be the separation between snow and rain. This separation was not relevant in 1868 as the snow line was located well above 3000 m a.s.l. (Fig. 11). We conclude that for this Lago Maggiore flood, the uncertainty from the rainfall input is by far larger (orders of magnitude) than from model parameters.
The simulations show that the flood event followed a rather dry to normal late-summer period, and a first very wet spell during September. During this wet period, soil storage capacity was reached and the Lago Maggiore lake level rose significantly. For the second wet period (comprising the episodes 09-27 and 10-03), WRF simulations are added to the analog-driven simulations. Differences appear between the analog- and the WRF-derived precipitation: WRF shows a decreasing intensity for the four major rainfall events, while the analog method shows increasing intensities (Fig. 12, left panel). Total precipitation sums are approximately equal for both approaches. The simulated lake level responds accordingly (Fig. 12, right panel), i.e., with a significant increase in the lake level during the early treatment period in the WRF simulation, and a smaller increase later (and vice versa for the analog method).
Although our hydrometeorological model chain tends to overestimate the lake levels (see Sect. 2), we are not able to reproduce the observed lake level peak. Possible reasons are manifold. Firstly, the reconstructed precipitation input could have been strongly underestimated. However, given the very steep rise in the observed lake level, this precipitation amount would have been enormous. Secondly, a damming of the lake due to a logjam could also have occurred. We evaluated an idealized model experiment of such a logjam by reducing the outflow amount to one third of the theoretical relationship for the time of the steepest increase. At the time of the highest peak, such a logjam at the Sesto Calende bridge would have needed to be resolved in 1 day to match the steep decline observed in the lake level records. However, to our knowledge, such a logjam is unreported in the historical documents. Thirdly and most likely, the reason for the strong underestimation is due to changes in the lake level–outflow relationship. Ambrosetti (1994) reviewed long-term lake level changes in the 19th and 20th centuries and stated that the high lake levels recorded before 1868 are unlikely to be achieved again, as a ridge on the lake outlet was heavily eroded during the 1868 flood event (minus 30 cm). As we do not have any hint of the shape of this ridge and the cross section at the lake outflow, we cannot prove this theory. However, we assume that changes in the lake level–outflow relationship is the most likely reason, among the ones discussed.
Furthermore, we estimate the effect of deforestation on the flood event in 1868. Our simulations show only very small differences, indicating that even a higher percentage of forest cover (conditions similar to today) would not have dampened the impacts of such an extreme event. This is mainly due to the limited and rapidly filled storage capacity of the vegetation, and especially of the mostly very shallow soils (Fig. 12, left panel). This is confirmed by literature values regarding forest canopy and forest floor interception capacity, which are about 3 mm at maximum for beech (fagus sylvatica; Gerrits et al., 2010) and 4.7 mm at maximum for spruce (picea abies; Breuer et al., 2003). In relation to a total precipitation input of 280 mm, the limited significance of forest cover during such extreme events is clear. In addition, we assume the effect of debris flows to be negligible in our case. Clearly, deforestation increases the disposition for debris flows in steep terrain. They could block river discharge, with severe ramifications due to the impounding of water and an often sudden release of blocked water (Badoux et al., 2014). However, these processes happen on an hourly time scale (Borga et al., 2014), while the rise of the Lago Maggiore lake level took several days.
In this study, we have combined traditional reconstructions and numerical simulations to assess an extreme flood that occurred in the Lago Maggiore catchment and surrounding areas on the south side of the central Alps during the end of September and early October 1868. We have taken an interdisciplinary approach to describe damage and impacts, the flood-inducing precipitation, the driving atmospheric conditions and potential reasons for the extreme flood levels.
The analyses show that the systematic use of contemporary sources, such as documentaries, weather annals and eyewitness and administrative reports, results in a very detailed picture of the impact and damage on regional and even municipality levels. Damage was concentrated around Lago Maggiore and south of the Alpine divide, but also reached across the Alpine divide into Graubünden, Valais and central Switzerland.
The synoptic (large-scale) atmospheric conditions have been analyzed using 20CR, a global reanalysis dataset. The ensemble mean is chosen as a minimum-error estimate for further analyses based on low spread of the ensemble over the region of interest and a small smoothing effect in the pressure fields. The synoptic situation is comparable to modern cases. However, we additionally find a repeated occurrence of similar patterns over four distinct episodes from 17 September to 4 October 1868. Typical precursors and companions of heavy precipitation are found with PV-streamers, atmospheric wave breaking, and persistent, very high (IVT >300 kg m−1 s−1) southerly moisture fluxes towards the Alps.
Simulated weather variables at mesoscales (i.e., local scales) are obtained from dynamical downscaling 20CR input to a 2 km grid using the limited-area weather model WRF. Given the uncertainties stemming from the model setup and the coarse initial and boundary conditions, we regard the simulation output as a well-reasoned proposal of how the weather evolved during the 1868 event. However, we conclude from a range of comparisons to observations and modern analog cases that the downscaling experiment delivers very plausible results. Concretely, the simulated precipitation rates, patterns and atmospheric dynamics are compatible with the observed precipitation and damage. They also agree well with existing concepts of forced moisture convergence in the concave orography around Lago Maggiore, and subsequent uplift, convection and repeated northeastward propagation of convective cells. Hence, the WRF model is able to reproduce small-scale phenomena of an event that occurred in 1868, and to achieve a realistic cloud-resolving simulation with downscaling from 20CR.
In addition, we simulate freezing levels that are mostly close to 4000 m a.s.l., meaning that virtually none of the heavy precipitation was stored as snow and delayed runoff. The subsequent hydrological modeling captures the gradual increase in the Lago Maggiore water level. The simulated and observed peak levels differ by approximately 2 m. Reasons for this gap may be found in unknown riverbed profiles at the lake outflow. Reduced forest cover in the Lago Maggiore catchment at that time did not have an influence on the extreme response of Lago Maggiore; experiments with different percentages of forest cover have not resulted in different responses in the lake level.
This is in contrast to leading forestry policies at that time, which presumed a forest storage effect. Based on studies of French engineers from the late 18th century, the idea of a general correlation between forest cover and floods was established in Switzerland in the mid-19th century and strongly supported by the Swiss forestry association. The catastrophic flood in 1868 triggered the implementation of afforestation programs and the construction of hydraulic structures. Following the event, the federal government enacted forest and hydraulic engineering laws, and committed to financially supporting protection measures. As a result, many rivers were channeled, torrent controls established and alpine meadows afforested in the following decades. A differentiated consideration of the role of forest cover as a flood protection measure has only taken place since the late 20th century, and the paradigm has only recently shifted towards renaturalization of waterways.
In conclusion, we find – for this specific case – very good agreement between traditional reconstructions and numerical simulations on almost all levels, mind you for an event in the mid-19th century. To our knowledge, the provided local-scale weather maps are the earliest to date, but we hope that this is not the case for long. Indeed, these findings highlight the broad prospects for these combined analyses with respect to studies of weather events and their impacts back to the early 19th century, and maybe beyond. They also highlight the opportunities for cross-validations between scientific disciplines, be it meticulously examined documents for validating weather or runoff models, or numerical support for historical climatology studies.
Sources and availability of data are described in Sect. 2.
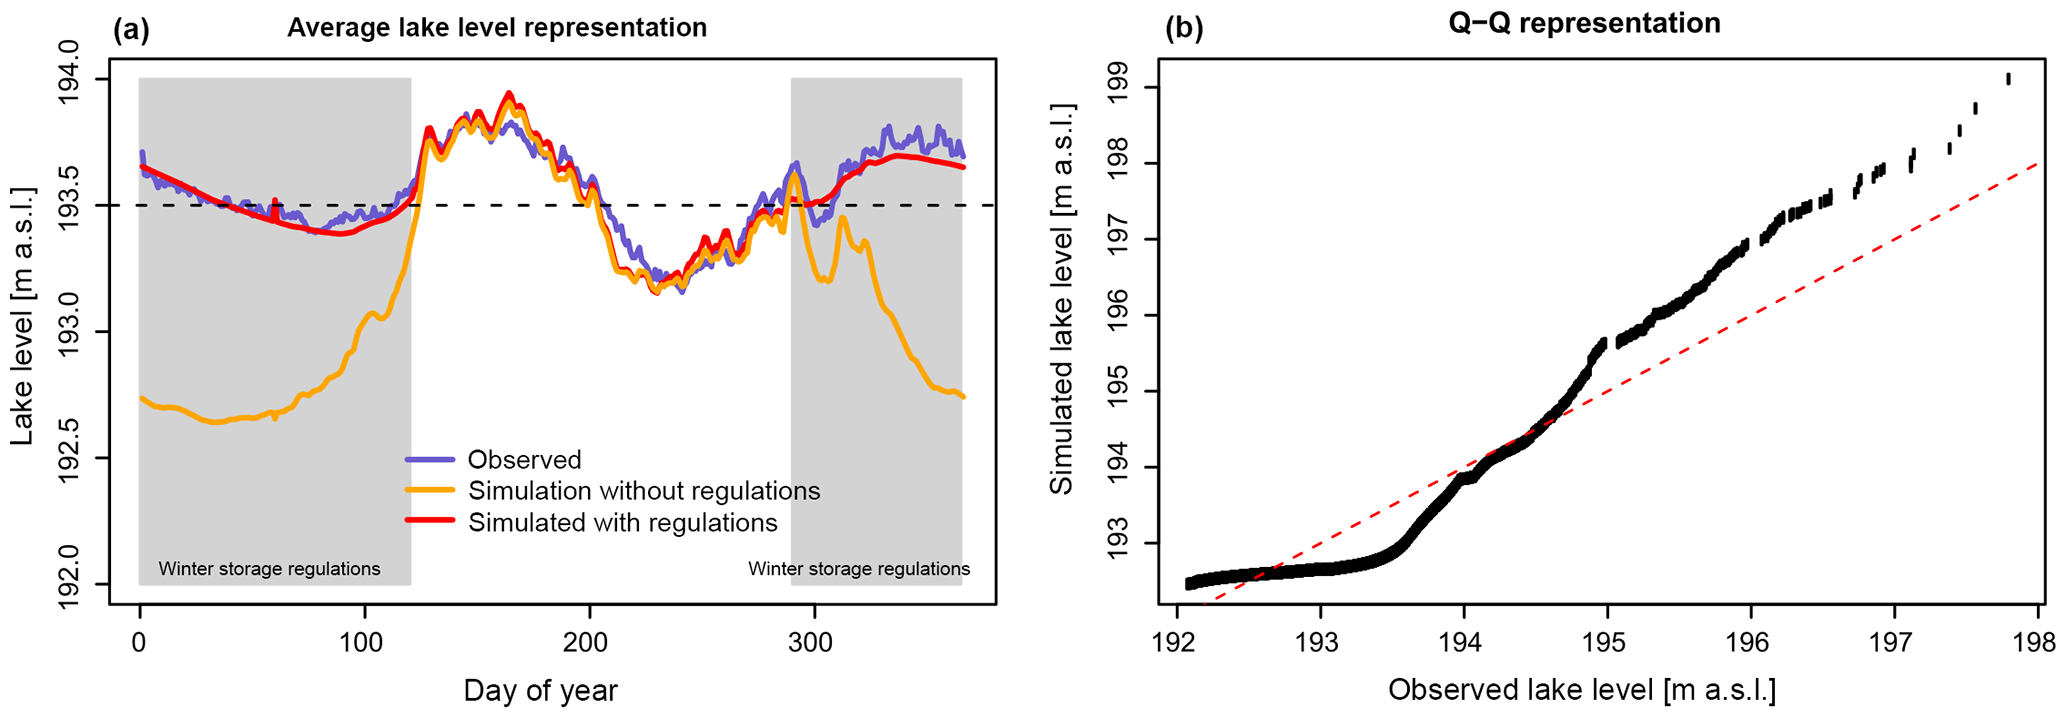
Figure A1Validation of the hydrological model performance by means of (a) long-term average (1960–2010) and (b) daily value-based Q–Q representation, indicating a fair model performance with the tendency to overestimate higher lake levels. In panel (a), we show the model representation assuming a simple winter storage regulation (red line).
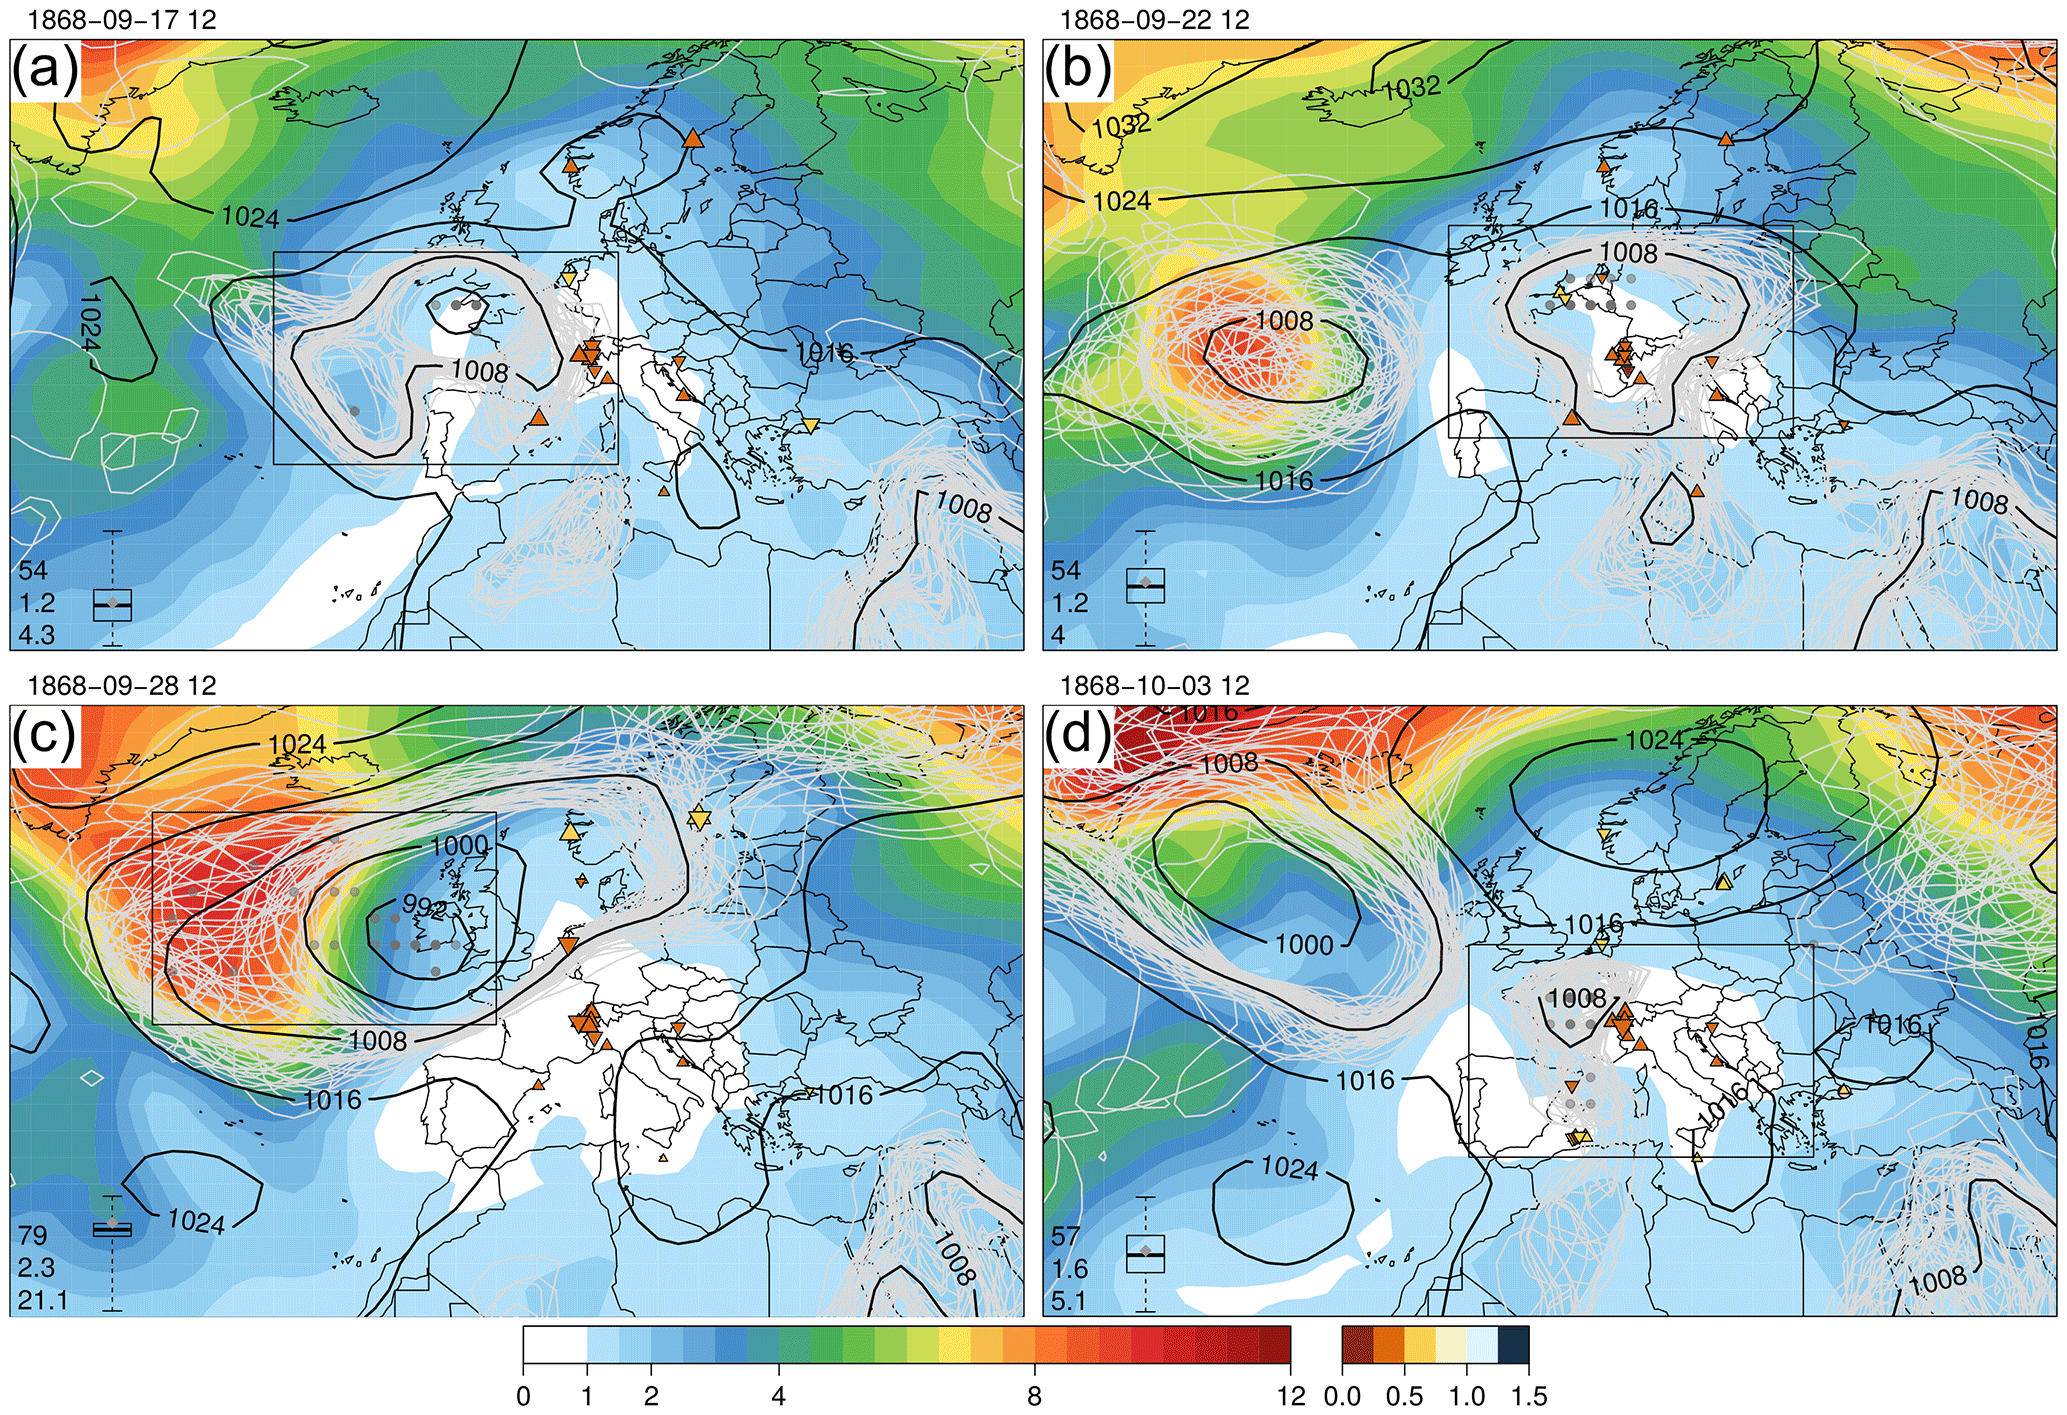
Figure A2Mean sea level pressure (hPa) calculated from 20CR for (a) 17 September 1868 12:00 UTC, (b) 22 September 1868 12:00 UTC, (c) 27 September 1868 12:00 UTC and (d) 3 October 1868 12:00 UTC. The background color shade indicates the standard deviation (“spread”) of the ensemble (hPa). Light grey contours indicate the 1008 hPa isobars for all 56 ensemble members. Bold black contours show the isobars in the 20CR ensemble mean. Grey dots mark the locations of pressure minima for all ensemble members within the inset box; the darker the dot, the more members have the minimum pressure at this grid point. The box plot in the lower left corner of each panel indicates the median, interquartile range and full range of the ensemble pressure minima; the grey diamond indicates the pressure minimum in the ensemble mean. From top to bottom, the values to the left of the box plot indicate the position of the ensemble mean with respect to the according percentile (%) of the ensemble members, the interquartile range and the full range of the ensemble members in hPa. Triangles mark the locations of the pressure observations that are available for assimilation into 20CR from 06:00 to 12:00 UTC at the specific date (ISPD; Cram et al., 2015). The adjustment effect (magnitude qualitatively shown by the size of the triangle) by the pressure measurements towards weakening and deepening of the surrounding pressure fields is shown with upward-pointing and downward-pointing triangles, respectively; the color shade represents the ratios of the ensemble spread in the analysis with respect to the first guess forecast (see also Compo et al., 2011).
The authors declare that they have no conflict of interest.
The work was supported by the Oeschger Centre for Climate Change Research
and by the Swiss National Science Foundation (project CHIMES). We would like
to thank Ralph Rickli, Christian Rohr and Martin Stuber for fruitful
discussions about weather dynamics and historical aspects. We also thank
Erin Gleeson for the careful language editing. Support for the Twentieth
Century Reanalysis Project version 2c dataset is provided by the U.S.
Department of Energy, Office of Science Biological and Environmental
Research (BER) program and by the National Oceanic and Atmospheric
Administration Climate Program Office. We acknowledge the editor and reviewers for their careful guidance and constructive comments.
Edited by: Joaquim G. Pinto
Reviewed by: Andrea Buzzi and one anonymous referee
Ambrosetti W., Barbanti, L., De Bernardi, R., Libera, V., and Rolla, A.: La piena del Lago Maggiore nell'autunno 1993: un evento di portata secolare, Verbania Pallanza, Consiglio nazionale delle ricerche CNR, Documenta dell'Istituto Italiano di Idrobiologia no. 45, 1994.
Andres, N., Lieberherr, G., Sideris, I. V., Jordan, F., and Zappa, M.: From calibration to real-time operations: an assessment of three precipitation benchmarks for a Swiss river system, Meteorol. Appl., 23, 448–461, https://doi.org/10.1002/met.1569, 2016.
Appenzeller, C. and Davies, H. C.: Structure of Stratospheric Intrusions Into the Troposphere, Nature, 358, 570–572, 1992.
Arpagaus, J.: Die Hochwasser des Jahres 1868 mit besonderer Berücksichtigung des Kantons Graubünden, Denkblätter, Selbstverlag des Autors, Chur, 172, 1870.
Badoux, A., Andres, N., and Turowski, J. M.: Damage costs due to bedload transport processes in Switzerland, Nat. Hazards Earth Syst. Sci., 14, 279–294, https://doi.org/10.5194/nhess-14-279-2014, 2014.
Barton, Y., Giannakaki, P., von Waldow, H., Chevalier, C., Pfahl, S., and Martius, O.: Clustering of Regional-Scale Extreme Precipitation Events in Southern Switzerland, Mon. Weather Rev., 144, 347–369, https://doi.org/10.1175/MWR-D-15-0205.1, 2016.
Bertò, A., Buzzi, A., and Zardi, D.: Back-tracking water vapour contributing to a precipitation event over Trentino: A case study, Meteorol. Z., 13, 189–200, https://doi.org/10.1127/0941-2948/2004/0013-0189, 2004.
Blotnitzky, L.: Bericht über den Föhn und dessen Einfluss auf die Wasserverheerungen an das eidg. Departement des Innern und des Bauwesens, Bern, 1869.
Bogni, P.: L'inondazione di Sesto Calende, Milano, available at: https://hdl.handle.net/2027/uiuc.7212552 (last access: 9 October 2018), 1869.
Borga, M., Stoffel, M., Marchi, L., Marra, F., and Jakob, M.: Hydrogeomorphic response to extreme rainfall in headwater systems: Flash floods and debris flows, J. Hydrol., 518, 194–205, https://doi.org/10.1016/j.jhydrol.2014.05.022, 2014.
Boudevillain, B., Argence, S., Claud, C., Ducrocq, V., Joly, B., Joly, A., Lambert, D., Nuissier, O., Plu, M., Ricard, D., Arbogast, P., Berne, A., Chaboureau, J.-P., Chapon, B., Crepin, F., Delrieu, G., Doerflinger, E., Funatsu, B., Kirstetter, P.-E., Masson, F., Maynard, K., Richard, E., Sanchez, E., Terray, L., and Walpersdorf, A.: Cyclogenèses et précipitations intenses en région méditerranéenne: origines et caractéristiques, La Météorologie, 66, 18–28, 2009.
Bougeault, P., Binder, P., Buzzi, A., Dirks, R., Houze, R., Kuettner, J., Smith, R. B., Steinacker, R., and Volkert, H.: The MAP Special Observing Period, B. Am. Meteorol. Soc., 82, 433–462, https://doi.org/10.1175/1520-0477(2001)082<0433:TMSOP>2.3.CO;2, 2001.
Breuer, L., Eckhardt, K., and Frede, H. G.: Plant parameter values for models in temperate climates, Ecol. Model., 169, 237–293, https://doi.org/10.1016/S0304-3800(03)00274-6, 2003.
Brönnimann, S., Martius, O., Franke, J., Stickler, A., and Auchmann, R.: Historical weather extremes in the “Twentieth Century Reanalysis”, in: Weather extremes during the past 140 years, edited by: Brönnimann, S. and Martius, O., Geographica Bernensia G89, Bern, 53–58, https://doi.org/10.4480/GB2013.G89.06, 2013.
Bundesamt für Wasser und Geologie: Hochwasser 2000 – Les crues 2000, Bern, 2002.
Buzzi, A. and Foschini, L.: Mesoscale Meteorological Features Associated with Heavy Precipitation in the Southern Alpine Region, Meteorol. Atmos. Phys., 72, 131–146, 2000.
Buzzi, A., Tartaglione, N., and Malguzzi, P.: Numerical simulations of the 1994 Piedmont flood: Role of orography and moist processes, Mon. Weather Rev., 126, 2369–2383, 1998.
Caillouet, L., Vidal, J.-P., Sauquet, E., and Graff, B.: Probabilistic precipitation and temperature downscaling of the Twentieth Century Reanalysis over France, Clim. Past, 12, 635–662, https://doi.org/10.5194/cp-12-635-2016, 2016.
Camuffo, D. and Jones, P. D.: Improved Understanding of Past Climatic Variability from Early Daily European Instrumental Sources, Kluwer Academic Publishers, Dordrecht, 2002.
Carrillo, C. M., Castro, C. L., Chang, H.-I., and Luong, T. M.: Multi-year climate variability in the Southwestern United States within a context of a dynamically downscaled twentieth century reanalysis, Clim. Dynam., 49, 4217–4236, https://doi.org/10.1007/s00382-017-3569-1, 2017.
Cassandro Cremonini, R., Gandini, D., Paesano, G., Pelosini, R., and Qian, M.: Analysis of the severe flood of 13–16th October 2000 in Piedmont, Italy, Cuad. Investig. Geogràfica, 27, 147–162, 2001.
Coaz, J. W. F.: Die Hochwasser im September und October 1868 im bündnerischen Rheingebiet, Engelmann, Leipzig, 1869.
Compo, G. P., Whitaker, J. S., Sardeshmukh, P. D., Matsui, N., Allan, R. J., Yin, X., Gleason, B. E., Vose, R. S., Rutledge, G., Bessemoulin, P., Brönnimann, S., Brunet, M., Crouthamel, R. I., Grant, A. N., Groisman, P. Y., Jones, P. D., Kruk, M. C., Kruger, A. C., Marshall, G. J., Maugeri, M., Mok, H. Y., Nordli, O., Ross, T. F., Trigo, R. M., Wang, X. L., Woodruff, S. D., and Worley, S. J.: The Twentieth Century Reanalysis Project, Q. J. Roy. Meteor. Soc., 137, 1–28, https://doi.org/10.1002/qj.776, 2011.
Cram, T. A., Compo, G. P., Yin, X., Allan, R. J., McColl, C., Vose, R. S., Whitaker, J. S., Matsui, N., Ashcroft, L., Auchmann, R., Bessemoulin, P., Brandsma, T., Brohan, P., Brunet, M., Comeaux, J., Crouthamel, R., Gleason, B. E., Groisman, P. Y., Hersbach, H., Jones, P. D., Jónsson, T., Jourdain, S., Kelly, G., Knapp, K. R., Kruger, A., Kubota, H., Lentini, G., Lorrey, A., Lott, N., Lubker, S. J., Luterbacher, J., Marshall, G. J., Maugeri, M., Mock, C. J., Mok, H. Y., Nordli, Ø., Rodwell, M. J., Ross, T. F., Schuster, D., Srnec, L., Valente, M. A., Vizi, Z., Wang, X. L., Westcott, N., Woollen, J. S., and Worley, S. J.: The International Surface Pressure Databank version 2, Geosci. Data J., 2, 31–46, https://doi.org/10.1002/gdj3.25, 2015.
Culmann, C.: Bericht an den hohen schweizerischen Bundesrath über die Untersuchung der schweiz. Wildbäche, vorgenommen in den Jahren 1858, 1859, 1860 und 1863, Zürcher und Furrer, Zürich, 1864.
Di Bella, G.: Le Piene del Ticino a Sesto Calende, Cocquio Trevisago, available at: http://www.prosestocalende.it/ (last access: 9 October 2018), 2005.
Dickinson, R., Errico, R., Giorgi, F., and Bates, G.: A regional climate model for the western United States, Clim. Change, 15, 383–422, https://doi.org/10.1007/BF00240465, 1989.
DiNapoli, S. M. and Misra, V.: Reconstructing the 20th century high-resolution climate of the southeastern United States, J. Geophys. Res.-Atmos., 117, 1–17, https://doi.org/10.1029/2012JD018303, 2012.
Doswell, C. A., Brooks, H. E., and Maddox, R. A.: Flash flood forecasting: An ingredients-based methodology, Weather Forecast., 11, 560–581, 1996.
Fehlmann, R., Quadri, C., and Davies, H.: An Alpine rainstorm: Sensitivity to the mesoscale upper-level structure, Weather Forecast., 15, 4–28, https://doi.org/10.1175/1520-0434(2000)015<0004:AARSTT>2.0.CO;2, 2000.
Flückiger, S., Brönnimann, S., Holzkämper, A., Fuhrer, J., and Krämer, D.: Simulating crop yield losses in Switzerland for historical and present Tambora climate scenarios, Environ. Res. Lett., 12, 74026, 2017.
Frei, C.: Interpolation of temperature in a mountainous region using nonlinear profiles and non-Euclidean distances, Int. J. Climatol., 34, 1585–1605, https://doi.org/10.1002/joc.3786, 2014.
Frei, C. and Schär, C.: A precipitation climatology of the Alps from high-resolution rain-gauge observations, Int. J. Climatol., 18, 873–900, https://doi.org/10.1002/(SICI)1097-0088(19980630)18:8<873::AID-JOC255>3.0.CO;2-9, 1998.
Frei, C. and Schmidli, J.: Das Niederschlagsklima der Alpen: Wo sich Extreme nahe kommen, Promet Jahrgang 32 H. 1/2, 61–67, 2006.
Frei, C., Schöll, R., Fukutome, S., Schmidli, J., and Vidale, P. L.: Future change of precipitation extremes in Europe: Intercomparison of scenarios from regional climate models, J. Geophys. Res.-Atmos., 111, 22 pp., https://doi.org/10.1029/2005JD005965, 2006.
Froidevaux, P. and Martius, O.: Exceptional moisture transport towards orography?: a precursor to severe floods in Switzerland, Q. J. Roy. Meteor. Soc., 142, 1997–2012, https://doi.org/10.1002/qj.2793, 2016.
Füllemann, C., Begert, M., Croci-Maspoli, M., and Brönnimann, S.: Digittalisieren und Homogenisieren von historischen Klimadaten des Swiss NBCN – Resultate aus DigiHom, Arbeitsberichte der MeteoSchweiz, Bundesamt für Meteorologie und Klimatologie Meteo Schweiz, Zürich, 236, 2011.
Gerrits, A. M. J., Pfister, L., and Savenije, H. H. G.: Spatial and temporal variability of canopy and forest floor interception in a beech forest, Hydrol. Process., 24, 3011–3025, https://doi.org/10.1002/hyp.7712, 2010.
Gheusi, F. and Davies, H. C.: Autumnal precipitation distribution on the southern flank of the Alps: A numerical-model study of the mechanisms, Q. J. Roy. Meteor. Soc., 130, 2125–2152, https://doi.org/10.1256/qj.03.06, 2004.
Giorgi, F. and Bates, G. T.: The Climatological Skill of a Regional Model over Complex Terrain, Mon. Weather Rev., 117, 2325–2347, https://doi.org/10.1175/1520-0493(1989)117<2325:TCSOAR>2.0.CO;2, 1989.
Giorgi, F., Marinucci, M. R., and Visconti, G.: Use of a limited-area model nested in a general circulation model for regional climate simulation over Europe, J. Geophys. Res., 95, 18413, https://doi.org/10.1029/JD095iD11p18413, 1990.
Grebner, D.: Meteorologische Analyse des Unwetters von Brig und Saas Almagell vom 24. September 1993, Geogr. Inst. ETH Zürich im Auftrag des Bundesamtes für Wasserwirtschaft, Zürich, 1993.
Grebner, D.: Spatial and temporal patterns of precipitation fields of extreme events in Switzerland and concepts for precipitation scenarios, in: Generation of hydrometeorological reference conditions for the assessment of flood hazard in large river basins, Proceedings of International Workshop, Koblenz, 6 and 7 March 2001, CHR-Report No. I-20, 2001.
Grebner, D., Aschwanden, H., Steinegger, U., and Zimmermann, M.: Charakteristik des Hochwassers vom 9. bis 16. Oktober 2000 auf der Alpensüdseite und im Wallis, Wasser, Energie, Luft, 92, 11–12, 2000.
Gurtz, J., Baltensweiler, A., and Lang, H.: Spatially distributed hydrotope-based modelling of evapotranspiration and runoff in mountainous basins, Hydrol. Process., 13, 2751–2768, https://doi.org/10.1002/(SICI)1099-1085(19991215)13:17<2751::AID-HYP897>3.0.CO;2-O, 1999.
Haylock, M. R., Hofstra, N., Klein Tank, A. M. G., Klok, E. J., Jones, P. D., and New, M.: A European daily high-resolution gridded data set of surface temperature and precipitation for 1950–2006, J. Geophys. Res.-Atmos., 113, D20119, https://doi.org/10.1029/2008JD010201, 2008.
Hilker, N., Badoux, A., and Hegg, C.: The Swiss flood and landslide damage database 1972–2007, Nat. Hazards Earth Syst. Sci., 9, 913–925, https://doi.org/10.5194/nhess-9-913-2009, 2009.
Hofstra, N., Haylock, M., New, M., and Jones, P. D.: Testing E-OBS European high-resolution gridded data set of daily precipitation and surface temperature, J. Geophys. Res.-Atmos., 114, D21101, https://doi.org/10.1029/2009JD011799, 2009.
Hoinka, K. P., Schwierz, C., and Martius, O.: Synoptic-scale weather patterns during Alpine heavy rain events, Q. J. Roy. Meteor. Soc., 132, 2853–2860, 2006.
Jordan, F., Brauchli, T., García Hernández, J., Bieri, M., and Boillat, J.-L.: Rainfall-Runoff Modelling, User Guid., available at: http://www.e-dric.ch/images/techpdf/RS_USERS_GUIDE.pdf (last access: 15 October 2015), 2012.
Landolt, E.: Bericht an den hohen schweizerischen Bundesrath über die Untersuchung der schweiz. Hochgebirgswaldungen, vorgenommen in den Jahren 1858, 1859 und 1860, Zürich, 1862.
Landolt, E.: Die Wasserverheerungen in der Schweiz im September und Oktober 1868, Schweizerische Zeitschrift für Forstwesen, 20, 1–9, 1869.
Lenggenhager, S., Martius, O., Brönnimann, S., and Croci-Maspoli, M.: On the dynamical coupling between atmospheric blocks and heavy precipitation events:A discussion of the southern Alpine flood in October 2000, in review with Q. J. Roy. Meteor. Soc., 2018.
Liechti, K., Panziera, L., Germann, U., and Zappa, M.: The potential of radar-based ensemble forecasts for flash-flood early warning in the southern Swiss Alps, Hydrol. Earth Syst. Sci., 17, 3853–3869, https://doi.org/10.5194/hess-17-3853-2013, 2013.
Lin, Y.-L., Chiao, S., Wang, T.-A., Kaplan, M. L., and Weglarz, R. P.: Some Common Ingredients for Heavy Orographic Rainfall, Weather Forecast., 16, 633–660, https://doi.org/10.1175/1520-0434(2001)016<0633:SCIFHO>2.0.CO;2, 2001.
Luino, F., Fassi, P., Lerbini, M., Belloni, A., Caldiroli, G., and Braghin, F.: Individuazione delle zone potenzialmente inondabili della sponda lombarda del Lago Maggiore, Ricerca storica, studio geomorfologico ed analisi urbanistica ai fini della pianificazione di emergenza comunale e intercomunale, Consiglio Nazionale delle Ricerche, Istituto di Ricerca per la Protezione Idrogeologica CNR-IRPI, Torino, 2005.
Malguzzi, P., Grossi, G., Buzzi, A., Ranzi, R., and Buizza, R.: The 1966 “century” flood in Italy: A meteorological and hydrological revisitation, J. Geophys. Res.-Atmos., 111, 1–15, https://doi.org/10.1029/2006JD007111, 2006.
Martius, O., Zenklusen, E., Schwierz, C., and Davies, H. C.: Episodes of Alpine heavy precipitation with an overlying elongated stratospheric intrusion: A climatology, Int. J. Climatol., 26, 1149–1164, 2006.
Massacand, A. C., Wernli, H., and Davies, H. C.: Heavy precipitation on the alpine southside: An upper-level precursor, Geophys. Res. Lett., 25, 1435–1438, https://doi.org/10.1029/98GL50869, 1998.
Maugeri, M., Bellumé, M., Buffoni, L., and Chlistovsky, F.: Reconstruction of daily pressure maps over Italy during some extreme events of the 19th centrury, Nuovo Cimento, 21, 135–147, 1998.
Messmer, M., Gómez-Navarro, J. J., and Raible, C. C.: Sensitivity experiments on the response of Vb cyclones to sea surface temperature and soil moisture changes, Earth Syst. Dynam., 8, 477–493, https://doi.org/10.5194/esd-8-477-2017, 2017.
Michaelis, A. C. and Lackmann, G. M.: Numerical modeling of a historic storm: Simulating the Blizzard of 1888, Geophys. Res. Lett., 40, 4092–4097, https://doi.org/10.1002/grl.50750, 2013.
Panziera, L. and Germann, U.: The relation between airflow and Orographic precipitation on the southern side of the Alps as revealed by weather radar, Q. J. Roy. Meteor. Soc., 136, 222–238, https://doi.org/10.1002/qj.544, 2010.
Panziera, L., James, C. N., and Germann, U.: Mesoscale organization and structure of orographic precipitation producing flash floods in the Lago Maggiore region, Q. J. Roy. Meteor. Soc., 141, 224–248, https://doi.org/10.1002/qj.2351, 2015.
Parodi, A., Ferraris, L., Gallus, W., Maugeri, M., Molini, L., Siccardi, F., and Boni, G.: Ensemble cloud-resolving modelling of a historic back-building mesoscale convective system over Liguria: the San Fruttuoso case of 1915, Clim. Past, 13, 455–472, https://doi.org/10.5194/cp-13-455-2017, 2017.
Petrascheck, A.: Die Hochwasser 1868 und 1987, Ein Vergleich, Wasser, Energie, Luft, 81, 1–8, 1989.
Pfister, C.: Wetternachhersage: 500 Jahre Klimavariationen und Naturkatastrophen (1496–1995), Verlag Paul Haupt, Bern, 1999.
Pfister, C.: Am Tag danach – Zur Bewältigung von Naturkatastrophen in der Schweiz 1500–2000, Haupt Verlag Bern, Stuttgart, Wien, 2002.
Pfister, C.: Naturkatastrophen als nationale Mobilisierungsereignisse in der Schweiz des 19. Jahrhunderts, in: Naturkatastrophen: Beiträge zu ihrer Deutung, Wahrnehmung und Darstellung in Text und Bild von der Antike bis ins 20. Jahrhundert, edited by: Groh, D., Kempe, M., and Magelshausen, F., Gunter Narr Verlag, Tübingen, 2003.
Pfister, C. and Brändli, D.: Rodungen im Gebirge – Überschwemmungen im Vorland: Ein Deutungsmuster macht Karriere, in: Natur-Bilder. Wahrnehmungen von Natur und Umwelt in der Geschichte, edited by: Sieferle, R. P. and Breuninger, H., 297–323, Campus, Frankfurt a.M., 1999.
Pfister, C. and Summermatter, S.(Eds.): Katastrophen und ihre Bewältigung: Perspektiven und Positionen: Referate einer Vorlesungsreihe des Collegium Generale der Universität Bern im Sommersemester 2003, Haupt Verlag, Bern, 2004.
Pieri, A. B., von Hardenberg, J., Parodi, A., and Provenzale, A.: Sensitivity of Precipitation Statistics to Resolution, Microphysics, and Convective Parameterization: A Case Study with the High-Resolution WRF Climate Model over Europe, J. Hydrometeorol., 16, 1857–1872, https://doi.org/10.1175/JHM-D-14-0221.1, 2015.
Rössler, O. and Brönnimann, S.: The effect of the Tambora eruption on Swiss flood generation in 1816/1817, Sci. Total Environ., 627, 1218–1227, https://doi.org/10.1016/j.scitotenv.2018.01.254, 2018.
Röthlisberger, G.: Unwetterschäden in der Schweiz im Jahre 1993, Wasser, Energie, Luf, 86, 1–8, 1994.
Rotunno, R. and Ferretti, R.: Mechanisms of Intense Alpine Rainfall, J. Atmos. Sci., 58, 1732–1749, https://doi.org/10.1175/1520-0469(2001)058<1732:MOIAR>2.0.CO;2, 2001.
Rotunno, R. and Houze, R. A.: Lessons on orographic precipitation from the mesoscale alpine programme, Q. J. Roy. Meteor. Soc., 133, 811–830, 2007.
Schlemmer, L., Martius, O., Sprenger, M., Schwierz, C., and Twitchett, A.: Disentangling the Forcing Mechanisms of a Heavy Precipitation Event along the Alpine South Side Using Potential Vorticity Inversion, Mon. Weather Rev., 138, 2336–2353, https://doi.org/10.1175/2009MWR3202.1, 2010.
Schneidereit, M. and Schär, C.: Idealised Numerical Experiments of Alpine Flow Regimes and Southside Precipitation Events, Meteorol. Atmos. Phys., 72, 233–250, https://doi.org/10.1007/s007030050018, 2000.
Schwander, M., Brönnimann, S., Delaygue, G., Rohrer, M., Auchmann, R., and Brugnara, Y.: Reconstruction of Central European daily weather types back to 1763, Int. J. Climatol., 37, 30–44, https://doi.org/10.1002/joc.4974, 2017.
Schweizerisches Bundesarchiv: Aufruf des Bundesraths an das Schweizervolk und an die Schweizer im Auslande (vom 14. Oktober 1868), BAR J 2.1 1000/1211 Nr. 17, Schweizerische Eidgenossenschaft, Bern, 1868a.
Schweizerisches Bundesarchiv: Schätzung von Tessin [Beschreibung und Schätzung von verschiedenen Schäden], BAR J 2.1 1000/1211 Nr. 17, Schweizerische Eidgenossenschaft, Bern, 1868b.
Schweizerisches Bundesarchiv: Überschwemmungen in den Kantonen Tessin, Uri, Wallis, Graubünden und St. Gallen im Jahre 1868, BAR E 21 1000/131 Nr. 21722-21724, Schweizerische Eidgenossenschaft, Bern, 1868c.
Skamarock, W. C., Klemp, J. B., Gill, D. O., Barker, D. M., Duda, M. G., Wang, W., and Powers, J. G.: A Description of the Advanced Research WRF Version 3, NCAR Tech. Note, (NCAR/TN–475+STR), National Center for Atmospheric Research, Mesoscale and Microscale Meteorology Division, Boulder, Colorado, USA, 2008.
Stucki, P. and Luterbacher, J.: Precipitation, Temperature and Runoff over the Past Few Centuries, in: Hydrological Atlas of Switzerland HADES, p. 4, Bern, available at: http://www.hydrologischeratlas.ch (last access: 9 October 2018), 2010.
Stucki, P., Rickli, R., Brönnimann, S., Martius, O., Wanner, H., Grebner, D., and Luterbacher, J.: Weather patterns and hydro-climatological precursors of extreme floods in Switzerland since 1868, Meteorol. Z., 21, 531–550, https://doi.org/10.1127/0941-2948/2012/368, 2012.
Stucki, P., Martius, O., Brönnimann, S., and Franke, J.: The extreme flood event of Lago Maggiore in September 1993, in: Weather extremes during the past 140 years, edited by: Brönnimann, S. and Martius, O., Geographica Bernensia, G89, 53–58, https://doi.org/10.4480/GB2013.G89.06, 2013
Summermatter, S.: Die Überschwemmungen von 1868 in der Schweiz: unmittelbare Reaktion und längerfristige Prävention mit näherer Betrachtung des Kantons Wallis, Verlag Traugott Bautz, Nordhausen, 2005.
Summermatter, S.: Die instrumentalisierte Katastrophe: Die Schweizer Wasserbaupolitik vor und nach den Überschwemmungen von 1868, Hist. Soc. Res., 32, 200–214, 2007.
Summermatter, S.: Die Prävention von Überschwemmungen durch das politische System der Schweiz von 1848 bis 1991, Universität Bern, Bern, 2012.
Tonzani, P. and Troisi, C.: Gli eventi alluvionali del settembre-ottobre 1993 in Piemonte, available at: http://www.arpa.piemonte.it/approfondimenti/temi-ambientali/geologia-e-dissesto/pubblicazioni/immagini-e-files/ev93/ev93 (last access: 9 October 2018), 1993.
Viviroli, D., Zappa, M., Gurtz, J., and Weingartner, R.: An introduction to the hydrological modelling system PREVAH and its pre- and post-processing-tools, Environ. Modell. Softw., 24, 1209–1222, https://doi.org/10.1016/j.envsoft.2009.04.001, 2009.
Welker, C., Martius, O., Stucki, P., Bresch, D., Dierer, S., and Brönnimann, S.: Modelling economic losses of historic and present-day high-impact winter windstorms in Switzerland, Tellus A, 68, 18, 29546, https://doi.org/10.3402/tellusa.v68.29546, 2015.
Wolf, R.: Schweizerische Meteorologische Beobachtungen, Schweizerische Meteorologische Centralanstalt der schweizerischen naturforschenden Gesellschaft, Fünfter Jahrgang, Zürich, 1868.
Zappa, M., Jaun, S., Germann, U., Walser, A., and Fundel, F.: Superposition of three sources of uncertainties in operational flood forecasting chains, Atmos. Res., 100, 246–262, https://doi.org/10.1016/j.atmosres.2010.12.005, 2011.