the Creative Commons Attribution 4.0 License.
the Creative Commons Attribution 4.0 License.
 | 20 Nov 2018
Probable maximum precipitation estimation in a humid climate
Zahra Afzali-Gorouh
Bahram Bakhtiari
Kourosh Qaderi
Probable maximum precipitation (PMP) estimation is one of the most important components for designing hydraulic structures. The aim of this study was the estimation of 24 h PMP (PMP24) using statistical and hydro-meteorological (physical) approaches in the humid climate of the Qareh-Su basin, which is located in the northern part of Iran. Firstly, for the statistical estimate of PMP, the equations of empirical curves of the Hershfield method were extracted and the Hershfield standard and modified methods were written in Java programming language, as a user-friendly and multi-platform application called the PMP Calculator. Secondly, a hydro-meteorological approach, which is called the convergence model, was used to calculate PMP24. The results of both approaches were evaluated based on statistical criteria, such as the mean absolute error (MAE), mean squared error (MSE), root mean squared error (RMSE), mean absolute percentage error (MAPE), correlation coefficient (r), and coefficient of determination (R2). The maximum values of PMP24 for the Hershfield standard and modified methods were estimated to be 448 and 201 mm, respectively, while the PMP obtained by the physical approach was 143 mm. Comparison of PMP24 values with the maximum 24 h precipitation demonstrated that based on performance criteria including the MAE, MSE, RMSE, MAPE, r, and R2, the physical approach performed better than the statistical approach and it provided the most reliable estimates for PMP. Also, the accuracy of the Hershfield modified method was better than the standard method using modified Km values, and the standard method gives excessively large PMP for construction costs.


Intensive rainfall and heavy floods are among the most catastrophic natural hazards which have large social consequences for communities all over the world. In order to reduce the destructive effects of these phenomena, flood risk management is essential. One of the most important components in flood risk management is probable maximum flood (PMF) estimation. Hydrologists use PMF to design types of hydrologic infrastructure in a given basin, such as major spillways, dam storage capacity, and flood protection structures. In order to calculate PMF accurately, it is necessary to calculate the probable maximum precipitation (PMP). PMP has been defined as “the greatest depth of precipitation for a certain duration meteorologically possible for a given size storm area at a specific time of year (WMO, 2009)”.
The World Meteorological Organization has widely proposed the use of statistical and hydro-meteorological (physics-based) approaches for estimating PMP (WMO, 2009). A statistical approach is a probabilistic procedure that requires statistical analysis based on the historical extreme precipitation at the meteorological stations where at least 30 years of daily data are available. This procedure is mostly used for small basins up to 1000 km2 (WMO, 2009).
Several statistical approaches have been used to derive PMP. Among others, the Hershfield method (Hershfield, 1961, 1965) is recommended by WMO as a well known method to calculate PMP. Other statistical methods widely used are multifractal (Douglas and Barros, 2003), traditional frequency analysis methods or different statistical distributions such as the generalized extreme value (GEV) (Vivekanandan, 2015; Deshpande et al., 2008) and Fisher–Tippett and beta distributions (Nobilis et al., 1991). The advantage of the multifractal approach is that it provides a formal framework to derive the value of extreme events, called the fractal maximum precipitation (FMP), independently of empirical adjustments, a site-specific application of FMP in orographic regions. It should be noted that the length of the record, the spatial resolution of the rain gauge network, and the lack of uncertainty estimates constrained this method (Douglas and Barros, 2003). PMP estimation using the GEV method requires potentially suitable distribution such as extreme value type 1 (EV1) or extreme value type 2 (EV2). Many studies focus on the GEV and the Hershfield method in different regions. These researchers suggested that the application of the GEV method has led to underestimates of the upper tail (Fernando and Wickramasuriya, 2011; Alias et al., 2013; Boota et al., 2015).
Among these approaches, the Hershfield method is the most frequently used (WMO, 1986, 2009; Lan et al., 2017; Singh et al., 2018). Basically, this approach is a frequency analysis method; it is different from traditional frequency analysis methods in two important respects. First, frequency analysis methods are used to determine the statistics of extremes, and this method involves the application of the process of enveloping. Second, it focuses on a wide region, rather than a single station or single watershed, in order to capture a storm that approximates the physical upper limit of precipitation (WMO, 2009). Generally, this method is applied for the quick assessment of PMP (Rakhecha et al., 1992).
Hydro-meteorological estimation approaches can usually be divided into various methods, such as (a) the storm model approach, (b) the generalized method, (c) the moisture maximization method, and (d) the storm transportation method.
- a.
The storm model approach provides the PMP estimation based on the physical parameterization of the precipitation process and the maximization of its components. This method emphasizes the meteorological analysis of the conditions responsible for the development of extreme precipitation (Collier and Hardaker, 1996; Beauchamp et al., 2013).
- b.
The generalized method is time-consuming and expensive, but it has many advantages. Consistency between estimates for basins in the region is maintained. In fact, this method provides the most accurate estimates for an individual basin (Rakhecha et al., 1995; WMO, 2009).
- c.
The moisture maximization method is widely used for PMP estimation. Despite its modifications and improvements, the method has been criticized as being insufficiently physical as it assumes a linear relationship between precipitation and the water-holding capacity of the atmosphere (WMO, 1986; Papalexiou and Koutsoyiannis, 2006; Casas et al., 2011; Micovic et al., 2015; Rouhani and Leconte, 2016).
- d.
The storm transportation method is based on transposition and maximization of the actual observed storms. This method increases the sample size of historical storms for PMP estimation (Rezacova et al., 2005; Rakhecha and Singh, 2009). Therefore, each method has its own theoretical basis as well as advantages, disadvantages, and applicable conditions. However, it is not always easy to use hydro-meteorological methods in many parts of the world. For example, determining the maximum humidity content in some places may not be effortless (WMO, 2009). For this reason, such physical-based approaches have not been completely established and need to be widely verified.
Comparison of both statistical and hydro-meteorological approaches has shown that both of them have advantages and disadvantages. The main disadvantage of the statistical approach is that it only depends on point precipitation data. Therefore, it cannot estimate PMP accurately (Soltani et al., 2014). While the advantages of this approach are its simple usage and quick estimates in emergencies or when there is the absence of adequate in situ meteorological data, the disadvantage of the hydro-meteorological approach is the computational complexity and the fact that it requires the strong hydro-meteorological knowledge, especially when there is insufficient storm data over the region. This approach has two main advantages, including the consideration of the majority of atmospheric factors such as the dew point temperature, air temperature, wind speed and direction, humidity, and air pressure; it provides more reliable results than the statistical approach for a large basin. Furthermore, it is possible to use satellite images and run atmospheric models such as RegCM3, WRF, and MM5 with this approach (Soltani et al., 2014).
Some studies indicated that both statistical and physical approaches provide reliable estimates of PMP (Rezacova et al., 2005; Casas et al., 2011). In some cases, the PMP value obtained from the statistical approach is about 2 times higher than the estimated value of the physical approach (Desa et al., 2001; Fattahi et al., 2010; Chavan and Srinivas, 2015). Thus, these studies had opposing conclusions regarding the importance of the occurrence of rare events in the recorded period, the storm precipitation data which affect the computation of the average and standard deviation amounts, and the length of records in deriving changes in PMP. A general summary of these research studies has indicated that statistical approaches provide larger estimates of PMP, but it is proposed for areas where hourly rainfall, dew point temperature, wind speed, and vertical radiosonde measurements are unavailable.
There have been several studies about PMP estimation using the hydro-meteorological and statistical approaches in different parts of Iran (Ghahraman, 2008; Naseri Moghaddam et al., 2009; Fattahi et al., 2010; Shirdeli, 2012). Naseri Moghadam et al., (2009) estimated 1-day PMP for 23 meteorological stations in four central provinces of Iran using the Hershfield method. Their emphasis was to correct the frequency factor of the Hershfield method for these stations. The results indicated that the highest value of the frequency factors was 7.6. In another study, Soltani et al. (2014) estimated PMP using statistical and physical approaches for the central regions of Iran. They observed that PMP estimated using the statistical approach was greater than that estimated using the physical approach.
In an overall conclusion, it was found that there are no generally recommended approaches for PMP estimation (WMO, 2009). Besides the available extreme rainfall data, the choice of method depends on the geographical and meteorological characteristics of the area. It is important to consider both hydro-meteorological and statistical approaches for each region. Therefore, further research is needed to resolve this important issue.
Extreme rainfall and flash floods which occurred in the spring and summer seasons are the most common hazards in the north of Iran including the southern Caspian region representing the provinces of Mazandaran, Gilan, and Golestan. In recent years, the Golestan province has experienced deadly floods as shown in its historical data. Due to consequences of extreme precipitation and floods in this region, it is necessary to estimate the values of PMP and PMF to reduce the risk of them. The value of PMP is needed for designing irrigation and drainage channels and sewage collection and disposal systems, and for measuring the maximum amount of water entering the reservoirs in this region.
The present study was undertaken to achieve the following objectives: (i) to estimate the 24 h PMP (PMP24) using the Hershfield statistical approach at seven weather stations located in the north-east of Iran, (ii) to prepare a user-friendly and multi-platform program in Java for the PMP calculation using Hershfield's standard and modified methods, (iii) to provide the PMP24 spatial distribution maps in ArcGIS for the studied region, (iv) to determine the regions that are more likely to experience intense storms, (v) to estimate the PMP24 using the hydro-meteorological approach, and (vi) to compare the values obtained from both the hydro-meteorological and statistical approaches with the observed maximum 24 h precipitation in the study stations.
2.1 Study area and data
The Qareh-Su basin is located in the Golestan province in the northern part of Iran and has a humid climate. The Qareh-Su basin, with nearly 1760 km2 area, is one of the most important basins in the north of the country. This area is important from the viewpoint of the existence of different cities and villages, population densities, industrial and agricultural centres, floods, and watershed management schemes. A total of 8 % of the surface water (equal to 100 million m3) in the Golestan province is derived from the Qareh-Su basin. There are two main dams including Kowsar and Shast Kalateh which meet the water demand of agricultural and residential land located in this area. Also, it is one of the most flood-prone areas that has suffered from severe floods throughout its long history; therefore, in recent years, this region has experienced considerable damage. The locations of the study stations are shown in Fig. 1.
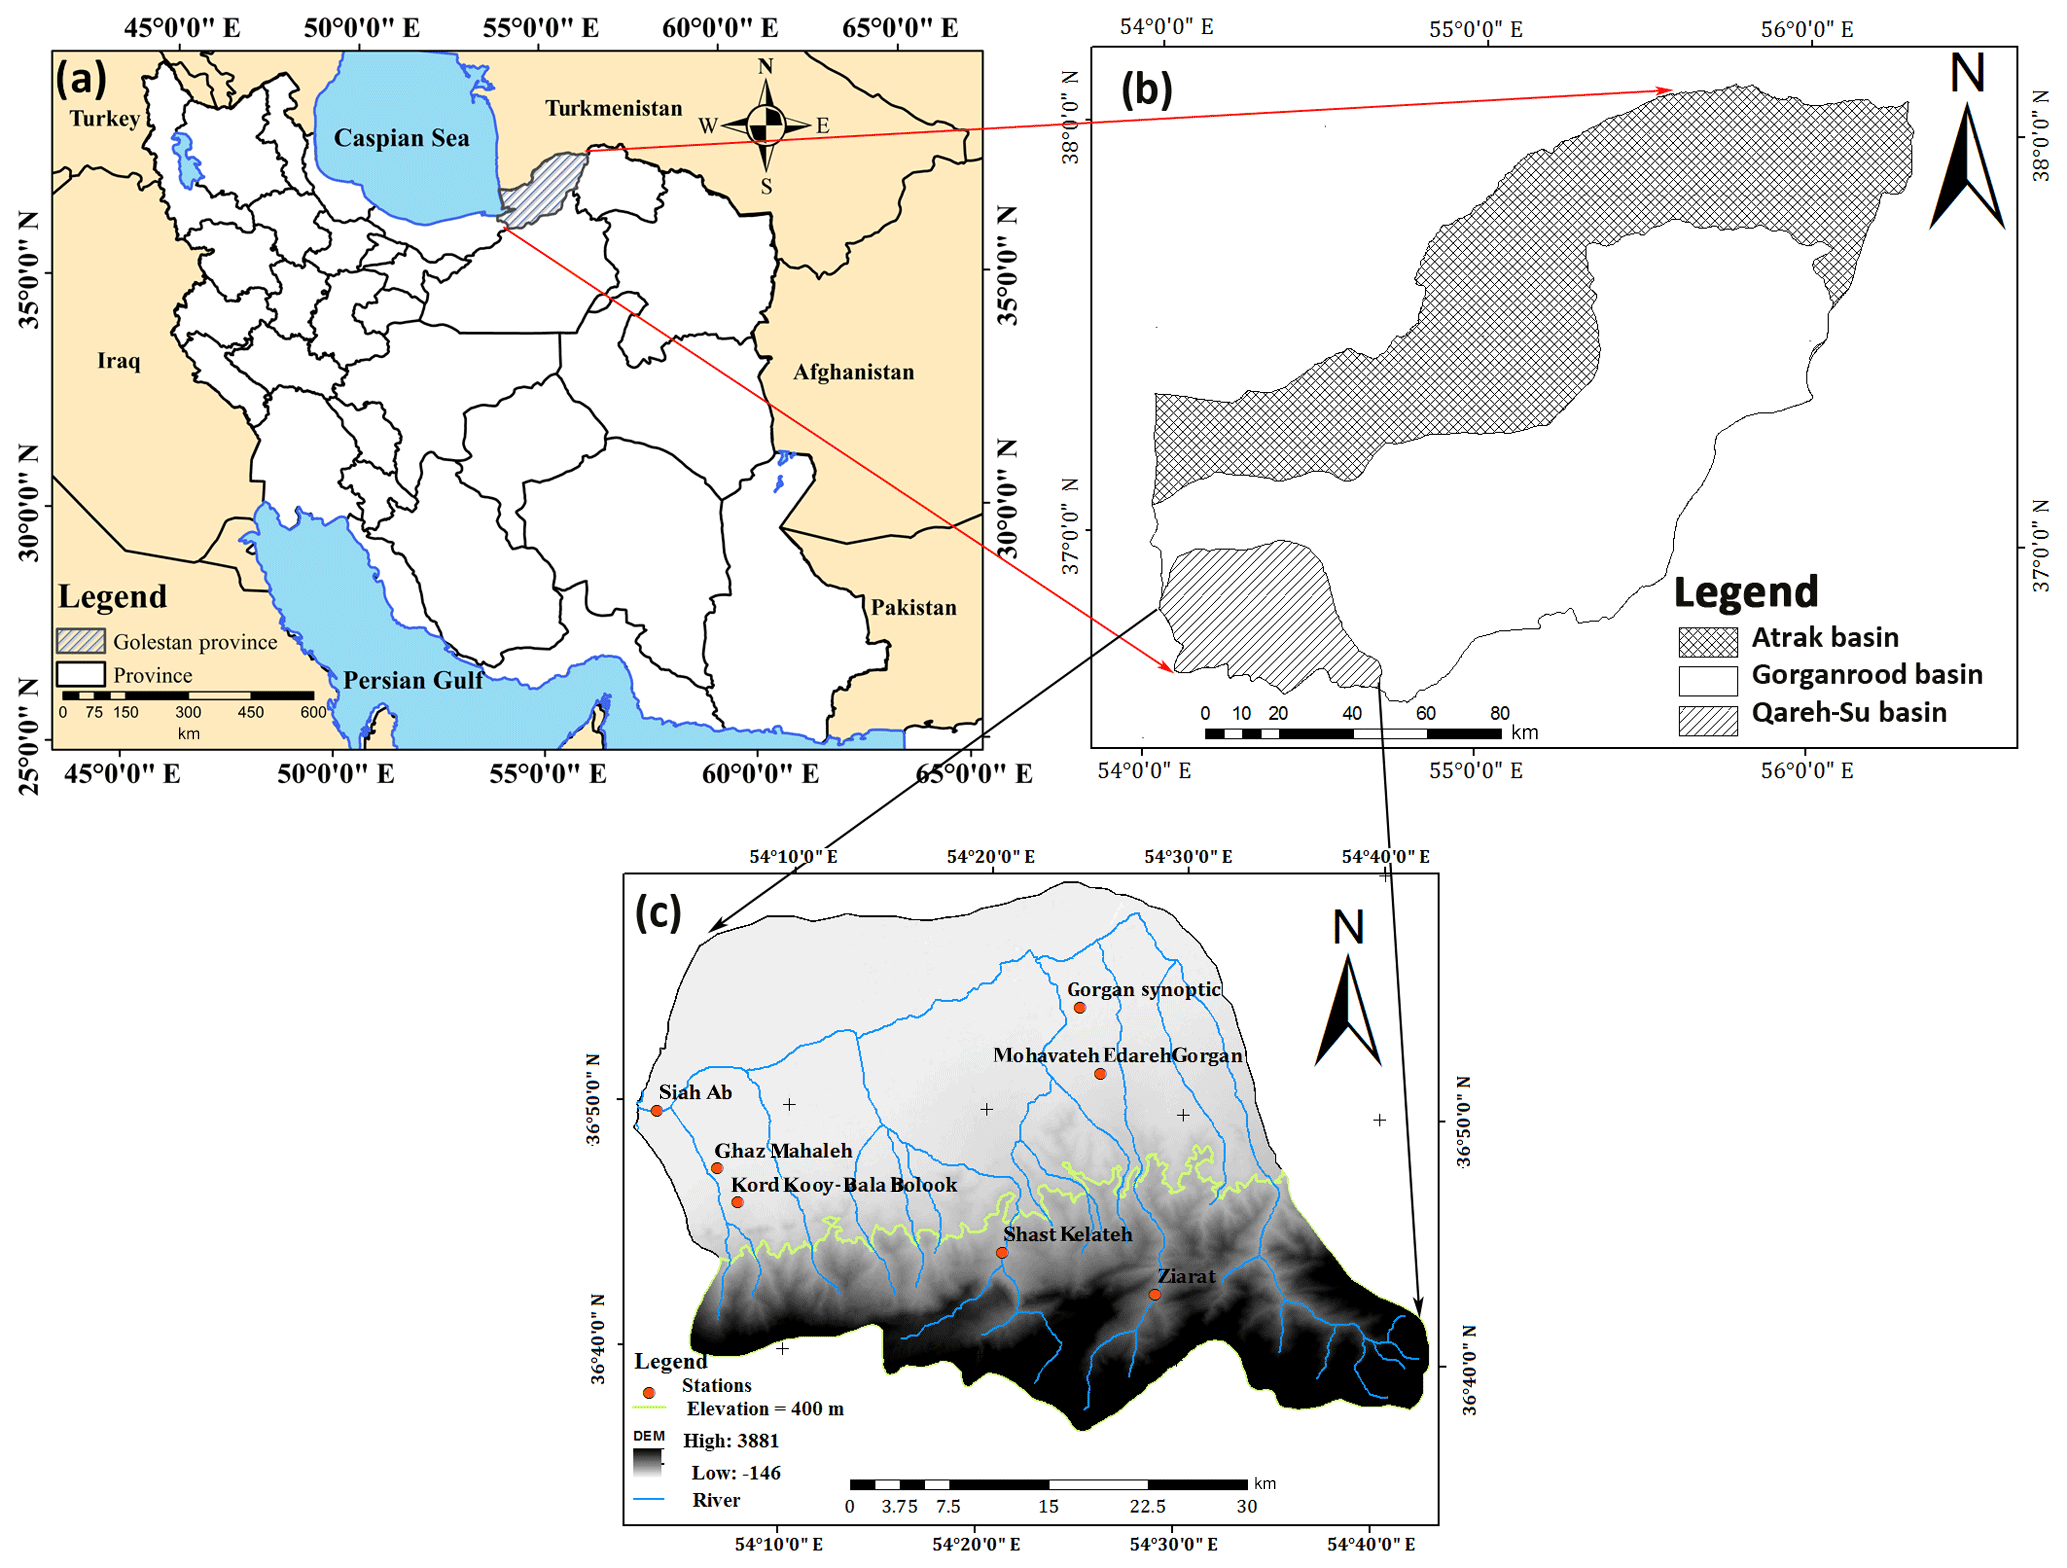
Figure 1(a) Golestan province, north of Iran, (b) three main basins of Golestan, and (c) the location of stations in the Qareh Su basin in south-western Golestan.
There are seven weather stations (one synoptic and six rain gauge stations) in the study area (Table 1). The long-term daily and hourly meteorological data during years 1981–2013 were applied to calculate PMP. These data include 3 h dew point temperature, 3 h wind speed and direction at 10 m elevation, 3 h and monthly air pressure, and 3 and 24 h precipitation, and were gathered from the IRIMO (Islamic Republic of Iran Meteorological Organization, 2014).
Table 1Characteristics of different stations in the Qareh-Su basin.

2.2 Statistical approach
The statistical approach developed by Hershfield is based on the general frequency equation (WMO, 2009; Chow, 1951). This equation is as follows:
where XPMP is the PMP estimate for a certain station at the particular duration and and Sn are the average and standard deviation of the annual extreme series for a given duration, respectively. Km is the frequency factor as a function of duration and average of annual maximum rainfall (the maximum depth of 24 h precipitation in each year). In other words, Km is the number of standard deviations to be added to the average of the annual extreme series to obtain PMP. In this approach, Km is calculated by Km charts, which were extracted based on records of rainfall from around 2700 stations in the climatological observation of the United States (WMO, 2009). The Hershfield standard method is modified by Desa et al. (2001). In the modified method, Km is calculated by Eq. (2):
where Xmax is the maximum observed rainfall data, and and Sn−m are the average and the standard deviation of the annual extreme series without the largest value, respectively. In order to calculate the PMP24 by the Hershfield modified method, first, the parameters in Eq. (1) are estimated. Then, the Km values for all the stations are mapped against each of the values and a smooth envelope curve is drawn. The Kenvelope value is obtained from the curve for each station's . The value of PMP for each station is then estimated using Eq. (1) by replacing Km with the Kenvelope value (Alias and Takara, 2013). In this study, statistical PMP was calculated using a user-friendly and multi-platform program in Java that is available at http://academicstaff.uk.ac.ir/en/babakhtiari (last access: 1 October 2015).
2.3 Physical approach
There are two common physical approaches, namely the mountainous and convergence models, to calculate PMP (Joos et al., 2005). The convergence model is based on the physical characteristics of storms, i.e. the dew point temperature, wind speed, wind direction, etc. The main steps to calculating PMP using the convergence model are the selection of severe storms, producing the depth–area–duration (DAD) curves, moisture maximization, and wind maximization. A severe and widespread storm is a weather condition that leads to the occurrence of precipitation at all stations in the basin and even around the basin. The most severe and widespread storms are selected based on maximum discharge and maximum 24 h rainfall data. Producing isohyets maps are one of the main steps in the preparation of DAD curves. Using an analysis of the storms, DAD curves can be obtained. DAD curves are also applied to generalized relations for other areas or other basins with a similar climate and topographic characteristics. The first step to develop a DAD curve is collection of the precipitation data for all areas in the storm.
The storm maximization factor is calculated by the moisture maximization factor multiplied by the wind maximization factor. The moisture maximization method is one of the acceptable procedures to maximize the rainfall values associated with severe storms (Rakhecha and Singh, 2009). This method assumes that the atmospheric moisture would hypothetically rise up to a high value that is regarded as the upper limit of moisture, and the mentioned limit is estimated from historical records of dew point temperature. After the selection of severe and widespread storms and the calculation of average rainfall depth for the study area, it is necessary to calculate the maximum humidity source in order to maximize selected storms. By converting mean monthly pressure data at each station to 1000 mb pressure level, the effect of topography could be ignored. Dew point temperature and maximum 12 h persisting conditions at the stations during all storm events were computed and reduced to equivalent mean sea level (i.e. 1000 mb pressure level). The moisture maximization factor (FM) is calculated by Eq. (3).
where Wm is the maximum precipitable water in the 1000 to 200 mb levels, which can be obtained on the basis of the maximum 12 h duration dew point with a 50-year return period, and Ws is the maximum precipitable water at 1000 to 200 mb levels, which can be obtained on the basis of the maximum 12 h duration dew point in a simultaneous period with a storm (WMO, 2009). Wind maximization is most commonly used in orographic regions when it appears that observed storm rainfall over a mountain range might vary in proportion to the speed of the moisture-bearing wind blowing against the range. The wind maximization ratio is simply the ratio of the maximum average wind speed for some specific duration and critical direction obtained from a long record of observations, e.g. 50 or 100 years, to the observed maximum average wind speed for the same duration and direction in the storm being maximized. The wind speed maximization factor (MW) is defined by Eq. (4).
where MW1 and MW2 are the maximum wind speed with a 100-year return period and the maximum persisting 12 h wind speed during the storm, respectively (WMO, 2009). Finally, PMP is determined by the precipitation depth (R) multiplied by moisture maximization and wind maximization factors based on Eq. (5).
2.4 Performance criteria
The performance of the statistical and physical approaches for estimating PMP24 was judged by comparing the observed maximum 24 h precipitation values with the corresponding average estimated PMP24 values. This comparison was conducted based on six statistical criteria, in terms of the mean absolute error (MAE; Eq. 6), mean squared error (MSE; Eq. 7), root mean squared error (RMSE; Eq. 8), mean absolute percentage error (MAPE; Eq. 9), correlation coefficient (r; Eq. 10), and coefficient of determination (R2; Eq. 11).
where Ot is maximum 24 h precipitation, Ct is the calculated PMP24, and n is the number of data. The RMSE reveals the actual division among the estimated and the observed values. When the RMSE value is closer to or equal to zero, performance is more accurate. Also, smaller values of MAE, MSE, and MAPE show a more accurate performance. The correlation coefficient varies from +1 to −1. Complete correlation between two variables is expressed by either +1 or −1, and complete absence of correlation is represented by 0. R2 varies between 0 and 1; a closer number to 1 represents a better performance.

Figure 2The spatial distribution of PMP24 using (a) standard and (b) modified approaches in the study area.
3.1 Statistical approach
The focus of this study is the calculation of PMP24 using statistical and physical approach in the north of Iran. In order to calculate PMP using the statistical approach, the equations of adjustment factors of the Hershfield method were extracted, based on the coefficient of determination (R2). Adjustment factors that are applied in the statistical estimation of PMP values are Km, the adjustment of average and standard deviation for the maximum observed event and for sample size, and the adjustment for fixed observational time intervals and area reduction curves. These equations permit estimation to be carried out rapidly using a computer. The 24 h duration Km was calculated using Eq. (12).
where x is the 24 h mean annual maximum rainfall (mm). Thus, a user-friendly and multi-platform Java application, which is called the PMP Calculator, was developed. This application was supported by all operating system such as Windows, Linux, and Macintosh OS X. It seems that this is the first attempt to design an application which calculates PMP in four durations using both Hershfield standard and modified methods. Also, in order to compare PMP in all stations, this application calculates the ratio of PMP to the maximum depth of rainfall as a criterion independent of climatic conditions.
Using the PMP Calculator application, PMP can be calculated using Hershfield standard and modified methods for durations such as 5 min and 1, 6, and 24 h durations. In this study, maximum 24 h duration rainfall values for selected stations located in the north of Iran with a record length of 33 years were adopted to estimate the appropriate Km values.
Table 2 indicates the result of PMP24 using the statistical approach in the study area, which was calculated using the PMP Calculator application. A more detailed analysis of PMP in the study area could be presented using the PMP24 isohyetal lines using the Hershfield standard and modified methods which are shown in Fig. 2. PMP values at each point in the study area could be approximated from these maps. Also, the range of PMP values and its variation are shown clearly. From Fig. 2a, it is clear that the highest PMP24 values for the standard Hershfield method are in the south-west parts of basin around the Kord Kooy and Ghaz Mahalleh stations, which are from 450 to 430 mm, whereas the lowest PMP values are in the south-eastern parts of basin around the Ziarat station, where the isohyetal lines are less than 240 mm. From Fig. 2b, the PMP24 values resulting from the use of the Hershfield modified method are lower in south-eastern parts and higher in the western parts of the study area. Generally, the PMP24 values resulting from both Hershfield methods decrease from west to east (Fig. 2). The results of Fig. 2 showed that the western parts of the basin, that are closer to the Caspian Sea, experience more severe storms. These maps are applicable to specify the regions that are more likely to experience intense storms, and such information could be useful for water resources planning and management, flood risk assessment, and catastrophe management.
The results indicated that for the Hershfield standard method, Km was found to vary between 17 and 18. The minimum and maximum values for point PMP24 were 232.4 and 447.7 mm (Table 2). Also, in the Hershfield standard method, there are substantial variations in the PMP results with the variation range of 215.3 mm and average and the standard deviation of 369.1 and 74.2 mm. It shows the effect of record length on the results of the standard approach and substantial variation in the results causes uncertainty. In the Hershfield modified method, in order to calculate the Km values, just the maximum values were considered. It caused a considerable decrease in the Km values compared with the Hershfield standard method.
The GEV theory was used to calculate 50-year precipitation (P50). For this purpose, the GEV model was fitted on rainfall data. The results indicated that there is a significant correlation between the standard and modified estimates of PMP24 and P50. The values of the coefficient of determination (R2) between the standard and modified estimates of PMP24 and P50 were 0.97 and 0.98, respectively. The relationships of PMP24 and P50 are defined by Eqs. (13 and 14). Since the application of the GEV model led to underestimates of the upper tail, the use of the Hershfield approach was recommended.
Table 2PMP24 values using Hershfield standard and modified methods in the study area.
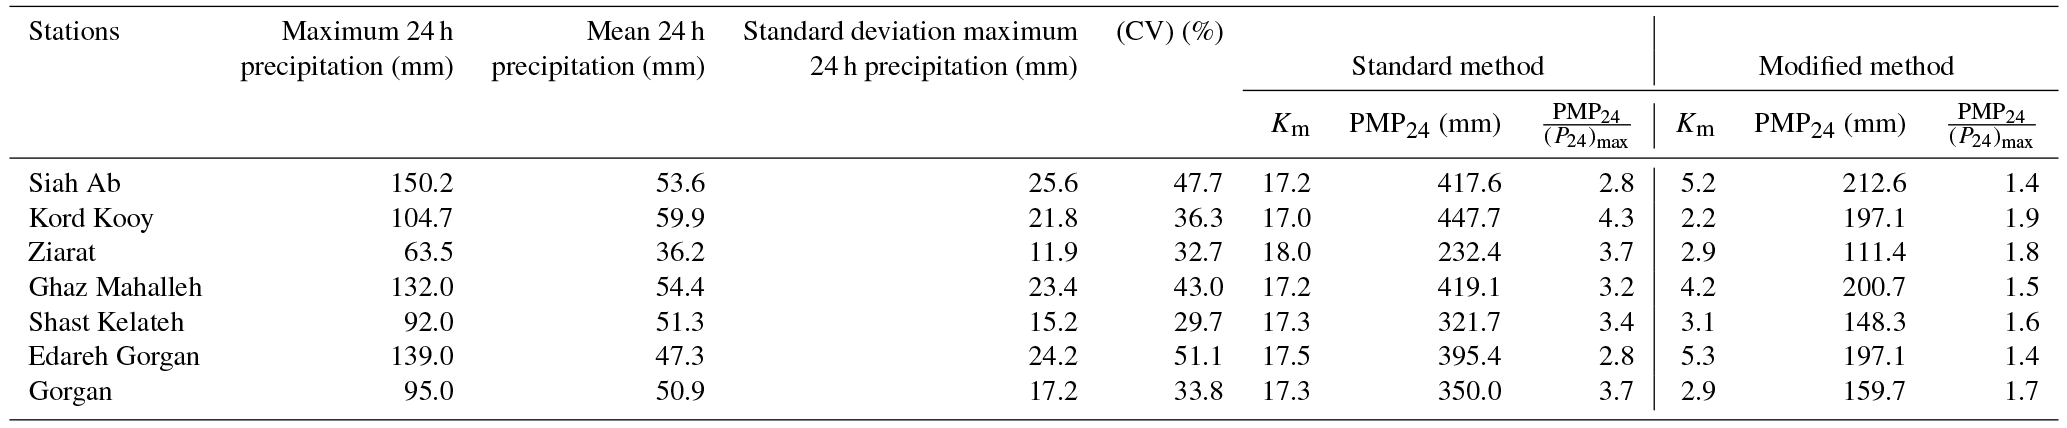
Therefore, the corresponding values of Km for the Hershfield modified method ranged from 2.2 to 5.3 and the minimum and maximum values for point PMP24 were 111.4 to 200.7 mm. The variation range, average, and the standard deviation of the modified method are about half of the corresponding values of the standard method. In order to compare two these methods and compare stations, the ratio of areal PMP24 to the maximum of 24 h precipitation (P24)max, as a criterion independent of climatic conditions, was used. The maximum and minimum value of the ratio of PMP24 to (P24)max obtained using the standard method were 2.8 and 4.3, whereas these values obtained using the modified method were 1.4 and 1.9. The ratio of PMP24 to (P24)max in the modified method is closer to 1; therefore, the results of the modified method are more rational. Finally, based on the modified method, the maximum Km of Hershfield equation in the study area was found to be 5.3. The approximated Km is in accordance with corresponding research in the Atrak watershed (Ghahraman, 2008) and in Malaysia (Desa et al., 2001; Desa and Rakhecha, 2007). Much research has been done on Km in the standard method but all of them lead to a high estimation of PMP. In the modified method, just the maximum values were considered and caused a severe and perceptible decrease in Km values, which were more rational (Desa et al., 2001). Due to considering actual rainfall in the calculation of Km, the modified method provided more stable results than the standard method in the study area. After calculation of the storm maximization factor using the wind and moisture maximization factors, the physical PMP24 was estimated.
3.2 Physical approach
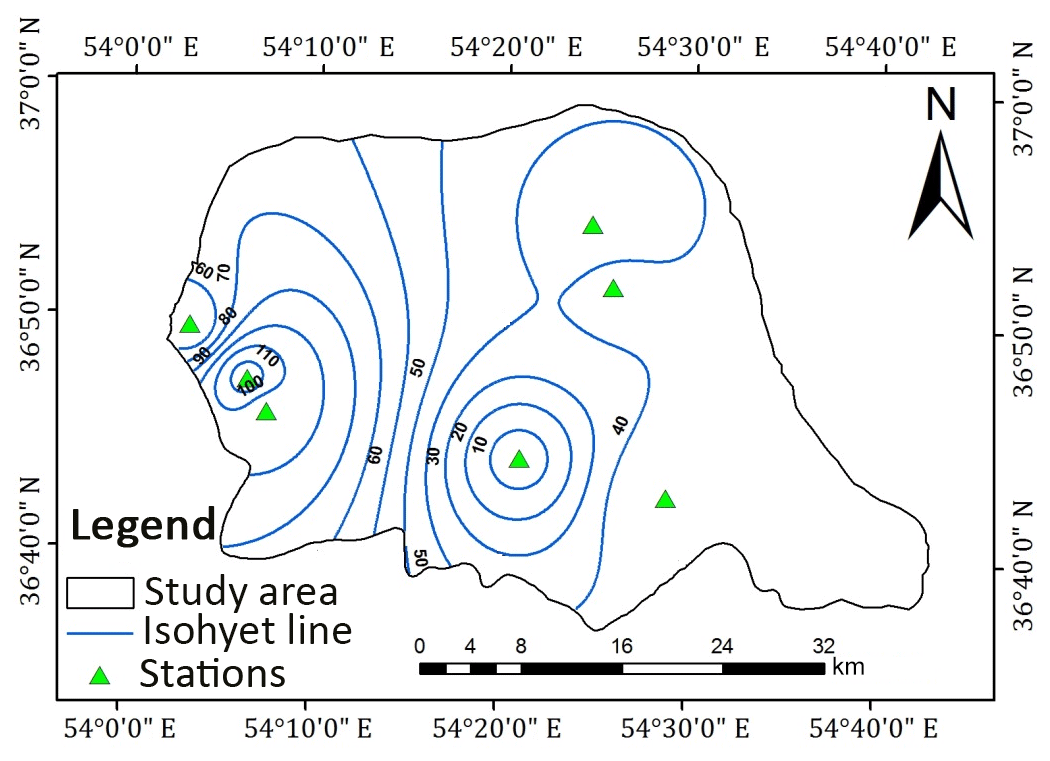
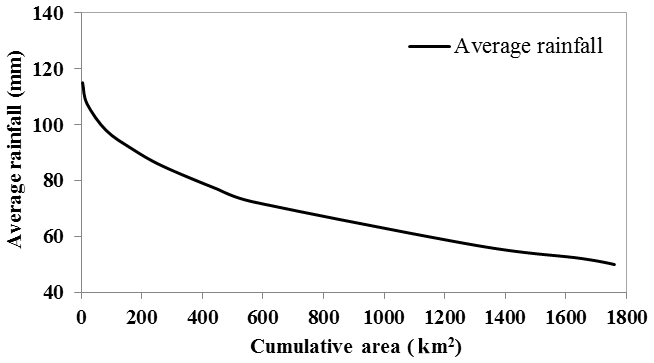
In this study based on maximum discharge and daily rainfall data with 24 h duration, obtained from the Iran Water Resources Management Company and IRIMO as reliable sources, eight storms were selected as the most severe and widespread storms during 1981 to 2013. The dates of occurrence of these storms are given in Table 3. After selection of severe and widespread storms, the isohyet maps for each storm were plotted in ArcGIS 9.3. To produce the DAD curves, the area bounded by each isohyet line was calculated in ArcGIS 9.3. Based on Fig. 3, which shows the spatial distribution of precipitation during the storm of September 2008 as one of the most severe storms, the greatest amount of precipitation occurred over the western parts of the basin that are nearest to the sea, whereas the smallest amounts of precipitation occurred over the eastern parts of the basin. Based on this figure, in the western parts of the basin, isohyet lines are found close to each other and the magnitude of the rainfall gradient increases; thus the variation of rainfall in this part of the basin was elevated. Table 4 illustrates the moisture and wind speed maximizations at 1000 mb for selected storms measured at the Gorgan station. The DAD curve for the storm of September 2008 showed that the amount of rainfall decreased with increasing area (Fig. 4). The results of the physical approach demonstrated that the storm of October 1993 was the most severe storm, while the storm of November 2006 was revealed as the mildest one (Table 5).
Table 3Date of 24 h duration severe and widespread storms in the study area.
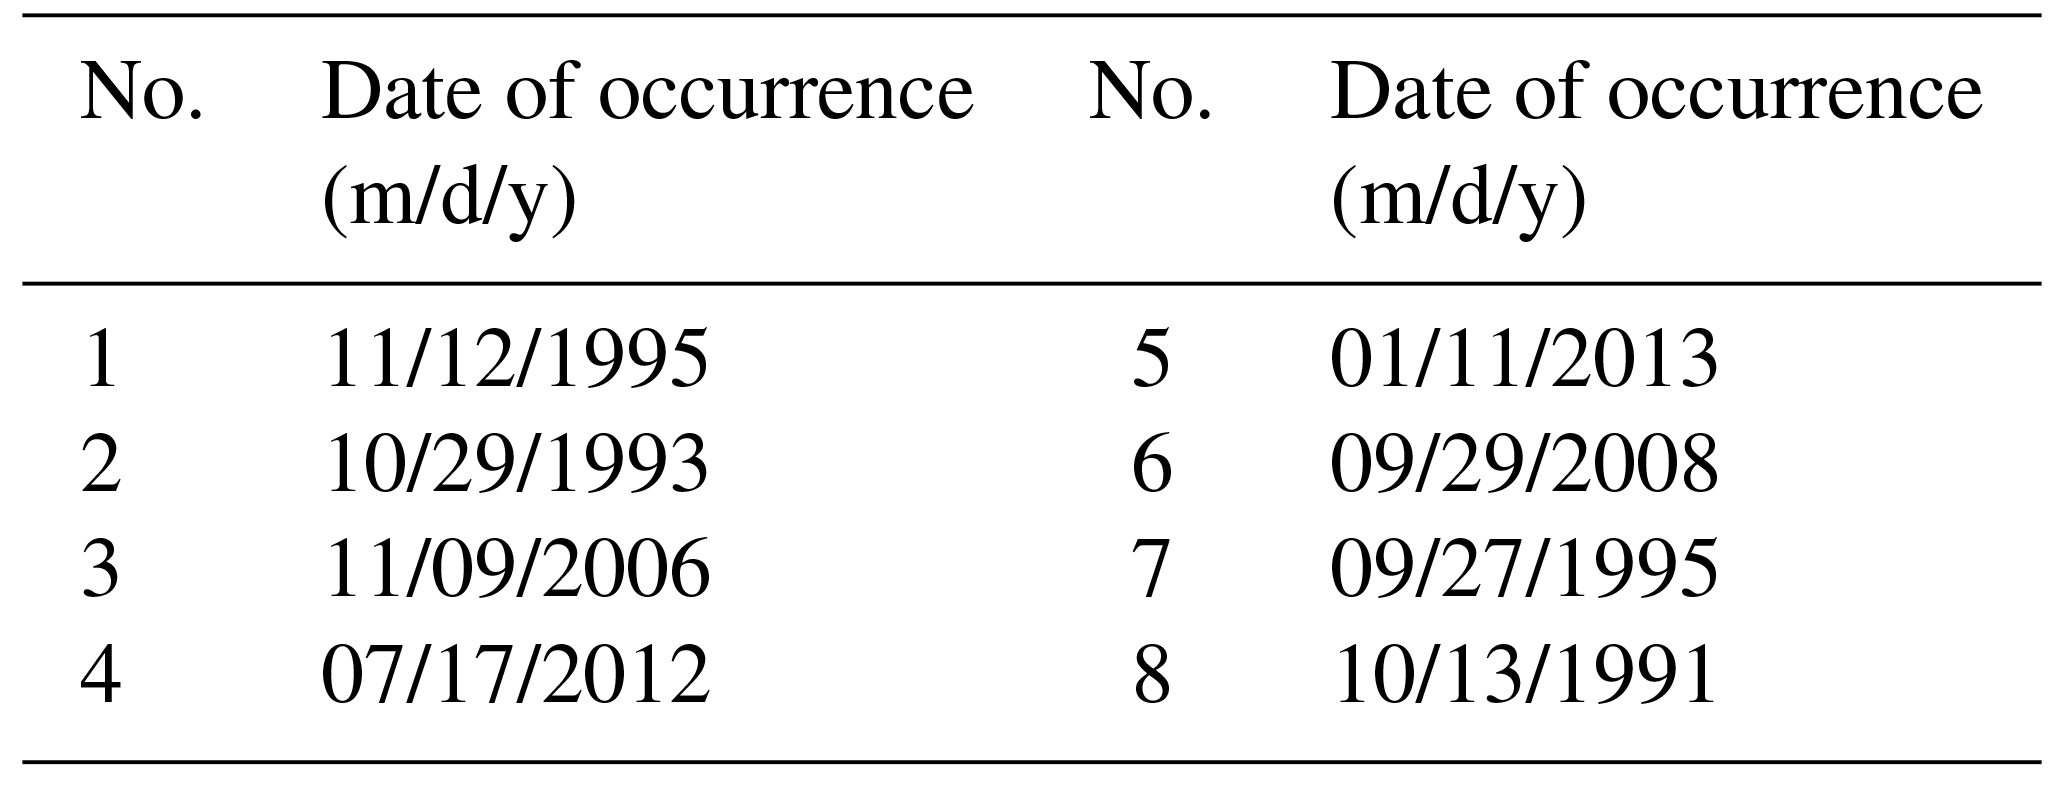
Table 4The moisture and wind maximization at 1000 mb for selected storms detected at the Gorgan station.
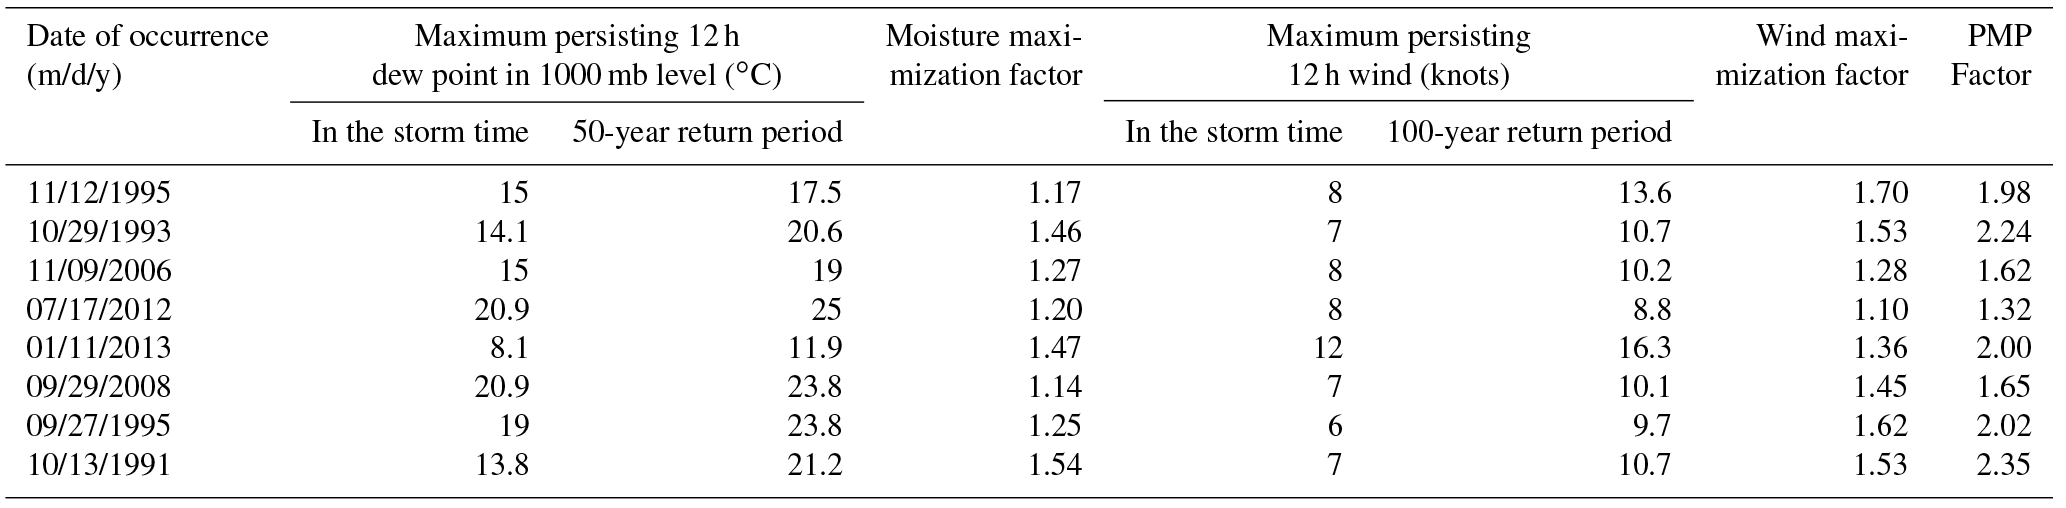
Table 5The PMP values estimated using the physical approach for selected storms in the study area.
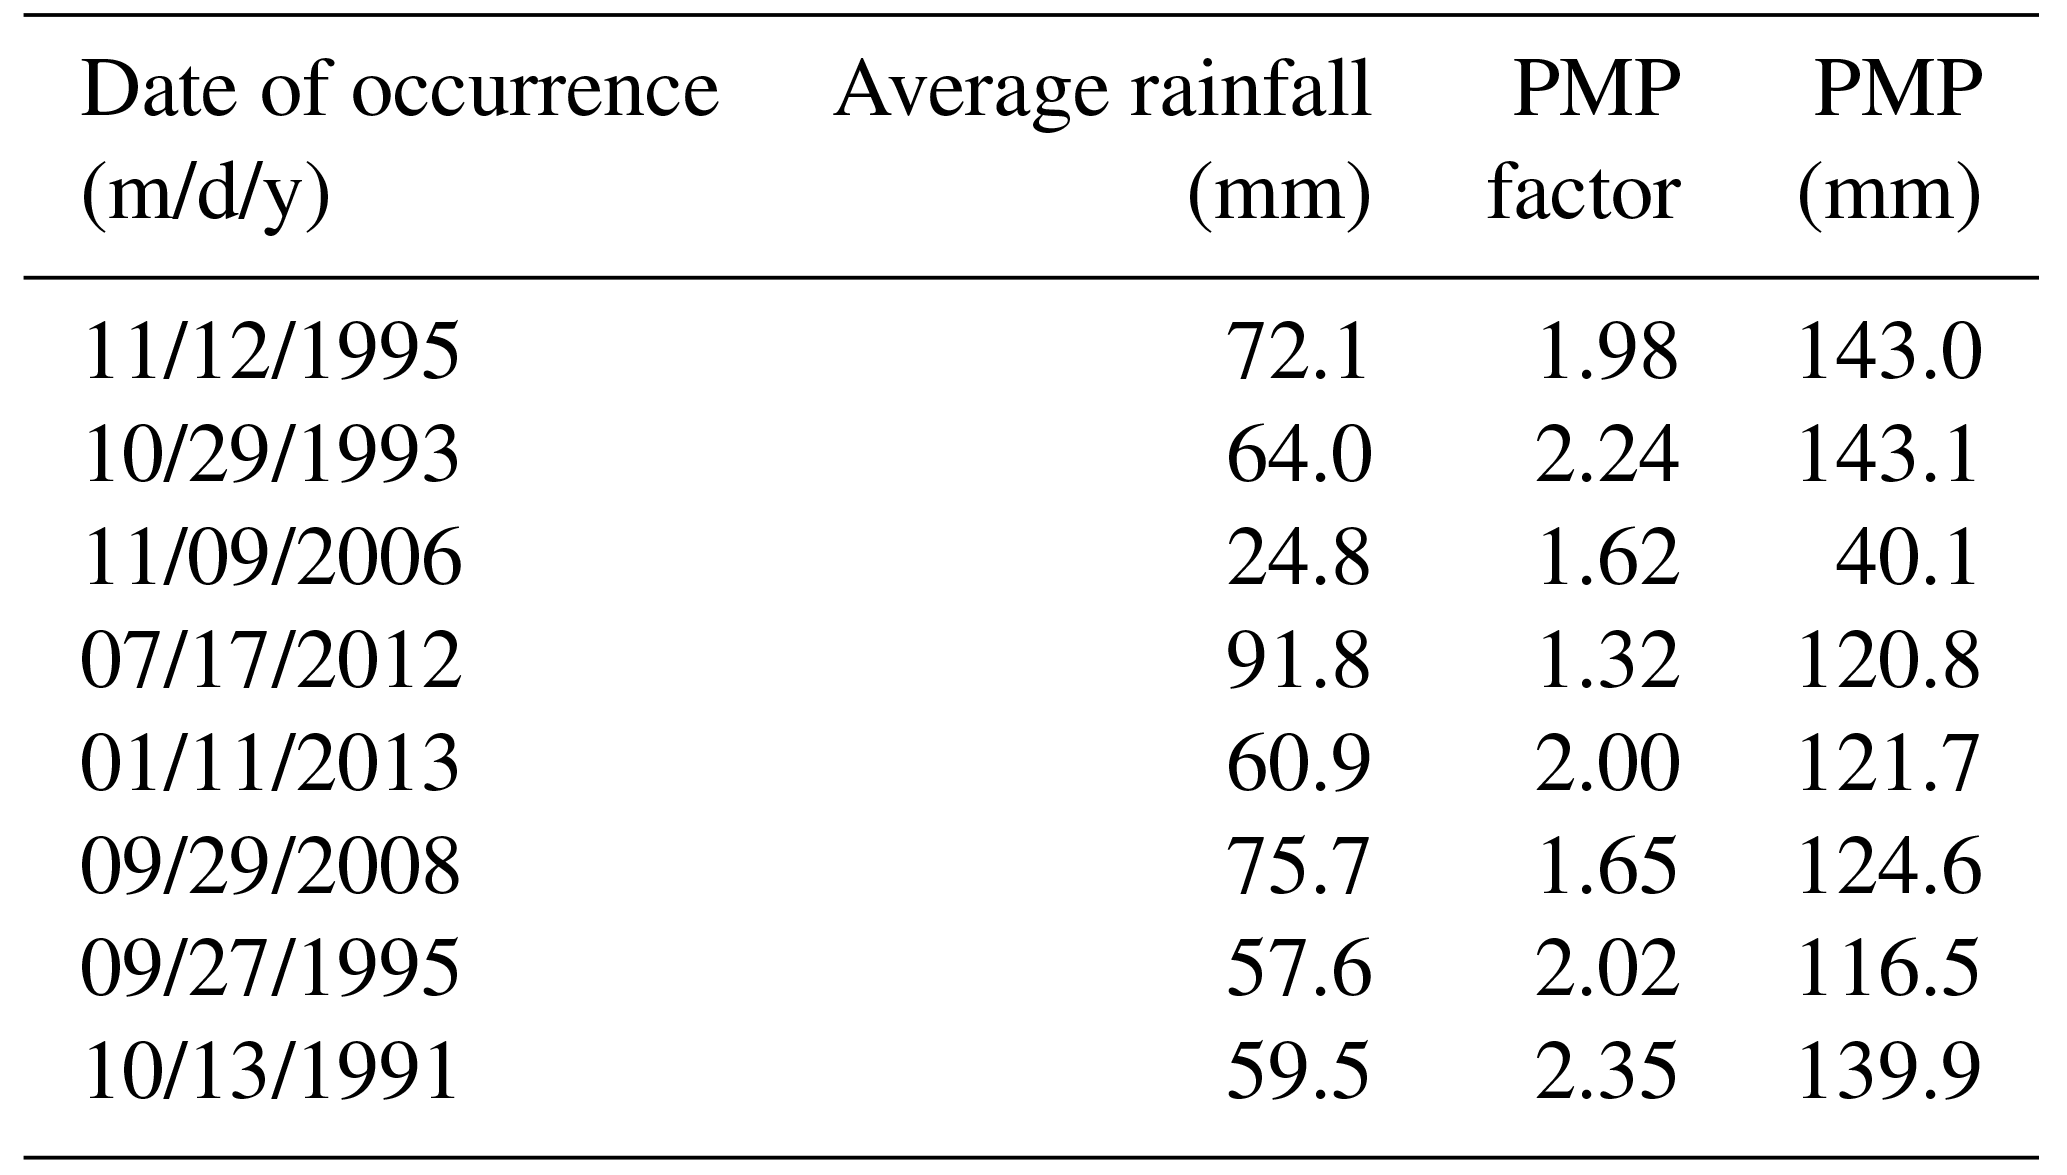
In order to estimate the moisture maximization factor, Wm was calculated with a 50-year return period. Also, to calculate the wind speed maximization factor, based on Eq. (4), MW1 was determined with a 100-year return period. Then wind and moisture maximization factors were estimated and the amount of PMP was calculated using the multiplication PMP factor on average rainfall in a cumulative area. Based on Table 5, the maximum PMP value is related to the storm that occurred on 29 October 1993 and the minimum PMP value is related to the storm that occurred on 9 November 2006.
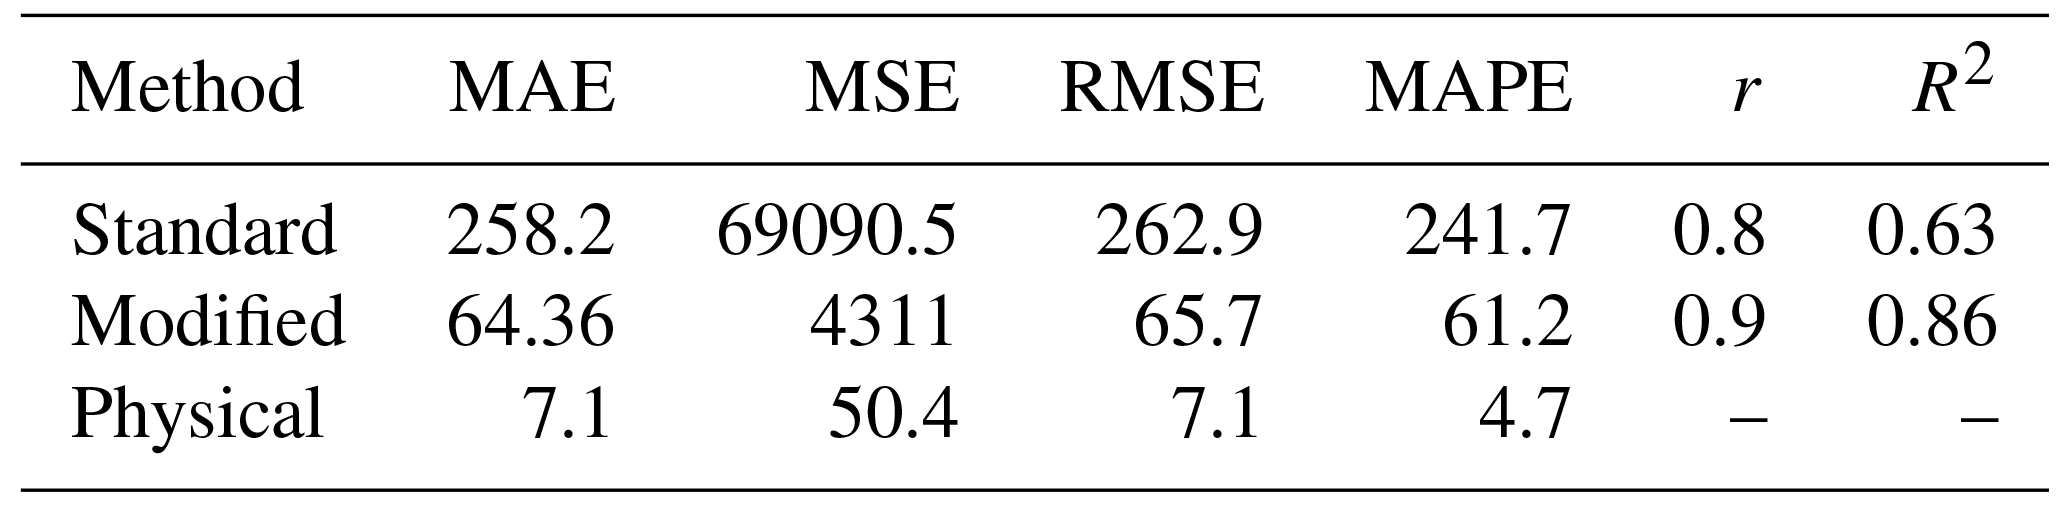
After the calculation of PMP using both approaches, the aim is the determination of the best approach to estimate PMP. Hence, based on performance criteria, the physical approach could perform better than the statistical approach. Furthermore, between the two Hershfield statistical methods, the accuracy of the modified method was better than the standard method using modified Km values (Table 6).
Table 6Statistical comparison between (P24)max and average estimated PMP24 values.
The physical approach is suitable and more reliable than the statistical approach for the consideration of the physical characteristics of air mass, and the application of meteorological data, such as the dew point, which is an indicator of the incoming air into the storm, led to more accurate estimates. The calculation of PMP using the physical approach is difficult because this method needs more meteorological data and the meteorological maps in a different level of the atmosphere must be investigated, which is time-consuming. Also, calculating PMP using the physical approach requires close cooperation between hydrologists and meteorologists. Although the application of the physical approach is preferred, use of the Hershfield modified method is recommended for quick and accurate PMP estimates when dew point temperature data were unavailable.
In the theory definition, PMP is the extreme rainfall for a given duration that is physically possible over an area. In practice, these estimates are based on the steps that hydro-meteorologists use to maximize observed large storms to achieve the PMP value. Therefore, there is a probability that the operational estimates of PMP may be exceeded. It is necessary to mention that the return period is the inverse of this probability which can be computed by choosing an adequate theoretical and empirical distribution such as the generalized extreme value (GEV) theory. Furthermore, there are physical and statistical approaches for the calculation of PMP.
There are physical and statistical approaches for the calculation of PMP. In this study, statistical (the Hershfield standard and modified methods) and physical (convergence model) approaches are used to calculate the 24 h PMP over the study area. In order to calculate PMP using the Hershfield method, an application, which is called the PMP Calculator, is designed. This application calculates PMP with 5 min and 1, 6, and 24 h durations for the Hershfield standard and modified methods. Also, for the calculation of PMP using the physical approach, after selection of the most severe and widespread storms and drawing DAD curves, moisture and wind factors are estimated. Finally, PMP for each storm is calculated. The results indicated that the maximum point PMP24 values were 448 and 201 mm for the Hershfield standard and modified methods, respectively, while the PMP24 value using the physical approach was 143 mm. The results of the modified method come closest to physical PMP. Due to the consideration of the physical characteristics of air mass, the result of the physical approach was reasonable and in compliance with real rainfall over the study area.
It should be noted that all of these approaches have uncertainty in the estimation of PMP. In the statistical approach, significant uncertainty can occur from the use of the enveloping curve of the frequency factor, and uncertainty can occur in the sample mean and standard deviation. Therefore, Hershfield's frequency factor in the standard method led to overestimation of PMP (448 mm). In order to reduce uncertainty in the PMP estimates, the modified method was used and led to a decrease in the PMP estimates (201 mm). These values indicated that PMP values obtained from the modified method and physical approach are closer to the (P24)max. Because the ratio of the point PMP24 to the (P24)max in the standard method was high at the study stations, this method is not recommended in this basin.
Due to consideration of the physical characteristics of air mass in the hydro-meteorological approach, it is suggested that this approach is used and uncertainty is disregarded. If the results of the standard method are used for designing local structures, the construction costs will be unnecessarily high. By including PMP analysis together with extreme rainfall return periods, optimum decisions can be made easier. Such studies are crucial for basins with a high population and which are exposed to various kinds of water-related natural disasters.
The raw data required in this study are available at http://irimo.ir/eng/wd/720-Products-Services.html (Islamic Republic of Iran Meteorological Organization, 2014).
This study is the result of a Master of Science thesis in the water engineering department of the Shahid Bahonar University of Kerman, under supervision of BB. BB helped in designing the PMP Calculator application and in analysing and interpreting the meteorological weather charts at the surface and in the upper level. ZAG helped in calculating statistical and physical PMP values and in preparing required maps in ArcGIS as well as results and discussion. KQ, as the advisor of the thesis, helped in checking PMP Calculator codes in Java and in eliminating errors. All authors discussed the results and contributed to the final paper. Methodology and data curation were performed by ZAG and BB. ZAG, BB, and KQ contributed to the initial draft preparation and revised and edited the manuscript.
The authors declare that they have no conflict of interest.
The authors wish to express their sincere thanks to Farzad Mahdikhani for
invaluable support during the designing of the PMP Calculator
application.
Edited by: Piero
Lionello
Reviewed by: two anonymous referees
Alias, N. E. and Takara, K.: Estimating the probable maximum precipitation of Kuala Lumpur, Malaysia and Yodo river basin, Japan using statistical method, J. Disaster Res., 8, 197–198, 2013.
Alias, N. E., Luo, P., and Takara, K.: Probable maximum precipitation using statistical method for the Yodo river basin, J. Japan Soc. Civil Eng., 69, 157–162, 2013.
Islamic Republic of Iran Meteorological Organization: Meteorological data from synoptic station during years 1981–2013, available at: http://irimo.ir/eng/wd/720-Products-Services.html (last access: 25 June 2014.
Beauchamp, J., Leconte, R., Trudel, M., and Brissette, F.: Estimation of the summer-fall PMP and PMF of a northern watershed under a changed climate, Water Resour. Res., 49, 3852–3862, 2013.
Boota, M. W., Nabi, G., Abbas, T., Hussain, F., and Yaseen, M.: an appraisal of statistically approaches for estimation of probable maximum preciptation in highland climatic zone of Pakistan, Sci. Int. (Lahore), 27, 1993–1998, 2015.
Casas, M. C., Rodriguez, R., Prohom, M., Gazquez, A., and Redano, A.: Estimation of probable maximum precipitation in Barcelona (Spain), Int. J. Climatol., 31, 1322–1327, 2011.
Chavan, S. R. and Srinivas, V. V.: Probable maximum precipitation estimation for catchments in Mahanadi river basin. International conference on water resources, coastal and ocean engineering, Aquat. Pr., 4, 892–899, 2015.
Chow, V. T.: A general formula for hydrologic frequency analysis, EOS T. Am. Geophys. Un., 32, 231–237, 1951.
Collier, C. G. and Hardaker, P. J.: Estimating probable maximum precipitation using a storm model approach, J. Hydrol., 183, 227–336, 1996.
Desa, M. N. and Rakhecha, P. R.: Probable maximum precipitation for 24-h duration over an Equatorial Region, Part 2 – Johor, Malaysia, J. Atmos. Res., 84, 84–90, 2007.
Desa, M. N., Noriah, A. B., and Rakhecha, P. R.: Probable maximum precipitation for 24-h duration over Southeast Asian monsoon region- Selangor, Malaysia, J. Atmos. Res., 58, 41–54, 2001.
Deshpande, N. R., Kulkarni, B.D., Verma, A. K., and Mandal, B.N.: Extreme rainfall analysis and estimation of probable maximum precipitation (PMP) by statistical methods over the Indus river basin in India, J. Spat. Hydrol., 8, 22–36, 2008.
Douglas, E. M. and Barros, A. P. B.: Probable maximum precipitation estimation using multifractals: application in the Eastern United States, J. Hydrometeorol., 4, 1012–1024, https://doi.org/10.1175/1525-7541(2003)004<1012:PMPEUM>2.0.CO;2, 2003.
Fattahi, E., Noorian, A. M., and Noohi, K.: Comparison of physical and statistical methods for estimating probable maximum precipitation in south-western basins of Iran, DESERT, 15, 127–132, 2010.
Fernando, W. C. D. K. and Wickramasuriya, S. S.: The hydro-meteorological estimation of probable maximum precipitation under varying scenarios in Sri Lanka, Int. J. Climatol., 31, 668–676, 2011.
Ghahraman, B.: The estimation of one day duration probable maximum precipitation over Atrak watershed in Iran, Iranian J. Sci. Technol., 32, 175–179, 2008.
Hershfield, D. M.: Estimating the probable maximum precipitation, ASCE J. Hydraul. Div., 87, 99–106, 1961.
Hershfield, D. M.: Method for estimating probable maximum precipitation, J. Am. Water Works Ass., 57, 965–972, 1965.
Joos, B., Darakhani, J., Mouvet, L., and Mehinrad, A.: An integrated probabilistic approach for determining the effects of extreme hydrological events on a flood evacuation system, 73rd annual meeting of ICOLD, Tehran, Iran, 2005.
Lan, P., Lin, B., Zhang, Y., and Chen, H.: Probable Maximum Precipitation Estimation Using the Revised Km – Value Method in Hong Kong, J. Hydrol. Eng., 22, 05017008, https://doi.org/10.1061/(ASCE)HE.1943-5584.0001517, 2017.
Micovic, Z., Schaefer, M. G., and Taylor, G. H.: Uncertainty analysis for probable maximum precipitation estimates, J. Hydrol., 521, 360–373, 2015.
Naseri Moghaddam, M., Ghazanfari, S., Ghahraman, B., and Davari, K.: Probable maximum precipitation for 24-hour duration over four central provinces in Iran, World Environmental and Water Resources Congress, 1–6, 2009.
Nobilis, F., Haiden, T., and Kerschbaum, M.: Statistical Considerations Concerning Probable Maximum Precipitation (PMP) in the Alpine Country of Austria, Theor. Appl. Climatol., 44, 89–94, 1991.
Papalexiou, S. M. and Koutsoyiannis, D.: A probabilistic approach to the concept of Probable Maximum Precipitation, Adv. Geosci., 7, 51–54, https://doi.org/10.5194/adgeo-7-51-2006, 2006.
Rakhecha, P. R. and Singh, V. P.: Applied Hydrometeorology, Springer, 384 pp., 2009.
Rakhecha, P. R., Mandal, B. N., Kulkarni, A. K., and Deshpande, N. R.: Estimation of Probable Maximum Precipitation for Catchments in Eastern India by a Generalized Method, Theor. Appl. Climatol., 51, 67–74, 1995.
Rakhecha, P. R., Deshpande, N. R., and Soman, M. K.: Probable maximum precipitation for a 2-day duration over the Indian Peninsula, Theor. Appl. Climatol., 45, 277–283, 1992.
Rezacova, D., Pesice, P., and Sokol, Z.: An estimation of probable maximum precipitation for river basins in Czech Republic, J. Atmos. Res., 77, 407–421, 2005.
Rouhani, H. and Leconte, R.: A novel method to estimate the maximization ratio of the Probable Maximum Precipitation (PMP) using regional climate model output, Water Resour. Res., 52, 7347–7365, 2016.
Shirdeli, A.: Probable maximum precipitation 24 hours estimation, A case study of Zanjan province of Iran, Manag. Sci. Lett., 2, 2237–2242, 2012.
Singh, A., Singh, B. P., and Ar, B.: Risk analysis of probable maximum precipitation estimates, Int. J. Hydrol., 2, 411–422, 2018.
Soltani, M., Khoshakhlagh, F., Zawar-Reza, P., Miller, S. T. K., Molanejad, M., and Ranjbar Saadat Abadi, A.: Probable maximum precipitation estimation using statistical and physical methods over Esfahan province of Iran, Res. J. For. Environ. Protection, 1, 38–55, 2014.
Vivekanandan, N.: Estimation of Probable Maximum Precipitation Using Statistical Methods, World Journal of Research and Review (WJRR), 1, 13–16, 2015.
World Meteorological Organization (WMO): Manual for Estimation of Probable Maximum Precipitation, Operational Hydrology Report 1, 2nd edition, Publication 332, World Meteorological Organization, Geneva, 1986.
World Meteorological Organization (WMO): Manual on Estimation of Probable Maximum Precipitation, 3rd edition, publication 1045, Geneva, 2009.