the Creative Commons Attribution 4.0 License.
the Creative Commons Attribution 4.0 License.
 | 06 Dec 2018
Dependency of tropical cyclone risk on track in South Korea
Chaehyeon C. Nam
Chang-Hoi Ho
Deliang Chen
Several previous studies on tropical cyclone (TC) risk assessment have attempted to quantify the relationship between TC damage and its elements (i.e. exposure, vulnerability, and hazard). For hazard parameters, TC intensity (e.g. central minimum pressure, maximum wind speed) and size information (e.g. 30 knot radius of the TC) have been widely utilized. Our risk analysis of 85 TCs that made landfall in South Korea from 1979 to 2010, however, suggests that a small deviation of the TC track in the west–east direction (≤250 km, smaller than the average radius of TC) has a more dominant effect on the extent and distribution of TC damage than TC intensity or size. This significant track dependency of TC damage exists because the TC track is responsible for the realization of hazard change from potential to active. More specifically, although two TCs may have the same intensity and size, locally experienced rainfall and wind speed can vary according to their tracks due to topography. These results suggest that track information should be considered more carefully in assessments of future TC risk.
- Article
(7305 KB) -
Supplement
(231 KB) - BibTeX
- EndNote


Tropical cyclones (TCs) are among the biggest concerns for disaster management. As a single natural hazard worldwide, TCs are the costliest natural disaster (http://emdat.be, last access: 26 November 2015). Many researchers have tried to understand and predict TC activity and the associated risk. In TC risk studies, the risk triangle concept, which describes risk as comprising of three major elements (i.e. hazard, exposure, and vulnerability), is widely adopted (Mendelsohn et al., 2012; Peduzzi et al., 2012). In many empirical statistical models for TC risk, risk is estimated quantitatively using actual damage as a response variable (Pielke Jr. et al., 2008; Park et al., 2015). The three risk elements are then used as explanatory variables in these studies. Exposure and vulnerability are usually expressed by the number of residents and regional gross domestic product (GDP) in the area of interest, respectively (Pielke et al., 2008). Hazard is typically represented by TC intensity parameters, such as central pressure and maximum wind speed (Nordhaus, 2010; Hsiang and Narita, 2012). Several recent studies have also suggested TC size as a hazard parameter (Czajkowski and Done, 2014; Zhai and Jiang, 2014).
Using TC intensity or size as hazard parameters, however, is insufficient for estimating TC damage. Even when a TC has the same intensity and size, damage can drastically change depending on its track, which causes the TC to experience different topography. Typhoon Rusa (2002) and Typhoon Haiyan (2013) are good examples. The record-breaking rainfall in Gangneung, South Korea, was caused by Typhoon Rusa (2002) because the track of Typhoon Rusa (2002) was optimal for the orographic lifting effect, and so heavy precipitation occurred over the city (Park and Lee, 2007). The deadliest damage by typhoon Haiyan (2013) in the Philippines primarily came about because the TC penetrated Tacloban, which is located in a low-lying area near the ocean, such that most of the damage arose from storm surge (Ching et al., 2015). In both cases, if the TCs went through a different area, avoiding the mountains and lowland, the result could have been much less devastating.
This study focused on the role of the track in the TC risk determination process. We tried to directly compare the priority among the risk elements by using various statistical analyses of the historical TC records and damage data from South Korea and explicitly show the significance of track dependency in TC risk. Moreover, we explained the role of the track within the TC risk triangle framework and how TCs with similar intensity and size but slightly different track patterns could bring dramatically different risk patterns. The rest of the paper is organized as follows. Section 2 lists the datasets for TC intensity and size, local wind and rain hazard, damage, and social index used in this study and explains how these datasets were processed and statistically analysed. Results from the risk comparison and decision tree analysis are described in Sect. 3, and a summary of the major findings of this study is given in Sect. 4. Finally, in Sect. 5, we address several implications for future risk research and predictions based on our findings.
2.1 Data source and processing
The present study utilized several datasets: (1) weather station data, (2) TC track, intensity, and size data, (3) national survey data of TC damage, and (4) national survey data of regional wealth. This section will describe how different datasets were obtained and processed before the statistical risk analysis.
First, from 60 weather stations throughout South Korea (see Fig. 4 for station locations), daily maximum near-surface wind speed and daily accumulated precipitation values were gathered (Korea Meteorological Administration, 2015).
Second, TC information including track, intensity, and size was obtained from the Regional Specialized Meteorological Center (RSMC) best-track data (RSMC Tokyo, 2015). For intensity, we used the maximum wind speed and central pressure data. For TC size, we used the largest radius of 30 knot winds, which is specifically provided by RSMC. RSMC best-track data in the 6 h interval were interpolated to a 1 h interval to obtain precise hazard values at landfall (Park et al., 2011). The interpolated RSMC best-track data were used to select the TCs that made landfall on South Korea (TCs entering the area within 3∘ of the coastline of Korea). Then, we verified these TCs with the official influential TC record in the Typhoon White Book issued by the National Typhoon Center (NTC, 2011), as in our previous study (refer to Park et al., 2016, for more details on NTC Typhoon White Book). We chose only the TCs that had maximum wind speeds greater than or equal to 17 m s−1 (above or equal to tropical storm (TS) class) at the time of entering the 3∘ line. As a result, 85 TCs were determined to be influential in South Korea from 1979 to 2010 (see Supplement Table S3 for the list of the names and years of all the target TCs).
Third, we used damage data from the National Disaster Information Center (NDIC) of the Korean government (NDIC, 2015) after following procedures. NDIC property loss data consist of data on monetary damages to industrial, public, and private facilities, standardized to the value of money in 2005 by accounting for inflation. The loss data were collected by local governmental offices, and therefore most losses could be reported regardless of whether the victims were insured or uninsured. There may, however, be some cases of minor losses that were not reported to the local offices by the victims. The raw dataset included damage data caused by all types of extreme weather such as TCs, heavy monsoon rainfall, heavy snowfall, or high waves. Some cases were not classified by specific damage sources. Some cases were categorized under high wave damage, although they were also caused by TCs as the high waves were induced by TCs. Therefore, we matched all the raw loss data to the TC data using the NTC White Book (NTC 2011) and RSMC best-track data (RSMC Tokyo, 2015). To be more specific, we compared the three relevant periods: (1) the period of warning issued recorded in the NTC White Book (NTC, 2011), (2) the number of days that the TC stayed within 3∘ of the Korean coastline based on the RSMC dataset (RSMC Tokyo, 2015), and (3) the period of damage occurrence recorded in the NDIC dataset (NDIC, 2015).1 If any day of the NDIC damage period overlapped with the RSMC or Typhoon White Book influence period of a TC, the loss was attributed to the TC. “No damage” and “damage” cases were later categorized based on whether any economic loss records reported by the damage dataset existed for a given province and TC event.
Fourth, province-level aggregated wealth data were obtained from government statistical surveys (Korean Statistical Information Service, 2015). We aggregated the 17 districts of South Korea into 5 provinces because the administrative division had been changed between 1979 and 2010, and the size of the 17 districts varies from city size to province size. The names of the provinces are Gyeong-gi (GG), Chung-cheong (CC), Jolla (JL), Gang-won (GW), and Gyeong-sang (GS) (See Fig. 2 for the distribution of the provinces). These five provinces have independent records of damage for every influential TC case and annual regional wealth. The temporal variation of wealth was considered through the normalization of damage data to the reference year, 2005, with wealth per capita. In general, the wealth of South Korea has consistently increased. However, there are significant differences in the growth rates among provinces, which affect the TC damage records. Through normalization, the potential impact of regional differences in wealth trends was eliminated. The spatial disparity of wealth at a certain time (i.e. 2005) should be addressed when mapping the damage distribution.
2.2 Statistical analysis
2.2.1 Data mining methods
The 85-selected influential TCs were then grouped according to their track patterns using the fuzzy c-means clustering method (FCM). We clustered the track patterns, considering only the parts of the tracks in the domain of 28–40∘ N and 120–138∘ E (grey boxes in Fig. 2) so that we could divide tracks and focus on the paths near South Korea. There may be other ways to categorize track patterns in the area of interest. For example, one can group them using a certain longitude criterion (e.g. east versus west from 128∘ E) or the approaching angle criterion (Hall and Sobel, 2013). Here, we chose to use the FCM, as it is widely adopted for objectively dividing widespread data with amorphous boundaries. Some previous studies have shown this method to be effective for grouping TC track patterns (Kim et al., 2011; Park et al., 2017).
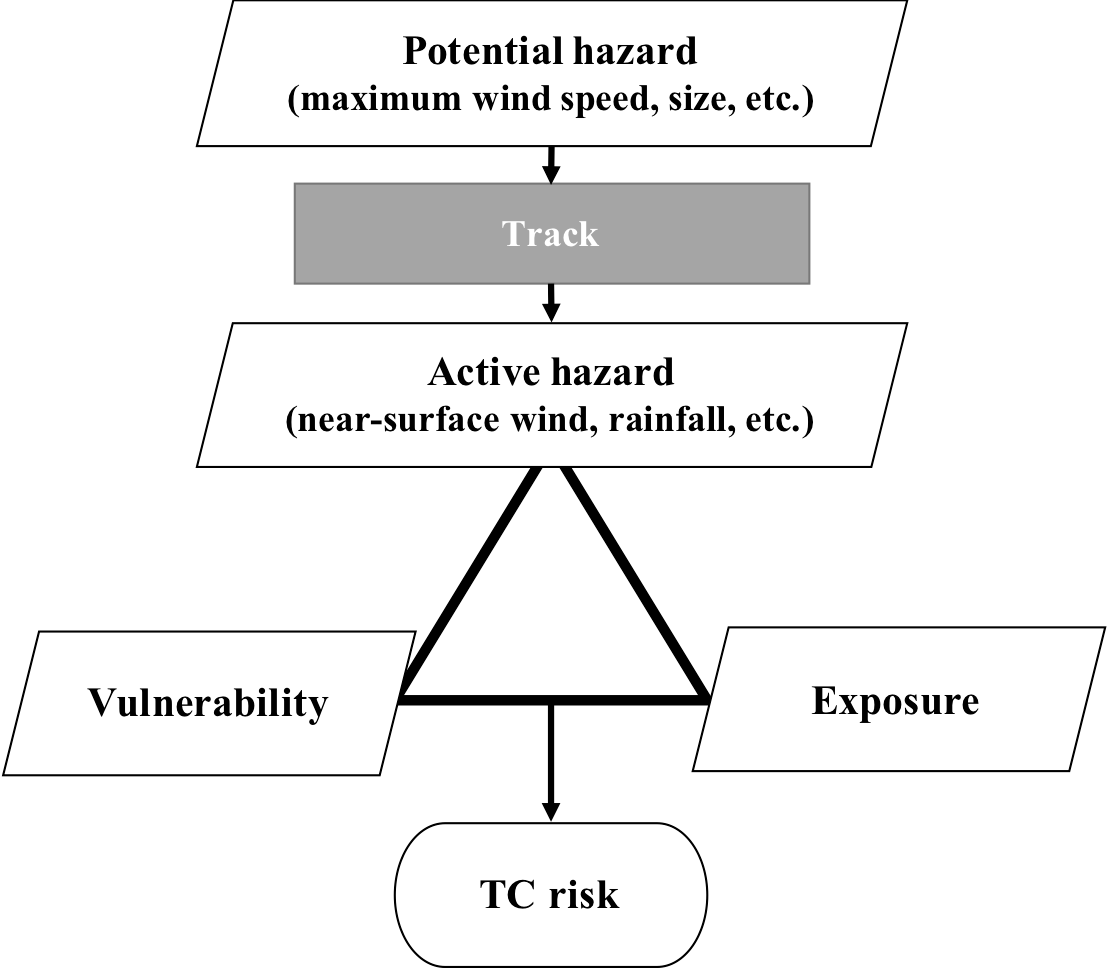
Figure 1Flowchart for local risk materialization process with TC risk elements and their relationships. Potential and active hazards correspond to indirect and direct causes for TC risk in terms of causality science. See the main text for more explanation.

Figure 2Four groups of tropical cyclone tracks that made landfall over South Korea from 1979 to 2010. The box shaded in grey, covering 28–40∘ N and 120–138∘ E, indicates the clustering domain for the fuzzy c-means clustering method. A map of the five aggregated provinces of South Korea is displayed in (c) Gyeong-gi (GG), Chung-cheong (CC), Jolla (JL), Gang-won (GW), and Gyeong-sang (GS). Taebaek and Sobaek mountains are indicated with orange lines.
The TCs were grouped into four types. The optimum cluster numbers were decided using four validity measures: the partition coefficient, partition index, separation index (i.e. Xie and Beni index), and Dunn index. The partition coefficient measures how much overlap the fuzzy clusters have, and is inversely proportional to the average overlap between the clusters. Both of the partition and separation indexes are computed by the compactness and separation of the clusters. However, the partition index represents separation as the sum of the distances between the clusters, while the separation index represents separation as the minimum of them. The Dunn index is calculated by the ratio of the shortest and the longest distances of the two objectives within a same cluster. The larger partition coefficient and smaller partition index, separation index, and Dunn index create better clustering (for a more detailed explanation and formula of validity measures for the optimum cluster number, refer to Appendix B of Kim et al., 2011). All the indexes pointed to 4 being the optimum number in our case. We conducted some sensitivity tests that introduced slight changes to the TC lists, such as different time frames (e.g. 1979–2015) or different clustering domains (e.g. 5∘ area from the Korean Peninsula coastline), and 4 still appeared to be the optimum cluster number from the validity measures.
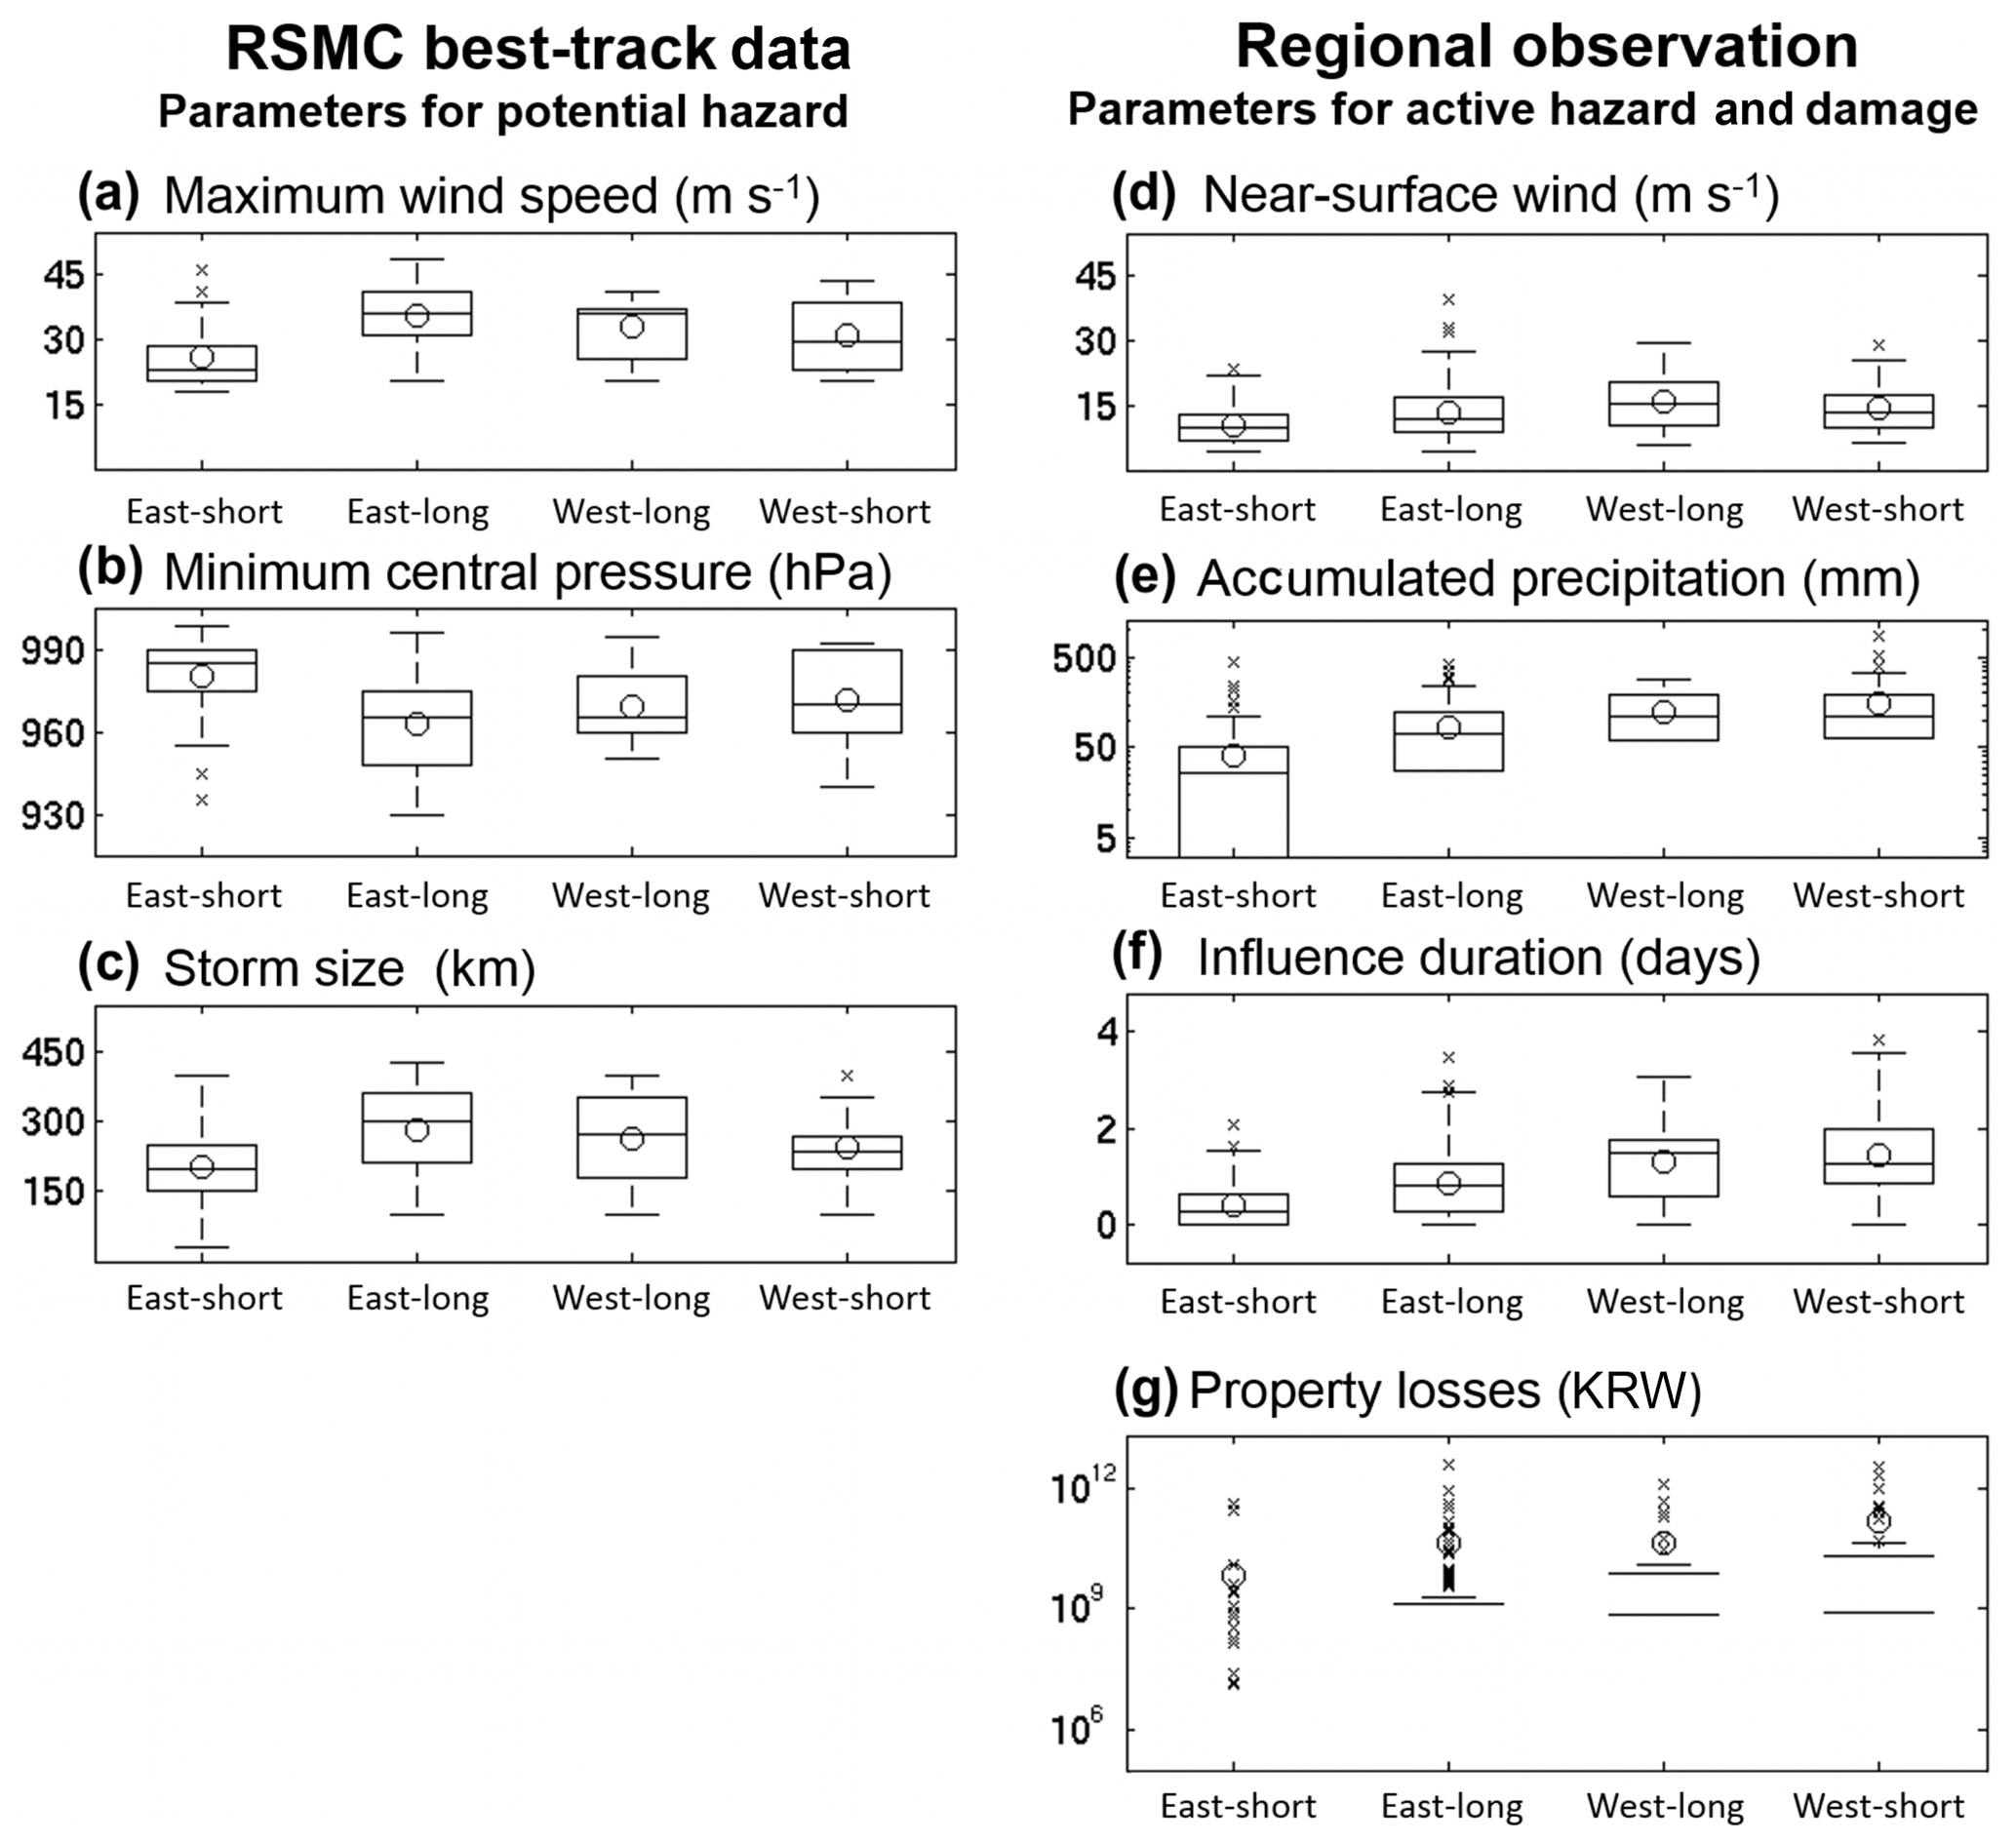
Figure 3Box plots of the hazards and damages of track-pattern groups. (a) Maximum wind speed, (b) central minimum pressure, and (c) storm size from the best-track data at the point that the TCs entered the area within 3∘ of the coast of the Korean Peninsula or ,for the TCs that did not enter the area within 3∘, when they were closest to South Korea. (d) Daily maximum wind speed (10 min average), (e) daily accumulated precipitation, (f) influence duration from 60 weather stations, and (g) property losses (USD 1 ≈ KRW 103) over South Korea. The storm size is the longest radius of 30 knot winds or greater. Station maximum wind speed and precipitation are one maximum daily value of the whole influence duration. The upper (bottom) side of each box is 0.75 (0.25) quantile. The bar inside the box represents the median, and the circle represents the mean. The plotted whiskers extend to the most extreme data point that is not an outlier. Outliers, which are located outside of the maximum whisker length, are drawn as a cross. The maximum whisker length is 1.5 times the value of the third quantile minus the first quantile. Note that the y axes of (e) and (g) are in log scale, so zero cannot be shown in these plots. The zero values not shown in these box plots are as follows: the third quantile (0.75) of east-short in (e), the third quantiles of all four types in (g), and the medians of east types and the first quantile of east-short type in (g).
We further introduced the decision tree analysis to decipher the relationships among risk elements. The decision tree method, a multivariable technique, allowed us to explain, describe, classify, and predict a target as a result of the combined effects of multiple input variables beyond a one-cause and one-effect relationship. Compared to other multivariable techniques, the decision tree method's advantage is that it is easy to use, robust with a variety of data, and most of all, intuitively interpretable. It helps decision analysts structure the decision process in a graphical sequence.
Among several famous decision tree algorithms, this study applied See5/C5.0 as a classification method for TC risk calculation (Rulequest Research, 2015). The See5/C5.0 algorithm is an improved version of C4.5 (Quinlan, 1993) in terms of accuracy, speed, and computer memory consumption. Furthermore, the C4.5 algorithm was advantageous because it could accommodate all the required class, binary, and continuous variable types (see Table S1). See5/C5.0 calculates the information gained at each node, based on the entropy concept, in order to select the most efficient attribute for splitting the training samples into two branches.
Table 1Each Spearman's correlation coefficient of property losses with active and potential hazards. Active hazards are maximum daily wind speed, maximum daily accumulated precipitation, and the sum of influenced periods for all 60 weather stations. The potential hazards are maximum wind speed, central pressure, and storm radius (30 knots) based on the RSMC best-track data for each track group. The significance of the correlations are shown with asterisks.
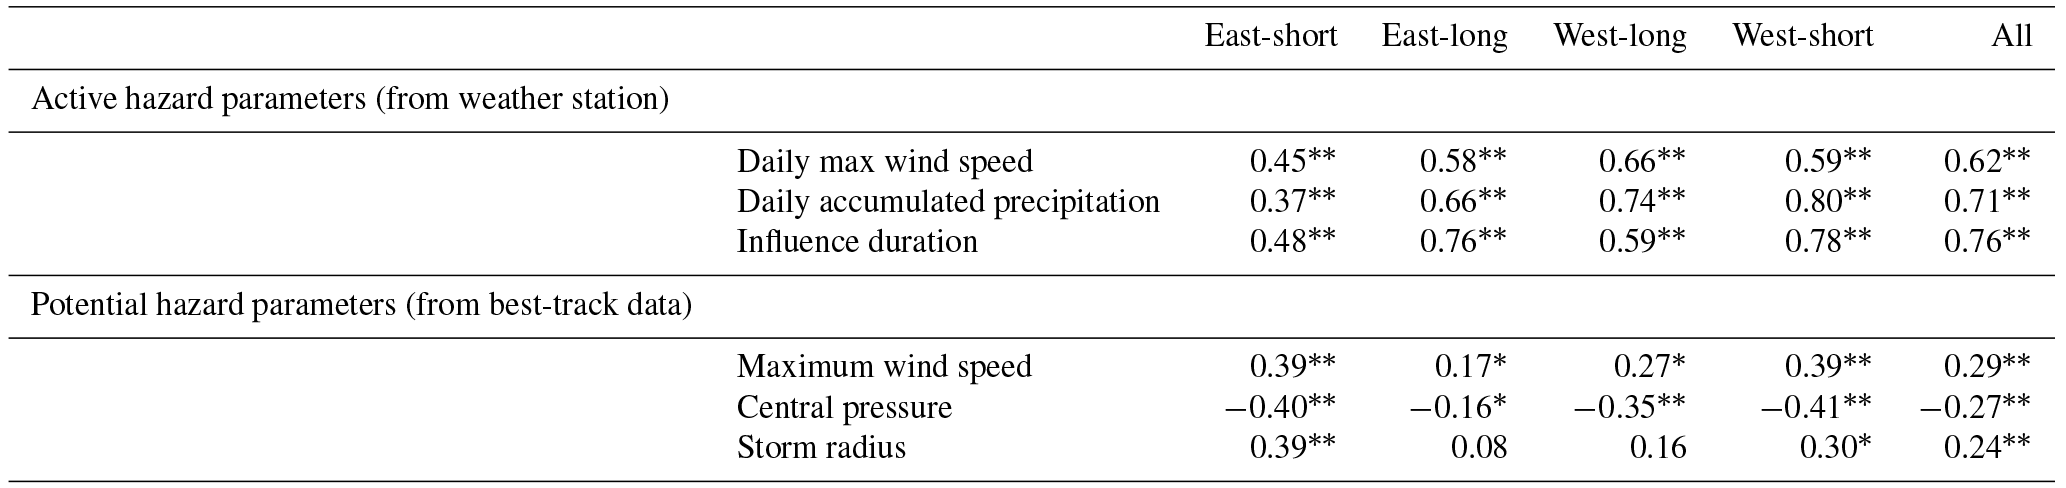
* Significant at the 95%. Significant at the 99 % confidence levels.
To prevent overfitting, we introduced pruning and cross-validation. First, we required that branches have a sample size of at least five. The number 5 was determined through the retrospective pruning process. Second, a 10-fold cross-validation, which divided the training dataset and validation dataset randomly ten times, was conducted. Cross-validation results are provided in Table S4, and they show the decision tree results (e.g. model accuracy, tree size, or attribute usage) are stable and consistent. The best-track data based decision tree has a relatively broad range of distribution in terms of size and accuracy for each training dataset, but the significant track dependency remained through the cross-validation.
2.2.2 Significance tests
For all the statistical analyses of risk comparison among track groups, non-parametric methods were used (Sawilowsky, 1990). Medians were used rather than means, and rank-based procedures were conducted for any significance test. This is because we cannot regard the TC damage as following a normal distribution; rather, damage shows an extreme distribution. Zero losses were recorded for 30 % of TCs, and 30 % of all the accumulated damages were attributed to a single TC, Typhoon Rusa in 2012. The Kruskal–Wallis test, or the one-way analysis of variance (ANOVA) on ranks, was used to determine if there are statistically significant differences for a variable between track groups. Spearman's rank correlation coefficient, which measures the linear relationships between the rankings of two variables, was used instead of the more common Pearson product-moment correlation coefficient, which measures linear relationships between the raw values of two variables.
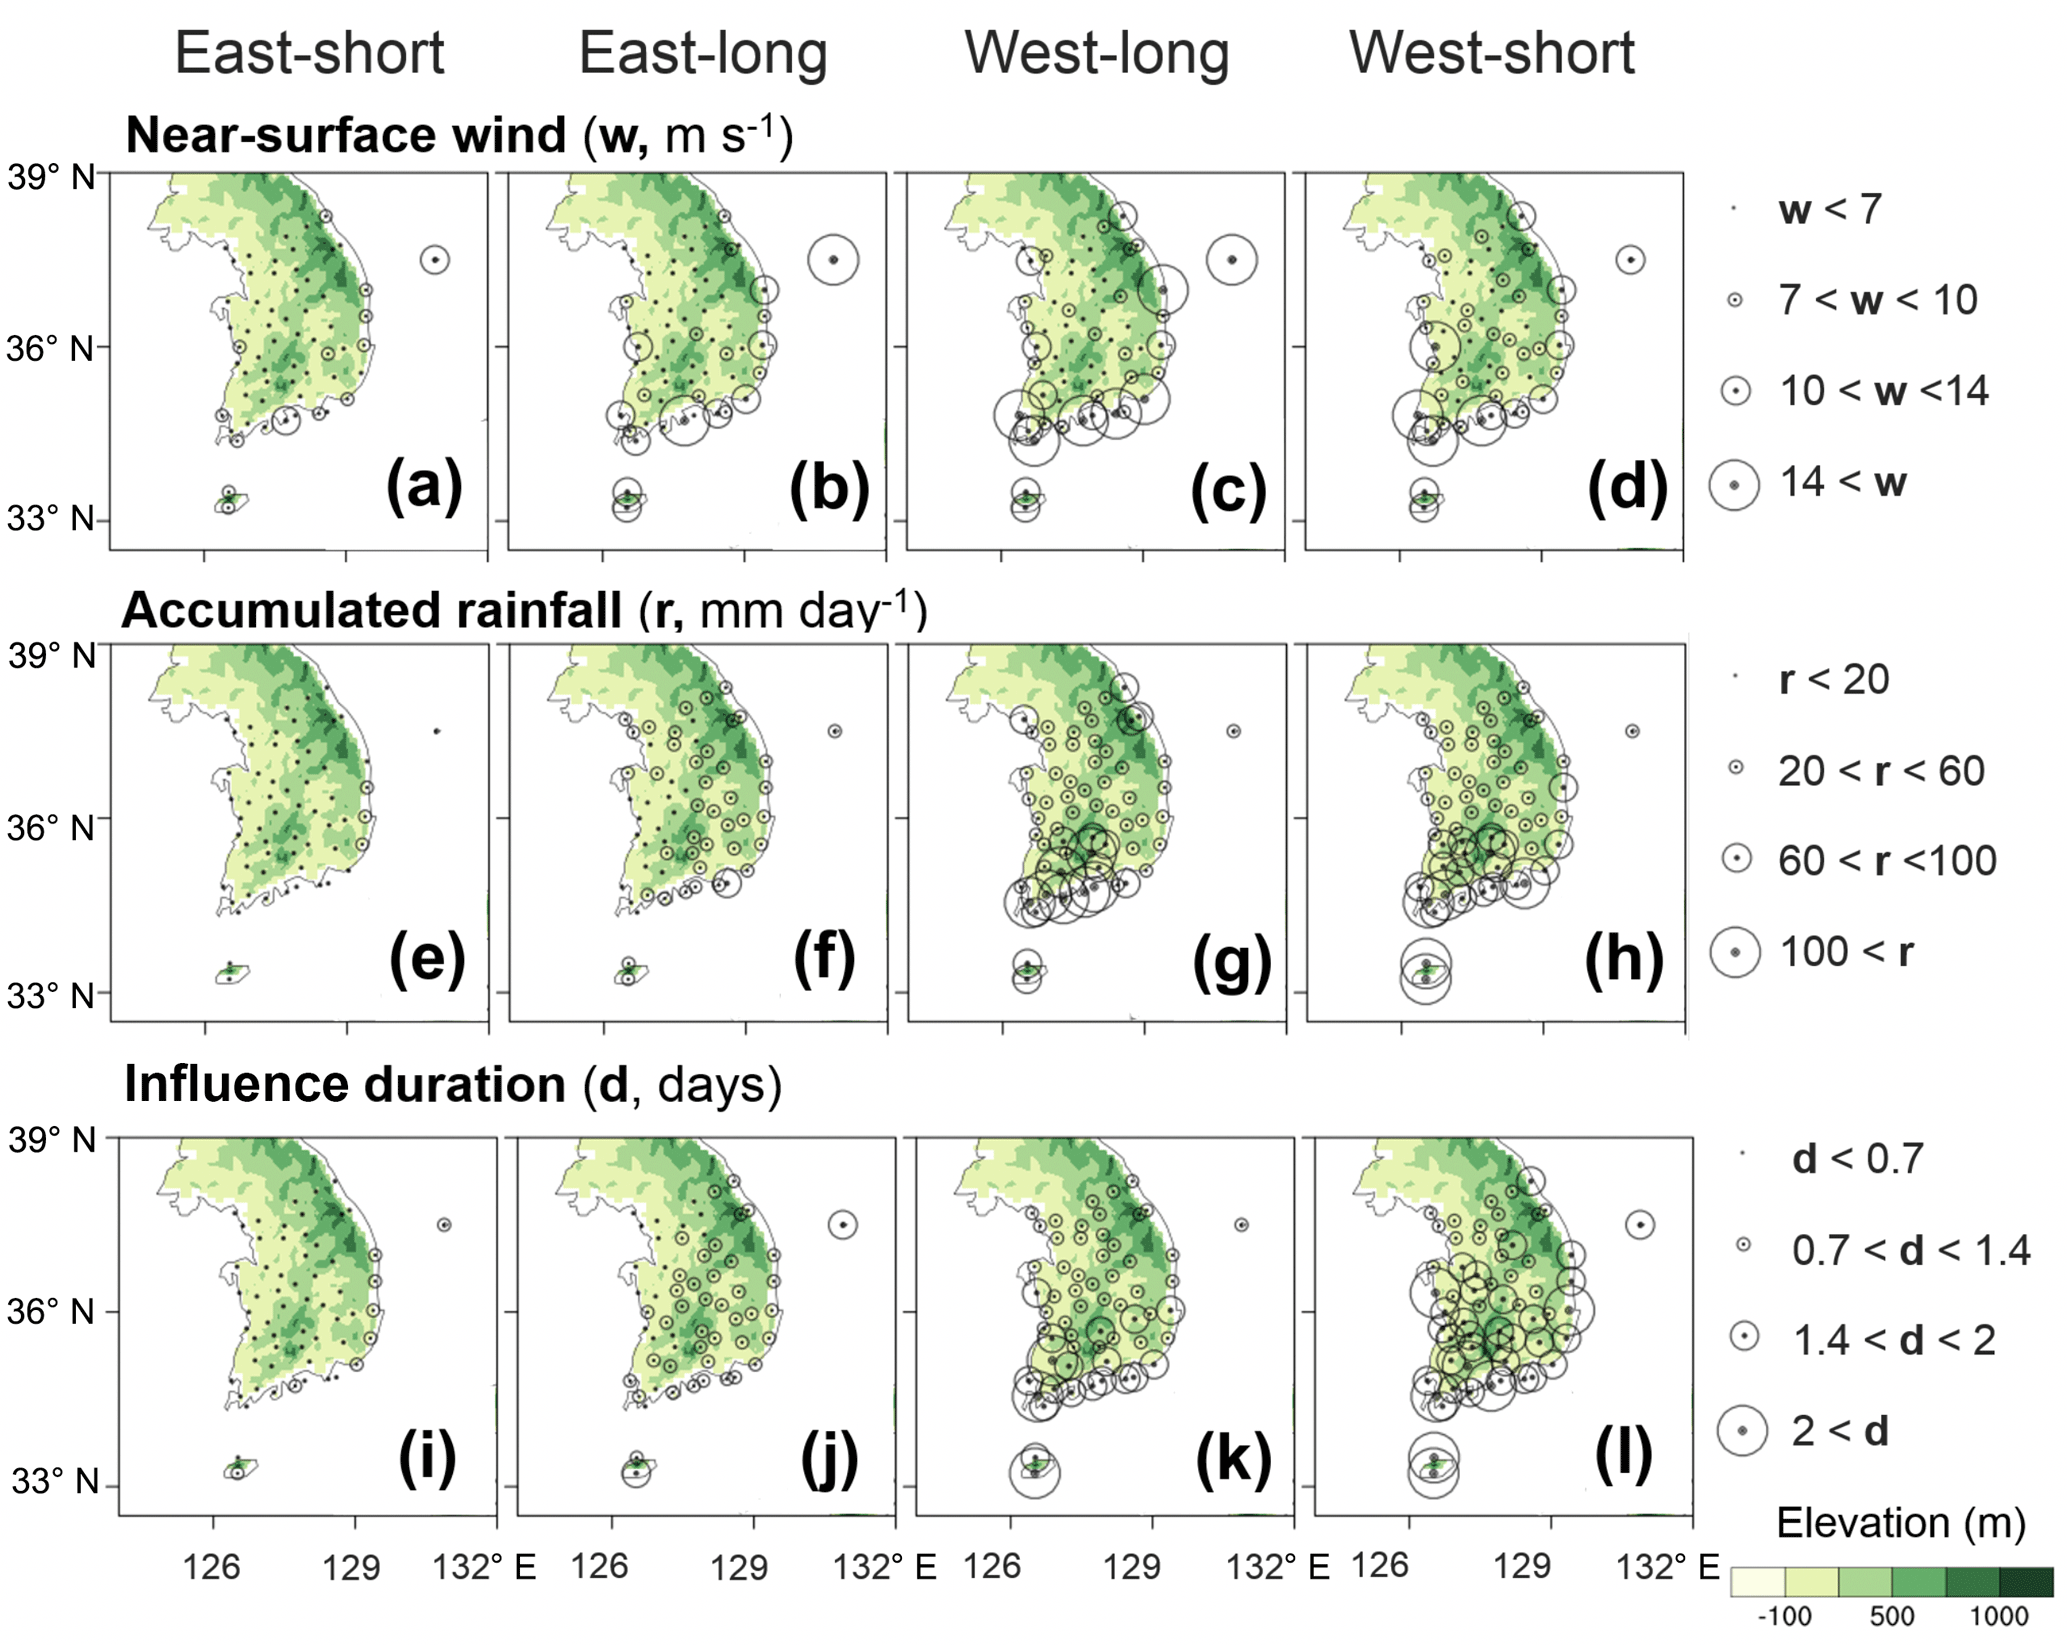
Figure 4Three active hazard parameters – wind, precipitation, and duration – of tropical cyclones for each track type observed at 60 weather stations. Shown here is the mean value recorded at each station. For example, for a certain station, if a TC recorded above-threshold values at the station for 3 days (refer to the main text for the definition of a threshold), the influence duration is 3 for that TC at that station. Then, we get 22 influence duration values for the east-short type, because there are 22 TCs of the east-short type. We take the means of the 22 influence duration values for each station and plot the mean value at the location of the station with four different circle sizes. In addition to duration, for wind and rain, we used daily maximum wind speed (10 min mean) and daily accumulated rainfall. When we have multiple days of influence duration, we have multiple values of daily maximum wind speed and daily accumulated rainfall for each specific TC. We then used the biggest wind or rain value among the multiple values as the representative value of the hazard caused by that TC at that location.
In this paper, we adopted the hazard mode concept (potential versus active hazard) from the risk management field (MacCollum, 2006). For the hazard mode concept, active hazard refers to a situation when “a harmful incident involving the hazard has actually occurred”, whereas potential hazard refers to a situation where “the environment is currently affected but not yet activated at a given place and time”. By this definition, we refer to heavy rainfall and wind gusts induced at the local area by the TC as active hazards, and we consider the TC system's minimum central pressure, maximum wind speed, and size over South Korea as potential hazards. These two modes of TC hazard (potential and active) are utilized throughout this paper.
3.1 TC hazards and risk of different track types
In order to objectively evaluate the effect of each TC track on damage, a total of 85 TCs which influenced South Korea during 1979–2010 were grouped into four track patterns. The four TC track patterns can be characterized as (1) east-short, (2) east-long, (3) west-long, and (4) west-short types based on the position and length of the TC tracks around the Korean Peninsula (Fig. 2). Although the average zonal distance between the mean tracks of east-types (i.e. east-short and east-long) and west-types (i.e. west-short and west-long) was only about 250 km, hazards (both potential and active) and damages caused by the TCs are significantly different depending on the four TC track patterns at the 99 % confidence level based on the Kruskal–Wallis test (Fig. 3). This highlights the importance of the track in TC risk assessment because the 250 km distance is not long considering that the average errors of track forecasting in the western North Pacific are about 200 and 400 km for 24 and 48 h, respectively (Roy and Kovordanyi, 2012). Meanwhile, the high sensitivity of damage on the track shown in Fig. 3 suggests that the current skill of TC track forecasting may not be enough to exactly estimate TC risk distribution over South Korea in advance of 1 day and over.
As shown in Fig. 3, potential hazards display different results from active ones, although both originate from the same TC. Potential hazards are stronger in longer tracks, i.e. east-long and west-long, while active ones are stronger in west-types than east-types (compare Fig. 3a–c to d–f). In addition, even if potential hazard parameters have been widely used in TC risk analysis (Nordhaus, 2010; Hsiang and Narita, 2012; Czajkowski and Done, 2014; Zhai and Jiang, 2014), they show worse accordance with damage than active ones. For all potential hazards, the ranking is in order of east-long, west-long, west-short, and east-short. It is natural for a TC with a longer track to have higher wind speed, deeper central pressure, and larger size, since a TC with a stronger intensity should be more durable compared to a weaker TC under the same environmental conditions, such as friction, vertical wind shear, and sea surface temperature (Kim et al., 2011). In contrast, for active hazards, the ranking is in order of west-types, east-long, and east-short track patterns. This relationship between track and active hazard parameters (i.e. near-surface wind, rainfall, and influence duration) cannot be simply explained unlike potential hazard parameters.
Figure 4 shows the spatial distribution of active hazard parameters with the topography for each track pattern. Focusing on the near-surface winds (Fig. 4a–d), the near-surface winds of west-type tracks were comparable to near-surface winds of east-long track, particularly along the coast, even though potential hazards of west-type tracks are significantly weaker than those of east-long tracks (Fig. 3a–f). This can be attributed to the concept of dangerous and navigable semicircles. In the case of west-type tracks, South Korea falls within a dangerous semicircle (right-hand side of the direction of TC movement) in which the TC translation speed and rotational wind field are additive, and hence, strong wind speed is observed therein. In contrast, in the case of east-type tracks, the country is located under a navigable semicircle (left-hand side of the direction of TC movement), in which the TC translation is counter-directional to the rotational wind. Therefore, weaker wind speeds are found there than that in the dangerous semicircle.
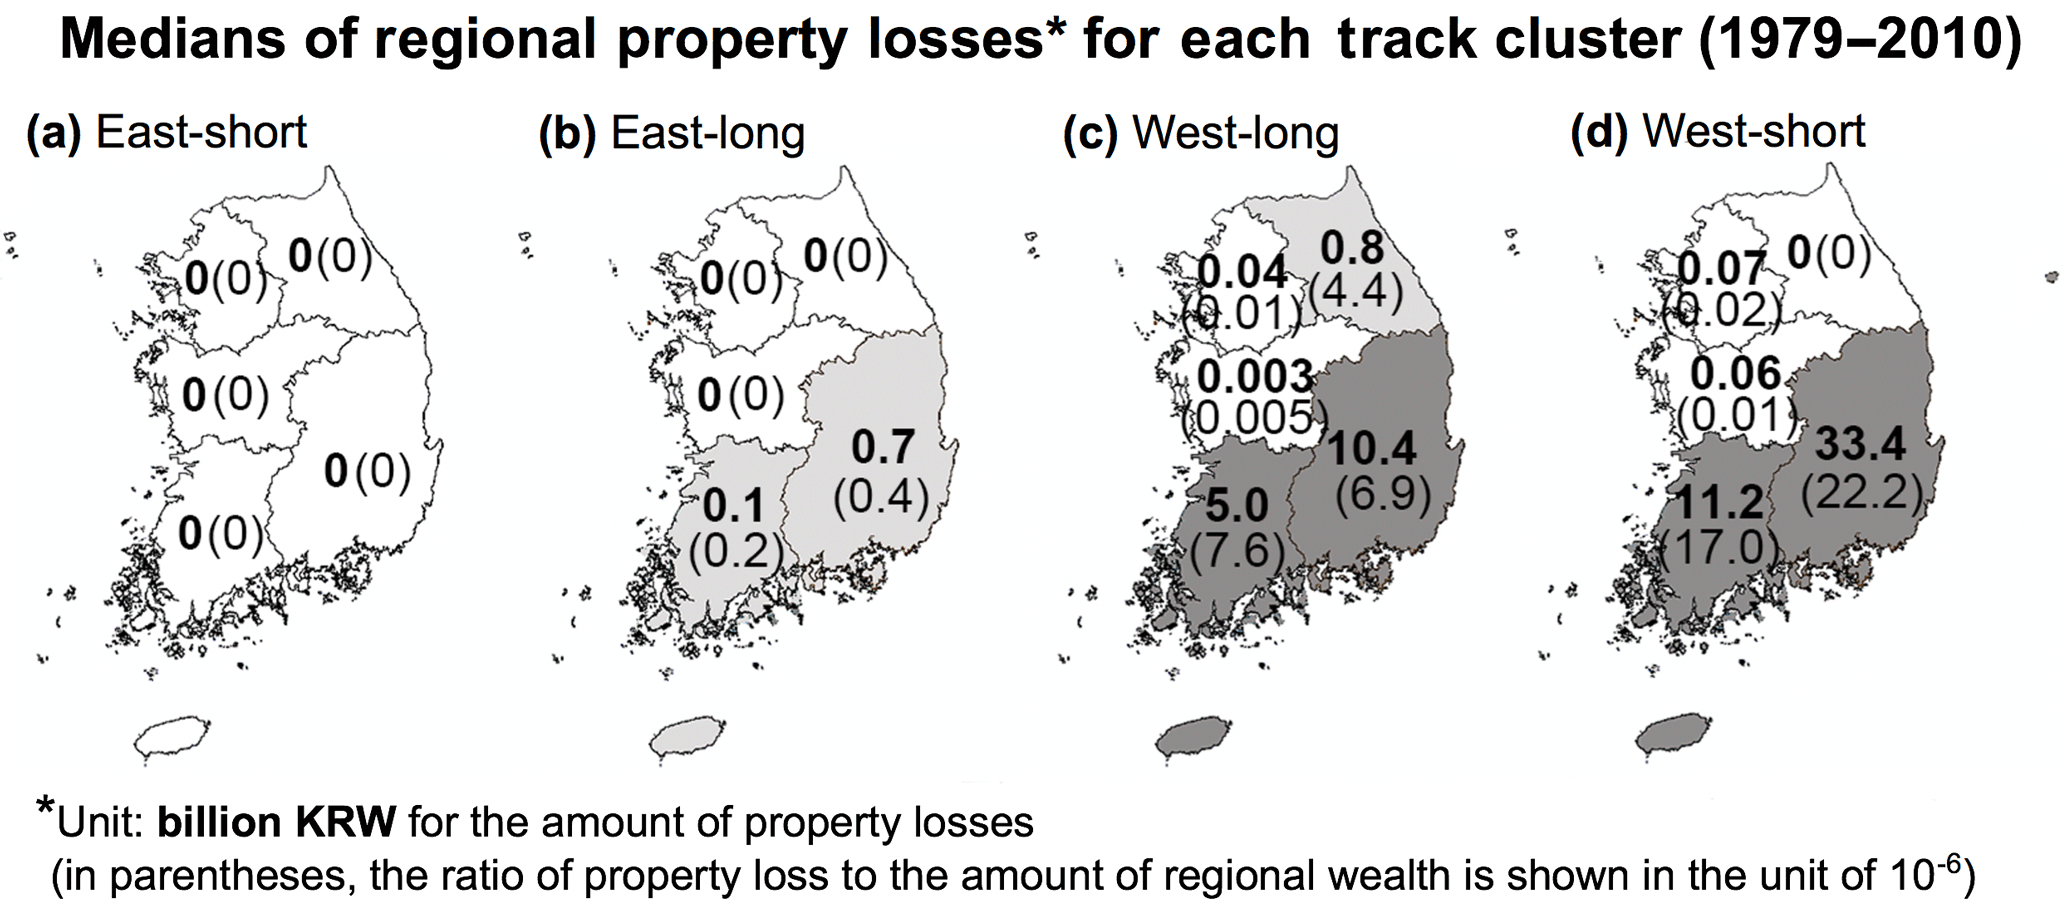
Figure 5Medians of regional economic losses from a tropical cyclone (regional economic losses divided by regional wealth). The dark shading indicates provinces that have median losses larger than KRW 1 billion, and the light shading indicates provinces with median losses larger than KRW 0.1 billion and smaller than KRW 1 billion. More than the half of the east-short TCs are non-damaging TCs, so the property loss medians of all provinces are zero.
In terms of rainfall, much heavier rainfall was found in the west-type tracks than that in east-type tracks along mountainous areas, particularly the Sobaek mountains (Figs. 2c and 4e–h). Heavy rainfall along the mountains can be explained by the orographic lifting effect. When a TC is located in the southwest of South Korea, the eastern sides of the Sobaek mountains become the upstream slope of the tangential wind of the TC, causing more torrential rainfall than the inherent rain band of the TC (Park and Lee, 2007; Lin et al., 2002). Thus, the orographic lifting effect can be maximized by west-type tracks but not east-type ones.
Finally, the influence duration was distinctly longer for west-type tracks compared to east-type tracks. Only a TC with a west-long track penetrates the country, and hence, the west-approaching TCs could affect a more extensive area for a longer time. The long influence duration of the west-short tracks was possibly because a TC with a west-short track moves the slowest, and it could stay in the same area for the longest time (significant at the 95 % confidence level, Kruskal–Wallis test). Note that we calculated influence duration for each station by applying the same criteria for wind and rainfall. A station was marked as “influenced” if either the daily accumulated precipitation or daily maximum sustained wind speed recorded at that station on the specific day exceeded the station's critical thresholds, which we set as the 90th percentile of each station's precipitation and wind speed records over the analysis period (1979–2010).
Looking at Fig. 3, the ranking of active hazards was exactly same as that of damage. In addition, the spatial distribution of damage also matched well with those of active hazards (compare Figs. 4 and 5). The area where active hazards are high, exhibited high risks. There was only one exception, for west-types, the southwestern province (Jolla, JL) recorded less damage than the southeastern province (Gyeong-sang, GS), although stronger active hazards are found in JL than GS. This discordance was partly explained by exposure disparity. GS possesses higher wealth compared to JL. After the damage was divided by regional wealth (parentheses of Fig. 5), the spatial distribution of damage became more analogous to that of active hazards, even if the damage in GS is still slightly higher than in JL for the west-short tracks (Fig. 5d). This may be related to different vulnerability to TCs between the two provinces. Since GS is more mountainous than JL, the vulnerability of GS to TC rainfall can be higher than that of JL. Nevertheless, all the active hazard parameters (r=0.62) showed much higher correlations with damages than potential hazard parameters (r=0.29), although most of the potential hazards displayed statistically significant correlations at the 95 % or 99 % confidence levels (Table 1).
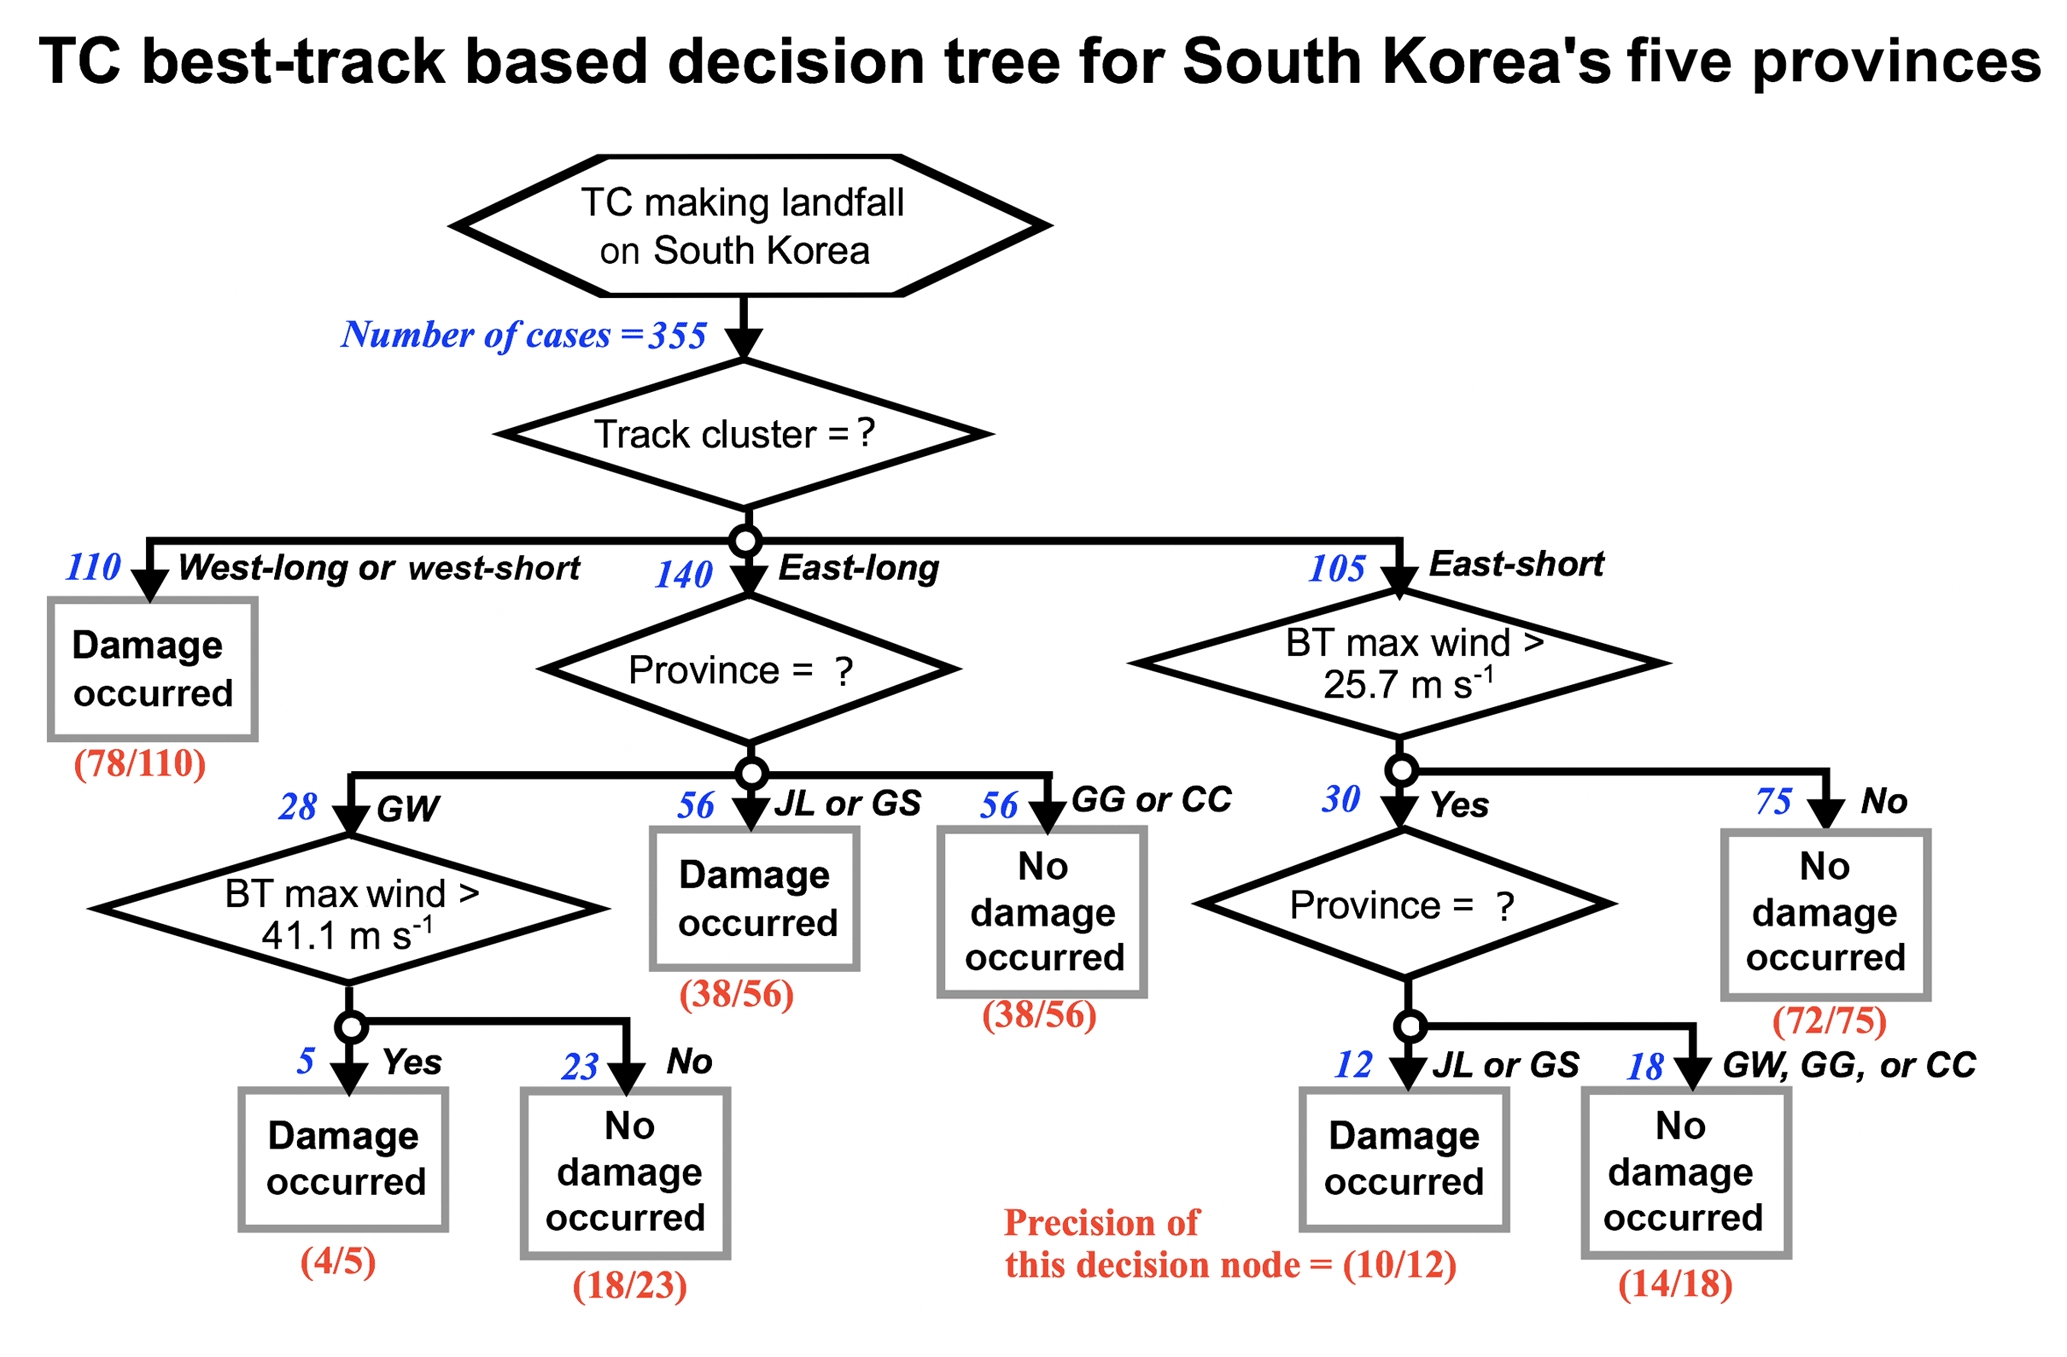
Figure 6Decision tree model for damage occurrence using the four TC best-track attributes (maximum wind speed, central pressure, storm size, and track group) and province information as input variables. The hexagonal box indicates the start of the algorithm, and the rhombus boxes contain questions bifurcating each node. The grey rectangular boxes indicate the final diagnosis boxes, in which the precision of the diagnosis is written in parentheses with red ink (the number of correctly identified cases and the number of cases diagnosed following the specific sequence of criteria). The number of cases corresponding to each criterion is presented at the left side of each arrow with blue ink, and at the right side of each arrow, there is a corresponding answer for the question right above the rhombus box. Refer to Fig. 2 for the full names of provinces for each abbreviation (i.e. GW, JL, GS, GG, and CC). BT is best-track.
All the results in this section suggest that active hazards are better indicators of TC risk than potential ones. In other words, if we want to a predict whether there would be damage to a city or not and if the active hazard information is available, we may not need to gain any additional information of potential hazards. Nevertheless, this does not mean that potential hazards are not important. We have to utilize a climate model with a fine resolution of at least less than 10 km for realistic simulation of active hazards, i.e. wind and rainfall (Park and Lee, 2007; Lee and Choi, 2010), which is a difficult task and requires high computing power. Hence, active hazards seem not to be optimal for risk forecasting to help emergent decision making, as well as climate change research with large spatiotemporal scale. In this respect, it can be more valuable to use potential hazards for risk assessment if we identify an additional factor that can fill the gap between active and potential hazards.
3.2 Importance of track in TC risk analysis
Here, through the decision tree analysis, the importance of track in TC risk was investigated. Through the decision tree analysis, the following three questions could be answered: (1) what is the most effective factor for classifying “damage” and “no damage” cases for TCs making landfall on South Korea, (2) how do different factors in combination determine damage occurrence, and (3) what critical values of the factors can be used as quantitative guidelines related to TC damage occurrence? Here, the decision tree model was designed to objectively classify whether a TC will bring damage to a province or not; the decision tree used potential hazards and track as input variables (see Table S1 for more information about the input variables). Overall, we had 355 effective cases, comprising of 160 “damage” cases and 195 “no damage” cases; we only considered damage occurrence in each province by a TC (see Table S2 for detailed information of damage cases).
According to the decision tree, track information acts as the primary determinant of TC risk. Information about the track pattern was nominated as the first splitting attribute (Fig. 6). This means all 355 cases should be classified by the track group prior to all other decision nodes in order to reach the end nodes. In other words, the most important factors of TC risk may be neglected when performing a risk analysis without track information. The detailed process is as follows. First, the model simply sent all west-type TCs to the end damage node. Next, the east-type TC cases were assessed according to province and TC intensity (maximum wind speed). For a TC in the east-long group, damage could occur in JL, GS, and GW provinces. Particularly, for the GW province, damage will be inflicted only if the maximum wind speed is greater than 41.1 m s−1. East-short cases, unlike east-long cases, were sent to the intensity criteria before the province criteria. East-short TCs with weak intensity (maximum wind speed less than 25.7 m s−1) were directly linked to the no damage node. The east-short TCs with satisfactory intensity (maximum wind speed greater than 25.7 m s−1) were sent to the province criterion; even though it is a small portion, the critically strong east-short TCs can cause damage in the southern provinces.
The relative importance of the variables in each decision tree was offered quantitatively in terms of the usage rate by the See5/C5.0 algorithm. When an attribute is the most-related variable to the target variable, the attribute should be used most frequently for classification by a decision tree model. In our decision tree (Fig. 6), the track group variable was used in 100 % of the cases; province and potential hazards then follow with usage rates of 48 % and 37 %, respectively. Therefore, we can say that for risk determination, TC track was the most important attribute, which gives essential information on TC risk analysis. The use of the province variable as the second most important variable was mainly related to the relative location of the province with respect to the TC centre along the track. Southern provinces are generally closer to the TC centre regardless of the four track types because TCs move from the south (low latitude) to the north (high latitude). Potential hazards were the third most important attribute. Maximum wind speed was utilized as an effective classifier, but TC size was not used.
Our results show that potential hazards, generally utilized in risk analysis, are less correlated with damage than active hazards. However, potential hazards are still valuable in risk analysis considering their convenience. In addition, according to our analysis, track information can considerably fill the gap between potential (e.g. maximum wind speed, and central minimum pressure) and active hazards (e.g. near-surface wind speed and rainfall). Figure 1 shows the graphical model summarizing the above points, which indicates the position of the track in a causal relationship with the TC risk process. The track may contribute to realizing active hazards through altering the following factors: (1) interaction with inhomogeneous topography, (2) the storm-relative location (i.e. which quadrangle of the TC the city is located in), and (3) the influence duration. The decision tree analysis suggests the TC track is the most decisive factor for TC damage occurrence, whereas potential hazards play only peripheral roles. Therefore, it is recommended to utilize track information as an additional factor when using potential hazards in risk analysis. Our results also imply that it is necessary to consider possibly large uncertainties in future TC risk projection because of high sensitivity of TC risk for the track as well as the lack of reliability of future projection of TC tracks (Knutson et al., 2010; Walsh et al., 2016).
On the other hand, the importance of the track may differ by country because topography among the three factors suggested is not identical between countries. If a country has major mountainous areas like South Korea, track information may become more important, and vice versa. The dependence of TC risk on track over southeastern United States, for example, in which there is little mountainous area, may be less important than that of South Korea. As a future study, we would compare the role of the track in TC risk between countries having different topographic conditions.
Our conclusion not only highlights the importance of the track in TC risk analysis, but also suggests that track pattern type can be used as an independent variable for regional risk forecast. However, the decision tree model utilized here is not proper for forecasting, since it is prone to overfitting and errors due to bias and variance. This is because the decision tree determines an optimal choice at each node. Choosing the best answer at each step does not guarantee the global optimum. If the model makes a different choice at a given step, the final node can be totally different, especially when the dataset is small. For the current study, to prevent these errors, we verified our results with pruning and cross-validation. We also used the decision tree method to diagnose the relationship between risk elements but not for forecasting. As a further study, we plan to utilize the random forest model for forecasting.
The raw data used in this study are available at https://data.kma.go.kr/ (Korea Meteorological Administration, 2015), http://kosis.kr/eng/ (Korean Statistical Information Service, 2015), https://www.jma.go.jp/jma/jma-eng/jma-center/rsmc-hp-pub-eg/besttrack.html (RSMC Tokyo, 2015), and http://www.safekorea.go.kr (NDIC, 2015). The decision tree code is available at https://www.rulequest.com/download.html (Relequest Research, 2015).
The supplement related to this article is available online at: https://doi.org/10.5194/nhess-18-3225-2018-supplement.
DSRP first proposed the idea, and CHH and CNN developed it. CNN conducted the data analysis and wrote the first draft. All four of the authors contributed to revising and editing the first draft.
The authors declare that they have no conflict of interest.
This work was supported by the Korea Ministry of Environment (MOE) as the
Climate Change Correspondence Program and Chosun University.
Edited by: Piero Lionello
Reviewed by: one
anonymous referee
Ching, P. K., de los Reyes, V. C., Sucaldito, M. N., and Tayag, E.: An assessment of disaster-related mortality post-Haiyan in Tacloban city, Western Pacific Surveillance and Response Journal, 6, 34–38, 2015.
Czajkowski, J. and Done, J. J.: As the wind blows? Understanding hurricane damages at the local level through a case study analysis, Weather Clim. Soc., 6, 202–217, 2014.
Hall, T. M. and Sobel, A. H.: On the impact angle of Hurricane Sandy's New Jersey landfall, Geophys. Res. Lett., 40, 2312–2315, 2013.
Hsiang, S. M. and Narita, D.: Adaptation to cyclone risk: Evidence from the global cross-section, Climate Change Economics, 3, 1250011, https://doi.org/10.1142/S201000781250011X, 2012.
Kim, H.-S., Kim, J.-H., Ho, C.-H., and Chu, P.-S.: Pattern classification of typhoon tracks using the fuzzy c-means clustering method, J. Climate, 24, 488–508, 2011.
Knutson, T. R., McBride, J. L., Chan, J., Emanuel, K., Holland, G., Landsea, C., Held, I., Kossin, J. P., Srivastava, A. K., and Sugi, M.: Tropical cyclones and climate change, Nat. Geosci., 3, 157–163, 2010.
Korea Meteorological Administration: Weather station data over South Korea, available at: https://data.kma.go.kr/, last access: 26 November 2015.
Korean Statistical Information Service: Province-level aggregated wealth data were obtained from government statistical surveys, available at: http://kosis.kr/eng/, last access: 26 November 2015.
Lee, D.-K. and Choi, S.-J.: Observation and numerical prediction of torrential rainfall over Korea caused by Typhoon Rusa (2002), J. Geophys. Res., 115, D12105, https://doi.org/10.1029/2009JD012581, 2010.
Lin, Y.-L., Ensley, D. B., Chiao, S., and Huang, C.-Y.: Orographic influences on rainfall and track deflection associated with the passage of a tropical cyclone, Mon. Weather Rev., 130, 2929–2950, 2002.
MacCollum, D.: Construction safety engineering principles: designing and managing safer job sites, McGraw-Hill Education, 416 pp., 2006.
Mendelsohn, R., Emanuel, K. A., Chonabayashi, S., and Bakkensen, L.: The impact of climate change on global tropical cyclone damage, Nat. Clim. Change, 2, 205–209, 2012.
National Disaster Information Center (NDIC): Damage data, available at: http://www.safekorea.go.kr, last access: 26 November 2015.
National Typhoon Center: Typhoon White Book, The Korean Meteor. Administration, 358 pp., 2011 (in Korean).
Nordhaus, W. D.: The economics of hurricanes and implications of global warming, Climate Change Economics, 1, 1–20, 2010.
Park, D.-S. R., Ho, C.-H., Kim, J.-H., and Kim, H.-S.: Strong landfall typhoons in Korea and Japan in a recent decade, J. Geophys. Res., 116, D07105, https://doi.org/10.1029/2010JD014801, 2011.
Park, D.-S. R., Ho, C.-H., Nam, C. C., and Kim, H.-S.: Evidence of reduced vulnerability to tropical cyclones in the Republic of Korea, Environ. Res. Lett., 10, 054003, https://doi.org/10.1088/1748-9326/10/5/054003, 2015.
Park, D.-S. R., Ho, C.-H., Kim, J., Kang, K.-R., and Nam, C. C.: Highlighting socioeconomic damages caused by weakened tropical cyclones in the Republic of Korea, Nat. Hazards, 82, 1301–1315, 2016.
Park, D.-S. R., Ho, C.-H., Chan, J. C. L., Ha, K.-J., Kim, H.-S., Kim, J., and Kim, J.-H.: Asymmetric response of tropical cyclone activity to global warming over the North Atlantic and the western North Pacific from CMIP5 model projections, Sci. Rep. UK, 7, 41354, https://doi.org/10.1038/srep41354, 2017.
Park, S. K. and Lee, E.: Synoptic features of orographically enhanced heavy rainfall on the east coast of Korea associated with Typhoon Rusa (2002), Geophys. Res. Lett., 34, L02803, https://doi.org/10.1029/2006GL028592 , 2007.
Peduzzi, P., Chatenoux, B., Dao, H., De Bono, A., Herold, C., Kossin, J., Mouton, F., and Nordbeck, O.: Global trends in tropical cyclone risk, Nat. Clim. Change, 2, 289–294, 2012.
Pielke Jr., R. A., Gratz, J., and Landsea, C. W.: Normalized hurricane damages in the United States: 1900–2005, Nat. Hazards Rev., 9, 29–42, 2008.
Quinlan, J. R.: C4.5: programs for machine learning. Morgan Kaufmann Publisher Inc., 270 pp., 1993.
Regional Specialized Meteorological Center (RSMC) Tokyo : Tropical cyclone best track data, available at: https://www.jma.go.jp/jma/jma-eng/jma-center/rsmc-hp-pub-eg/besttrack.html, last access: 26 November 2015.
Roy, C. and Kovordanyi, R.: Tropical cyclone track forecasting techniques – A review, Atmos. Res., 104–105, 40–69, 2012.
Rulequest Research: The code for See5/C5.0 decision tree model, available at: https://www.rulequest.com/download.html, last access: 26 November 2015.
Sawilowsky, S. S.: Nonparametric-tests of interaction in experimental-design, Review of Education Research, 60, 91–126, 1990.
Walsh, K. J. E, McBride, J. L., Klotzbach, P. J., Balachandran, S.,Camargo, S. J., Holland, G., Knutson, T. R., Kossin, J. P., Lee, T.-C., Sobel. A., and Sugi, M.: Tropical cyclones and climate change, WIREs Climate Change, 7, 65–89, https://doi.org/10.1002/wcc.371, 2016.
Zhai, A. R. and Jiang, J. H.: Dependence of US hurricane economic loss on maximum wind speed and storm size, Environ. Res. Lett., 9, 064019, https://doi.org/10.1088/1748-9326/9/6/064019, 2014.