the Creative Commons Attribution 4.0 License.
the Creative Commons Attribution 4.0 License.
 | 21 Dec 2018
Multi-hazard risks in New York City
Yaella Depietri
Khila Dahal
Timon McPhearson
Megacities are predominantly concentrated along coastlines, making them exposed to a diverse mix of natural hazards. The assessment of climatic hazard risk to cities rarely has captured the multiple interactions that occur in complex urban systems. We present an improved method for urban multi-hazard risk assessment. We then analyze the risk of New York City as a case study to apply enhanced methods for multi-hazard risk assessment given the history of exposure to multiple types of natural hazards which overlap spatially and, in some cases, temporally in this coastal megacity. Our aim is to identify hotspots of multi-hazard risk to support the prioritization of adaptation strategies that can address multiple sources of risk to urban residents. We used socioeconomic indicators to assess vulnerabilities and risks to three climate-related hazards (i.e., heat waves, inland flooding and coastal flooding) at high spatial resolution. The analysis incorporates local experts' opinions to identify sources of multi-hazard risk and to weight indicators used in the multi-hazard risk assessment. Results demonstrate the application of multi-hazard risk assessment to a coastal megacity and show that spatial hotspots of multi-hazard risk affect similar local residential communities along the coastlines. Analyses suggest that New York City should prioritize adaptation in coastal zones and consider possible synergies and/or trade-offs to maximize impacts of adaptation and resilience interventions in the spatially overlapping areas at risk of impacts from multiple hazards.


Megacities (i.e., urban areas exceeding 10 million inhabitants) host 500 million people or 6.8 % of the global population, a proportion that is projected to rise to 8.7 % by 2030 (UNDESA, 2016). These urban agglomerations are highly interconnected and vibrant centers in which enormous physical and intellectual resources are concentrated. Mainly located along waterways and coastal areas, megacities tend to be more exposed to disasters and suffer higher social and economic losses (UNDESA, 2016). Earthquakes, cyclones and flooding are the major threats to megacities (Philippi, 2016). Large cities themselves modify the local and regional environment, changing the microclimate (e.g., by creating urban heat islands, UHIs), paving over soil and altering ecosystem processes and building up infrastructure (e.g., roads, buildings, pipes, wires), which, together with projected impacts of climate change such as sea level rise, contributes to magnifying hazard impacts in coastal inhabited areas (Pelling and Blackburn, 2013). New York City (NYC), a regional megacity, is highly exposed to multiple hydrometeorological hazards. For example, on the 29 October 2012, Hurricane Sandy made landfall close to Atlantic City, New Jersey (United States), with the intensity of a Category 3 hurricane. Located approximately 200 km north, the NYC area was severely affected by the hurricane, which surprised the city; it was largely unprepared to cope with the magnitude of such an event. The city suffered human losses, widespread damage to buildings, power outages, interruptions to utility services and large-scale flooding. In the metropolitan region 97 people lost their life, thousands were displaced and economic losses amounted to more than USD 50 billion (Abramson and Redlener, 2012). Hurricane Sandy triggered a series of responses from the local administration. Since then, the NYC Office for Emergency Management has developed multiple initiatives to decrease risk of coastal storms, as described in the 2014 NYC Hazard Mitigation Plan. Additionally, the city established the Mayor's Office for Recovery and Resilience in 2014. Innovative design approaches led to the recently approved “Big U” coastal resilience project that is planned as a fortification of Lower Manhattan to protect it from future storm surges and flooding. However, coastal hazards are not the only extreme events that threaten New Yorkers. Heat waves kill on average more persons than any other extreme event in NYC (Depietri and McPhearson, 2018). Additionally, extreme precipitation can cause havoc in cities. In NYC even precipitation events as low as 38 mm are of concern to local authorities because they create surface flooding which impact residents and infrastructures.
In general, hazards in urban areas overlap spatially and/or temporally (e.g., high rainfalls and storm surges, or heat waves followed by a storm), though these overlaps are rarely adequately captured by research and policy. Attention has traditionally been paid to the physical components of risk to hazards, focusing on the potential joint impacts that multiple hazards can have on the infrastructures and buildings within certain sensitive areas or locations because of their frequency and intensity (e.g., Kappes et al., 2012a; van Westen et al., 2002). There has been less study to assess the socioeconomic components of multi-hazard risk in cities in order to design combined plans and policies that can together address multiple sources of vulnerability and risk (Johnson et al., 2016). Policies based on mono-hazard risk assessments could reduce or even increase vulnerability and risk to other hazards affecting the same area. A multi-hazard risk assessment instead facilitates identification of potential synergies or trade-offs for adaptation policies and specific interventions and can maximize resilience and adaptation by meeting challenges posed by different sources of natural hazard risk. For example, tree planting or green roof investments to increase stormwater infiltration can also be a synergistic strategy for the reduction of the UHI.
The objective of this study is to provide an improved multi-hazard risk assessment methodology which is then applied to NYC as a case study of how megacities in coastal areas are affected by multiple, spatially overlapping hazards. NYC is an important megacity for examining multi-hazard risk given its global prominence as the largest city in the United States with hundreds of billions (USD) in assets and millions of people at risk. It is a coastal city threatened by multiple hydrometeorological hazards, further exacerbated by climate change. Here we report data on past and future potential multi-hazard events in NYC and assess the combined socioeconomic risks to residents of three different sources of climatic hazards: heat waves (HW), inland flooding (IF) and coastal flooding (CF). The analysis is based on the spatial features of hazards and social vulnerability in the city to inform resilience and adaptation planning that typically focuses interventions on single hazards. In this way we intend to provide a scientific basis with context-specific and expert-based input for improving our understanding of multi-hazard risk in the city and for future planning in the city as well as recommendations for the real-world implementation of such a multi-hazard assessment for other similarly exposed urban areas.
1.1 Vulnerability to and risk assessment of natural hazards
The study of the impacts of natural hazards on the social–ecological systems has moved from the focus on the geophysical, climatological or hydrometeorological phenomena by first considering physical vulnerability (i.e., exposure and fragility of the exposed elements) and only later the socioeconomic, institutional and cultural factors that increase the exposure, susceptibility and coping capacity of the system (Bankoff et al., 2004; Birkmann, 2006; Cardona, 2004). In this perspective the occurrence of a hazard does not necessarily lead to a disaster. Disasters are sociocultural constructions mainly driven by the fragilities of the affected social–ecological system, its health and its management approach, which all contribute to defining the risk of hazards (Oliver-Smith, 2004). Risk thus concerns the values, knowledge and actions of a particular society (Cardona, 2004; Wisner et al., 2014). Economic factors also play a role in defining vulnerability and thus risk. For instance, poor populations tend to settle in hazard-prone areas where housing costs are lower, a result of past political, economic and cultural legacies that provide them with little alternative, putting them at higher risk (Wisner et al., 2014). The same hazard can cause very different impacts in adjacent areas but which differ in their socioeconomic activities and institutional or governance practices. An example from Collins (2010) describes how, in Paso del Norte (a city between two countries: El Paso County, United States, and Ciudad Juárez, Mexico), the impacts of floods, that occurred between July and September 2006, were overall of an order of greater magnitude in the Mexican part of the city due to unequal power relations expressed through the economic system. Risk is thus a complex concept that encompasses both the features of the hazard and that of the system potentially affected.
1.2 Multi-hazard risk assessment
A subgroup of hazard risk-assessments that considers more than one hazard at a time is called multi-hazard risk assessment. The UNSIDR glossary of terms of 2009 defines multi-hazard as (1) “the selection of multiple major hazards that the country faces” and (2) “the specific contexts where hazardous events may occur simultaneously, cascadingly or cumulatively over time, and taking into account the potential interrelated effects”. The need for multi-hazard approaches is acknowledged at the local, national and international level. Already in the early 1990s, the multi-hazard risk approach was proposed as a requirement for the development of strategies aiming at sustainable urban development. The need for multi-risk assessment is in fact part of Agenda 21 for sustainable development, formulated during the UN summit in Rio de Janeiro in 1992, which requested “complete multi-hazard research” as a fundamental element of human settlement planning and management in disaster-prone areas (UNEP, 1992). This was reaffirmed in the Johannesburg Declaration of Sustainable Development in 2002, which required “[a]n integrated, multi-hazard, inclusive approach to address vulnerability, risk assessment and disaster management, including prevention, mitigation, preparedness, response and recovery” (UN, 2002, p. 20). The Hyogo Framework of Action 2005–2015 pledged the introduction of “integrated, multi-hazard approach[es] for disaster risk reduction […] into policies, planning and programming related to sustainable development, relief, rehabilitation and recovery activities in post-disaster and post-conflict situations in disaster-prone countries” (UNISDR, 2005). The Sendai Framework for Disaster Risk Reduction 2015–2030, which follows the Hyogo Framework of Action, calls for disaster risk reduction practices to be multi-hazard, besides being multisectoral and inclusive. And yet, despite decades of attention, we still have little understanding of risks posed by multiple hazards spatially and temporally interacting in sensitive areas around the world (Wipulanusat et al., 2011).
There are different ways to look at how multiple hazards affect a same area, or a group of subjects or objects. (1) A hazard can lead to another hazard through cascading effects (e.g., a heavy storm causing landslides); (2) two or more hazards can simultaneously impact a same area; (3) or hazards can impact the same subject or object in sequence, leading to cumulative effects (Kappes et al., 2012b). Some studies have assessed different aspects of multi-hazard risk in the recent literature. Bernal et al. (2017) adopt a probabilistic approach to analyze physical risk of earthquakes, landslides and volcanic eruptions jointly. A similar approach to looking at physical risk was suggested by van Westen (2002). Liu et al. (2015) propose a multi-hazard risk framework, comparable to the one we apply in this study, but show an example of multi-hazard risk focusing on physical vulnerability. Forzieri et al. (2016) look at the multi-hazard assessment in Europe linked to climate change impacts, but only consider the hazard features and leave the vulnerability component for future investigation. Most of these case studies look at physical vulnerability and risk and consider potentially cascading hazards. Few studies have looked at the socioeconomic component of risk in multi-hazard assessments (Greiving, 2006; Johnson et al., 2016). Here, we explore the socioeconomic vulnerability and risk spatially, using an extensive survey amongst local experts and stakeholders to identify sources of multi-hazard risk and to derive weights assessing the importance of the different hazards and the vulnerability indicators selected. This is an additional feature of this type of study that aims at further adapting the study to the local conditions. We thus developed a highly context-specific case of multi-hazard risk in NYC, but with a generalizable multi-hazard risk assessment approach that can be adapted to other regions with variations on the choice of the hazards, vulnerability indicators and weights assigned to the indicators themselves. The methodology, in fact, intends to add to the literature on multi-hazard risk assessment by integrating locally adapted weights derived from expert opinions.
1.2.1 Multi-hazard risk in urban areas
Urban areas worldwide tend to suffer greater fatalities and economic losses when compared to their rural counterparts due to the concentration of people, infrastructures and assets as well as to inadequate management (Dickson et al., 2012). The high concentration of infrastructures in urban areas (water supply network, sewage systems, transportation, subways, roads and railways, energy supply network, telecommunication system, green infrastructures) put them particularly at risk in the case of failure of or damage to these critical systems (Graham, 2010). Amongst the natural hazards, heat waves are a predominantly urban hazard, meaning that higher degrees of mortality and morbidity are experienced in cities compared to rural areas (Clarke, 1972; D'Ippoliti et al., 2010). In coastal cities a high number of people are also exposed to storm surges, water intrusion and erosion (Nicholls and Small, 2002). Coastal ecosystems are the most productive as well as the most threatened by human activity and expanding urban development in these zones with increasing concentration of infrastructure and people ultimately further increases risk (MA, 2005; Pelling and Blackburn, 2013). Urbanization and climate change in coastal areas are on a collision course and understanding and planning for multi-hazard risk is an increasingly critical part of climate change resilience and adaptation planning, policy and management.
Different hazards such as floods, heat waves and earthquakes, when concentrated in densely populated urban areas, make multi-hazard assessment an important yet challenging task for decision makers. A recent study analyzed the risk of multiple hazards including landslides, typhoons and heat waves in two districts of Hong Kong and found that, despite socioeconomic differences of the two districts, both present comparable levels of risk (Johnson et al., 2016). Van Westen et al. (2002) looked at physical risk (i.e., of buildings and infrastructures) in a spatial manner to suggest possible mitigation measures for Turrialba in Costa Rica, a city exposed to flooding, landslides and earthquakes. Kappes et al. (2012a) assessed the geophysical risk to the Faucon municipality located in the Barcelonnette basin, in the Southern French Alps, of debris flows, shallow landslides and river flooding to support priority settings for users. Likewise, Lozoya et al. (2011) took an ecological perspective to assess risk of multiple hazards such as riverine floods, storm-induced coastal floods and storm-induced erosion of the S'Abanell urban and touristic beach of Spain, finding that cultural and regulating ecosystem services were the most affected by hazards in the area. Overall, few studies have focused on multi-hazard risk assessment with a strong social component to understand vulnerability in coastal megacities of the developed world.
Multi-hazard mapping, which consists of “the totality of relevant hazards in a defined area” (Kappes et al., 2012b), is a fundamental approach for multi-hazard risk assessment in urban areas and relevant for the NYC area. Such an approach allows for the identification of potential hotspots of risk and vulnerability derived from the spatial combination of more than one hazard. The effects of the hazards are considered as additive, with overlapping degrees of impacts. In this way, the impacts acting in the same locations, without interacting causally or coinciding contemporaneously, can be considered jointly. The approach facilitates the identification of structural improvements that can lead to the combined reduction of the exposure to two or more hazards in urban areas. The socioeconomic determinants of vulnerability, which often lead to the concentration of vulnerable people in certain areas of the city, are examined jointly and help the identification of zones of the city more likely to suffer harm from multiple hazards and in which more resources should be invested for adaptation. Multi-hazard risk is composed of two main steps: the analysis of the hazards and of the vulnerability of the system. Thus it widely refers to the vast literature on disaster risk and vulnerability assessment mentioned above (e.g., Birkmann, 2006; Birkmann et al., 2013; Bogardi and Birkmann, 2004; Cardona, 2004; Pelling, 2003; Turner et al., 2003; Wisner et al., 2014). The vulnerability component is the predisposition of the system to suffer harm and it is generally expressed through the degree of exposure of the system (or number of subjects or objects potentially affected by the hazard), the susceptibility (or the fragilities of the system exposed such as the health of the population) and the lack of resilience (or the incapacity to be prepared, cope and respond to the hazard) (Birkmann et al., 2013). Here, we analyze how multiple hazard risks overlap spatially in New York City with the goal of supporting planning and policy for three key objectives: (1) to improve risk reduction through multipurpose strategies, (2) to improve the adaptive capacity of the city and (3) to suggest a potential approach for similar multi-hazard risk assessments in other vulnerable urban areas and settlements.
1.3 New York City and disaster risk
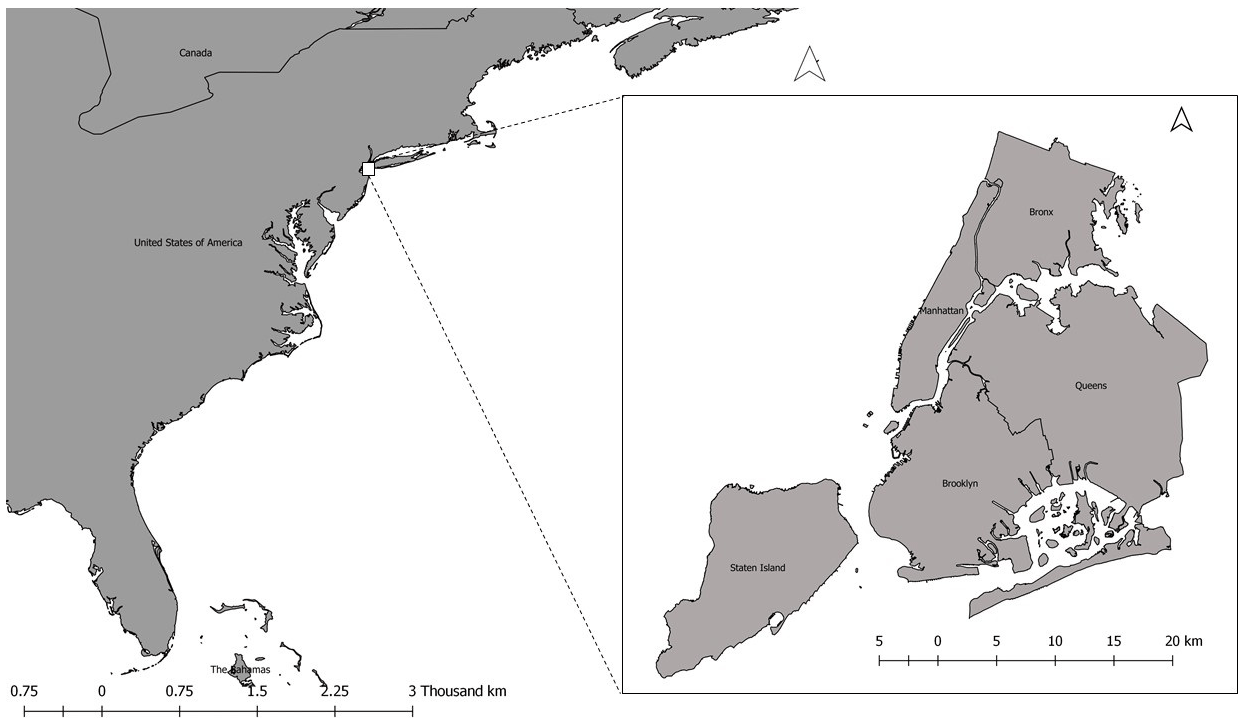
NYC is the largest city in the United States and is located on the east coast (see Fig. 1), with approximately 8.6 million people in 2017 and just in the municipal area according to the US Census Bureau. The NYC–Newark–New Jersey metropolitan statistical area is much larger, with 20.3 million people living in the region closely connected socially, economically and infrastructurally to NYC (https://factfinder.census.gov/faces/nav/jsf/pages/index.xhtml, last access: 18 December 2018). The metropolitan area is also the largest in the United States (https://www.census.gov/newsroom/press-releases/2018/popest-metro-county.html#popest-tab6, last access: 18 December 2018). Approximately 1.4 million people aged 60 and older live in the city, representing a particularly vulnerable group, especially for heat-related morbidity and mortality. The elderly constitute 17 % of the population at present, and this proportion is expected to grow considerably in the coming years (Goldman et al., 2014). NYC is also built around a network of rivers, estuaries and islands, with much of the metropolitan region situated less than 5 m above mean sea level (Colle et al., 2008) which contributes to the hazard context especially in terms of coastal flooding.
We focus our analysis on three hazards that cause the highest human impacts in NYC (see Depietri and McPhearson, 2018): heat waves, inland flooding and coastal flooding. Heat waves in NYC are defined by the NYC Panel on Climate Change (NPCC) 2015 Report as three consecutive days above 90 ∘F (or about 32.2 ∘C) (Horton et al., 2015a). Inland flooding in NYC can be triggered by precipitation of more than 1.5 in. (or 38 mm) of rain per day since the city's drainage system is designed to handle heavy rainfall with intensities of 1.5 in. (about 38 mm) per day in most areas of the city where sewers were built prior to 1960 and of 1.75 in. (about 44 mm) per day in locations where sewers were built after 1960 (Llyod and Licata, n.d.). Coastal flooding is primarily driven by storm surges. NYC is affected by a changing climate, with future projections including probable higher temperatures, increasingly frequent heavy downpours and a rising sea level that will further increase storm surges and coastal flooding (Garner et al., 2017; Horton et al., 2015a; Lin et al., 2012, 2016; Reed et al., 2015; Rosenzweig and Solecki, 2015). In the next sections, we describe each hazard and its local impacts. Information about multi-hazard risk in the city is scarce in the available literature; consequently we have combined multiple sources of evidence of the occurrence of multi-hazard events in NYC and review them in Sect. 3.1.
1.3.1 Heat waves
Heat waves in NYC are the largest cause of death due to socio-natural hazards (Depietri and McPhearson, 2018; NYC, 2014). Past disastrous heat waves include the July 1966 event, in which the mortality rate increased by 36 % (Schuman, 1972), and the summer 1972 heat wave which caused 253 deaths on 24 July only (Ellis et al., 1975). According to the NYC Department of Health and Mental Hygiene, 46 heat stroke deaths resulted from two heat waves in July–August 2006, while 26 heat-related deaths occurred during the heat wave of July 2013 (NYC, 2006, 2014). Between 2000 and 2011, 447 patients were treated for heat illness and 154 died (CDCP, 2013). A study by Madrigano et al. (2015) reported up to 234 heat-related deaths for the same period. It has been documented that extreme heat impacts have been increasing at least for the period 1987–2005 (Anderson and Bell, 2011). However, the number of deaths is significantly less pronounced when compared to the first half of the 20th century, showing evidence of adaptation likely due to the use of air conditioning (Depietri and McPhearson, 2018; Petkova et al., 2014).
Risk to heat waves is driven by several factors. Those with poor socioeconomic status, for example black (non-Hispanic) individuals, and the socially or linguistically isolated are more likely to die during a heat wave (Madrigano et al., 2015). People with chronic physical or mental health illnesses (i.e., cardiovascular disease, obesity, neurologic or psychiatric disease) also account for a large majority of the causalities, together with individuals subject to alcohol or drug abuse (CDCP, 2013; Ellis et al., 1975). The ageing population is the most at risk of suffering from heat stroke during a heat wave (Luber and McGeehin, 2008; Oudin Åström et al., 2011). Madrigano et al. (2015) also found that greener neighborhoods were less at risk in NYC, potentially due to a decreased UHI in those areas of the city. Increased rates of poverty and higher densities of African-American populations were found to be highly correlated with the lack of green spaces in the city (Klein Rosenthal et al., 2014). Low income and crowding were also elements of risk in the 1966 heat waves according to Schuman (1972). Primary indicators of heat vulnerability are relatively consistent across studies with poverty, poor housing conditions, low access to air-conditioning and seniors' hypertension associated with elderly death due to heat stress in NYC between 1997 and 2006 (Klein Rosenthal et al., 2014). Environmental conditions, pervious land cover and aggregated surface temperatures were also found to be positively associated with heat-related deaths of the elderly (Klein Rosenthal et al., 2014).
Gedzelman et al. (2003) calculated the UHI of NYC to be on average approximately 4 ∘C in summer and autumn and 3 ∘C in winter and spring according to measurements taken between 1997 and 1998 (Gedzelman et al., 2003). Temperatures have been rising in Central Park between 1900 and 2013 (Horton et al., 2015a). In particular, it has been estimated that the temperature rose by 1.1 ∘C between 1900 and 1997 in NYC (Knowlton et al., 2007). One-third of the total warming of the city since 1900 was attributed to the intensification of the UHI. Projections show that this trend is likely to continue in the future, with warmer temperatures in NYC in the coming decades driven by the UHI and increasing temperatures caused by climate change (Horton et al., 2015a). A study by Knowlton et al. (2007) showed that, despite the possibility to adapt to rising temperature, heat-related premature deaths are likely to rise in projected future climates and affect regions also beyond the urban core of the city. Spatial and temporal patterns of current risk combined with projections for increasing temperatures and frequency and intensity of heat waves thus suggest the need for extensive planning and management to reduce heat risk in NYC.
1.3.2 Inland floods
In the city, the built environment – dense and heavily paved built-up areas and reclaimed wetlands – limits the ground's capacity to absorb and drain water, raising the risk of urban or inland surface flooding. Sealed surfaces cover 72 % of the NYC areas according to the city's Department of Environmental Protection. Much of NYC's infrastructure, especially in low-lying or poor drainage areas, cannot cope with more than 1.5 in. (or 38 mm) per hour of rainfall (Lane et al., 2013), as mentioned above. According to NYC (2014), communities in low-lying areas with limited drainage capacity tend to experience sewer backups and street and basement flooding that can expose them to contaminated stormwater and wastewater. Combined sewer overflows, occurring when sewage and stormwater are discharged from sewer pipes without treatment because of the treatments plants are unable to handle flows, are frequent in NYC and are a significant source of environmental pollution (Rosenzweig et al., 2006). Excessive rain washes away pollutants from the streets, which end up in the surrounding bodies of water. Exposure to contaminated water can have both short- and long-term public health effects. Flooded basements and houses increase allergies, asthma and other respiratory illness from exposure to mold and fungus. However, flash floods in NYC are rarely life-threatening because of the local topography (Lane et al., 2013).
Recent research using historical data has suggested that for the NYC region, daily precipitation extremes are increasing in fall with less change in all other seasons (Frei et al., 2015; Huang et al., 2017, 2018). However, projections from downscaled global climate models (GCMs) provide less clear evidence for a shift in the intensity of flood caused by rain events in the Northeast United States (Knighton et al., 2017; Schoof and Robeson, 2016). The city committed to a plan to invest in green infrastructures for stormwater management, investing USD 5.3 billion and saving approx. USD 1.5 billion by spending a portion of this investment on green infrastructure in combination with traditional pipe and tank improvements (NYC, 2010). The green infrastructures planned include green and blue roofs, rain gardens, permeable pavements, bioswales and the planting of street trees. However, inland flooding is likely to continue to pose a significant risk to the urban residents of NYC.
1.3.3 Coastal flooding
Almost 33 square miles (about 85.5 km2) of NYC is within the equivalent of a 100-year floodplain (close to half of Brooklyn) (NYC, 2013). The most frequent coastal storms affecting NYC are nor'easters (i.e., storms along the east coast of North America, so called because the winds over the coastal area are typically from the northeast, according to NOAA (https://www.weather.gov/safety/winter-noreaster; last access: 16 September 2018). Even moderate nor'easter events can cause significant flooding (Colle et al., 2008) and are often associated with extended periods of high winds and high water (Orton et al., 2012; Rosenzweig et al., 2011). Extratropical cyclones followed by tropical cyclones tend to generate the greatest storm surge heights and flooding in NYC (Catalano and Broccoli, 2017; Smith et al., 2010; Towey et al., 2018), which can reach up to 5.12 m according to Lin et al. (2010). Extratropical storms account for 80 %–85 % of total precipitation from December to May and 93 %–100 % of extreme precipitation from November to May on the northeastern coast of the United States (Agel et al., 2015). Hurricanes affect NYC more infrequently. However the associated flooding is being exacerbated due to the increase of sea level and the increase in the intensity of the hazard itself (Kemp and Horton, 2013; Reed et al., 2015). Five major Category 3 hurricanes affected the New York area between 1851 and 2010, mostly in the month of September (Blake et al., 2011) and generally led to great damage (Rosenzweig et al., 2011). In 2012, Hurricane Sandy made landfall as a post-tropical cyclone in New Jersey with 70 kt maximum sustained winds, driving a catastrophic storm surge into the New Jersey and New York coastlines (Blake et al., 2013). In NYC the storm surge was 2.81 m and was the cause of most of the damage and losses (Kemp and Horton, 2013). Hurricane Sandy caused 43 deaths in NYC, and nearly half were adults aged 65 or older (Kinney et al., 2015). According to Lane et al. (2013), death was caused most frequently by drowning associated with the storm surge. Other deaths were caused by falling trees, falls, electrocution and other trauma. Further, Sandy caused at least USD 19 billion in economic losses to the city (NYC, 2013), left hundreds of thousands without power, some for many weeks (Lane et al., 2013). It was also found that power outages increase risk of death in NYC (Anderson and Bell, 2012). Five hospitals shut down due to Sandy, and three of them had to evacuate patients after the storm hit because of flood damage to critical equipment; power losses in these facilities further complicated evacuation operations (Lane et al., 2013). Nearly 70 000 buildings were damaged by the storm or destroyed by related fire especially in south Brooklyn, South Queens and Staten Island; the subway system was seriously affected; roads, railroads and airports were flooded; and the communication system was disrupted in many areas (NYC, 2013).
Since Hurricane Sandy, the city established a USD 20 billion plan to adapt to climate extremes with 257 initiatives which span from coastal protection, economic recovery, community preparedness and response, to environmental protection and remediation (NYC, 2013). Additionally, the Mayor's Office of Housing Recovery Operations was established in 2013 to oversee housing recovery in NYC.
Increasing hurricane intensity over time has been detected (Gornitz et al., 2001; Knutson et al., 2015). Additionally, three of the nine highest recorded water levels in the New York Harbor region have occurred since 2010, and 8 of the largest 20 have occurred since 1990 (Talke et al., 2014). A rise of 40 % of sea level in NYC is driven by subsidence and the rest by global climate change, amounting in total to 25.4 mm per decade since 1900 (Horton et al., 2015b). Due to sea level rise, which is projected to accelerate during this century to reach up to 1.2 m in the coming century (Kopp et al., 2014), coastal flooding in NYC is expected to become more frequent and intense, even in the absence of changes in the intensity and frequency of storms (Colle et al., 2008; Gornitz et al., 2001; Horton et al., 2015b). A recent study has shown that, by 2030–2045, the megacity could be affected by significant flooding on average every 5 years (Garner et al., 2017). This is ever more significant when considering the high and increasing concentration of assets and people exposed in the coastal areas of the city (Aerts and Botzen, 2012). According to Aerts et al. (2013), the estimated flood damage to buildings for NYC is between USD 59 and 129 million year−1, while the damages caused by a 100-year storm surge are within a range of USD 2 to 5 billion.
2.1 Multi-hazard events in New York City and indicators' weighting
We present an improved method for multi-hazard risk in cities generally, and applied it to the case study of NYC as a coastal megacity. Similar methodologies have been presented by Johnson (2016) and Greiving (2006); however here we integrated weights derived from local expert opinions. We assessed past heavy precipitation and extreme high temperatures based on daily precipitation and daily max temperatures recorded in Central Park from 1876 to 2016 and made available by the US National Oceanic and Atmospheric Administration (NOAA) to examine how temporally consecutive events occur in the city as part of a broader study initially presented in Depietri and McPhearson (2018). We conducted an analysis of daily NOAA's meteorological records (including daily precipitation and max and min temperatures) to identify dates on which an event of extreme heat would be immediately followed by a storm (or vice versa), two consecutive heat wave events (happening within 3 days max away from each other) and consecutive flooding events (two consecutive days of extreme precipitation). We then manually investigated the New York Times (NYT) database for relevant articles appearing in the edition of the day following the multi-hazard event identified, in order to analyze the occurrence and social, infrastructural and economic impact of cumulative events more in depth. We then conducted a survey with local experts and decision-makers with a principal objective to collect weights for the indicators and sub-indicators selected, but also to collect information of past and future potential multi-hazard events occurring in the city.
For the survey, we drafted a comprehensive list of the local authorities' representatives, researchers and other local actors such as NGOs whose daily work is related to different aspects of vulnerability and risk of hazards in NYC. The respondents to the survey were thus identified as being highly knowledgeable and to have experience of the local hazard risks and impacts. The institutional, urban planning, environmental planning, disaster risk reduction, health and social sectors were represented in the survey. A total of 122 invitation e-mails were sent to contact persons belonging to local and federal institutions as well as local NGOs. Of these, 10 were no longer valid and we subsequently collected 65 responses with a 58 % response rate. The survey was anonymous but almost 60 % of the respondents belonged to local jurisdictions, about 15 % to NGOs and 10 % to local universities, while state agencies, federal agencies and companies represented less than 5 % each. No further information about the respondent identity was collected to ensure anonymity.
Table 1Hazard indicators selected, and weights derived from the survey with standard deviations (SDs). (The SDs are equal due to the weighting method which required the allocation of 100 points amongst the sub-indicators indices.)
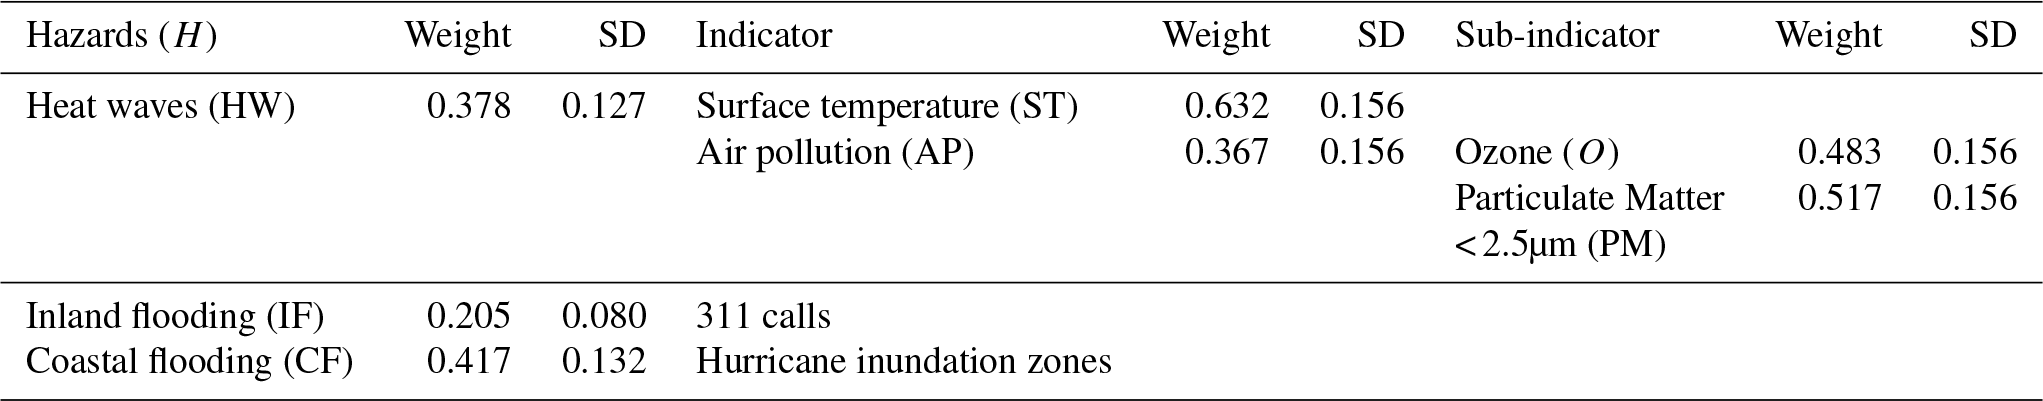
Table 2Vulnerability indicators and weights derived from the survey with standard deviations (SDs). (Note that the SDs for the two indicators of the lack of coping capacity are equal due to the weighting method which required the allocation of 100 points amongst the sub-indicators' indices.)

The list of indicators and sub-indicators weighted by the respondent of the questionnaire was derived from the relevant literature. The final list included those indicators able to describe the vulnerability to the three hazards jointly for which data were available (see Tables 1 and 2). For the weighting of indicators, we adopted the method of budget allocation, a participatory method (Saisana and Tarantola, 2002). Respondents were asked to rate each indicator by assigning 100 points distributed amongst the set of indicators describing the composite index. Final weights were derived by averaging the scores assigned by each respondent and dividing the means by 100. The weights thus derived were normalized to a fraction of up to 1 for each category. Unlike other methods such as analytic hierarchy process (AHP) and Delphi, the technique of budget allocation is intuitive, computationally simple, but accurate, and therefore widely used (Saisana and Tarantola, 2002). The weights obtained are listed in Tables 1 and 2. Additional questions in the survey were related to multi-hazard risk in NYC and the city preparedness to cope with different hazards. The results are presented in Sect. 3.1.
2.2 Multi-hazard risk assessment
We assessed multi-hazard risk of the main three hydrometeorological hazards affecting NYC described above. In this study, we emphasize the inclusion of social factors of risk by adapting our methodology from Greiving (2006) who carried out a multi-hazard risk assessment at the country level for Europe and from Johnson et al. (2016) who applied a similar methodology to the case of two Hong Kong districts. Overall, the methodology consists of generating hazard maps, one for each hazard (which are then combined in a multi-hazard map), and a common vulnerability map for the three hazards that includes socioeconomic indicators. We then obtained the final risk map as the product of the combined multi-hazard map and the common vulnerability map. Note that all variables used have been normalized and expressed as levels, ranging from 1 to 5, of hazard intensity, exposure, susceptibility, lack of coping capacity and vulnerability and risk. This normalization, widely in use in vulnerability and risk assessments, allowed us to conduct analyses across different, otherwise incommensurate, variables.
2.2.1 Hazard mapping
Multi-hazard risk assessment consists of an initial study of combined hazards which overlap temporally and spatially in the megacity. We created a raster surface for each hazard by categorizing the hazard intensity into five ordinal scales of 1 to 5, which are equivalent to standardized hazard levels of very low, low, medium, high and very high. We used the natural break (Jenks) method of data classification in ESRI's ArcGIS software as the method considers both the span of values and the number of observations for each category (Smith et al., 2007), and is widely used for classification in mapping (Huang et al., 2011).
Especially in the urban context, hazards present a significant social component which magnifies impacts due to the high modification of the environment. For creating the heat wave hazard surface, we maintained that the hazard affects the entire city with different intensities according to two aggravating factors: surface temperature and air pollution. Surface temperature was derived from the thermal band of 2011 Landsat imagery captured on the 15 and 31 July, while the air pollution layer was developed based on raster surfaces of 300 m resolution for 2010 with annual average values of PM2.5 and ozone (O3) concentrations. PM10 and O3 are the main contributors to extreme heat mortality besides heat itself (see Depietri et al., 2011, for a review). We acquired the air pollution data from the New York City Community Air Survey (NYCCAS) carried out by the New York City Department of Health and Mental Hygiene, Queens College Center for the Biology of Natural Systems and ZevRoss Spatial Analysis. Indicators used to develop the heat hazard map were weighted according to the survey responses (see Table 1 and Eqs. 1 and 2) and then combined, resulting in a raster surface with values ranging from 1 to 5.
where AP stands for air pollution, O for ozone and PM for particulate matter smaller than 2.5 µm. HW stands for heat wave hazard and ST for surface temperature. Additional scenarios for applying weightings could be applied that take into account different priorities amongst diverse stakeholders in the city, and here we present a single scenario for which the mean weight from all respondents was applied which has proved to be informative about the nuances of the factors determining multi-hazard risk in NYC.
The inland flooding map was derived through a spatial interpolation of 311 calls for street flooding (data available between January 2010 and December 2015) and basement flooding (data available between July 2011 and December 2015). The 311 calls were obtained from a spatial database developed and maintained by the City of New York which comprises all sorts of complaint calls. When preparing the inland flooding layer, we removed the complaint points from the dataset that had been recorded during the event or one day after the event of coastal storms, in order to maintain differences between precipitation-driven inland flooding and coastal flooding driven by storm surges. The dates and times of storm surges in the NYC coastal area were obtained from NOAA's storm events database (https://www.ncdc.noaa.gov/stormevents, last access: 23 February 2017) under the keywords “coastal flooding”, “high surf”, “tropical storm” and “storm surge/tide”. The 311-call dataset has nonetheless some limitations that are worth a mention. For instance, it does not account for possible differences in the likelihood of reporting flooding amongst populations (e.g., depending on income). However, this is the only available dataset on inland flood occurrence and allows us to consider one of the most frequent and perennial natural hazards affecting NYC – flooding driven by precipitation. Still, NOAA tide gauge data at the Battery in NYC are a useful source of continuously recorded water surface elevation, and therefore could be used as an indicator of storm surge heights, though not included in this analysis.
For coastal flood inundation we used the local expert map obtained from the NYC Office of Emergency Management (OEM) with hurricane inundation zones published in 2013. Local authorities suggested that we adopt the hazard map produced after Hurricane Sandy as this would be a more conservative starting point. However, we opted for the general map considering multiple levels of hazard, as this had predefined categories of hazard and thus was better able to be compared with the other hazards in a multi-hazard analysis.
The hazards' weights reported in Table 1 indicate that, according to the surveyed respondents, higher impacts would be caused by coastal hazards. This result might be justified considering the recent occurrence of Hurricane Sandy and its high impacts which triggered high concern amongst local authorities. A final multi-hazard map (H) was generated by adding weighted values of the three hazard layers (HW – heat wave; IF – inland flooding; CF – coastal flooding), as presented in Eq. (3). The resultant composite hazard layer also has values ranging between 1 and 5 to represent the five respective classes of hazard intensity.
The weighted linear combination of the three hazard intensities considers the hazards to spatially overlap without any additional quantifiable interactions.
2.2.2 Vulnerability and risk maps
To be compatible with the computation of hazard layers, we developed raster surfaces of 30 m spatial resolution for different socioeconomic and demographic variables relevant for the three hazards, describing the three components of vulnerability as listed in Table 2. For this reason, we disaggregated the 2010 census data made available by the US Census Bureau at the block group level. Disaggregation of census data using dasymetric approaches to a finer spatial scale follows Mennis and Hultgren (2006). We used the number of residential units, land use type and building type as ancillary information to convert demographic totals from census block groups to spatially corresponding cadastral lots for each vulnerability indicator. The disaggregated data layers were then resampled to a spatial resolution of 30 m to maintain uniformity with the spatial resolution of hazard data layers. These data were used to derive a vulnerability map based on indicators describing exposure, susceptibility and lack of coping capacity. Selection of these indicators stemmed from the review of available literature covered in Sect. 1.3.1 to 1.3.3, and the weights derived from the survey are presented in Table 2.
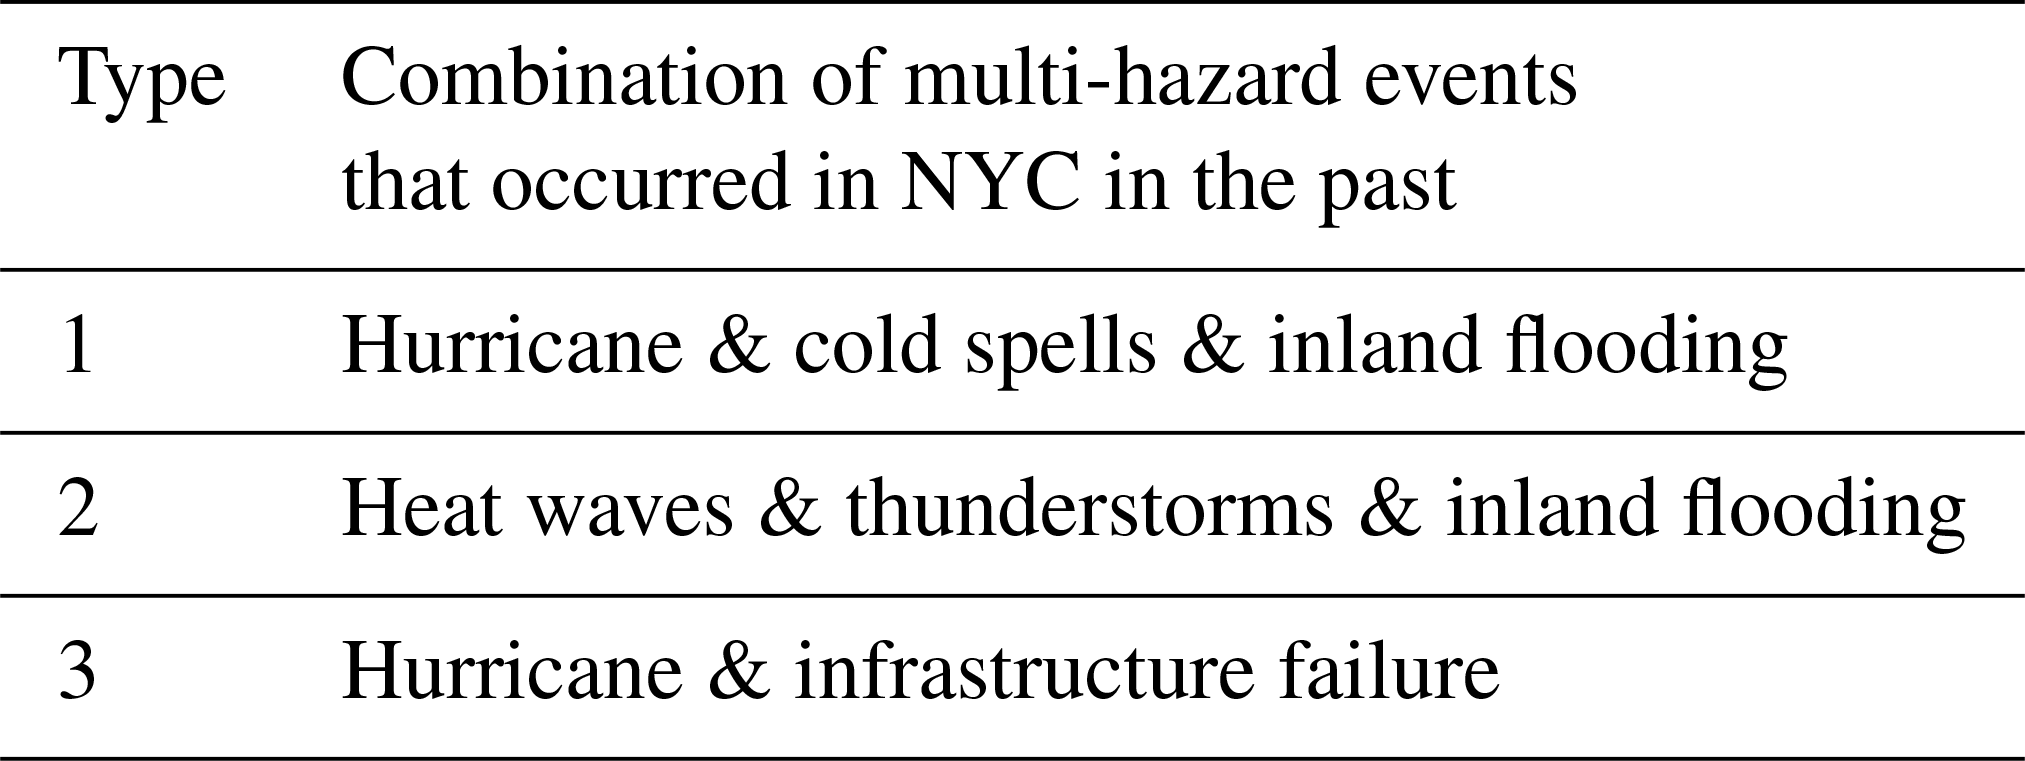
Table 3List of multi-hazard events that happened in the past according to the respondents of the questionnaire.
Vulnerability is defined as the “propensity of exposed elements such as physical or capital assets, as well as human beings and their livelihoods, to experience harm and suffer damage and loss when impacted by single or compound hazard events” (Birkmann et al., 2013, p. 195). This vulnerability perspective in risk reduction particularly looks at the socioeconomic, institutional and cultural conditions of people and physical assets which can be affected by a hazard as well as at their capacity to prevent and cope with the impacts of that event. As mentioned, in Birkmann et al. (2013, p. 200), vulnerability is described through three components defined above: exposure, susceptibility and lack of coping capacity.
The first step in the socioeconomic vulnerability assessment was to identify the exposed subjects. Exposure (E) was calculated as the number of inhabitants (P) for each 30 m×30 m spatial unit. The other two components of vulnerability are susceptibility (S) and lack of coping capacity (CC). Like the hazard mapping described above, we reclassified each of the indicators into five intensity categories represented by the values of 1 to 5 in such a way that 5 represents the highest level of intensity. For example, smaller values in the median income layer represent a higher degree of susceptibility and hence were given higher intensity values. The two components of vulnerability (S and CC) were calculated according to Eqs. (4) and (5):
where EL stands for elderly, C for children, I for median income, AA for African Americans, NS for no schooling, L for non-English-speaking, HH one-person household. We aggregated the indicators as a weighted sum, as each indicator contributes a fraction of the susceptibility or lack of coping capacity. The S and CC layers thus generated have values ranging between 1 and 5.
Some indicators (i.e., homes in deteriorated or dilapidated buildings, mold in home, asthma, heart attack hospitalizations, overweight, adults reporting heavy drinking, crowding, air conditioning, adults with a personal doctor and adults with health insurance) were considered but excluded in the final list because they were not available at the low scale for NYC or because some were not relevant for the three hazards when jointly considered. Respondents to the survey also suggested some additional indicators to consider and are summarized in the Results section.
The final vulnerability (V) map was generated by adding exposure (E), susceptibility (S) and lack of coping capacity (CC) layers with equal weights (Eq. 6):
We aggregated the three components of vulnerability by summing equally weighted values, a general approach adopted in the literature due to the difficulty of assigning different weights to these three components (see, for instance, Welle and Birkmann, 2015). Risk to natural hazards, such as hydrometeorological, climatological or geophysical hazard, is the combination of the probability or likelihood in time and space of a natural hazard to occur and to affect a vulnerable system (UNISDR, 2015). In the disaster risk reduction literature, risk is commonly defined as the product of hazard and vulnerability. The final aggregated risk map was calculated by multiplying the final aggregated hazard map by the vulnerability map (see Eq. 7):
where R is risk, H is multi-hazard and V vulnerability. We multiplied hazard by vulnerability because, following the definition of risk, with no hazard or no vulnerabilities, there would be no risk. The final risk map thus derived comprises 16 classes with values ranging from 1 to 25. As for the hazard and vulnerability maps mentioned above, the final aggregated risk is also displayed using five intensity classes.
Our method of aggregation, which first quantifies the indicators of hazard and vulnerability into five ordinal categories and then uses weighted linear combination, is drawn from the existing literature hazard and vulnerability assessment. Previous studies on hazard risk mapping have documented the robustness and accuracy of this method (Greiving, 2006; Greiving et al., 2006; Johnson et al., 2016; Michael and Samanta, 2016; Zhou et al., 2016).
To compare the plausibility of our results, we also followed an additional method of aggregation, which is collectively described as the fuzzy defined weighted combination (Aydi et al., 2013; Janke, 2010). We followed the same procedural steps, weights and aggregation formulae except that the numerical values of each of the hazard and vulnerability layers were standardized between 0 and 1 (i.e., 0 %–100 %) instead of the five ordinal classes. When displayed the final risk layer by reclassifying it into five categories based on natural breaks (Jenks), the map was very similar to the final map generated following the method we described above.
3.1 The qualitative results of the NOAA NYT search and the survey
Most of the temporally overlapping extreme events identified in the NOAA database between 1876 and 2016 were related to multiple heat waves happening at a distance of up to 3 or 4 days (13 events), followed by two consecutive days of extreme precipitation (9 events) and days of extreme heat followed by high precipitation (3 events). However, given a broader review carried out on the New York Times and described in Depietri and McPhearson (2018), we were able to identify various additional interrelated multi-hazard incidents which occurred in NYC, meaning that multi-hazard events have more interrelated impacts which might not only depend on the high intensity of the hazard alone.
The stakeholders who compiled the questionnaire were also asked to provide information related to past and present multi-risk events as well as strategies that they would prioritize for the city. In a multi-hazard perspective, the results of the survey indicated that heat waves in NYC would highly positively interact (i.e., increasing their impacts) with droughts, but also with inland and coastal flooding, although these would have opposed interactions too. Inland and coastal flooding can have additive impacts if they occur at the same time or successively. Furthermore, respondents indicated that other interactions between the wider ranges of hazards affecting NYC have occurred in the past and may occur in the future (summarized in Tables 3 and 4, respectively). In this study we cover many of these situations, although further analysis can be envisaged to better understand the interaction between the hazards and the failure of infrastructures.
3.2 Multi-hazard risk assessment
Figure 2a, b and c present the mapped analytical results for each of the three hazards considered. Except for heat stress, which is distributed across the whole city with points of low hazard intensity corresponding to the urban parks, the hazards' intensities are mainly concentrated along the coast, especially in Manhattan and in Brooklyn.
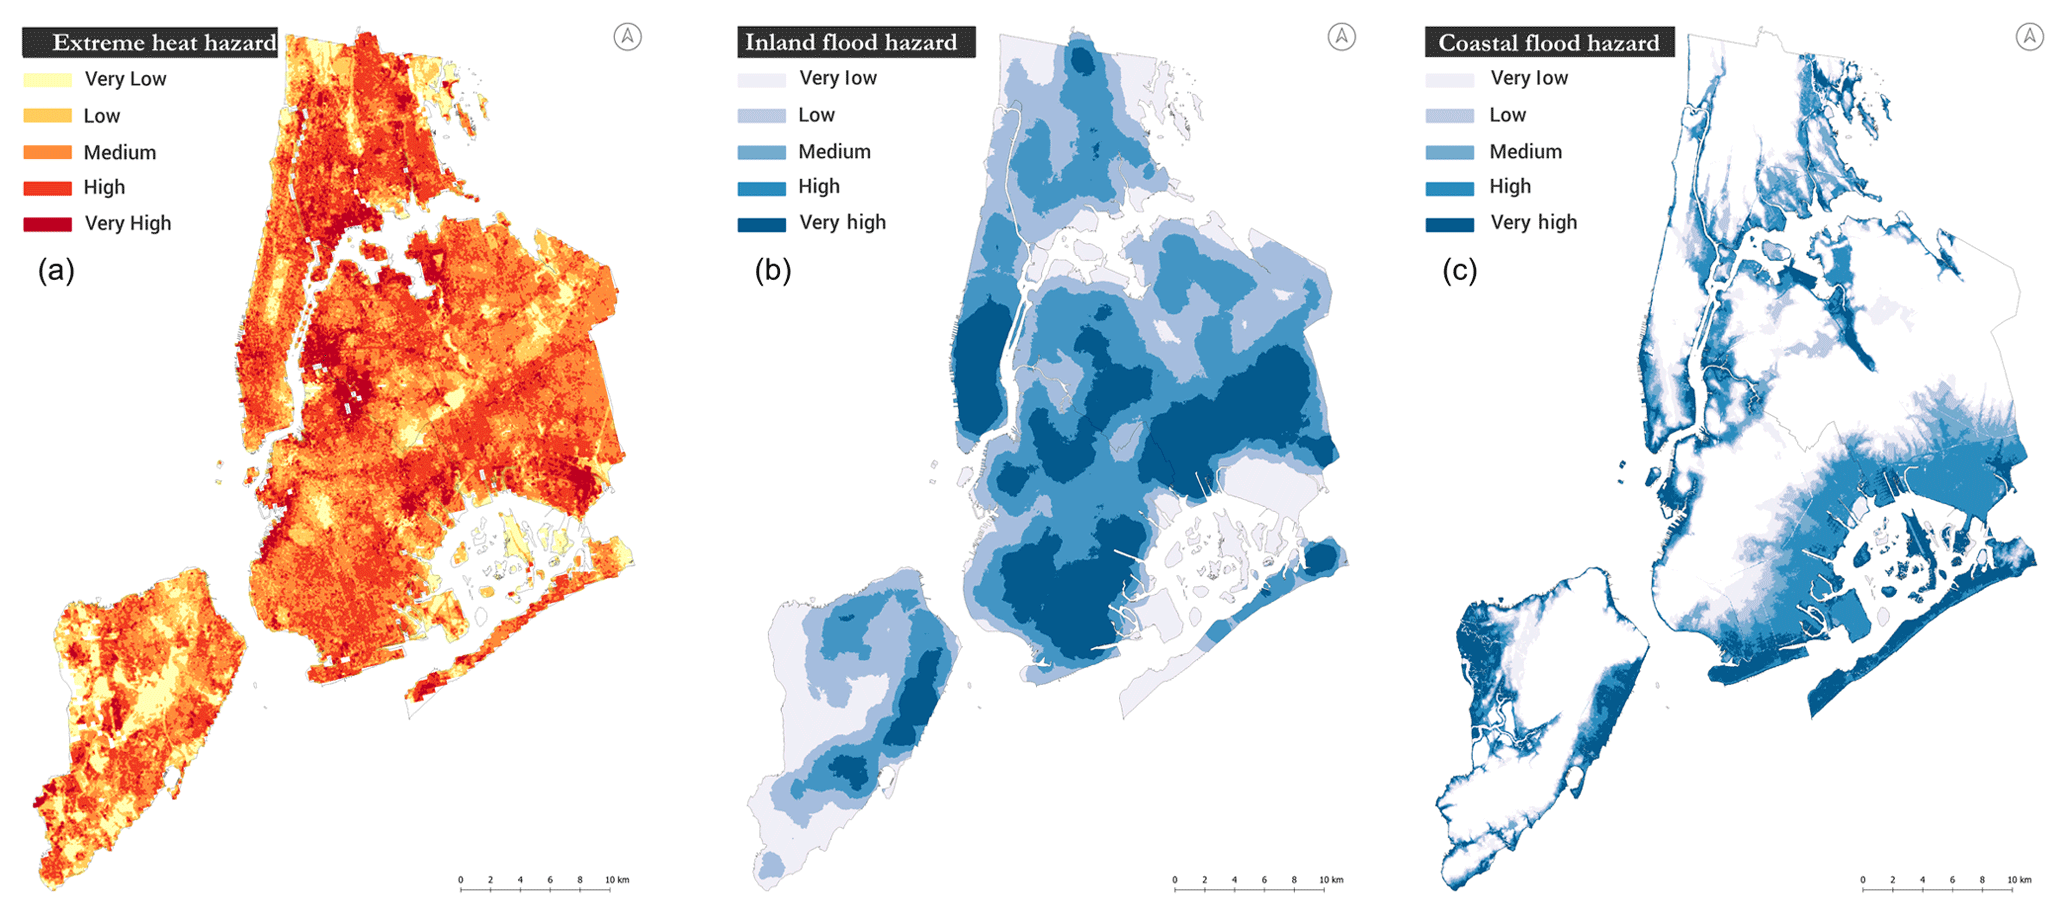
Figure 2Spatial variation in heat hazard, inland flooding hazard and coastal flood hazard for New York City. (a) Map of the heat stress based on surface temperature and air pollution. (b) Map of the inland flooding based on the 311 calls for street flooding or basement flooding. (c) Hurricane inundation zones based on the map provided by the Office of Emergency Management.
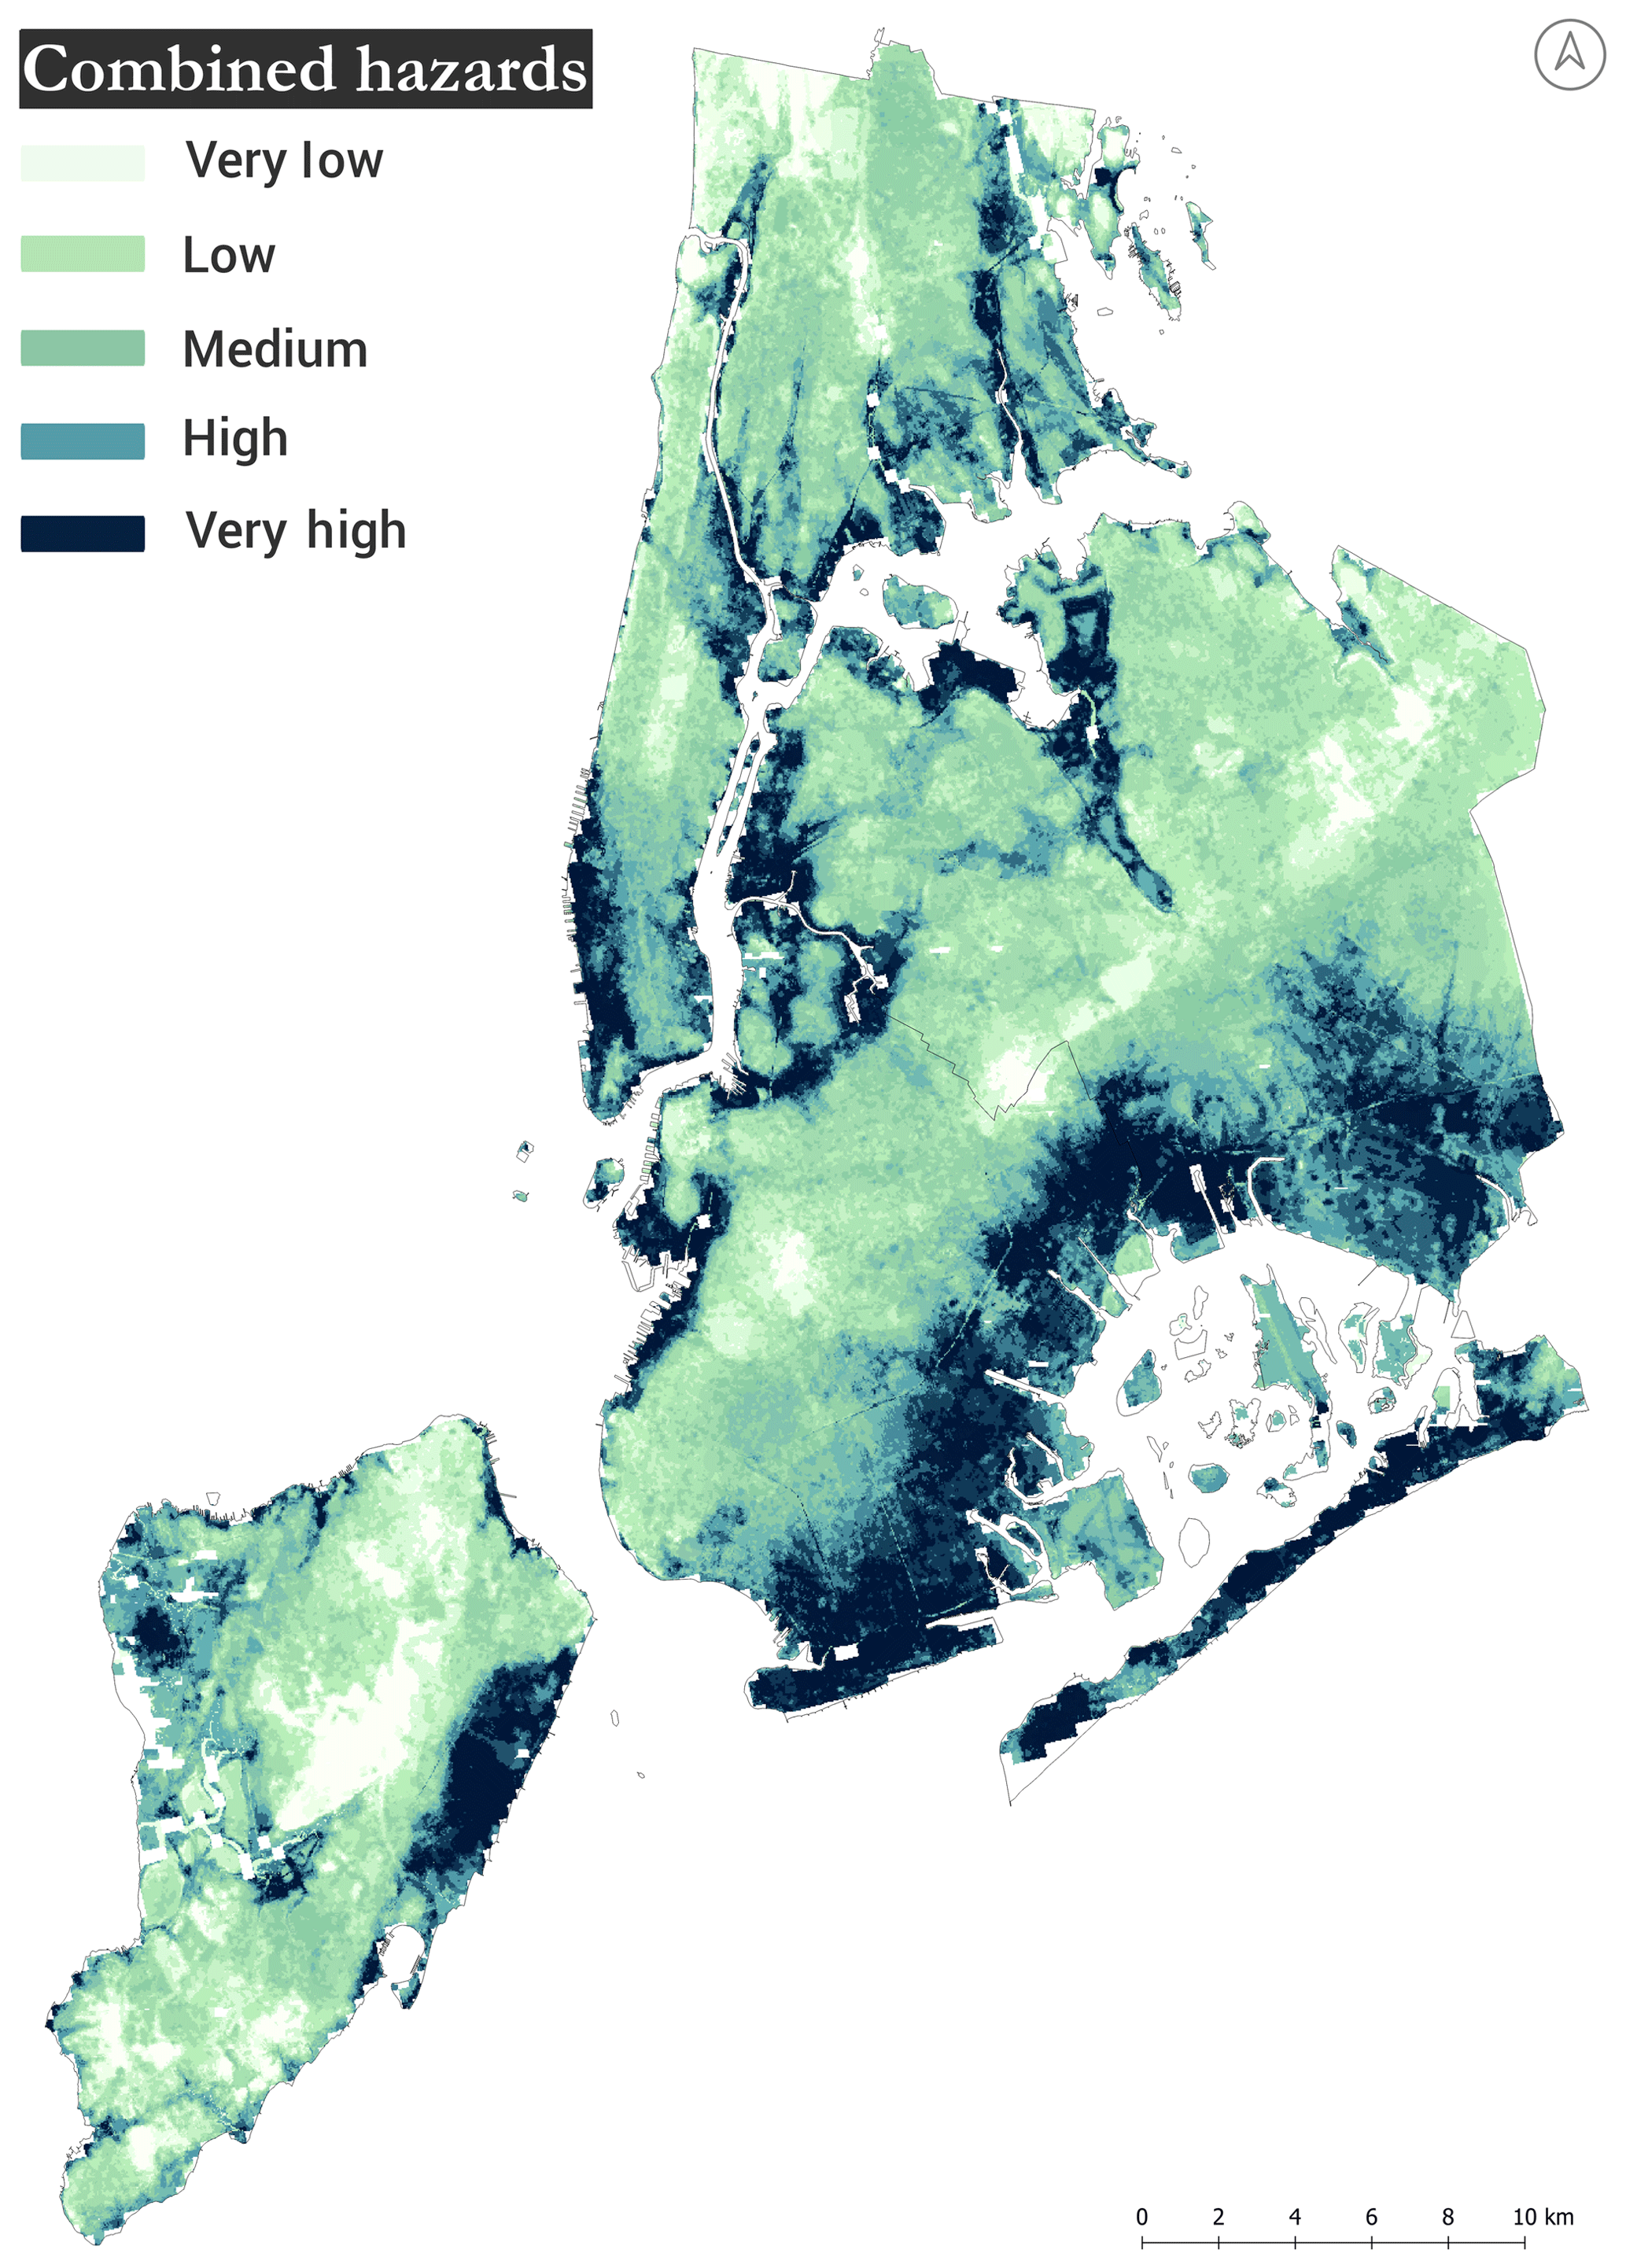
Figure 3Spatial variation in the combined hazards including weights derived through expert input.
Figure 3 displays the joint multi-hazard map with higher intensities in most of the coastal areas. Coastal flooding was assigned a larger weight with respect to the other two hazards based on survey responses, which drives the hotspot analysis somewhat. At present the city is still largely unprepared to cope with flooding and is highly exposed to this type a hazard, a condition that was particularly clear after Hurricane Sandy. Inland flooding was shown to be most intense along the coast, further strengthening the presence of hazards along coastal areas, though modeling is required to better understand the drivers of inland flood hazards and where they are likely to occur in the future.
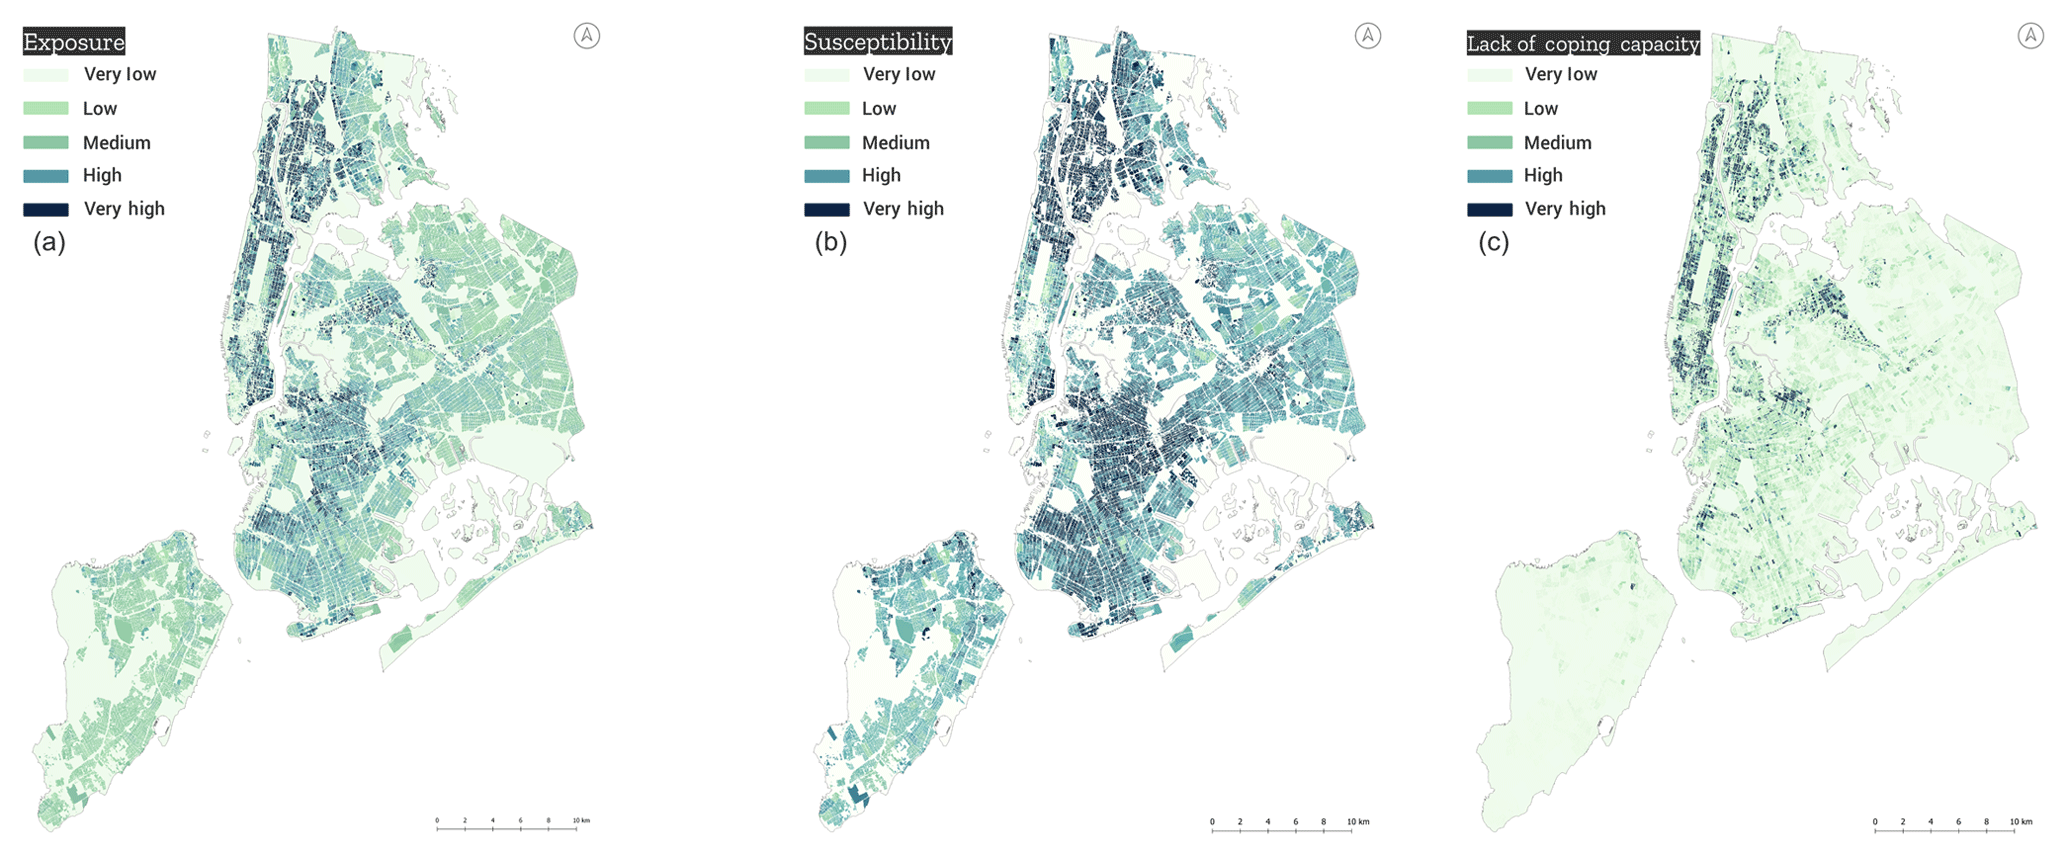
Figure 4Spatial variation in three components of vulnerability (a: exposure, b: susceptibility and c: lack of coping capacity) to multiple hazards.
Figure 4a shows the exposure of the city based on the population. Since Manhattan has the highest density, it is where the highest exposure values are found. Parts of Brooklyn and the Bronx also have high densities but are overall less concentrated than Manhattan. The susceptibility map of the city (Fig. 4b) shows that the most fragile members of the population in socioeconomic terms are in some parts of Brooklyn and the Bronx. As most people living alone are in Manhattan, this area shows higher values of lack of coping capacity, while linguistic isolation (non-English-speaking) explains some lack of coping capacity in parts of Brooklyn and the Bronx (Fig. 4c).
Table 4List of multi-hazard events that the city should adapt to as these could occur in the future.

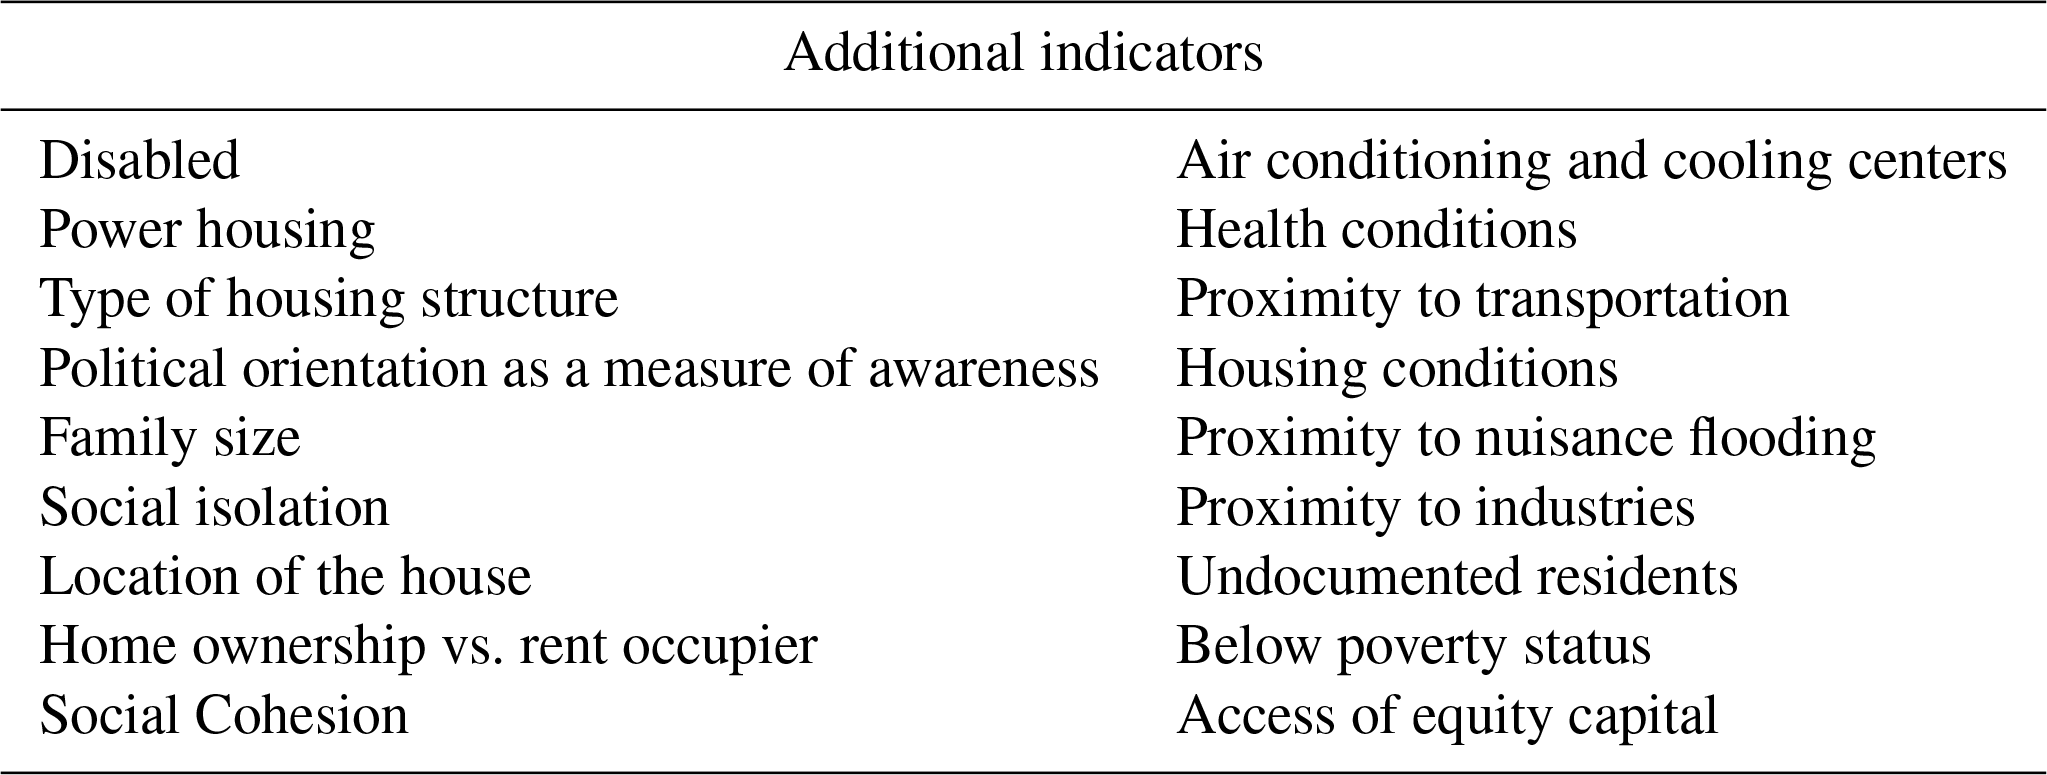
Table 5Indicators that have been suggested by the survey and that could be further integrated in this type of assessment depending on the availability of the data.
The resultant vulnerability map (Fig. 5) shows highly vulnerable populations located mainly in the Bronx, large parts of Brooklyn and some parts of Manhattan (such as Harlem) and Queens. Staten Island appears as the least vulnerable compared to other parts of the city.

The survey's respondents suggested other important indicators that can be considered in a vulnerability assessment (see Table 5). These fall into the categories of indicators that we had to exclude either because they were not directly relevant to the three hazards we focused on jointly, or because data were unavailable at the spatial scale at which we conducted our analysis. Despite their exclusion from the study, we report these results as a useful piece of information for further research.
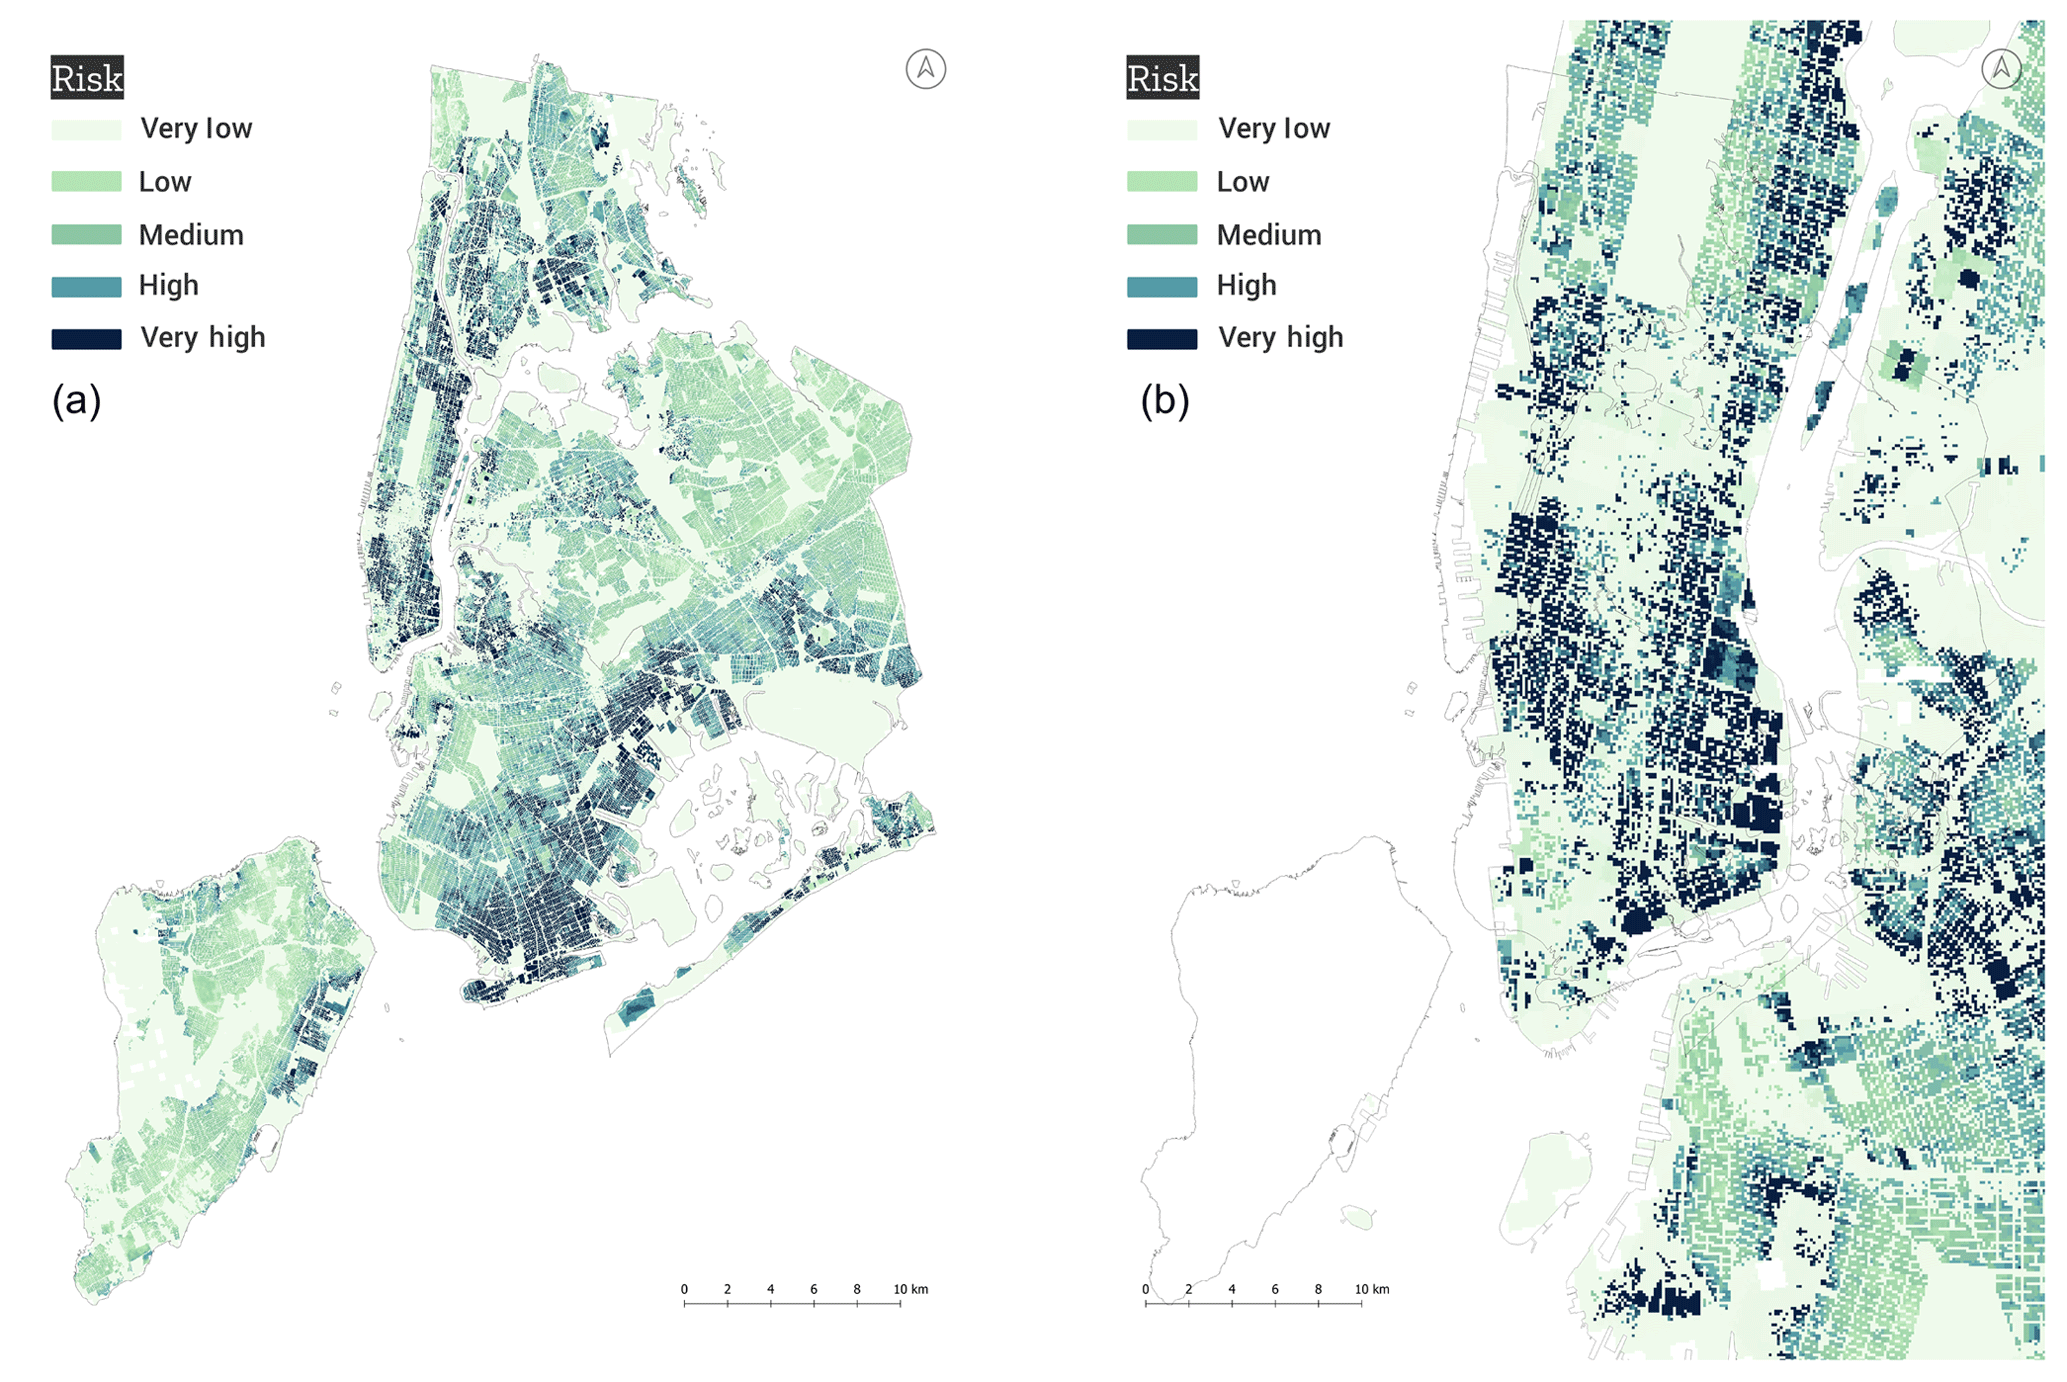
Figure 6Final multi-hazard risk map and detail of the high spatial resolution risk map for Lower Manhattan and parts of Brooklyn. (a) Multi-hazard risk map. (b) Detail of the multi-hazard risk map.
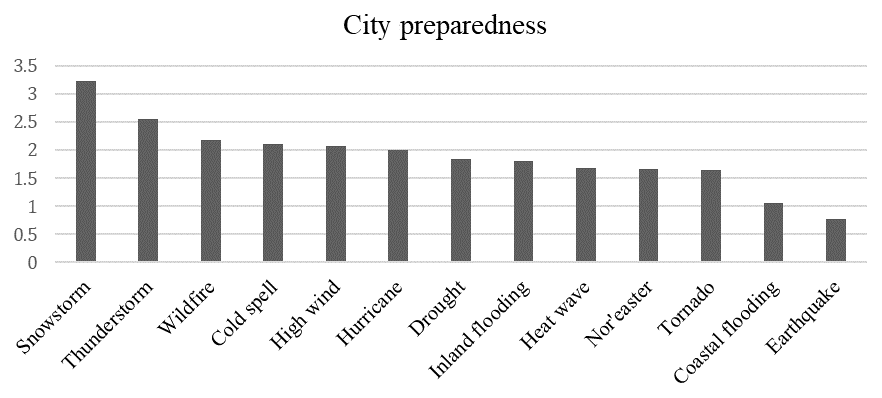
Figure 7Survey results regarding the level of the city's preparedness for impactful hazards potentially affecting NYC out of a maximum of 5 points.
Combining multiple hazards and the vulnerability assessment produced a final multi-hazard risk assessment map at high resolution for NYC (Fig. 6a). We find that the coastal areas of Brooklyn, Manhattan and Harlem are the most at risk from the three hazards considered given the methodological approach and expert input affecting weighted indicators. Figure 6b, shown in detail, demonstrates the relatively high spatial resolution of the analysis and the utility for decision-making for prioritizing investments within neighborhoods and down to the building scale for multi-hazard risk reduction.
Adapting to coastal threats remains a high priority for the city post Sandy, but results here suggest that coastal areas are also at risk from a multi-hazard perspective. This result is further supported from expert input gathered through the survey of local stakeholders who see the city the least prepared to cope with coastal flooding, second only to earthquakes (see Fig. 7). Of note is that some responses appear to be contradictory; e.g., snowstorms are often associated with nor'easters, while hurricanes are associated with coastal flooding with different degrees of preparedness. This inconsistency might be explained by the variety of hazards respondents were asked to assess.
Based on the NOAA NYT qualitative–quantitive assessment of multi-hazard climatic events and the responses from the survey, as well as results from the analysis carried out for a companion study by Depietri and McPhearson (2018), NYC can be described as being at risk from multiple and overlapping hazards, both spatially and temporally. Multi-hazard risk is therefore a reality that is important to further understand and plan for in NYC. We also suggest other similar coastal megacities would benefit from a multi-hazard perspective on planning and policy for climate adaptation and resiliency which integrates context-specific weights based on expert opinions. We focused on heat waves and inland and coastal flooding multi-hazard risks and assess how these are spatially distributed leading to overlapping risks. We find that the hazards considered mainly affect the coastal areas, while the socioeconomic vulnerability is concentrated in central areas of Brooklyn where the poorest segments of the population reside and in the Bronx. Parts of Manhattan are also highly vulnerable, likely due to the concentration of elderly and people living alone in these areas of the city or to the poverty that characterizes certain neighborhoods, such as Harlem. Coastal areas of the city facing the open sea as well as large areas of Manhattan and the Bronx were also the most at risk from the multiple hazards considered. We suggest that adaptation strategies should prioritize these areas. Further soft or hard infrastructures need to be adapted to potential inland flooding and heat waves, for instance through enhanced infiltration and reduction of the UHI by improving the distribution of green infrastructures. No part of the city is totally devoid of potential impacts from these hazards and synergies and trade-offs should be carefully evaluated. Coastal flooding also appears to be one of the hazards the city is least prepared for, followed by heat waves and inland flooding, amongst the hazards considered in this study. Results support current priorities in the city to invest resources to improve coastal areas, such as Jamaica Bay and its remaining wetlands.
The quantitative analysis we conducted principally considered the social aspects of vulnerability and risk. We illustrate that parts of the city potentially affected by multiple hazards do not necessarily correspond to the areas with the highest densities of vulnerable people. A further development of this study could include indicators of infrastructural vulnerability, especially in reference to inland and coastal flood risk. Some of the indicators that could be used to extend this analysis include the conditions of exposed buildings; roads, railroads and the subway system; and other critical infrastructures that supply energy, support communication or treat wastewater.
Multi-hazard risk indicator weights were derived from expert input through a survey methodology in which experts ranked indicators and sub-indicators. This survey approach allowed for the development of an assessment specific to the case of the city of New York. Higher multi-hazard risk in coastal zones is partially driven by weights derived from survey respondents and may depend on the recent awareness raised by disastrous impacts caused by Hurricane Sandy and generally because of the high infrastructural and social impacts these hazards have on the city. We initially calculated risk through all steps described but with equal weighting. The results still showed that the coastal areas of Brooklyn, Harlem and the Bronx were the most at risk to multiple hazards. This suggests that the methodology is robust and would not lead to major changes in the results with a change of weights. However, at the high resolution at which the study is carried out, context-specific weights become important to the overall understanding of risk from multiple hazards.
The choice of the 311 calls to represent inland flooding allowed us to include an element of the disaster scape of NYC which, to the best of our knowledge, has not been explored in previous studies. Despite the potential limitations of the approach, areas identified at high risk of inland flooding due to 311 calls varied little with changes in the classification method. Overall, the methodology can potentially be expanded to accommodate other indicators, for instance to produce hazard-specific vulnerability maps instead of a common assessment. By including a broader range of vulnerability indicators and by conducting hazard-specific vulnerability assessments, each step of the methodology would potentially be reinforced and provide additional insights.
The quantitative aspects of this work also show the significance of every step of the methodology. Each map provides valuable information for the detection of risk in the city beyond the final aggregated risk map. For instance, the maps of the components of vulnerability show that high exposure (or where most of the people are located) does not correspond to areas where people are the most vulnerable. Further, the final risk map, when compared with the combined hazard maps, shows that the main determinant factor of risk is the level of multi-hazard rather than the vulnerability of the population. The detailed spatial resolution of the risk assessment provides decision makers with the possibility to prioritize areas of intervention at high spatial resolution, down to the building and street level at which most planning and development decisions actually occur. The use of context-specific weights allow for differentiation of the role of each hazard and of each indicator in shaping vulnerability and risk in NYC. By considering the three hazards jointly, it is evident that no inhabited area of the city is exempt from risk, and other areas show an accumulation of risk and are thus locations that should be prioritized for adaptation and mitigation interventions.
This study provides a comprehensive assessment of the relevance of a multi-hazard approach in a coastal megacity and its application to three of the main hazards that affect New York City: heat waves, coastal flooding and inland flooding. The results of a NOAA NYT database search and the experts' responses to a questionnaire illustrate the relevance of considering risk in NYC in terms of multi-hazard risk. The quantitative analysis showed that risk to multiple hazards in NYC is mainly driven by the distribution of the hazards rather than by vulnerability. The concentration of people, the susceptibility and the lack of coping capacity play a secondary role in determining risk which is instead dominated by the magnitude and distribution of the hazards combined.
For the three hazards considered, we focus on a significant spatial overlap where hazards and risk exist in the city. The results showed that the city is most at risk in the coastal areas of midtown and downtown Manhattan, Harlem and the coastal areas of Brooklyn, especially those surrounding Jamaica Bay. A predominant role is thus played by coastal flooding. The analysis of these results suggests that decision makers should prioritize strategies that protect the city from coastal flooding while considering at the same time that those areas are also affected by other hazards which should be jointly addressed. These considerations are supported by the responses from the survey that emphasize how the city is little prepared to cope with coastal flooding.
Further research should consider additional indicators of physical vulnerability and cascading effects, provoked by climatological hazards and leading to the failure of critical infrastructures dangerous for human health (e.g., power outages and exposure to toxic substances). We suggest that it is important not only for NYC, but also for other coastal megacities, to adopt a multi-hazard approach to understanding climate-related risk and for designing and prioritizing action to maximize interventions and investments in ways that reduce risk and build resilience to multiple hazards.
US NOAA meteorological data are available at https://www.weather.gov/okx/CentralParkHistorical (last access: 19 December 2018). The New York Times database of articles is available at https://www.nytimes.com/ (last access: 19 December 2018). Landsat imagery is available at https://landsat.usgs.gov/landsat-data-access (last access: 19 December 2018). New York City community air survey data are available at https://data.cityofnewyork.us/Environment/NYCCAS-Air-Pollution-Rasters/q68s-8qxv (DOHMH, 2017). The data on the 311 calls for street and basement flooding are available at https://data.cityofnewyork.us/City-Government/311-Call-Center-Inquiry/tdd6-3ysr (311 NYC, 2018). Worst-case storm surge inundation areas are provided by the NYC Office of Emergency Management (OEM) at https://data.cityofnewyork.us/Public-Safety/Hurricane-Inundation-Zones-Worst-Case/h3ke-x25q (OEM, 2018). Census data at the block level are available at https://www.census.gov/geo/maps-data/data/tiger-line.html (last access: 19 December 2018).
YD designed the research project, designed the approach, and did most of the writing, all in strict collaboration with TM. KD did most of the calculations for the spatial assessment and contributed to the writing.
The authors declare that they have no conflict of interest.
We thank Jaskirat Randhawa for data visualization assistance, Bill Solecki
and Erin Friedman for feedback and local experts for input on weightings. We
also thank two anonymous reviewers for their insightful comments. The
research was supported by the Urban Resilience to Extreme Weather-Related
Events Sustainability Research Network (URExSRN; NSF grant no. SES 1444755)
and through the 2015-2016 BiodivERsA COFUND call for research proposals, with
the following as national funders: the Swedish Research Council for Environment,
Agricultural Sciences, and Spatial Planning; Swedish Environmental Protection
Agency; German Aeronautics And Space Research Centre; National Science Centre
(Poland); the Research Council of Norway; and the Spanish Ministry of Economy and
Competitiveness. Yaella Depietri was partially supported by the Zeff
Fellowship at the Technion – Israel Institute of Technology.
The article processing charges for this open-access
publication were covered by Stockholm University.
Edited by: Sven Fuchs
Reviewed by: two anonymous referees
311 NYC: 311 calls, available at: https://data.cityofnewyork.us/City-Government/311-Call-Center-Inquiry/tdd6-3ysr, last access: 19 December 2018.
Abramson, D. M. and Redlener, I.: Hurricane Sandy: lessons learned, again, Disaster Med. Public Health Prep., 6, 328–329, 2012.
Aerts, J. C. J. H. and Botzen, W. J. W.: Managing exposure to flooding in New York City, Nat. Clim. Change, 2, 377, doi:10.1038/nclimate1487, 2012.
Aerts, J. C. J. H., Lin, N., Botzen, W., Emanuel, K., and de Moel, H.: Low-Probability Flood Risk Modeling for New York City: Low-Probability Flood Risk Modeling for New York City, Risk Anal., 33, 772–788, doi:10.1111/risa.12008, 2013.
Agel, L., Barlow, M., Qian, J.-H., Colby, F., Douglas, E., and Eichler, T.: Climatology of Daily Precipitation and Extreme Precipitation Events in the Northeast United States, J. Hydrometeorol., 16, 2537–2557, doi:10.1175/JHM-D-14-0147.1, 2015.
Anderson, B. and Bell, M.: Heat Waves and Mortality in New York, NY, Epidemiology, 22, S20, doi:10.1097/01.ede.0000391719.31370.34, 2011.
Anderson, G. B. and Bell, M. L.: Lights out: Impact of the August 2003 power outage on mortality in New York, NY, Epidemiol. Camb. Mass, 23, 189–193, doi:10.1097/EDE.0b013e318245c61c, 2012.
Aydi, A., Zairi, M., and Dhia, H. B.: Minimization of environmental risk of landfill site using fuzzy logic, analytical hierarchy process, and weighted linear combination methodology in a geographic information system environment, Environ. Earth Sci., 68, 1375–1389, doi:10.1007/s12665-012-1836-3, 2013.
Bankoff, G., Frerks, G., and Hilhorst, T. (Eds.): Mapping vulnerability: disasters, development, and people, Earthscan Publications, London, Sterling, VA, 2004.
Bernal, G. A., Salgado-Gálvez, M. A., Zuloaga, D., Tristancho, J., González, D., and Cardona, O.-D.: Integration of Probabilistic and Multi-Hazard Risk Assessment Within Urban Development Planning and Emergency Preparedness and Response: Application to Manizales, Colombia, Int. J. Disaster Risk Sci., 8, 270–283, doi:10.1007/s13753-017-0135-8, 2017.
Birkmann, J., Ed.: Measuring vulnerability to natural hazards: towards disaster resilient societies, United Nations University, Tokyo, New York, 2006.
Birkmann, J., Cardona, O. D., Carreño, M. L., Barbat, A. H., Pelling, M., Schneiderbauer, S., Kienberger, S., Keiler, M., Alexander, D., Zeil, P., and Welle, T.: Framing vulnerability, risk and societal responses: the MOVE framework, Nat. Hazards, 67, 193–211, doi:10.1007/s11069-013-0558-5, 2013.
Blake, E. S., Lansea, C. W., and Gibney, E. J.: The deadliest, costliest, and most intense United States Tropical Cyclones from 1851 to 2100 (and other frequently requested Hurricane facts), National Weather Service, National Hurricane Center, Florida, 2011.
Blake, E. S., Kimberlain, T. B., Berg, R. J., Cangialosi, J. P., and Beven, J. L.: Tropical Cyclone Report Hurricane Sandy 22–29 October 2012, National Hurricane Center, Florida, 2013.
Bogardi, J. J. and Birkmann, J.: Vulnerability assessment: the first step towards sustainable risk reduction, in: Disasters and society – from hazard assessment to risk reduction, edited by: Malzahn, D. and Plapp, T., 75–82, Logos Verlag, Berlin, 2004.
Cardona, O. D.: The Need for Rethinking the Concepts of Vulnerability and Risk from a Holistic Perspective: A Necessary Review and Criticism for Effective Risk Management, in: Mapping vulnerability: disasters, development, and people, edited by: Bankoff, G., Frerks, G., and Hilhorst, T., Earthscan Publications, London, Sterling, VA, 2004.
Catalano, A. J. and Broccoli, A. J.: Synoptic Characteristics of Surge-Producing Extratropical Cyclones along the Northeast Coast of the United States, J. Appl. Meteorol. Climatol., 57, 171–184, doi:10.1175/JAMC-D-17-0123.1, 2017.
CDCP: Heat Illness and Death – New York City, 2000–2011, U.S. Department of Health and Human Services, Centers for Disease Control and Prevention, 2013.
Clarke, J. F.: Some effects of the urban structure on heat mortality, Environ. Res., 5, 93–104, doi:10.1016/0013-9351(72)90023-0, 1972.
Colle, B. A., Buonaiuto, F., Bowman, M. J., Wilson, R. E., Flood, R., Hunter, R., Mintz, A., and Hill, D.: New York City's Vulnerability to Coastal Flooding: Storm Surge Modeling of Past Cyclones, B. Am. Meteorol. Soc., 89, 829–841, doi:10.1175/2007BAMS2401.1, 2008.
Collins, T. W.: Marginalization, Facilitation, and the Production of Unequal Risk: The 2006 Paso del Norte Floods, Antipode, 42, 258–288, doi:10.1111/j.1467-8330.2009.00755.x, 2010.
Department of Health and Mental Hygiene (DOHMH): NYCCAS Air Pollution Rasters (2008–2015), available at: https://data.cityofnewyork.us/Environment/NYCCAS-Air-Pollution-Rasters/q68s-8qxv (last access: 20 December 2018), 2017.
Depietri, Y. and McPhearson, T.: Changing urban risk: 140 years of climatic hazards in New York City, Clim. Change, 148, 1–14, doi:10.1007/s10584-018-2194-2, 2018.
Depietri, Y., Renaud, F. G., and Kallis, G.: Heat waves and floods in urban areas: a policy-oriented review of ecosystem services, Sustain. Sci., 7, 95–107, doi:10.1007/s11625-011-0142-4, 2011.
Dickson, E., Baker, J. L., Hoornweg, D., and Asmita, T.: Urban Risk Assessments: An Approach for Understanding Disaster and Climate Risk in Cities, The World Bank, available at: http://elibrary.worldbank.org/doi/book/10.1596/978-0-8213-8962-1 (last access: 11 June 2015), 2012.
D'Ippoliti, D., Michelozzi, P., Marino, C., de'Donato, F., Menne, B., Katsouyanni, K., Kirchmayer, U., Analitis, A., Medina-Ramón, M., Paldy, A., Atkinson, R., Kovats, S., Bisanti, L., Schneider, A., Lefranc, A., Iñiguez, C., and Perucci, C. A.: The impact of heat waves on mortality in 9 European cities: results from the EuroHEAT project, Environ. Health, 9, 37, doi:10.1186/1476-069X-9-37, 2010.
Ellis, F. P., Nelson, F., and Pincus, L.: Mortality during heat waves in New York City July, 1972 and August and September, 1973, Environ. Res., 10, 1–13, doi:10.1016/0013-9351(75)90069-9, 1975.
Forzieri, G., Feyen, L., Russo, S., Vousdoukas, M., Alfieri, L., Outten, S., Migliavacca, M., Bianchi, A., Rojas, R., and Cid, A.: Multi-hazard assessment in Europe under climate change, Clim. Change, 137, 105–119, doi:10.1007/s10584-016-1661-x, 2016.
Frei, A., Kunkel, K. E., and Matonse, A.: The Seasonal Nature of Extreme Hydrological Events in the Northeastern United States, J. Hydrometeorol., 16, 2065–2085, doi:10.1175/JHM-D-14-0237.1, 2015.
Garner, A. J., Mann, M. E., Emanuel, K. A., Kopp, R. E., Lin, N., Alley, R. B., Horton, B. P., DeConto, R. M., Donnelly, J. P., and Pollard, D.: Impact of climate change on New York City's coastal flood hazard: Increasing flood heights from the preindustrial to 2300 CE, P. Natl. Acad. Sci. USA, 114, 201703568, doi:10.1073/pnas.1703568114, 2017.
Gedzelman, S. D., Austin, S., Cermak, R., Stefano, N., Partridge, S., Quesenberry, S., and Robinson, D. A.: Mesoscale aspects of the Urban Heat Island around New York City, Theor. Appl. Climatol., 75, 29–42, doi:10.1007/s00704-002-0724-2, 2003.
Goldman, L., Finkelstein, R., Schafer, P., and Pugh, T.: Resilient Communities: Empowering Older Adults in Disasters and Daily Life, The New York Accademy of Medicine, 2014.
Gornitz, V., Couch, S., and Hartig, E. K.: Impacts of sea level rise in the New York City metropolitan area, Global Planet. Change, 32, 61–88, doi:10.1016/S0921-8181(01)00150-3, 2001.
Graham, S.: Disrupted cities: When infrastructure fails, Routledge, New York, 2010.
Greiving, S.: Multi-risk assessment of Europe's regions, in: Measuring vulnerability to natural hazards: Towards disaster resilient societies, edited by: Birkmann, J., 210–226, 2006.
Greiving, S., Fleischhauer, M., and Lückenkötter, J.: A Methodology for an integrated risk assessment of spatially relevant hazards, J. Environ. Plan. Manag., 49, 1–19, doi:10.1080/09640560500372800, 2006.
Horton, R., Bader, D., Kushnir, Y., Little, C., Blake, R., and Rosenzweig, C.: New York City Panel on Climate Change 2015 Report, Chapter 1: Climate Observations and Projections: NPCC 2015 Report Chapter 1, Ann. NY Acad. Sci., 1336, 18–35, doi:10.1111/nyas.12586, 2015a.
Horton, R., Little, C., Gornitz, V., Bader, D., and Oppenheimer, M.: New York City Panel on Climate Change 2015 Report, Chapter 2: Sea Level Rise and Coastal Storms: NPCC 2015 Report Chapter 2, Ann. NY Acad. Sci., 1336, 36–44, doi:10.1111/nyas.12593, 2015b.
Huang, G., Zhou, W., and Cadenasso, M. L.: Is everyone hot in the city? Spatial pattern of land surface temperatures, land cover and neighborhood socioeconomic characteristics in Baltimore, MD, J. Environ. Manage., 92, 1753–1759, doi:10.1016/j.jenvman.2011.02.006, 2011.
Huang, H., Winter, J. M., Osterberg, E. C., Horton, R. M., and Beckage, B.: Total and Extreme Precipitation Changes over the Northeastern United States, J. Hydrometeorol., 18, 1783–1798, doi:10.1175/JHM-D-16-0195.1, 2017.
Huang, H., Winter, J. M., and Osterberg, E. C.: Mechanisms of Abrupt Extreme Precipitation Change Over the Northeastern United States, J. Geophys. Res.-Atmos., 123, 7179–7192, doi:10.1029/2017JD028136, 2018.
Janke, J. R.: Multicriteria GIS modeling of wind and solar farms in Colorado, Renew. Energy, 35, 2228–2234, doi:10.1016/j.renene.2010.03.014, 2010.
Johnson, K., Depietri, Y., and Breil, M.: Multi-hazard risk assessment of two Hong Kong districts, Int. J. Disaster Risk Reduct., 19, 311–323, doi:10.1016/j.ijdrr.2016.08.023, 2016.
Kappes, M. S., Papathoma-Köhle, M., and Keiler, M.: Assessing physical vulnerability for multi-hazards using an indicator-based methodology, Appl. Geogr., 32, 577–590, doi:10.1016/j.apgeog.2011.07.002, 2012a.
Kappes, M. S., Keiler, M., von Elverfeldt, K., and Glade, T.: Challenges of analyzing multi-hazard risk: a review, Nat. Hazards, 64, 1925–1958, doi:10.1007/s11069-012-0294-2, 2012b.
Kemp, A. C. and Horton, B. P.: Contribution of relative sea-level rise to historical hurricane flooding in New York City, J. Quat. Sci., 28, 537–541, doi:10.1002/jqs.2653, 2013.
Kinney, P. L., Matte, T., Knowlton, K., Madrigano, J., Petkova, E., Weinberger, K., Quinn, A., Arend, M., and Pullen, J.: New York City Panel on Climate Change 2015 Report Chapter 5: Public Health Impacts and Resiliency: NPCC 2015 Report Chapter 5, Ann. NY Acad. Sci., 1336, 67–88, doi:10.1111/nyas.12588, 2015.
Klein Rosenthal, J., Kinney, P. L., and Metzger, K. B.: Intra-urban vulnerability to heat-related mortality in New York City, 1997–2006, Health Place, 30, 45–60, doi:10.1016/j.healthplace.2014.07.014, 2014.
Knighton, J., Steinschneider, S., and Walter, M. T.: A Vulnerability-Based, Bottom-up Assessment of Future Riverine Flood Risk Using a Modified Peaks-Over-Threshold Approach and a Physically Based Hydrologic Model, Water Resour. Res., 53, 10043–10064, doi:10.1002/2017WR021036, 2017.
Knowlton, K., Lynn, B., Goldberg, R. A., Rosenzweig, C., Klein Rosenthal, J., and Kinney, P. L.: Projecting heat-related mortality impacts under a changing climate in the New York City region, Am. J. Public Health, 97, 2028–2034, 2007.
Knutson, T. R., Sirutis, J. J., Zhao, M., Tuleya, R. E., Bender, M., Vecchi, G. A., Villarini, G., and Chavas, D.: Global Projections of Intense Tropical Cyclone Activity for the Late Twenty-First Century from Dynamical Downscaling of CMIP5/RCP4.5 Scenarios, J. Clim., 28, 7203–7224, doi:10.1175/JCLI-D-15-0129.1, 2015.
Kopp, R. E., Horton, R. M., Little, C. M., Mitrovica, J. X., Oppenheimer, M., Rasmussen, D. J., Strauss, B. H., and Tebaldi, C.: Probabilistic 21st and 22nd century sea-level projections at a global network of tide-gauge sites, Earths Future, 2, 383–406, doi:10.1002/2014EF000239, 2014.
Lane, K., Charles-Guzman, K., Wheeler, K., Abid, Z., Graber, N., and Matte, T.: Health Effects of Coastal Storms and Flooding in Urban Areas: A Review and Vulnerability Assessment, J. Environ. Public Health, 2013, 913064, doi:10.1155/2013/913064, 2013.
Lin, N., Emanuel, K. A., Smith, J. A., and Vanmarcke, E.: Risk assessment of hurricane storm surge for New York City, J. Geophys. Res., 115, D18121, doi:10.1029/2009JD013630, 2010.
Lin, N., Emanuel, K., Oppenheimer, M., and Vanmarcke, E.: Physically based assessment of hurricane surge threat under climate change, Nat. Clim. Change, 2, 462–467, doi:10.1038/nclimate1389, 2012.
Lin, N., Kopp, R. E., Horton, B. P., and Donnelly, J. P.: Hurricane Sandy's flood frequency increasing from year 1800 to 2100, P. Natl. Acad. Sci. USA, 113, 12071–12075, doi:10.1073/pnas.1604386113, 2016.
Liu, Z., Nadim, F., Garcia-Aristizabal, A., Mignan, A., Fleming, K., and Luna, B. Q.: A three-level framework for multi-risk assessment, Georisk Assess. Manag. Risk Eng. Syst. Geohazards, 9, 59–74, doi:10.1080/17499518.2015.1041989, 2015.
Llyod, E. and Licata, A.: One New York City: One Water, Sustainable water managemnet for New York City's people and environment., n.d.
Lozoya, J. P., Sardá, R., and Jiménez, J. A.: A methodological framework for multi-hazard risk assessment in beaches, Environ. Sci. Policy, 14, 685–696, doi:10.1016/j.envsci.2011.05.002, 2011.
Luber, G. and McGeehin, M.: Climate Change and Extreme Heat Events, Am. J. Prev. Med., 35, 429–435, doi:10.1016/j.amepre.2008.08.021, 2008.
MA: Ecosystems and human well-being: current state and trends: findings of the Condition and Trends Working Group of the Millennium Ecosystem Assessment, Island Press, Washington, DC, 2005.
Madrigano, J., Ito, K., Johnson, S., Kinney, P. L., and Matte, T.: A Case-Only Study of Vulnerability to Heat Wave–Related Mortality in New York City (2000–2011), Environ. Health Perspect., 123, 672–678, doi:10.1289/ehp.1408178, 2015.
Mennis, J. and Hultgren, T.: Intelligent Dasymetric Mapping and Its Application to Areal Interpolation, Cartogr. Geogr. Inf. Sci., 33, 179–194, doi:10.1559/152304006779077309, 2006.
Michael, E. A. and Samanta, S.: Landslide vulnerability mapping (LVM) using weighted linear combination (WLC) model through remote sensing and GIS techniques, Model. Earth Syst. Environ., 2, 88, doi:10.1007/s40808-016-0141-7, 2016.
Nicholls, R. J. and Small, C.: Improved estimates of coastal population and exposure to hazards released, Eos Trans. Am. Geophys. Union, 83, 301, doi:10.1029/2002EO000216, 2002.
NYC: Deaths Associated with Heat Waves in 2006, Special Report, New York City Department of Health and Mental Hygiene, 2006.
NYC: NYC green infrastructure plan: A sustainable strategy for clean waterways, City of New York, New York, USA, 2010.
NYC: A stronger more resilient New York, The City of New York, 2013.
NYC: Heat-related Deaths in New York City, 2013, New York City Department of Health and Mental Hygiene, 2014.
OEM: Worst-case storm surge inundation areas, available at: https://data.cityofnewyork.us/Public-Safety/Hurricane-Inundation-Zones-Worst-Case/h3ke-x25q, last access: 19 December 2018.
Oliver-Smith, A.: Theorizing vulnerability in a globalized world: a political ecological perspective, in: Mapping vulnerability: disasters, development and people, edited by: Bankoff, G., Frerks, G., and Hilhorst, D., 10–24, Earthscan, London, 2004.
Orton, P., Georgas, N., Blumberg, A., and Pullen, J.: Detailed modeling of recent severe storm tides in estuaries of the New York City region, J. Geophys. Res.-Oceans, 117, C09030, doi:10.1029/2012JC008220, 2012.
Oudin Åström, D., Bertil, F., and Joacim, R.: Heat wave impact on morbidity and mortality in the elderly population: A review of recent studies, Maturitas, 69, 99–105, doi:10.1016/j.maturitas.2011.03.008, 2011.
Pelling, M.: The Vulnerability of Cities: Natural Disasters and Social Resilience, Earthscan, London, 2003.
Pelling, M. and Blackburn, S. (Eds.): Megacities and the coast: risk, resilience, and transformation, Routledge/Taylor & Francis Group, London, New York, 2013.
Petkova, E. P., Gasparrini, A., and Kinney, P. L.: Heat and Mortality in New York City Since the Beginning of the 20th Century, Epidemiology, 25, 554–560, doi:10.1097/EDE.0000000000000123, 2014.
Philippi, C.: Megacities Pushing the Boundaries of our Industry, Risk trends and insurance challenges, Allianz Global Corporate & Specialty, Munich, 2016.
Reed, A. J., Mann, M. E., Emanuel, K. A., Lin, N., Horton, B. P., Kemp, A. C., and Donnelly, J. P.: Increased threat of tropical cyclones and coastal flooding to New York City during the anthropogenic era, P. Natl. Acad. Sci. USA, 112, 12610–12615, doi:10.1073/pnas.1513127112, 2015.
Rosenzweig, C. and Solecki, W.: New York City Panel on Climate Change 2015 Report Introduction: NPCC 2015 Report Introduction, Ann. NY Acad. Sci., 1336, 3–5, doi:10.1111/nyas.12625, 2015.
Rosenzweig, C., Gaffin, S., and Parshall, L. (Eds.): Green Roofs in the New York Metropolitan Region, Research Report, Columbia University Centre for Climate Systems Reserach and NASA Goddard Institute for Space Studies, New York, 2006.
Rosenzweig, C., Solecki, W. D., Blake, R., Bowman, M., Faris, C., Gornitz, V., Horton, R., Jacob, K., LeBlanc, A., Leichenko, R., Linkin, M., Major, D., O'Grady, M., Patrick, L., Sussman, E., Yohe, G., and Zimmerman, R.: Developing coastal adaptation to climate change in the New York City infrastructure-shed: process, approach, tools, and strategies, Clim. Change, 106, 93–127, doi:10.1007/s10584-010-0002-8, 2011.
Saisana, M. and Tarantola, S.: State-of-the-art report on current methodologies and practices for composite indicator development, Citeseer, Ispra, 2002.
Schoof, J. T. and Robeson, S. M.: Projecting changes in regional temperature and precipitation extremes in the United States, Weather Clim. Extrem., 11, 28–40, doi:10.1016/j.wace.2015.09.004, 2016.
Schuman, S. H.: Patterns of urban heat-wave deaths and implications for prevention: Data from New York and St. Louis during July, 1966, Environ. Res., 5, 59–75, doi:10.1016/0013-9351(72)90020-5, 1972.
Smith, J. A., Villarini, G., and Baeck, M. L.: Mixture Distributions and the Hydroclimatology of Extreme Rainfall and Flooding in the Eastern United States, J. Hydrometeorol., 12, 294–309, doi:10.1175/2010JHM1242.1, 2010.
Smith, M. J., Goodchild, M. F., and Longley, P. A.: Geospatial Analysis: A Comprehensive Guide to Principles, Techniques and Software Tools, 2nd edn., Matador, Leicester, 2007.
Talke, S. A., Orton, P., and Jay, D. A.: Increasing storm tides in New York Harbor, 1844–2013, Geophys. Res. Lett., 41, 3149–3155, doi:10.1002/2014GL059574, 2014.
Towey, K. L., Booth, J. F., Frei, A., and Sinclair, M. R.: Track and Circulation Analysis of Tropical and Extratropical Cyclones that Cause Strong Precipitation and Streamflow Events in the New York City Watershed, J. Hydrometeorol., 19, 1027–1042, doi:10.1175/JHM-D-17-0199.1, 2018.
Turner, B. L., Kasperson, R. E., Matson, P. A., McCarthy, J. J., Corell, R. W., Christensen, L., Eckley, N., Kasperson, J. X., Luers, A., Martello, M. L., Polsky, C., Pulsipher, A., and Schiller, A.: A framework for vulnerability analysis in sustainability science, P. Natl. Acad. Sci. USA, 100, 8074–8079, doi:10.1073/pnas.1231335100, 2003.
UN: Johannesburg Declaration on Sustainable Development, Plan of Implementation of the World Summit on Sustainable Development, United Nations; World Summit on Sustainable Development (UN), 2002.
UNDESA: The World's Cities in 2016: Data Booklet, United Nations, Department of Economic and Social Affairs, Population Division, New York, NY, 2016.
UNEP: Agenda 21, Tech. rep., United Nations Environment Programme, 1992.
UNISDR: Hyogo Declaration, 2005.
UNISDR: Global Assessment Report on Disaster Risk Reduction. Making Development Sustainable: The future of Disasster Risk Management, United Nations Office for Disaster Risk Reduction (UNISDR), Geneva, Switzerland, 2015.
van Westen, C. J., Montoya, L., Boerboom, L., and Badilla Coto, E.: Multi-hazard risk assessment using GIS in urban areas: a case study for the city of Turrialba, Costa Rica, 120–136, Bali Indonesia, 2002.
Welle, T. and Birkmann, J.: The World Risk Index – An Approach to Assess Risk and Vulnerability on a Global Scale, J. Extreme Events, 2, 1550003, doi:10.1142/S2345737615500037, 2015.
Wipulanusat, W., Nakrod, S., and Prabnarong, P.: Multi-hazard Risk Assessment Using GIS and RS Applications: A Case Study of Pak Phanang Basin, Walailak J. Sci. Technol., 6, 109–125, https://doi.org/10.2004/wjst.v6i1.76, 2011.
Wisner, B., Blaikie, P., Cannon, T., and Davis, I.: At risk: Natural Hazards, People's Vulnerability and Disasters, Routledge, London, 2014.
Zhou, S., Chen, G., Fang, L., and Nie, Y.: GIS-Based Integration of Subjective and Objective Weighting Methods for Regional Landslides Susceptibility Mapping, Sustainability, 8, 334, doi:10.3390/su8040334, 2016.