the Creative Commons Attribution 3.0 License.
the Creative Commons Attribution 3.0 License.
Active tectonics of the onshore Hengchun Fault using UAS DSM combined with ALOS PS-InSAR time series (Southern Taiwan)
Benoit Deffontaines
Johann Champenois
Kuan-Chuan Lin
Chyi-Tyi Lee
Rou-Fei Chen
Jyr-Ching Hu
Samuel Magalhaes
Characterizing active faults and quantifying their activity are major concerns in Taiwan, especially following the major Chichi earthquake on 21 September 1999. Among the targets that still remain poorly understood in terms of active tectonics are the Hengchun and Kenting faults (Southern Taiwan). From a geodynamic point of view, the faults affect the outcropping top of the Manila accretionary prism of the Manila subduction zone that runs from Luzon (northern Philippines) to Taiwan. In order to better locate and quantify the location and quantify the activity of the Hengchun Fault, we start from existing geological maps, which we update thanks to the use of two products derived from unmanned aircraft system acquisitions: (1) a very high precision (< 50 cm) and resolution (< 10 cm) digital surface model (DSM) and (2) a georeferenced aerial photograph mosaic of the studied area. Moreover, the superimposition of the resulting structural sketch map with new Persistent Scatterer Interferometric Synthetic Aperture Radar (PS-InSAR) results obtained from PALSAR ALOS images, validated by Global Positioning System (GPS) and leveling data, allows the characterization and quantification of the surface displacements during the monitoring period (2007–2011). We confirm herein the geometry, characterization and quantification of the active Hengchun Fault deformation, which acts as an active left-lateral transpressive fault. As the Hengchun ridge was the location of one of the last major earthquakes in Taiwan (26 December 2006, depth: 44 km, ML= 7.0), Hengchun Peninsula active tectonics must be better constrained in order if possible to prevent major destructions in the near future.


The island of Taiwan is the location of the rapid NW–SE-trending oblique convergence of the Eurasian and Philippine sea plates (e.g., Ho, 1986, 1988). A southwest propagation of the deformation in Taiwan was proposed by Suppe (1981, 1984). It has been confirmed by continuous GPS measurements that highlight displacements in Southern Taiwan of about 60 mm yr−1 (e.g., Yu et al., 1997). This local shortening rate is the maximum range in the world. We focus on the Southern Taiwan area (Hengchun Peninsula) that is geodynamically interpreted as the Taiwan incipient collision zone (Lallemand et al., 2001, Fig. 1), which is the transition of the Manila subduction area toward onshore Taiwan collision. The Hengchun Peninsula is situated at the summit of the outcropping onshore Manila accretionary prism (Malavieille et al., 2002; Chang et al., 2003).
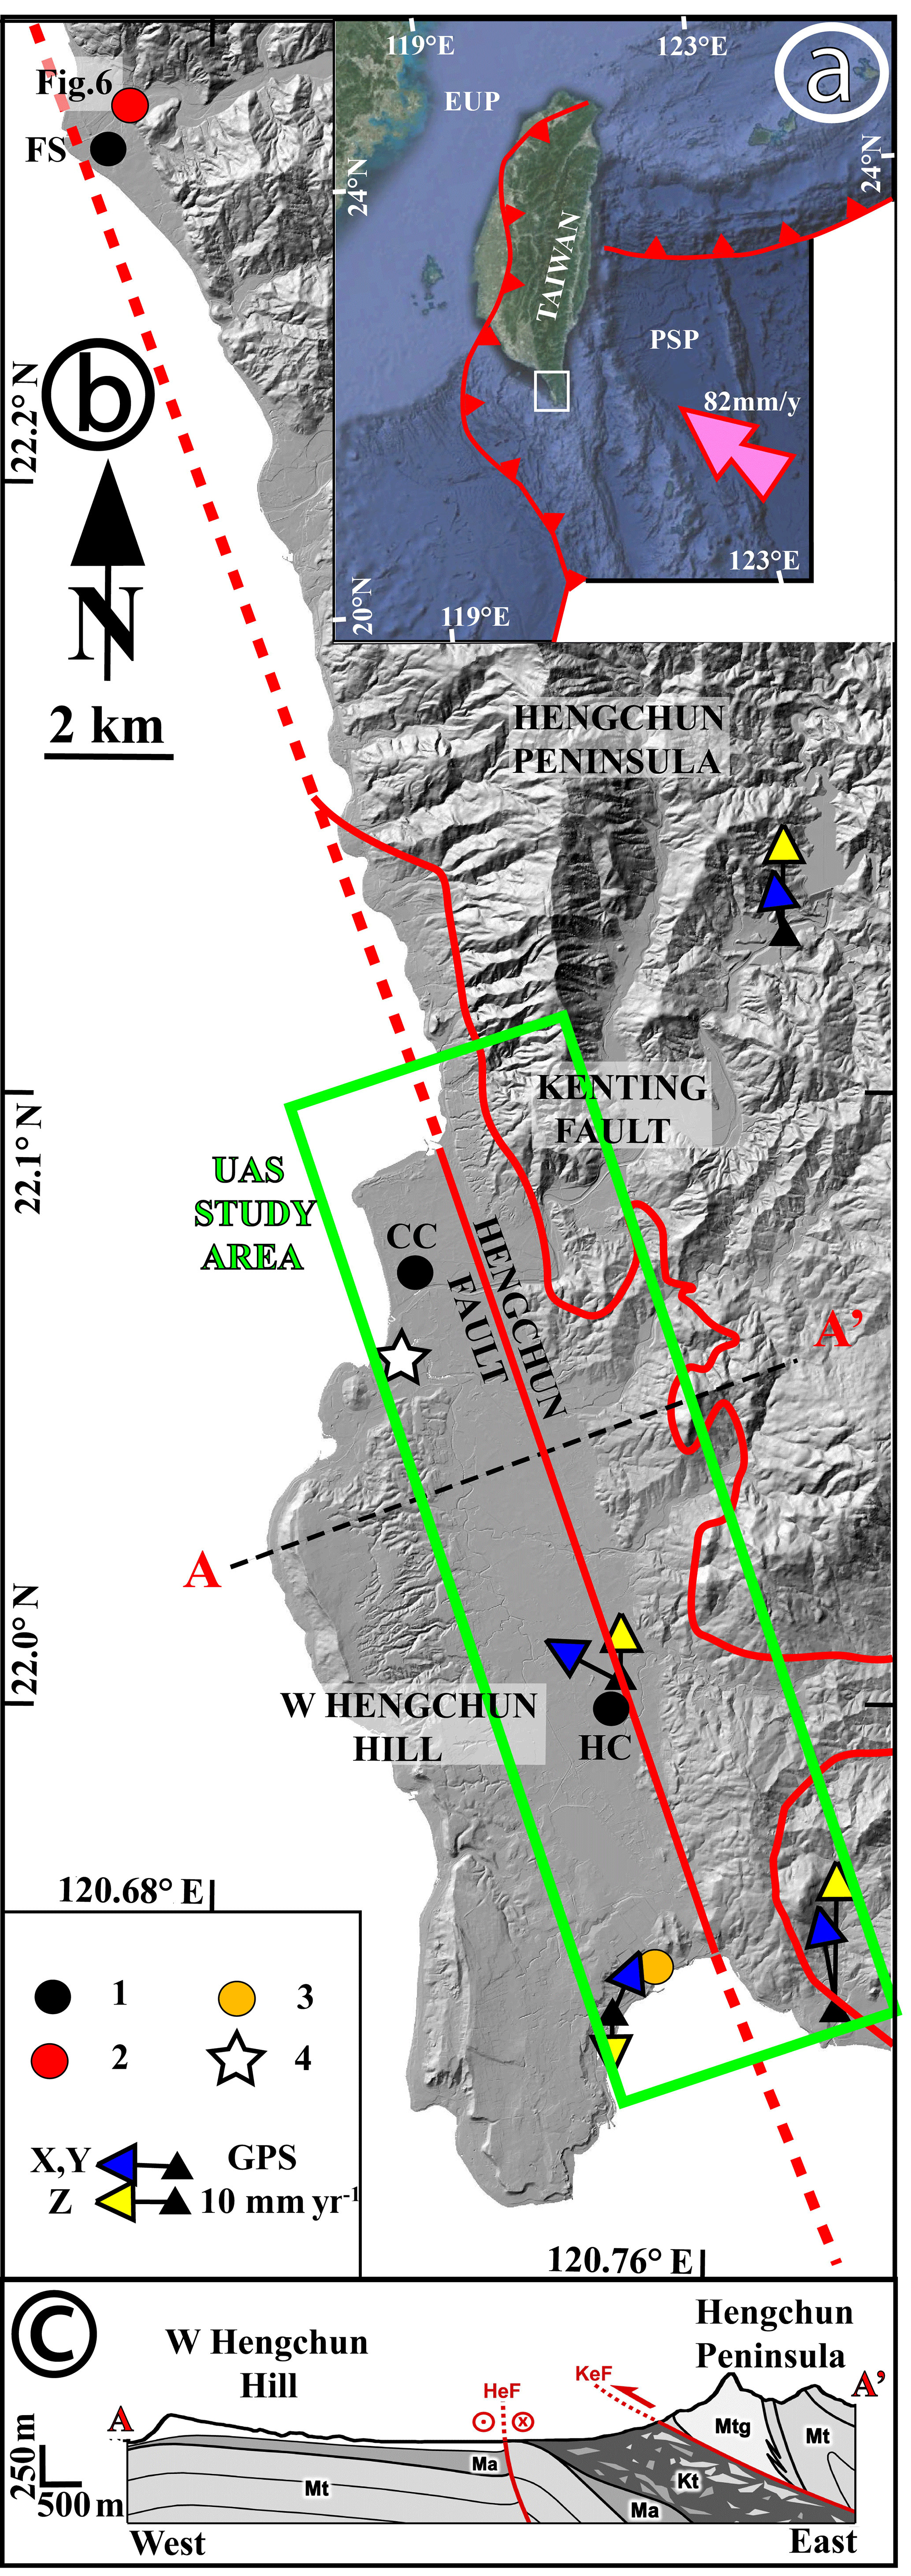
Figure 1Location of the Hengchun and Kenting faults within Southern Taiwan. (a) Location of the Hengchun Peninsula (modified from Google Earth; studied area: white quadrangle; EUP: Eurasian Plate; PSP: Philippine Sea Plate). The rate convergence of the Philippine Sea Plate toward Eurasia is 82 mm yr−1 (Yu et al. 1997). (b) Western Hengchun Peninsula hill shade from the 5 m ground-resolution digital terrain model: the heavy red lines are Hengchun and Kenting faults (modified from Sung, 1991, and Chang et al., 2009b). The black triangles are GPS stations; blue and yellow arrows represent horizontal and vertical GPS displacements, respectively; and the green quadrangle corresponds to the UAS-monitored area. A–A' is the location of the (c) W–E-trending synthetic geological cross section (modified from Chang et al., 2009b; Zhang et al., 2016). Ma: Ma'anshan formation; Mt and Mtg: different facies of Mutan formation (Mtg: Loshui sandstone; CGS geological map); HcL: Hengchun limestone; Al: Alluvial deposits; KeM: Kenting Mélange; HeF: Hengchun Fault; KeF: Kenting Fault. (1) Black circles are cities (CC: Checheng; HC: Hengchun; FS: Fang-Shan); (2) red circle is the location of photograph in Fig. 6); (3) orange circle is the Nuclear Power Plant No. 3; (4) white star is the GPS ground fixed station GS59 and base of this PS-InSAR data set. The fault displacements come from Chang et al. (2003).
This is a geologically complex area, as its lithology is composed of both soft folded turbidites (Mutan formation) and the Kenting Mélange, situated close to the Hengchun Fault zone (Fig. 1) and composed of highly deformed shales and large blocks of various lithologies. Evidence of this structural complexity are the five different 1∕50 000 scale geological maps (Huang et al., 1997, 2006; Chang et al., 2003, 2009b; Zhang et al., 2016) that have been drawn independently and that are geologically incompatible. Two different major NNW–SSE-trending fault zones (Hengchun and Kenting faults) are parallel to the eastern side of the 15 km long Hengchun Valley and have been recognized by previous authors as potentially active (e.g., Huang et al., 1997, 2006; Chang, et al., 2003, 2009a). In addition, these two faults affect soft, muddy and alluvial deposits and classical microtectonics; structural studies are impossible as there is no clear preserved fault plane and it is impossible to get any tectonic markers. As the Hengchun Peninsula is the location of sensitive structures, such as the Taipower Nuclear Power Plant No. 3 (Maanshan Nuclear Power Plant), it is a major concern to better decipher the neotectonics and the active tectonics of the area. Consequently, we address in this paper an indirect approach using an unmanned aircraft system (UAS), a digital elevation model (DEM), structural photointerpretation and quantitative measurements in order to locate, characterize and quantify the active deformation of the Hengchun Fault.
Below, we first focus on the inputs of a high-resolution DEM and the orthorectified images of the Hengchun Fault zone acquired from UAS in order to locate active faults. From a terminological point of view, we used a UAS, which encompasses all the aspects of deploying those aircrafts and is less restrictive than an unmanned aerial vehicle (UAV), which corresponds only to the platform itself. Then, following the classical photointerpretation techniques (e.g., Deffontaines et al., 1991), we carefully mapped and interpreted the new morphostructures in terms of geological mapping, revealing the active tectonic structures using a high-resolution and high-precision UAS digital surface model (DSM). In order to characterize and quantify their tectonic activity, we benefit from Persistent Scatterer Interferometry Synthetic Aperture Radar (PS-InSAR hereafter) results derived from ALOS radar images that give us the active interseismic displacement along the line of sight (LOS) of the radar through the 2007–2011 period. The latter is validated by two E–W-trending precise leveling lines across the Hengchun Fault and a few GPS stations (see Academia Sinica GPS, 2018, with a reference line in between Taipei and the Penghu Island) that give the local vertical and absolute 3-D displacements, respectively. Finally, the discussion leads us to propose a simple geodynamic and active tectonic model for the Hengchun Fault that fits with all the available data.
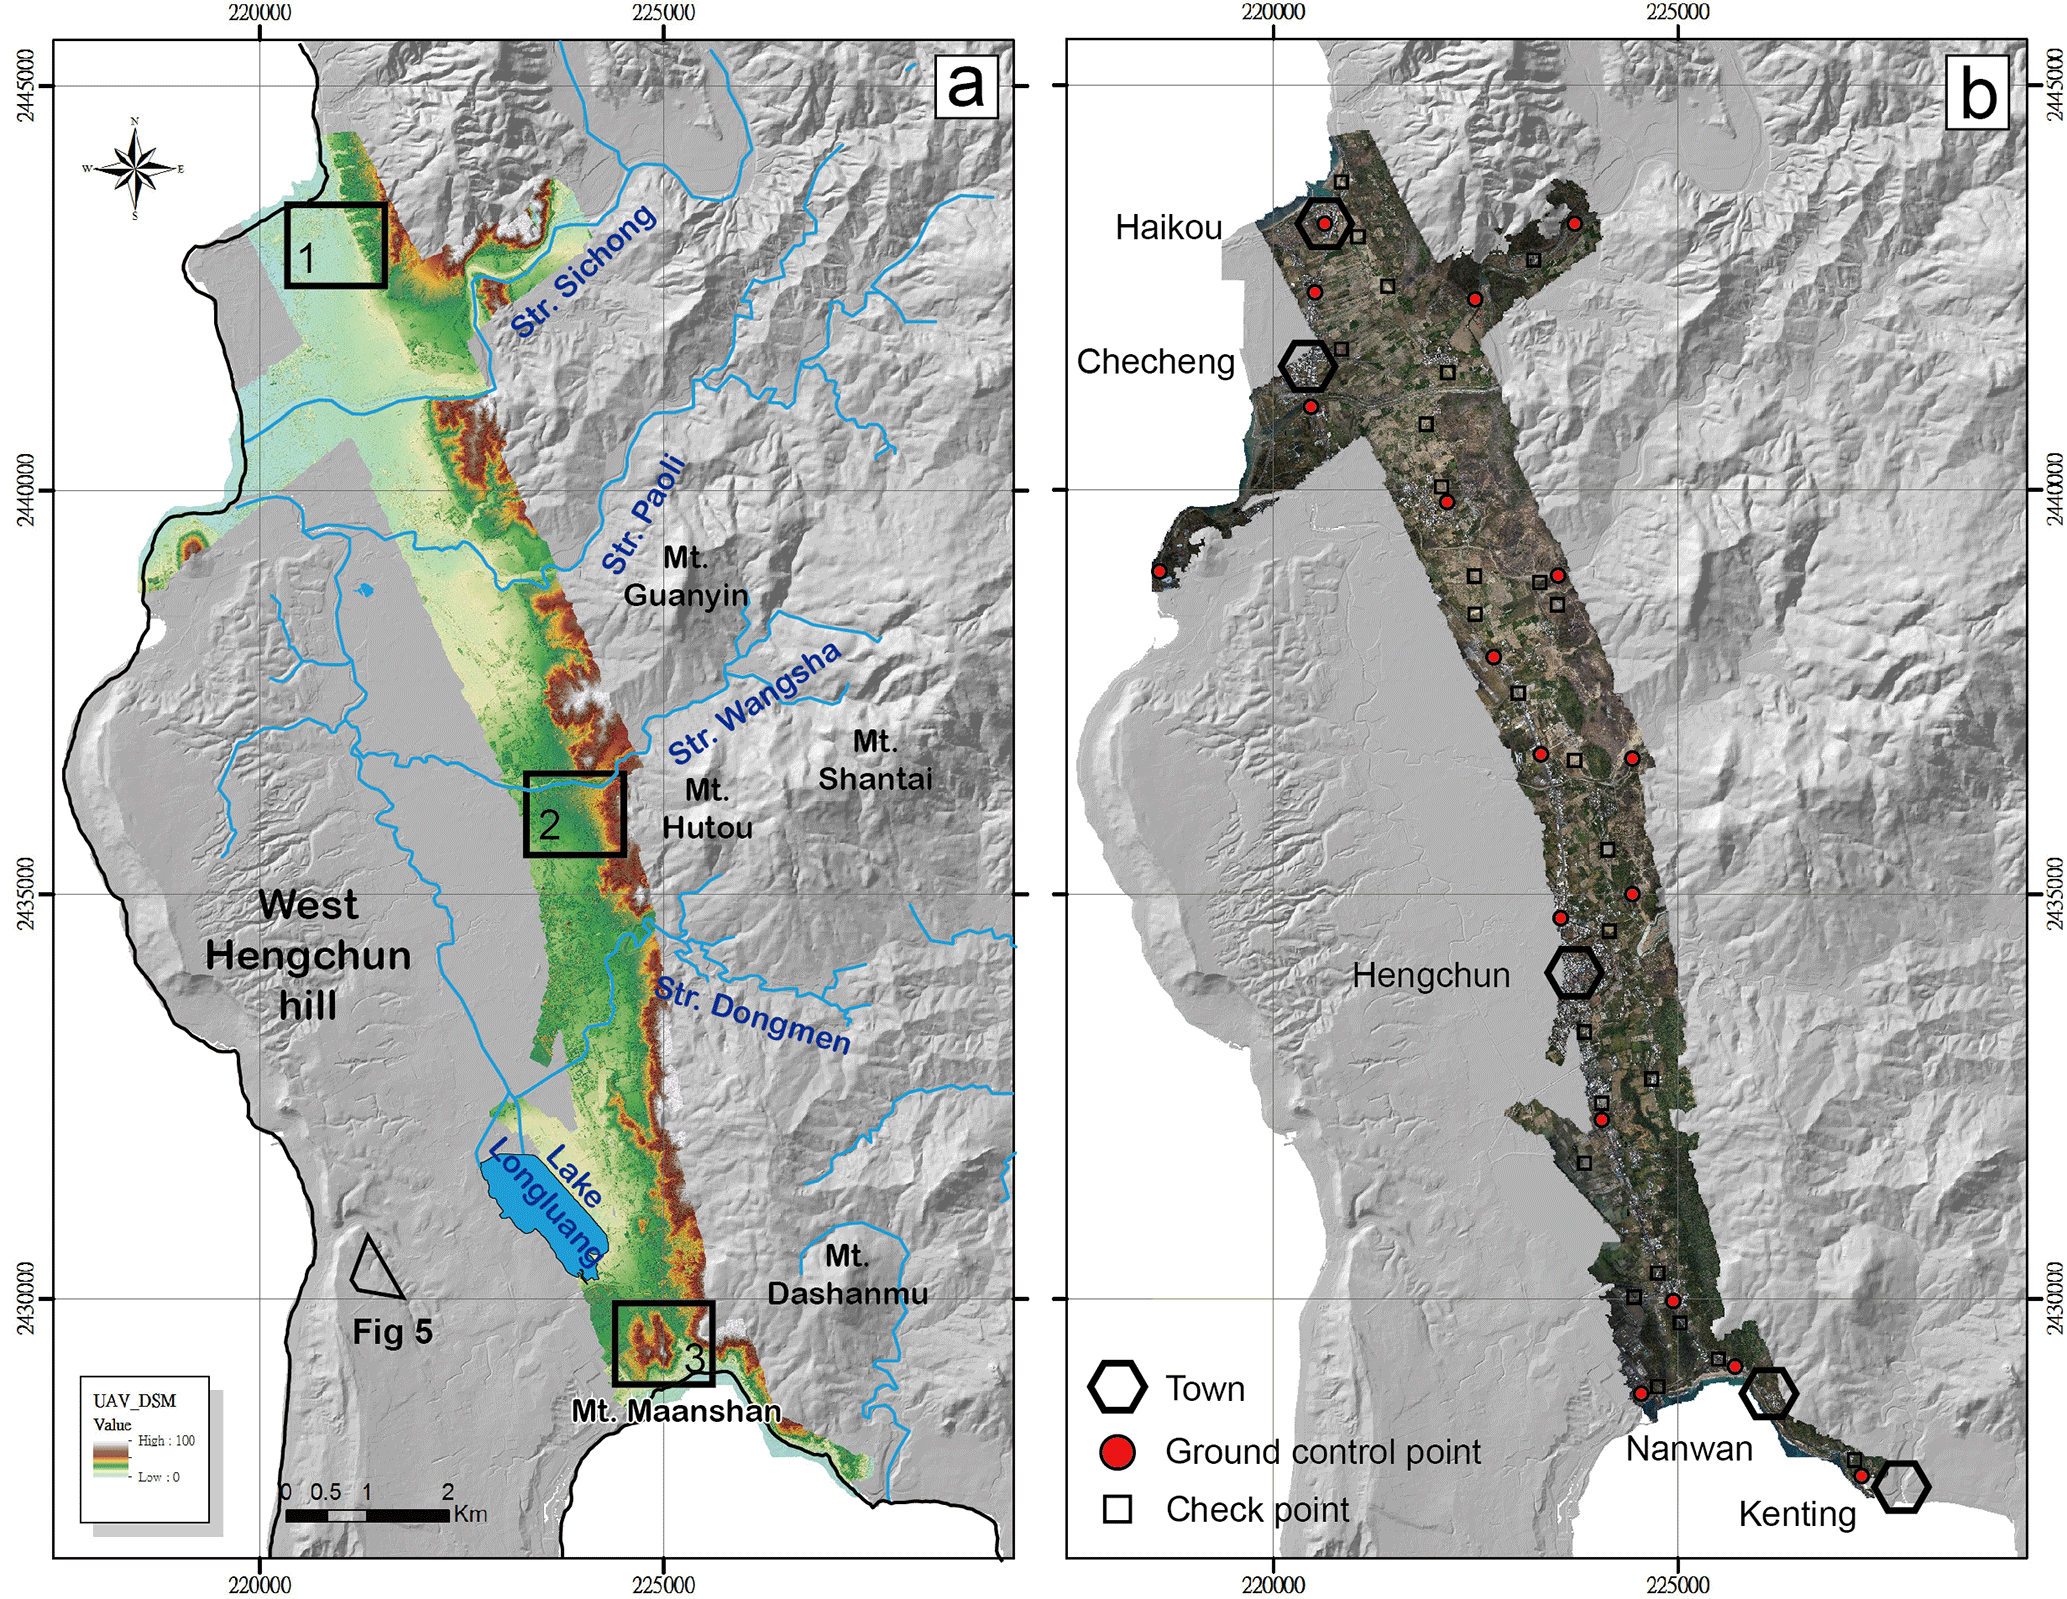
Figure 2(a) UAS digital terrain model (DTM) and (b) mosaic of orthorectified images. The black hexagons, red circles and rectangles indicate cities, ground control points and check points, respectively. One may notice the contrasting relief on both sides of the Hengchun Valley: its western flank is a homogenous structural surface slightly dipping east, in contrast with the highly eroded eastern part. For both (a) and (b), the black and white hill-shade DTMs correspond to a part of the 5 m ground-resolution Taiwan DTM.
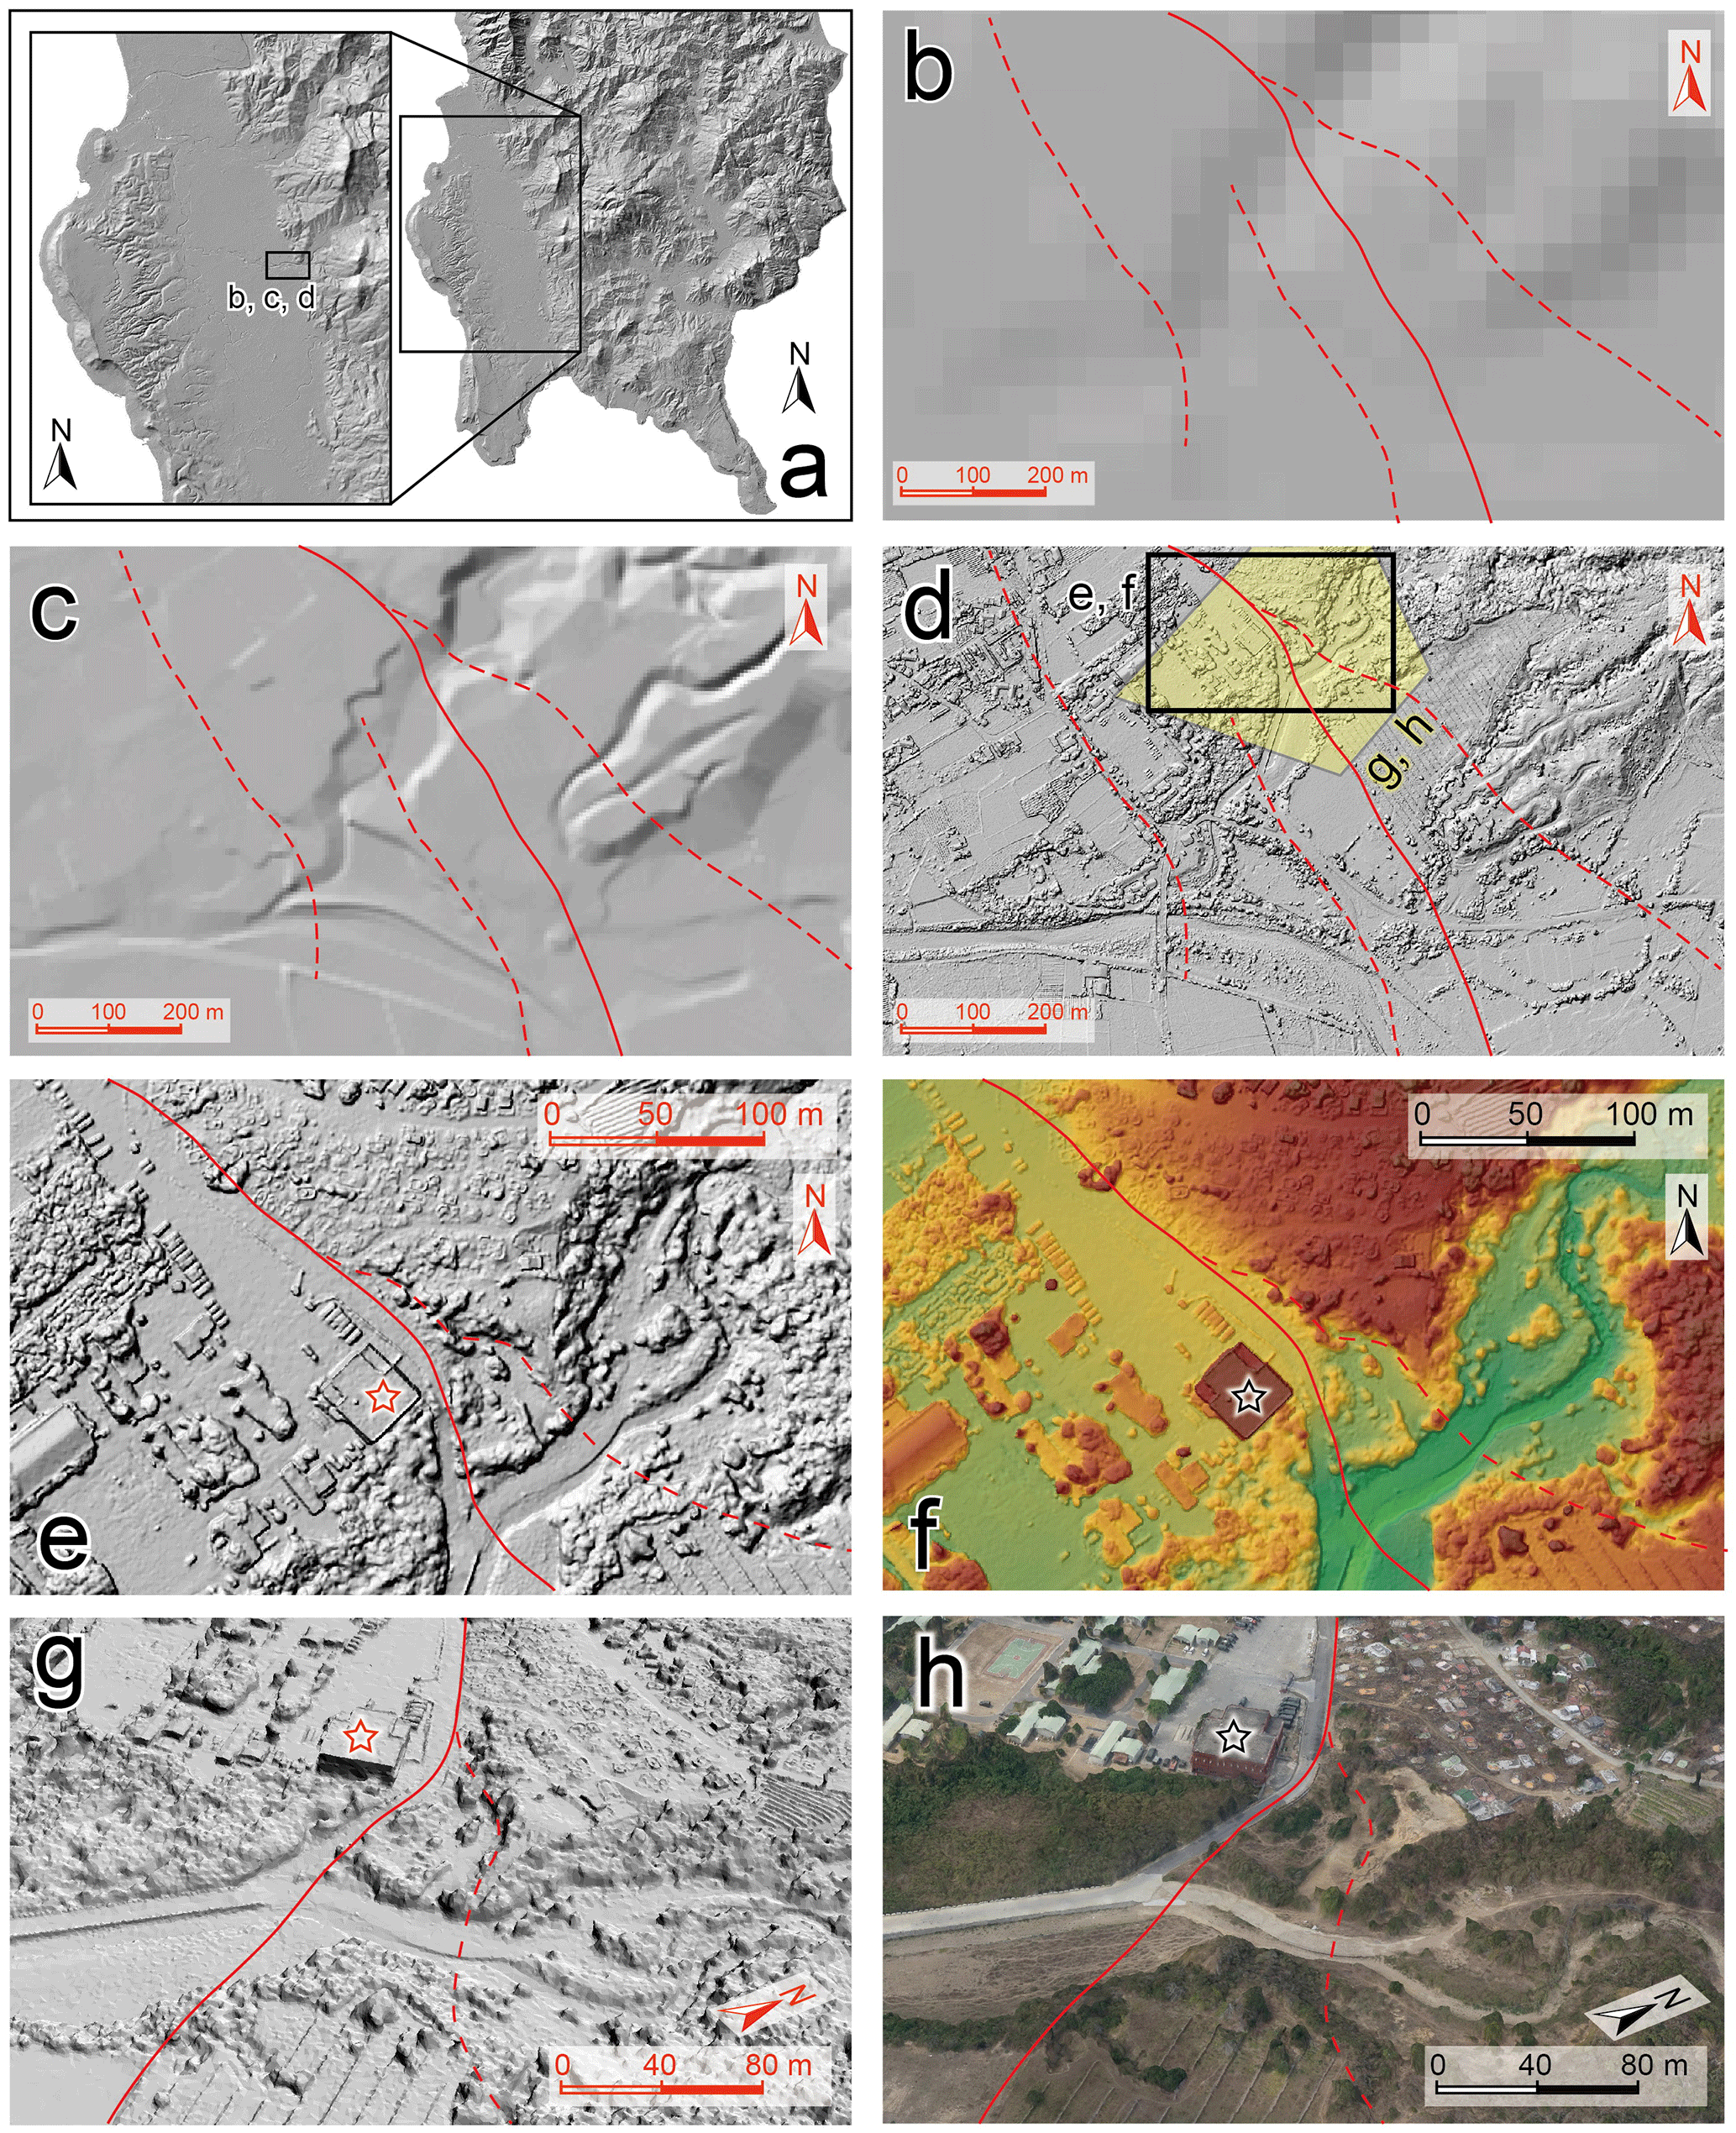
Figure 3Comparisons of topographic digital data sets for the same area acquired from different sources, including 40 m DTM, 5 m DEM and 0.13 m UAS DSM. Heavy and dashed (inferred) red lines correspond to fault lines. (a) Location of the data set of panels (b, c, d); (b) 40 m resolution DTM commonly used in Taiwan; (c) 5 m resolution DEM generated in 2003; (d) 0.13 m resolution UAS-derived DSM generated in this study. There are great differences in the quality of the different digital topography. Panels (e) and (f) highlight different parts of the UAS DSM: (e) enlargement of the hill-shaded UAS DSM, (f) enlargement of color-shaded UAS DSM, (g) side view of the hill-shaded true 3-D model and (h) side view of the image draped onto the true 3-D model (g). The side views of panels (g) and (h) are captured at the same position and orientation. The star indicates the same building shown in panels (f), (g) and (h). The locations of panels (b), (c) and (d) are indicated in panels (a), whereas panels (e) and (f) are indicated in panel (d). One can see the quality of the newly acquired UAS DSM that enable us to photointerpret precisely the location of the geology and the faults.
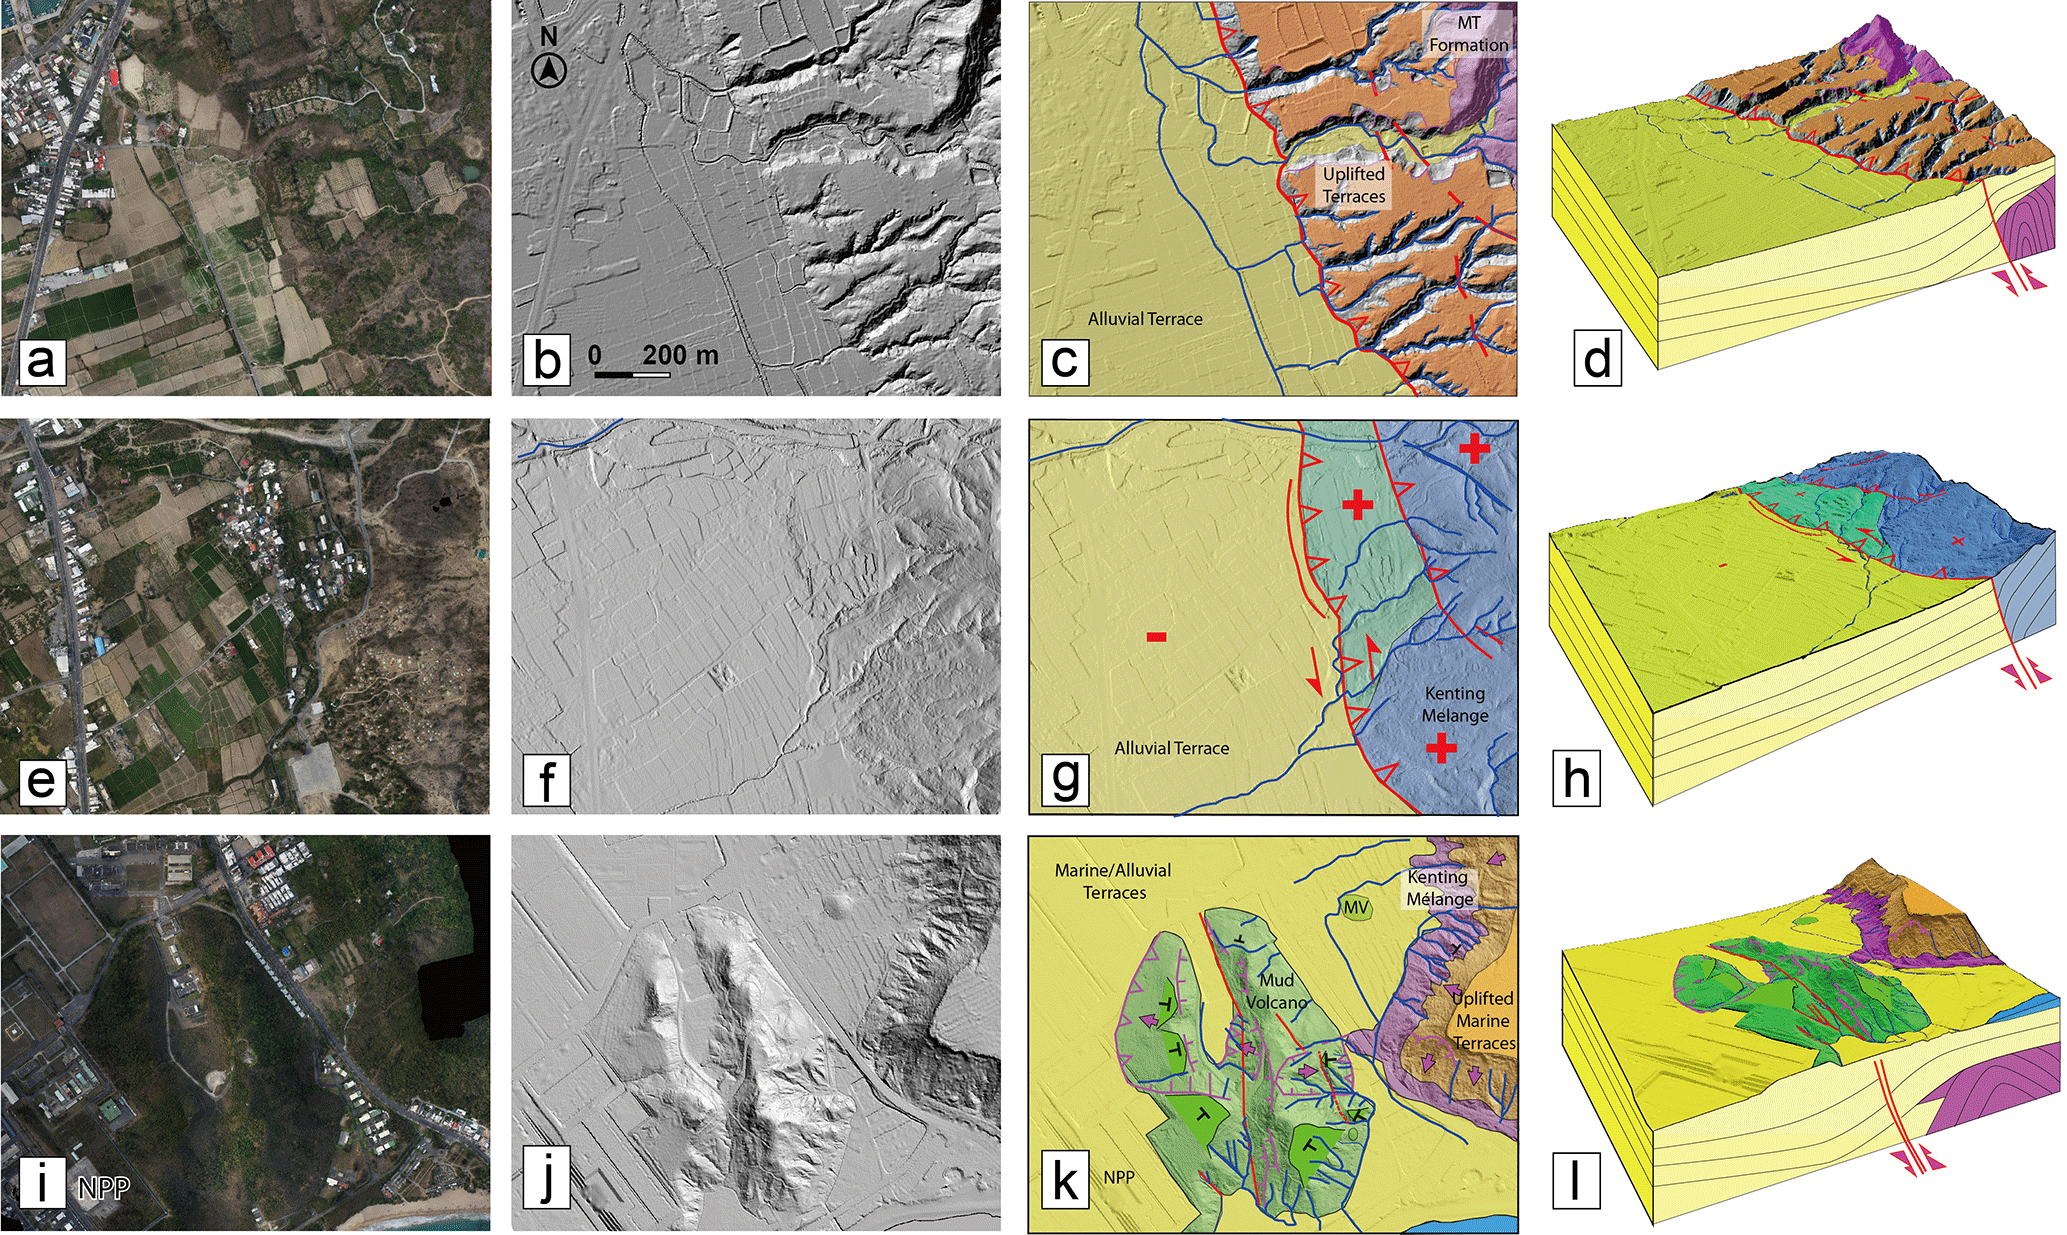
Figure 4Three geological photointerpretation case examples taken from north to south of the Hengchun UAS digital elevation model (DEM). Each box covers the same area (1.3 km × 1.1 km): (a, e, i) mosaic of the georeferenced aerial photographs (orthophoto) of each study area. (b, f, j) Black and white hill-shading relief from UAS-derived DTM. (c, g, k) Geological map from the high-resolution hill-shade DTM where the heavy red line corresponds to the Hengchun Fault and the blue line to the drainage. In light yellow are the quaternary alluvial and marine terraces, in purple and light blue, due to the DTM transparency, is the Kenting Mélange, in brown are the uplifted marine terraces, in light green is the mud volcano and in dark green its associated structural surface (chevrons with radial outward dips in black line). Purple lines are the boundaries of landslides; + are the uplifted areas; − is the subsiding area; NPP is Taiwan Nuclear Power Plant No. 3 (see location Fig. 1) mud volcano. (d, h, l) 3-D geological mapping with associated geological cross sections, showing the Hengchun Fault at depth (red arrows: active fault displacements; blue lines: rivers). The first line of images highlights the active tectonic scarp of the Hengchun Fault, which differentiates two blocks: uplifted (+), locally eroded terraces to the east and a flat lowland sedimentation area to the west. The second line of images highlights the left-lateral offset geometry (red arrows) of tributaries (blue line) on a glacis which is uplifted (+) to the east of the Hengchun Fault. The third line of images shows a deformed N–S-trending elongated mud volcano (MV – Ma'anshan) previously evidenced by Giletycz (2015), situated close to NPP (see infrastructures on the lower left corner of the deformed mud volcano) and a flat, uplifted (+) terraces (paleosurface of Fig. 6) on the western side of the captions.
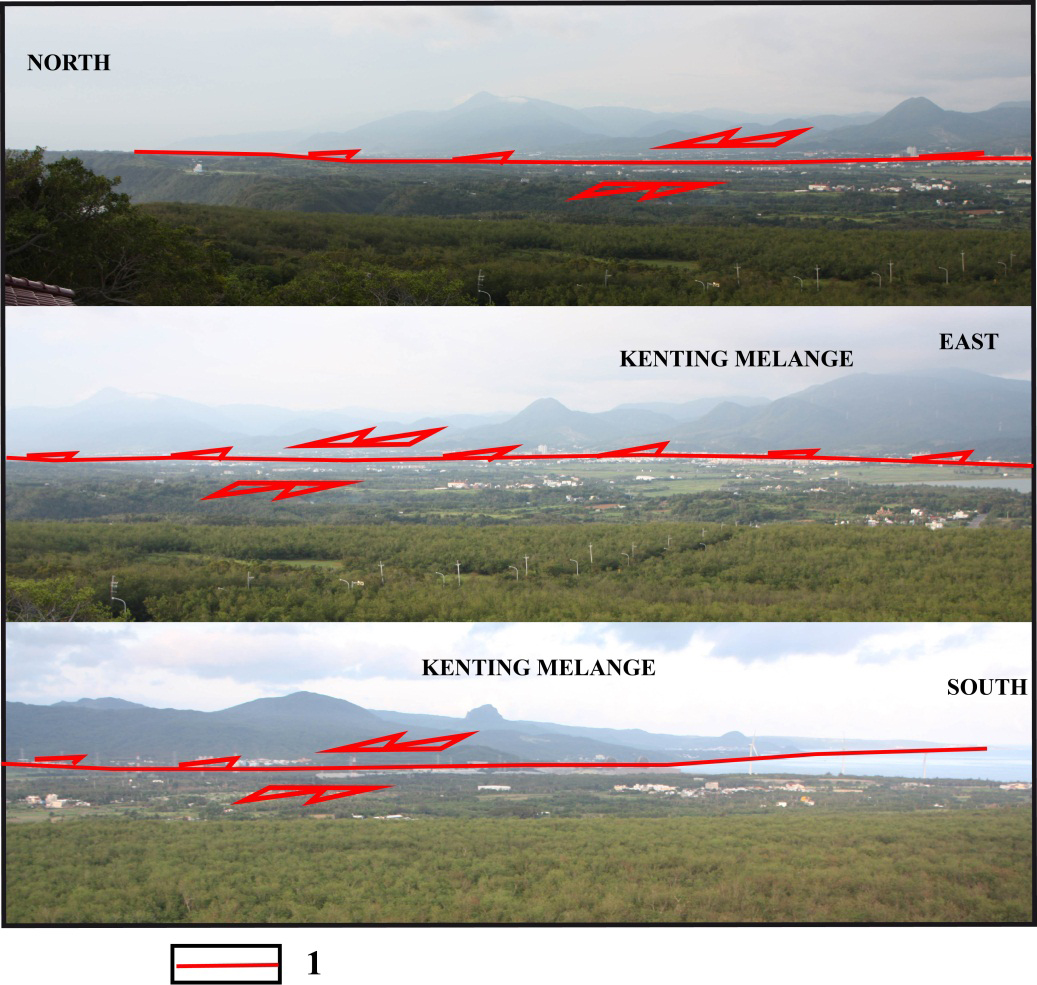
Figure 5Panorama of the Hengchun Fault observed from the western Hengchun Hill to the east. Red lines (1) correspond to the left-lateral compressive Hengchun Fault. Note the isolated summits within the Kenting Mélange that are composed of highly deformed shales with various huge blocks (possibly olistoliths) interpreted herein as a tectonic breccia. The location and the direction of the photos where it were taken are indicated in Fig. 2a.
A UAS, commonly known as a drone, is an aircraft without human pilot on board that flies autonomously and is being used in many areas because of its convenience, high resolution, etc. (Huang and Chang, 2014; Fernandez Galarreta et al., 2015; Giordan et al., 2015; Tokarczyk et al., 2015; Bühler et al., 2016; Deffontaines et al., 2017). The UAS used in this study is a modified version of the already-available Skywalker X8 delta-wing aircraft reinforced by carbon fiber rods and covered partially by Kevlar fiber sheets. The drone is launched by hand, flies and takes photos autonomously, then glides back down to the ground by using a pre-programmed flight plans organized by a ground control system; it is controlled by the ground control station and remote controller. The autopilot system used in this study is composed of and modified from the open-source APM (ArduPilot Mega 2.6 autopilot) firmware and open-source software Mission Planner, transmitted by ground–air XBee telemetry. In order to generate a high-resolution DSM (defines the terrain data including buildings and tree canopy) and mosaic orthorectified images, a total of 3767 photos were gathered by Sony ILCE-QX1 camera mounted on the crafts, during five fly missions, for a total coverage area of 33 km2 with 8 cm ground sampling distance. The coverage of the adjacent photos is kept at 85 % overlap and 45 % side lap. The raw images are processed by ContextCapture and Pix4Dmapper software mutually; the data sets generated in this study are orthoimages and DSMs, with a grid spacing of 10 cm. Prior to the morphotectonic analysis (e.g., Deffontaines and Chorowicz, 1991; Deffontaines et al., 1993, 1994, 1997, 2017; Pubellier et al., 1994), the quality of the data set (see whole data set in Fig. 2) needs to be evaluated. Eighteen ground control points are extracted with grid size of 2 m resolution of airborne light detection and ranging (lidar) data set and from the airborne lidar-associated 25 cm resolution orthorectified image. Most of the ground control points are situated on crossroads, targeted and georeferenced from orthorectified images, and the elevation is from the airborne lidar data. The comparison of the UAS DSM with airborne lidar data gives a root-mean-square deviation of 4.1 cm with maximum error of 42.5 cm from 26 sites of open, bare ground area, e.g., roads, school playgrounds, unvegetated terrains and parking lots. The elevation of the check points is averaged from an area of 4 m2, equal to the grid size of airborne lidar data. The distribution of the ground control points and checked points are located in Fig. 2b. Figure 3 highlights the precision and resolution difference on the available topographic data sets. The 40 m grid DEM was generated in 1986 by the Aerial Survey Office from aerial photos, the 5 m grid DEM was generated by several aerial photogrammetric agencies in 2004, whereas most of the aerial photos were acquired in 2003. The project to create a 5 m DEM data set was funded by the Taiwan Ministry of the Interior. The airborne lidar data were acquired in 2011 and used to generated a 2 m grid DTM (defines the geomorphologic elevation after removing the buildings, trees and vehicles) and DSM, but this data set is not authorized to be published even though it was generated by the authors. The ground control points used in this study were extracted from the airborne lidar data set we acquired some years ago. Figure 3 highlights visually the difference of quality, precision and resolution of each digital topographic data set. One can see the low quality of the 40 m DEM in contrast to the precision and resolution of our UAS DSM. Figure 4 illustrates some case examples of the quality of both the UAS DSM as well as the orthorectified image of the Hengchun Fault. The morphostructures analyses based on photo interpretation are conducted accordingly (Fig. 4c, d, g, h, k, and i).
3.1 Hengchun geological state of the art
From a geologic and geodynamic point of view, the Hengchun Peninsula is interpreted as the northern tip of the Manila accretionary prism (Malavieille et al., 2002; Chang et al., 2003). It is mainly composed of several lithological formations that are described below from the older to the younger ones (see their location on the cross section of Fig. 1c).
The Mutan formation is the largest outcropping formation of the Hengchun Peninsula. Middle-to-late Miocene in age, it is composed of folded classical turbidites made of shales interbedded with sandstones and conglomerates (channels and levees) (Sung and Wang, 1986; Sung, 1991). The Mutan formation is a very thick pile (locally several thousands of meters) and highly deformed turbidites (locally even overturned: e.g., CGS geological map by Sung, 1991; Chang et al., 2003).
The soft complex Ma'anshan formation, late Miocene–Quaternary in age, is a mix of submarine erosion and depressions filled in with both muddy Mutan and Kenting formations (Cheng and Haung, 1975; Page and Lan, 1983; Lin and Wang, 2001; Huang, 2006). The Ma'anshan formation is folded and outcrops partly in the south of the Hengchun Basin (CGS geological map by Sung, 1991); see panorama of the Hengchun Basin in Fig. 5. We believe that the Ma'anshan formation composes partly the basement of the Hengchun Basin and the offshore Manila accretionary prism to the south (Lundberg et al., 1992, 1997; Reed, et al., 1992).
The Kenting Mélange, which only outcrops east of the Hengchun Basin, is known as a tectonic mélange (e.g., Tsan, 1974; Page and Lan, 1983; Huang, 1984; Pelletier and Stephan, 1986; Huang et al., 1997; Chang et al., 2003, 2009a, b; Deffontaines et al., 2016; Zhang et al., 2016; Malavieille et al., 2016). It is interpreted as a chaotic tectonostratigraphic unit containing blocks of various origin (ophiolitic and sedimentary), size and lithology embedded in a sedimentary matrix (Malavieille et al., 2016). It is herein interpreted as a large tectonic breccia of composite ages that ranges from 1 to 10 Ma (see Malavieille et al., 2016) as it mixes various sizes of different blocks and different turbiditic and shale bodies (Page and Lan, 1983; Lin and Wang, 2001; Chang et al., 2003). In our opinion, this shaly, blocky tectonic mélange is injected (intruded) within the major fault zones south of Taiwan due to both the plate convergence and high pressure of fluids at depth (see also Deffontaines et al., 2016). Future scientific work is needed regarding the differing, incompatible assumptions and hypotheses in order to both characterize the processes that create this tectonic Kenting Mélange and to reconstruct (or inverse) its evolution through time (see synthesis in Malavieille et al., 2016).
The slightly tilted Hengchun limestone overlays the unconformable Ma'anshan formation on the western side of the Hengchun Valley and overlying the Kenting Mélange on the eastern side of the Hengchun Fault. As the Hengchun limestone is folded differently and continuously on both sides of the Hengchun Fault, it is unfortunately difficult to use the existed dating results to estimate a precise vertical uplift rate in the absence of the precise location of sampling (Chen and Liu, 1993).
3.2 Updated Hengchun geology and neotectonics
Geological mapping in the fields lead us to look for active tectonic cracks within anthropic concrete dykes. They reveal the clear lateral transpressive and thrusting component of the northern part of the Hengchun Fault (Fig. 6). As the concrete dykes are manmade and very recent, it is easy to reconstruct and inverse the deformation following the Angelier's methodology settled along the longitudinal valley fault (see also Lee et al., 1998, 2000, 2001, 2003, 2005, 2006).
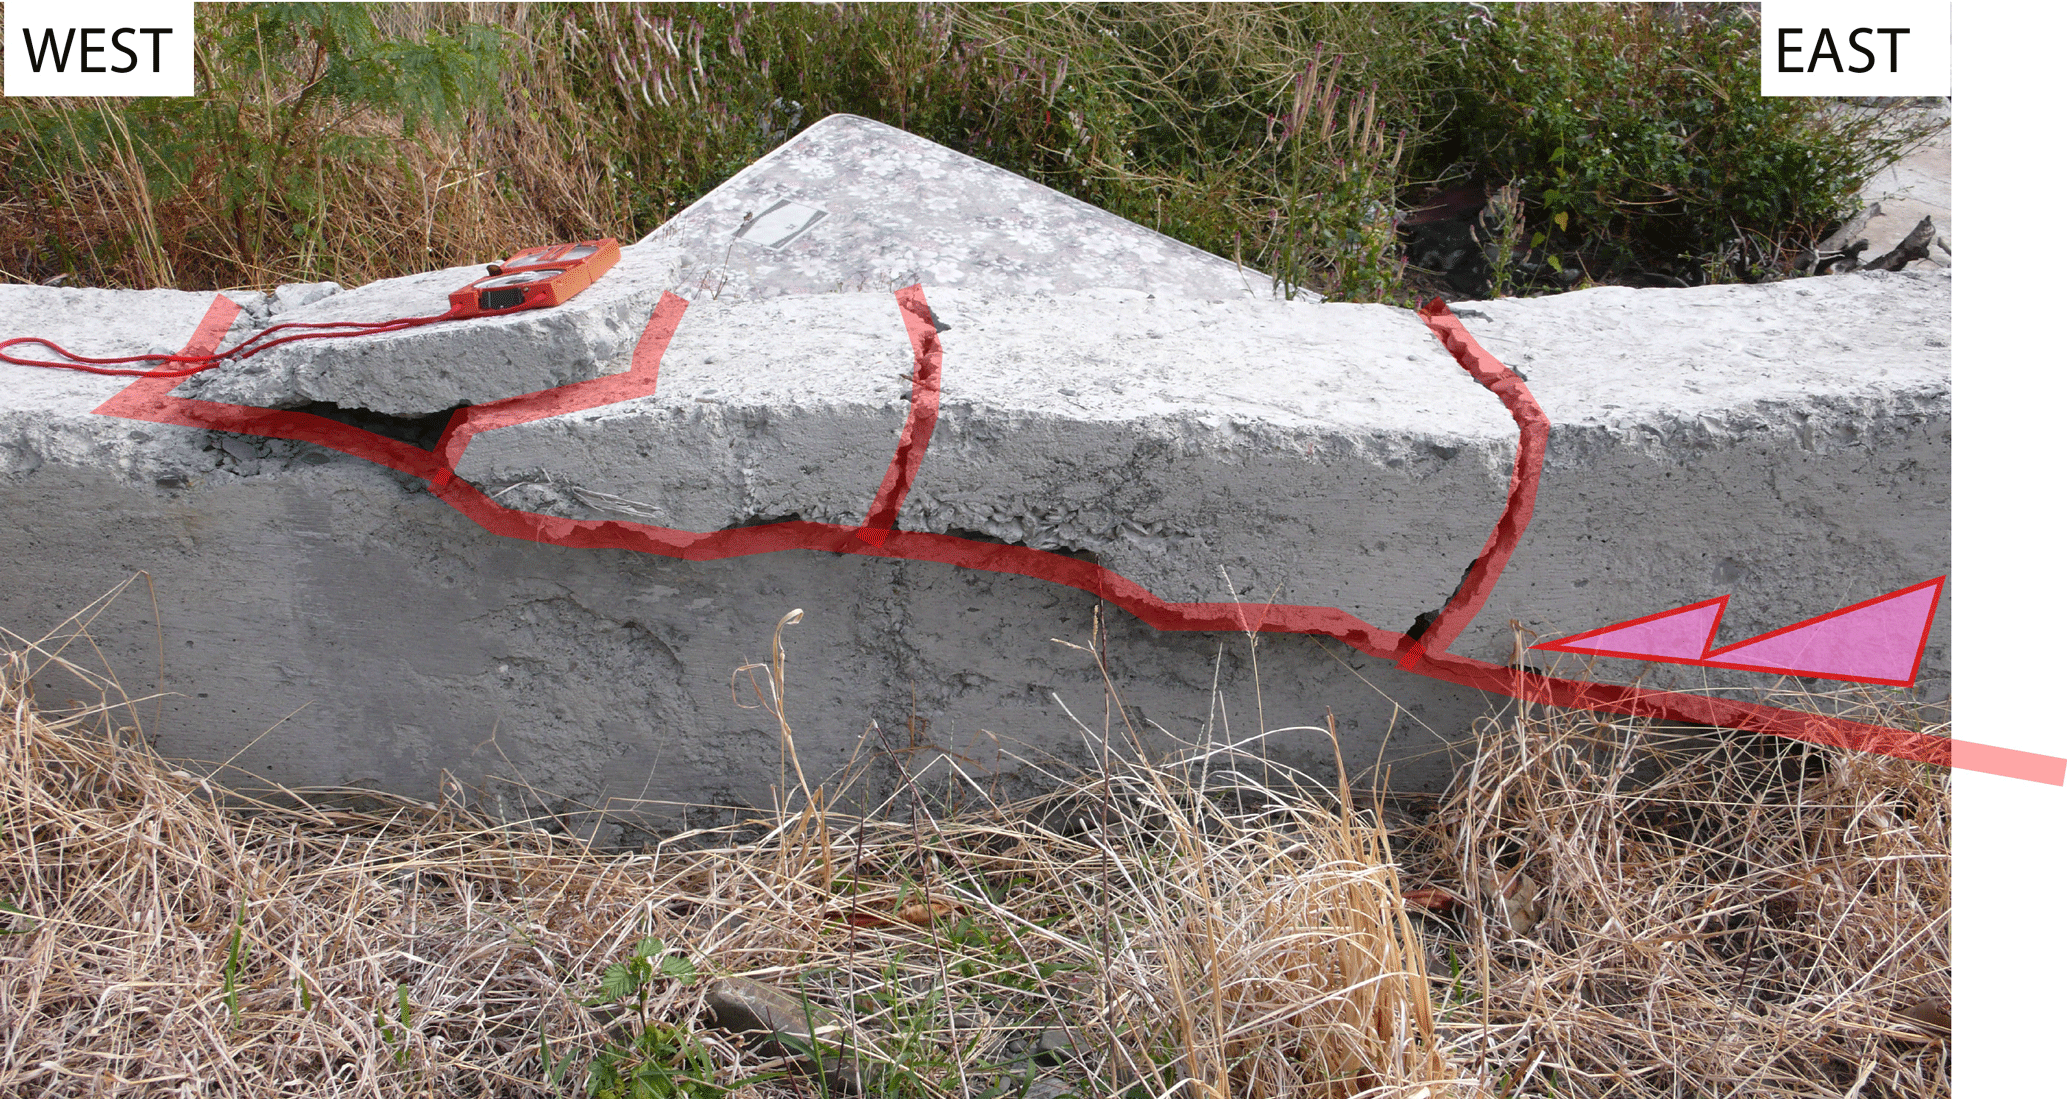
Figure 6Field photograph of compressive features affecting recent concrete dykes after the Hengchun earthquake (26 December 2006, ML=7.0); see location in Fig. 1 near the Fang-Shan village (22.26∘ N, 120.66∘ E). The red compass gives the scale of the outcropping deformation (20 cm). The thrust is associated with three back thrusts, highlighting a small pop-up (below the compass). The red arrow reveals the thrusting component that affects the new concrete dykes.
From a structural point of view, the Hengchun Fault geological map that we propose (Fig. 7) is the result of (1) field studies (Figs. 5 and 6 taken 3 January 2007), (2) the synthesis of previous geological mappings (Rokkaku and Makiyama, 1934; CPC, 1993; CGS in Sung, 1991; Chang et al., 2003; Chen et al., 2005; Giletycz et al., 2015) and (3) a detailed photointerpretation of both the orthorectified mosaic of the UAS aerial photograph as well as the hill shading of the high-resolution UAS-derived DSM (Fig. 7). The detailed structural photointerpretation of the Hengchun Fault area checked in the field takes into account the basic morphostructural principles (Deffontaines et al., 1991, 1993, 1997; Pubellier et al., 1994) such as the geometry of the drainage pattern (bayonet tracks, curves and alignments) and the alignments of small scarps present in the flat Hengchun Basin (Fig. 4e, f, g, h, and Fig. 7, index 5) that help to characterize the morphotectonic features (Fig. 7, faults that affect the topography, index 2 for instance). We also added on the Hengchun Fault geological mapping, geomorphological objects such as paleosurfaces (index 5 in Fig. 7), which are easily recognized by smooth textures, and structures above the Kenting Mélange. Those paleosurfaces are slightly tilted, folded and uplifted east of the Hengchun Fault and are witnesses of the vertical uplift of the transpressive tectonic activity of the Hengchun Fault. Unfortunately, due to the slight tilt, it remains difficult to extract fold axes from those paleosurfaces. It would be interesting to date these paleosurfaces in order to get the mid- to long-term activity of the deformation. We select also the chevrons from the morphostructural analysis of the high-resolution UAS DSM (index 6 in Fig. 7). Chevrons correspond to the top of harder rocks of the tilted structural surfaces within the Kenting Mélange east of the Hengchun Fault. They reveal opposite tilted strata, indicating the presence of folds (anticlines and synclines, index 7 in Fig. 7) close and parallel to the Hengchun Fault zone. Some tectonically offset and eroded mud volcanoes are also identified and mapped herein (index 3, in Fig. 6), especially in the South Hengchun Basin and close to Taipower Nuclear Power Plant No. 3. Those situated to the south of the study area were already evidenced by Giletycz (2015). They appear in the UAS DSM as characteristic “elongated conic volcanic” shape relief above the flat marine and alluvial lowland terrace. Their western side is locally affected by landslides (Fig. 7). We interpret these mud volcanoes as the outcropping traces of the shale intrusions within the Hengchun Fault zone, very probably due to fluids overpressure at depth in relation to the intense transpressive tectonic stress (see also Deffontaines et al., 2016).
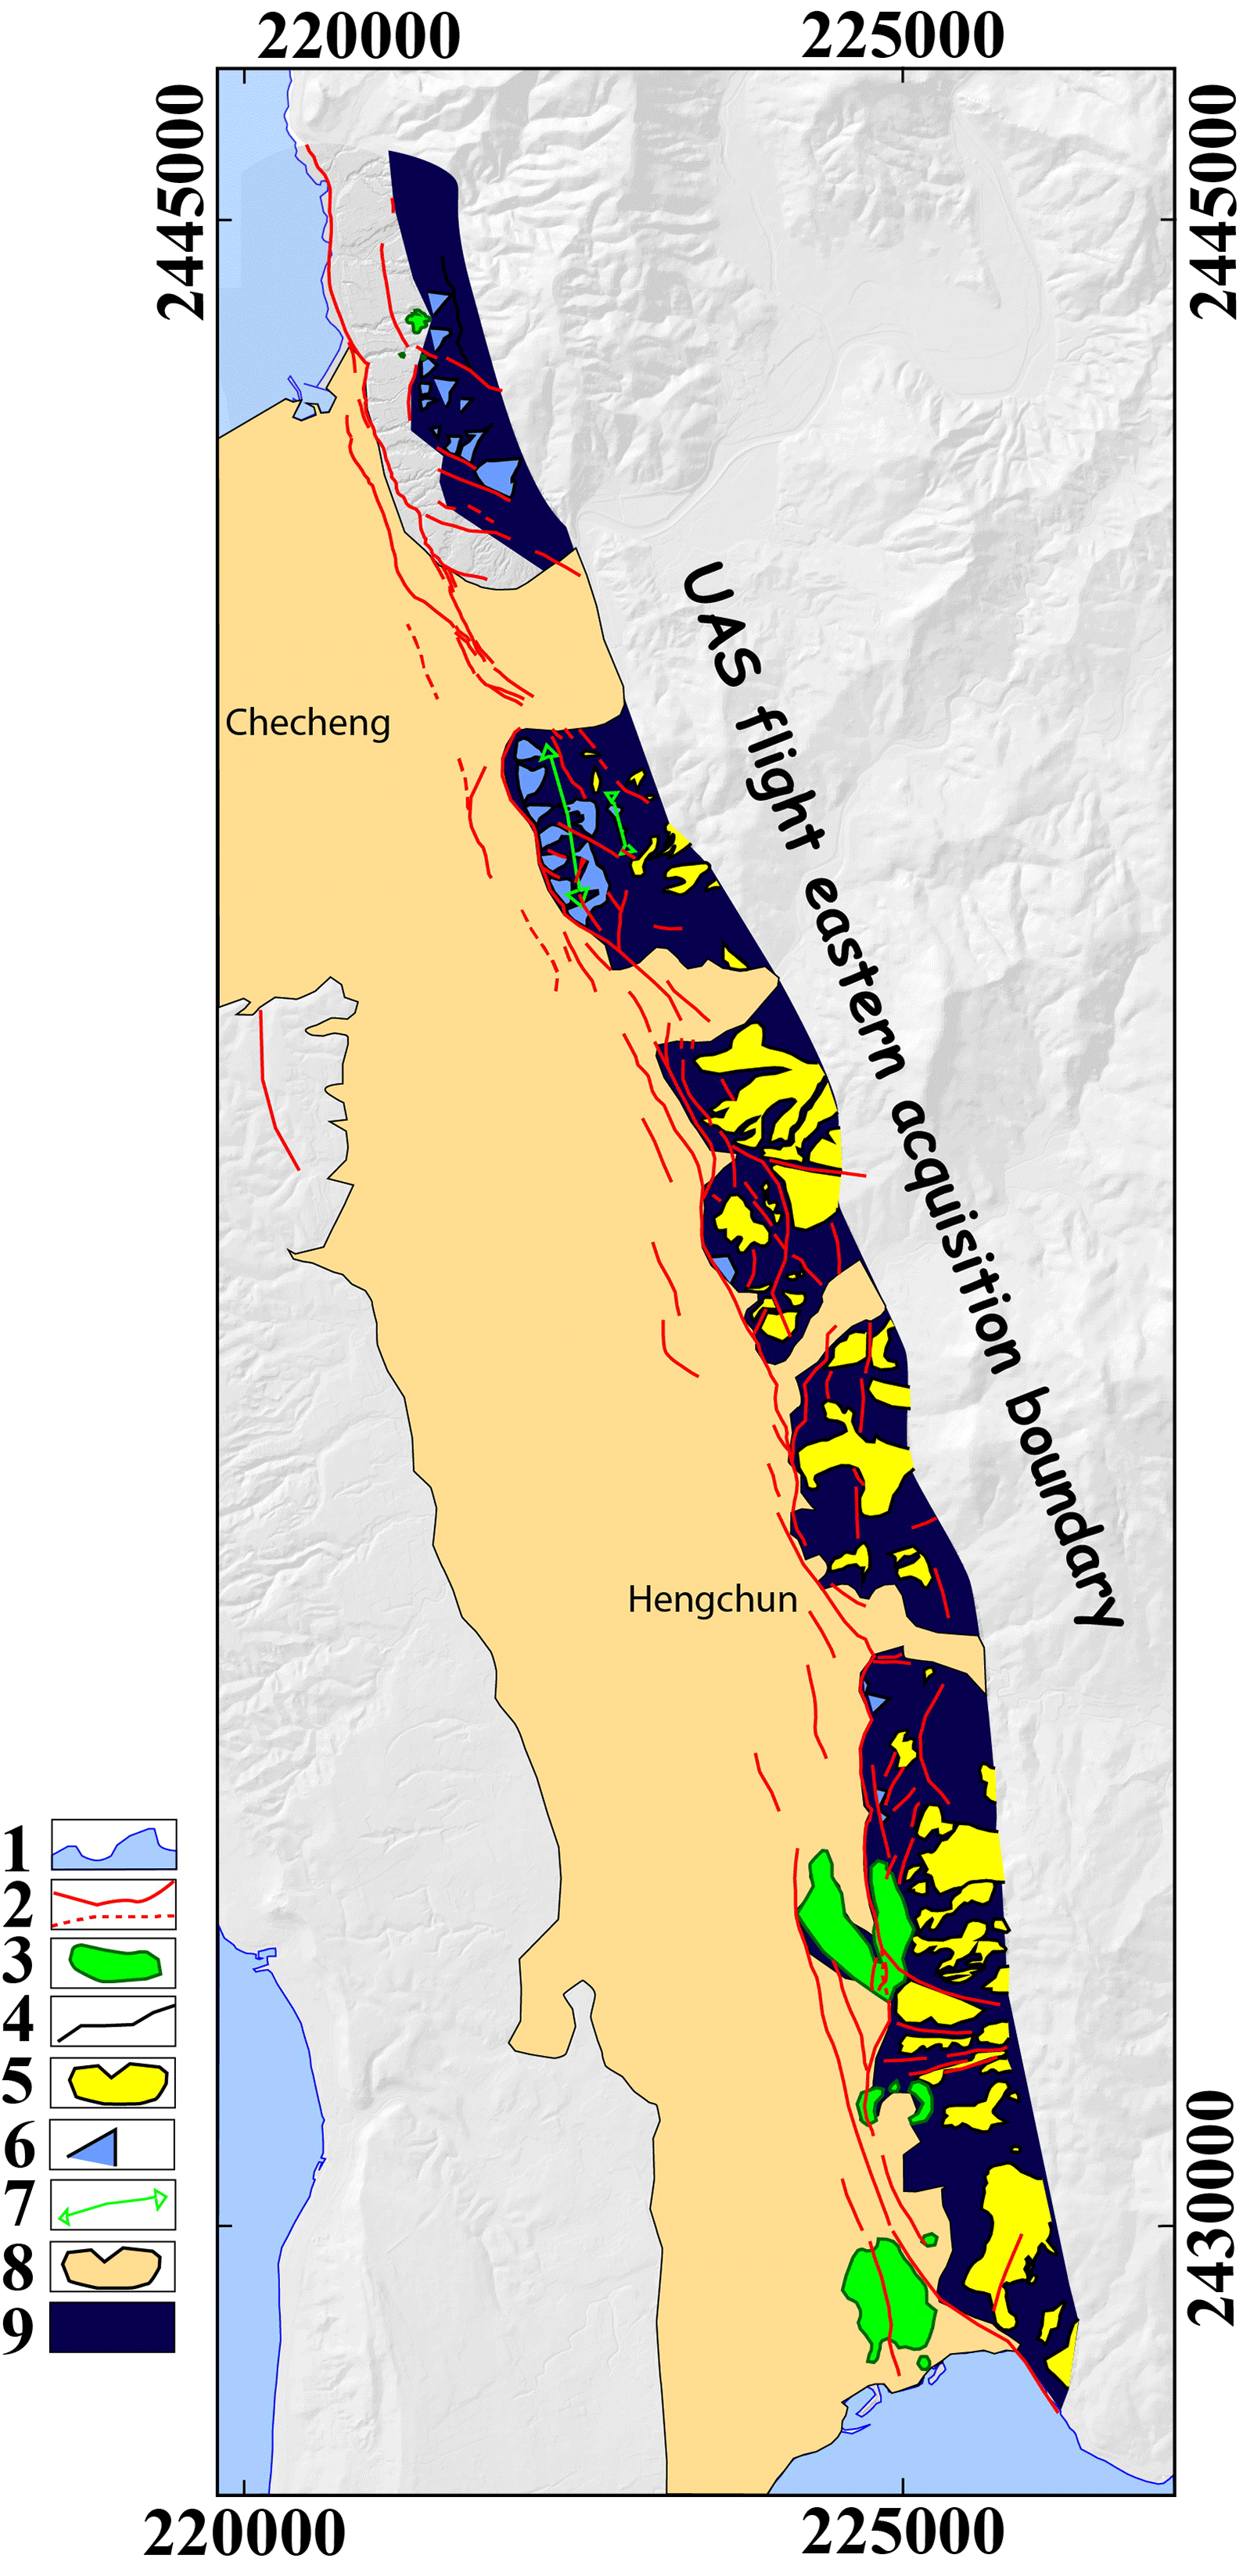
Figure 7Morphostructural map of the Hengchun Fault: (1) shoreline; (2) faults (red lines: certain faults; red dashed lines: inferred); (3) mud volcano; (4) lithological boundaries; (5) paleosurfaces; (6) chevron corresponding to tilted structural surface; (7) fold axes; (8) Hengchun Valley alluvial and marine deposits; (9) Kenting Mélange. Note that the Hengchun Fault is made of numerous small parallel faults affecting a rather wide area of the eastern Hengchun Valley. It is associated with a N–S-trending fold close to Checheng. Some folds that tilt paleosurfaces and NE–SW, E–W and NW–SE oblique faults affect the Kenting Mélange. The western extension of the Hengchun alluvial plain (8) is deduced from the 5 m DTM.
The Hengchun Fault is recognized as active (Bonilla, 1976; Hsu and Chang, 1979; Lee, 1999; Lin et al., 2000; Lin et al., 2009; Deffontaines et al., 2001, 2016). Effectively, geological mapping in the field reveals many active cracks within anthropic concrete dykes. These cracks highlight the clear transpressive and thrusting component of the Hengchun Fault (Figs. 5 and 6). We cannot recognize clearly in the topography the trace of the Hengchun Fault as a unique straight line thrusting (see Fig. 7) in contrast to the CGS geological mapping (Sung, 1991) or its sinusoidal shape on the CPC geological map (1993). We only highlight herein the Hengchun Fault zone, which is made of locally aligned segments of faults that affect the eastern part of the very recent Hengchun Basin deposits (see index 2 in Fig. 7). Note that regional geological maps aim to show both stratigraphy and structure, where the fault trace is at the maximum (or just approximately) stratigraphic separation. In contrast, the active fault trace is situated strictly at active lines where last rupture is located. Thus, these two facts may create large differences. Moreover, on land, the last fault rupture can only be identified by geomorphic features, not by drilling or geophysical prospecting.
To date the deformation, the vertical long-term slip rate has been deduced in marine terrace studies and estimated at 6.3 mm yr−1 at Hăikŏu (northern Hengchun Valley; see Fig. 2) and 3.8–6.1 mm yr−1 at Nanwan (south of Hengchun Valley; see Chen and Liu, 1993). Other marine terrace studies from Chen et al. (2005) show similar long-term slip rate.
In order to deduce the regional tectonic activity of the Hengchun Fault, we processed 13 radar images (ALOS PALSAR images acquired in L-band; λ= 23.6 cm, average incidence angle = 34.3∘) in ascending mode (flight direction 350∘ E of N) between 17 January 2007 and 28 January 2011, thus providing 4 years of monitoring, through StaMPS software (Hooper et al., 2007). A series of 12 interferograms has been generated, all with respect to a unique “super master” as a reference image situated in the mid-time series that minimizes both spatial and temporal decorrelation (Pathier et al., 2003; Champenois, 2011, Champenois et al., 2011, 2012, 2014, Fig. 8). Note that their perpendicular baselines situated between −1194 and 2417 m are significantly below the critical limit where all interferometric coherence is lost (Hooper, 2009). We used the 40 m ground-resolution Taiwan DTM in order to remove both the topographic and orbital components of the interferometric phase. All interferograms shows an excellent coherence in the Hengchun Plain as well as in the hilly area. The method identifies 20 133 PS pixels with an average density on the whole Hengchun Peninsula of 120 PS km−2 (see Fig. 9), characterized by their phase stability over the whole period. PS analyses lead us to extract a map of mean LOS surface velocities for each PS and also to catch their displacements through time series. Note that these LOS data are not projected onto the vertical component. The PS-InSAR base (fixed GPS station GS59 corresponds to the black and white star see its location close to Checheng and north of the Hengchun Valley in Figs. 1 and 9) is chosen as it presents a stable (to very low) continuous deformation during the monitoring time period. Nevertheless, this location might be subject to small continuous uplift or small continuous subsidence that may explain local discrepancies with the GPS average annual displacement. We compare our PS-InSAR results (Champenois, 2011; Champenois et al., 2011, 2014) to three fixed GPS stations (HENC, GS57, GS59; see Fig. 9) and two leveling lines acquired in the same monitoring time period (see Fig. 10). For each of the three fixed GPS stations (HENC, GS57, GS59), an average displacement has been calculated, projected into the radar LOS by taking into consideration the various local incidence angles along the distance axis (Hanssen, 2001; Cigna et al., 2011).

Figure 8Available ALOS SAR images and their associated perpendicular baselines. All slave images are linked to the best master image chosen in the middle of the time series that maximizes the sum correlation of all interferogram (Hooper et al., 2007).

Figure 9Mean LOS velocities of PS-InSAR between January 2007 and January 2011, superimposed onto the shaded 40 m ground-resolution Southern Taiwan digital terrain model. The large black circles are the GPS points and the color in the circles indicates their average LOS velocity component during the monitoring time period. The black and white star (situated close to Hăikŏu – see location in Figs. 1 and 2) corresponds to the GPS ground fixed station GS59 and is the base of this PS-InSAR data set. Blue and yellow arrows give their horizontal and vertical velocity. Red line: Hengchun Fault. Location of profiles 1 and 2 (see Fig. 11). Note the active surrection and folding east of the Hengchun Fault in contrast to the subsidence of its western part (Hengchun Valley).
The results (Fig. 9) show an impressive density of PS (more than 140 PS km2 in the surroundings of the Hengchun Fault) in this area, where both human activity and luxuriant vegetation prevail. The PS map reveals a clear continuous difference in LOS velocities across the Hengchun Fault where the Hengchun Valley (western side of the Hengchun Fault) subsides, with values ranging from −5 to −10 mm yr−1, in contrast with the westernmost Hengchun ridge, which is uplifting. This is evidenced in Fig. 9 by a rapid transition from blue/green to orange/red PS dots. Taking into account the PALSAR ascending satellite orbit and the NNW–SSE Hengchun Fault, trending of both geometries is close to the best configuration to detect and measure the fault displacements (Champenois, 2011). Consequently, Fig. 9 led us to draw, with much more accurate detail than Shyu et al. (2005) or Lin et al. (2009), a new place for this active Hengchun Fault within the Hengchun Plain (Champenois, 2011). The eastern side of the Hengchun Fault is characterized by the rapid increasing uplift of the Kenting Mélange up to a maximum that seems to parallel the Hengchun Fault. Farther east the PS LOS velocities decrease with the distance to the Hengchun Fault so the eastern Hengchun Peninsula appears to be slightly tilted. We observe in the Hengchun Peninsula a similar dissymmetric active vertical behavior as in the coastal range (eastern Taiwan): the western part of the relief is highly actively uplifting and folding in contrast to the eastern part, which is characterized by a decreasing uplifting and which is slightly tilted to the east (see also Deffontaines et al., 2017). We note in Figs. 10b and 11 the coherence of the PS LOS velocities and the GPS measurements (colored large dots that we put into the same LOS radar geometry). Consequently, those PS-InSAR results offer a precise mapping of the active interseismic splays of the Hengchun Fault and allow the quantification of the tectonic displacements.

Figure 10(a) Location of the leveling lines on the Hengchun Peninsula. (b) and (c) Associated PS mean velocity with error bars (blue dots), leveling data (red square and in pink: error bar) and GPS stations data (yellow triangle), projected on LOS. Leveling lines highlight the vertical component of the deformation. The easternmost and westernmost reference points are on an enclosed curve line of the class 1 level reference net defined by Taiwan's Satellite Survey Center of Department of Land Administration (see SSCDLA, 2018). As leveling line 2 parallels the Hengchun Fault (points 6 to 8), it is represented as a red quadrangle. Note the general agreement of both interseismic leveling and PSI vertical topographic displacements on those two transverse profiles across the whole Southern Hengchun Peninsula. They show subsidence in the western part of the Hengchun Fault (HeF) contrasting with uplifting due to active folding on its eastern side. In addition, there is little significative vertical interseismic displacement on the Kenting Fault location on both profiles during the monitoring time period.
Regarding the Kenting Fault, with the data used in this study we see no gradient of PS LOS velocity nor noticeable differential displacements on the GPS stations situated around the Kenting Fault (see Fig. 9 and profiles of Fig. 10a–b). Moreover, from the geological mapping analysis (Chang et al., 2003), the Kenting Fault has a sinusoidal planimetric geometry that follows more or less the topographic isocontour of the relief. So the Kenting Fault is a low-dipping thrust fault. Consequently, this fault may be either locked at the surface or an inherited inactive fault, or it may have a tectonic activity that we do not observe on this PS-InSAR data set during the monitoring time period.
We note a great coherence in between the PS and the available GPS measurements (colored large dots in Fig. 9) provided on two stations. For comparison purposes, the average annual GPS displacements acquired in the InSAR monitoring time period have been compared with the radar LOS. We compared also these PS results with leveling data acquired during the same period of time (between March 2008 and April 2011, during three campaigns of measurement). Figure 10 compares the leveling data, the mean LOS velocities of PS along the leveling lines and GPS data for the two stations situated close to the leveling lines. Note the agreement between all of them. The local heterogeneity of the displacements (e.g., small subsidence and small uplift) within the Hengchun Valley is highlighted by both the HENC GPS station that gives the absolute uplift displacement and the PS-InSAR data with various colored dots, ranging from blue to orange, situated on both sides of the O value.
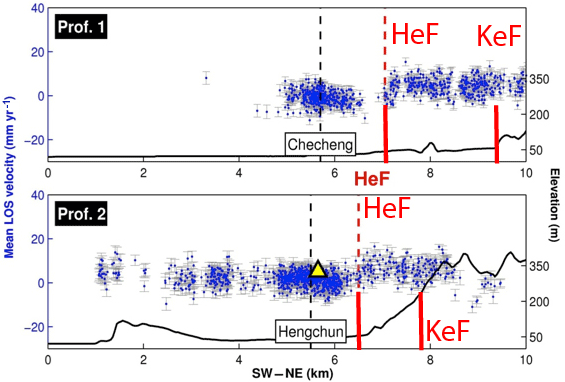
Figure 11E–W projection of mean LOS velocity in mm yr−1 (blue dots with error bars, E on the right) on two profiles transverse to the northern part of Hengchun Valley (close to the cities of Checheng and Hengchun; see profile location in Fig. 9). Black line: topography; yellow triangle: GPS point; HeF: Hengchun Fault; KeF: Kenting Fault. Note that Figs. 10 and 11 both show similar topographic displacements: the LOS offsets close to 10 ± 2.5 mm yr−1 associated with the Kenting Mélange uplift east of the Hengchun Fault, which contrasts with the generally subsiding Hengchun Valley. Kenting Fault has no vertical interseismic offset during the monitoring time period.
Moreover, in order to better characterize the Hengchun Fault activity and quantify the LOS velocity variation on both sides of Hengchun Fault, we computed the LOS velocity offset across the fault, using 31 profiles perpendicular to the fault line. Each 10 km long PS profile is perpendicular to the Hengchun Fault and characterized by an equidistance of 400 m. In addition, each PS data point situated on both sides (200 m vicinity) is projected on each PS profile. Each data point is only represented on only one profile. The number of PS dots per profile varies between 400 and 1200 (Champenois, 2011). This offset characterizes the slip rate of the fault. We present two specific profiles in Fig. 11 (see location Fig. 9). The two PS profiles, which run transverse to the Hengchun Fault, one north of the Hengchun Valley close to the Checheng city and the second one southward (close to Hengchun city), show LOS offset less than 10 ± 2.5 mm yr−1. Note the high number of PS reflectors situated in the cities of Checheng and Hengchun that confirm that on both profiles we evidence a clear jump in the PS magnitude that corresponds to the aseismic displacement of the Hengchun Fault (Champenois, 2011).

Figure 12Hengchun Fault along-strike variation of LOS velocity offset (perpendicular to the fault, in mm yr−1) including Hengchun and Checheng. Note the active interseismic displacement and its along-strike variations which confirms that Hengchun Fault is an active interseismic creeping fault of Taiwan. Furthermore the LOS velocities' variations are important in terms of seismic hazards as they reveal the location of slowly creeping areas where stress may accumulate at depth, such as those areas close to both Checheng and Hengchun and higher active tectonic areas such as in between Checheng and Hengchun or south of Hengchun Valley. Part of the deformation may also be distributed in the eastern part of the Hengchun Fault (e.g., the Kenting Fault and/or within the intrusion of the Kenting Mélange in between both Hengchun and Kenting faults; see Fig. 14).
So thanks to a series of more than 30 profiles perpendicular to the fault, we computed the interseismic LOS velocity offset along the fault, from north to south, with LOS values (from min 4.9 mm yr−1 to max 10.2 mm yr−1), reaching an average 8 ± 2.5 mm yr−1 during the monitoring time period, which reveals, using two linear regressions calculated on both side of the Hengchun Fault, the clear tectonic activity of the Hengchun Fault (Fig. 12). Note the good coherence between slip rates derived from PS analysis and the GPS measurement (projected in LOS by taking into account each local incidence angle along the distance axis) represented by the yellow triangle in see Fig. 12. This good fit between the fixed GPS stations validates our PS results. This is a major result from this study as it demonstrates the along-strike interseismic activity of the fault (Champenois, 2011; Champenois et al., 2011, 2012; this study) and allows us to obtain the average annual interseismic LOS displacement of the Hengchun Fault and its spatial variation along the fault. Variations of the along-strike velocity offset of Hengchun Fault need to be carefully monitored and analyzed in order to better characterize potential seismic hazards, especially the low interseismic creeping areas where stress may accumulate (see Fig. 12) and may correspond to a partially locked part of the fault source of future earthquakes (close to Hengchun Township, for instance).
StaMPS also gives access to time series of displacement, from 2007 to 2011 (see Champenois, 2011; Champenois et al., 2011, 2012). We can thus derive at each image acquisition date the displacement related to the fault (a cumulated slip value) and then monitor its slip variation through time. The time series of slip values (Fig. 13) does not show any clear seasonal accelerations or decelerations, but only expresses a rather linear behavior of the fault during the monitoring time period. This time series should be updated with new SAR images in order to get a longer monitoring period (Champenois, 2011; Champenois et al., 2011). It will help to know whether the Hengchun Fault has a linear displacement through time (or not).
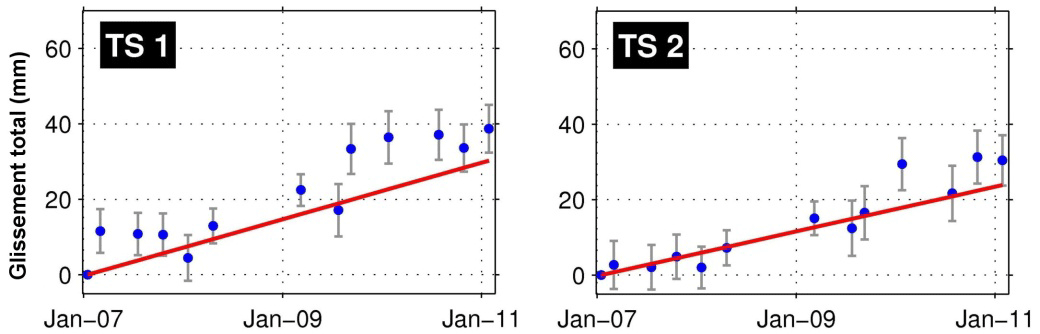
Figure 13Time series of cumulated slip (on profiles 1 and 2) where no particular seasonal effects prevail.

Figure 14(a) Simplest model of active interseismic tectonic deformation of the Hengchun Fault during the monitoring time period. It is compatible with the oblique geodynamic convergence (large red arrow on the right), GPS, leveling, interferometric active displacements, and the detailed UAS DSM photointerpretation. In addition, it is compatible with Rokkaku and Makiyama (1934) and CGS and CPC geological mappings (Chang et al., 2009b; Deffontaines et al., 2016). 1: Fault; 2: Thrust; 3: Fault plane; 4: Taiwan Strait/South China Sea; 5: Left-lateral component; 6: Transpressive left-lateral component; 7: Fold (anticline and syncline). The GPS data and PS mean LOS velocities imply that Hengchun Fault acts as a left-lateral transpressive strike-slip fault with an actively folding and uplifting anticline (hanging wall) contrasting with the aligned active subsidence of the Hengchun Valley that acts as a trending parallel to the Hengchun Fault. One can see the Hongtsai canyon at sea (see Deffontaines et al., 2016). (b) Simplified lithostratigraphic column of the Hengchun formations in the western Hengchun Peninsula. Al: alluvial deposits; HcL: Hengchun limestone; Ma: Ma'anshan formation; Mt and Mtg: different facies of Mutan formation (Mtg: Loshui sandstone – CGS geological map); KeM: Kenting Mélange; HeF: Hengchun Fault; KeF: Kenting Fault; Mio: Miocene; Pli: Pliocene; Ple: Pleistocene; Hol: Holocene strata (modified from CGS, CPC and previous references).
Many different tectonic models have been proposed on the active Hengchun Fault zone (thrust, left-lateral strike-slip, transpression and transtension; see Chang et al., 2003, 2009b). However, they miss both structural and active tectonic arguments to better understand the Hengchun Fault (e.g., Liew and Lin, 1987; Sung, 1991; CPC, 1993; Chen and Liu, 1993, 2000; Chang et al., 2003, 2009a, b; Chen et al., 2005; Vita-Finzi and Lin, 2005).
The simplest model that we propose herein (Fig. 14) that fits with the oblique NW-trending Taiwan geodynamic convergence (Suppe, 1984), the E–W displacements measured by GPS data (Yu et al., 1997), the geological data set and the geological mapping (CPC, 1993; CGS in Sung, 1991; Chang et al., 2003, 2009b; Giletycz et al., 2015), our detailed high-resolution UAS DSM photointerpretation (Fig. 7) and our interferometric 2009–2011 PS LOS displacements (Champenois, 2011; Champenois et al., 2011, 2014, Fig. 9) is given for the western part of the onshore Hengchun Peninsula (Fig. 14).
From all used geodetic techniques (GPS, leveling lines and interferometric), if we generalize the two leveling sections, which are coherent to both the three fixed GPS stations and the PS-InSAR results, the western Hengchun Peninsula is slowly uplifting (less than +10 mm yr−1), contrasting the slow subsidence of the eastern part of the Hengchun Peninsula (0 to −2.5 mm yr−1). So as we reveal a continuous active differential displacement across both sides of Hengchun Fault, which is deduced from leveling lines, GPS and PS-InSAR, Hengchun Fault shows the existence of a clear interseismic creeping component during the monitoring time period, with an average value of 8 mm yr−1 along the LOS, confirmed by the leveling monitoring (see leveling line 1: 8 mm offset – Fig. 10b). The variation of displacements on both sides of the Hengchun Fault zone also reveals the progressive folding of the Hengchun Fault zone: the eastern hanging wall is progressively shortening and uplifting (as revealed by GS57 and the two leveling lines) contrasting to the progressive subsidence of the Hengchun Basin (footwall situated west of Hengchun Fault – see Figs. 10b, c and 11, profiles 1 and 2). These displacement results (Figs. 9, 10 and 11) combined with the structural photointerpretation (Fig. 7) show that the fault is only locally outcropping and that active folding occurs, increasing progressively with time, stress and strain at depth.
Consequently, due to the rectilinear structural geometry, the Hengchun Fault appears to act as an almost vertically active left-lateral transpressive strike-slip fault with an active uplifting and folding (anticline) on its eastern hanging wall, in contrast to the active subsidence of the western footwall (which corresponds to the easternmost part of the dissymmetric Hengchun Basin, Fig. 14). Moreover, the Hengchun Fault is not outcropping along one small, straight, continuous north-to-south line but is instead a rather large “fault zone” made of little active fault segments (see location mapped in details, Fig. 7). One may note that the thrusting and left-lateral strike-slip motion have been deduced from both from the morphostructural analysis of the high-resolution DTM (see Fig. 4c, d, g and h) and the obliquity of the GPS arrows already evidenced in the bibliography (see blue arrows in Figs. 1 and 9, and Chang et al., 2003). Consequently, Fig. 14 proposes a simple model where the Hengchun Fault acts as a 160∘ E N-trending transpressive left-lateral strike-slip fault zone. Its active hanging wall is overthrusting and is actively folding the topographic surface that tilts and folds the paleosurfaces: the Hengchun limestone and marine terraces (see Liew and Lin, 1987, and Chen and Liu, 1993). The Hengchun Basin (Hengchun Fault footwall and west of it) under the transpression is also folded and is actively subsiding with a parallel to the fault syncline axis that create the lagoonal/marine deposition of the Pleistocene–Holocene Hengchun Basin (Chen et al., 1991).
Thus, the Hengchun Fault, as many faults in central and southern Taiwan, presents both left-lateral strike-slip and thrusting components such as the Chelungpu Fault reactivated during the Chichi earthquake (21 September 1999) as well as any Taiwan foothill transfer fault zones (e.g., Deffontaines et al., 1997).
Regarding the amplitude and the components of the active Hengchun Fault deformation, the two leveling lines reveal the vertical offset of the Hengchun Fault, consistent with interferometric displacement toward the LOS, with a value of 8 ± 2 mm yr−1, which corresponds to the vertical geodetic interseismic slip rate. Note that this short-term value is a bit different than the vertical long-term slip rate deduced from the marine terraces dating 6.3 mm yr−1 at Hăikŏu and 3.8–6.1 mm yr−1 at Nanwan (Liew and Lin, 1987; Chen and Liu, 1993). From this slight difference in between the long-term and the vertical geodetic slip rates, we may deduce the fact that the Hengchun Fault may be not only a creeping fault. But due to the folding component of the eastern side of the Hengchun Fault, it is needed to locate much precisely the in situ dated samples (Chen and Liu, 1993) to reconstruct and inverse correctly the long-term deformation history.
Chang et al. (2003) characterized the active horizontal slip rate of the western Hengchun Peninsula by comparing the directions and amplitude of the three fixed GPS stations. Note that these values take into account both Hengchun and Kenting faults without individualization.
First, the flights of UAS with image acquisition allow us to produce through photogrammetry a high-resolution DSM of the Hengchun Fault area with a less than 7 cm ground resolution and less than 40 cm precision. However, for some places, the texture may change rate quicker and higher than the image capture acquisition, such as the lakes or water surfaces due to sunlight reflection, which causes noises in DEMs. In addition, concerning the DEM photointerpretation, especially for the active geological structures, the terrain is easily modified by human activity in Taiwan: cities and farmland are rapidly growing in some areas, concealing morphotectonic structures. Fortunately, the orthomosaic images help to recognize those artifacts. Overall, the autonomous UAS and well-developed photogrammetry technique allow us to generate conveniently highly detailed topographic information and help to carry out large-scale, high-resolution morphotectonic study. Integrating leveling lines, three fixed GPS stations and PS-InSAR processing that gives the short-term active movement of the Hengchun Fault and high-resolution DSM structural photointerpretation acquired from UAS demonstrates longer-term topographic deformations and anomalies, thus providing one new scope that may be able to locate, characterize and quantify the active tectonics features.
Then with these useful high-resolution topographic data, we undertook a classical geological and geomorphological photointerpretation that led us to update and refine the pre-existing CPC (1993) and CGS (Sung, 1991) geological maps on both sides of the Hengchun Fault (see Figs. 4 and 7). The latter led us to characterize the structural geometry of the Hengchun Fault in the peninsula (Fig. 7). Moreover, the leveling lines and the PS-InSAR interferometric processing that we carried out over the Hengchun Peninsula from 2007 to 2011 with more than 12 coherent interferograms reveals clear interseismic displacements of the Hengchun Fault. Moreover, our interferometric results, which are in agreement with leveling lines and fixed GPS data, reveal the active sections and folding of the eastern hanging wall of the Hengchun Fault of about 8 ± 2 mm yr−1. Furthermore, the footwall is also subject to a complementary active subsidence related to the development of an active syncline parallel to the Hengchun Fault. These displacements are a cumulative vector that takes into account both planimetric and vertical components of the deformation. Our PS-InSAR results are fully coherent with both E–W-trending leveling lines across the Hengchun Fault and three continuous GPS stations situated on both sides of the Hengchun Fault. Consequently, we expand our interpretation due to the PS density (more than 140 PS km−2), which offers a spatial density of measurements that is greatly higher than that offered by GPS, allowing us a global and whole coverage and mapping of the active Hengchun Fault deformations (Fig. 9).
From the active tectonics conclusions, we deduce that the Hengchun Fault, characterized by a high dip angle, acts as a large, creeping interseismic left-lateral strike-slip fault zone with a clear transpressive vertical component of 8 ± 2 mm yr−1 (leveling lines and LOS) associated with active folding. We show that the Hengchun Fault presents a different tectonic behavior from north to south: in its northern part, the Hengchun Fault is narrow and clearly outcrops below the marine terrace with a measurable offset (see Fig. 4d). That contrasts with the central and southern part of the Hengchun Fault, where it is wider or larger (see many parallel and collinear faults and cracks that offset the topography in Fig. 7) and submitted to active folding, and the fault is only locally partially locked (close to the Hengchun city, see Fig. 12). In the central and southern parts, as the PS interferogram spectrum increases rather continuously from west to east, transverse and above the whole Hengchun Fault zone, the Hengchun Fault actively folds at depth. Moreover, the lack of clear along-strike PS discontinuity across the Hengchun Fault zone proves that it is not clearly offsetting the topography (and outcropping) during the acquisition monitoring time period (2007–2011). This should sign the slow continuous increase of tectonic stress at depth, which is a major indicator of a future earthquake in that area.
Unfortunately, the active differential displacement on both sides of the Kenting Fault is much more difficult to highlight with the present geodetic data sets and our PS-InSAR results due to (1) the low fault dip angle deduced from its mapping geometry, (2) an inherited inactive fault, (3) a locked fault at the surface, and possibly (4) the ductile rheology of the underlying formation (Mutan clay turbidites – MT). Consequently, better geologically mapping and monitoring of the Kenting Fault is needed in order to better understand its geometry, rheology and active tectonic behavior.
Nevertheless, the shallow seismicity (Deffontaines et al., 2016) confirms the high onshore shallow tectonic activity that hits the Hengchun Peninsula. The major, deep offshore Hengchun earthquake (26 December 2006, depth: 44 km, ML= 7.0) also participated in the active deformation of the Hengchun Peninsula.
Further dating ought to first be done with respect to the Hengchun Peninsula folding then undertaken in order to better characterize the ages of the terraces, paleosurfaces and the different deposits of the Hengchun Basin in order to inverse and reconstruct its tectonic history (Liew and Lin, 1987; Chen and Liu, 1993).
Finally, due to the average Hengchun Fault along-strike variations (around 8 ± 2 mm yr−1 displacement toward the LOS confirmed by leveling lines – Fig. 12), it is definitely important to better constrain the Hengchun Peninsula's active tectonics in order to prevent major destruction and major failure in the near future, such as damage to sensitive energy industries (e.g., Taiwan Nuclear Power Plant No. 3, situated along the southern tip of the Hengchun Fault).
The ALOS SAR images were obtained from the Japan Aerospace Exploration Agency. UAS data were acquired by the authors. The UAS data can be obtained upon request to the corresponding author (epidote@ntut.edu.tw).
The authors declare that they have no conflict of interest.
This article is part of the special issue “The use of remotely piloted aircraft systems (RPAS) in monitoring applications and management of natural hazards”. It is a result of the EGU General Assembly 2016, Vienna, Austria, 17–22 April 2016.
We are grateful to Andy Hooper for having developed and permitting to use the
“StaMPS/MTI” algorithms. We thank also the Japan Aerospace Exploration Agency
(JAXA) for the ALOS data in the scope of PI 112-0001 project (project
no. 5226904000; PI Benoit Deffontaines). Erwan Pathier (UJF Grenoble) and
Benedicte Fruneau (UPE) are also deeply thanked for their support during
Johann Champenois's PhD thesis. This project was partially supported by LIA
ADEPT (now D3E) no. 536, French CNRS-NSC (now MOST) and Taiwan MOST
105-2116-M-027-003.
Edited by:
Yuichi S. Hayakawa
Reviewed by: four anonymous referees
Academia Sinica GPS: available at: http://gps.earth.sinica.edu.tw/index.jsp, last access: 12 March 2018.
Bonilla, M. G.: Summary of Quaternary faulting and elevation changes in Taiwan, Mem. Geol. Soc. China, 2, 43–55, 1976.
Bühler, Y., Adams, M. S., Bösch, R., and Stoffel, A.: Mapping snow depth in alpine terrain with unmanned aerial systems (UASs): potential and limitations, The Cryosphere, 10, 1075–1088, https://doi.org/10.5194/tc-10-1075-2016, 2016.
Champenois, J.: Caractérisation des déformations tectoniques inter-sismiques de l'île de Taiwan par interférométrie radar, Geophysics, Université Paris-Est, 244 pp., 2011 (some parts in French).
Champenois, J., Deffontaines, B., Fruneau, B., Pathier, E., Lin, K. C., and Hu, J. C.: Persistent Scatterer InSAR applied to the Hengchun Peninsula (S. Taiwan), Neotectonic implications, Fringe, 2011.
Champenois, J., Fruneau, B., Pathier, E., Deffontaines, B., Lin, K.-C., and Hu, J.-C.: Monitoring of active tectonic deformations in the Longitudinal Valley (Eastern Taiwan) using Persistent Scatterer InSAR method with ALOS PALSAR data, Earth Planet. Sc. Lett., 337–338, 144–155, https://doi.org/10.1016/j.epsl.2012.05.025, 2012.
Champenois, J., Fruneau, B., Pathier, E., Deffontaines, B., and Hu, J. C.: From Collision to subductions, monitoring of ground displacements of the Hengchun Peninsula using Persistent Scatterer Interferometry (Southern Taiwan), Int Coll. Hualien, November 2014.
Chang, C. P., Angelier, J., Lee, T. G., and Huang, C.: From continental margin extension to collision orogen: structural development and tectonic rotation of the Hengchun peninsula, southern Taiwan, Tectonophysics, 361, 61–82, 2003.
Chang, C. P., Angelier, J., and Lu, C. Y.: Polyphase deformation in a newly emerged accretionary prism: Folding, faulting and rotation in the southern Taiwan mountain range, Tectonophysics, 466, 395–408, 2009a.
Chang, C. P., Angelier, J., and Huang, C. Y.: Evolution of subductions indicated by Mélanges in Taiwan, in: Subduction Zonz Geodynamics, edited by: Lallemand, S. and Funiciello, F., https://doi.org/10.1007/978-3-540-87974-9, Springer-Verlag Berlin Heidelberg, 207–225, 2009b.
Chen, H. W., Wu, L. C., Huang, C. Y., and Koichiro, M.: Late Pleistocene molluscan paleoecology of lagoon deposits of the Szekou Formation, Hengchun Peninsula, Southern Taiwan, Proceedings of the Geological Society of China, 34, 57–87, 1991.
Chen, W. S., Lee, W. C., Hunag, N. W., Yen, I. C., Yang, C. C., Yang, H. C., Chen, Y. C., and Sung, S. H.: Characteristics of accretionary prism of Hengchun Peninsula, southern Taiwan: Holocene activity of the Hengchun Fault, Western Pacific Earth Sciences, 5, 129–154, 2005.
Chen, Y. G. and Liu, T. K.: Holocene radiocarbon dates in Hengchun Peninsula and their neotectonic implications, Journal of the Geological Society of China, 36, 457–479, 1993.
Chen, Y. G. and Liu, T. K.: Holocene uplift and subsidence along an active tectonic margin south-western Taiwan, Quaternary Sci. Rev., 19, 923–930, 2000.
Cheng, Y. M. and Huang, C. Y.: Biostratigraphic study in the west Hengchun Hill, Acta Geologica Taiwanica, 18, 49–59, 1975.
CPC (Chinese Petroleum Corporation): Geologic map of Taiwan, 1:100,000, No. 7, Kaohsiung-Pingtung, Prepared by the Chinese Petroleum Corporation, Printed by the Chinese Society of Survey Engineering, 1993.
Cigna, F., Del Ventisette, C., Liguori, V., and Casagli, N.: Advanced radar-interpretation of InSAR time series for mapping and characterization of geological processes, Nat. Hazards Earth Syst. Sci., 11, 865–881, https://doi.org/10.5194/nhess-11-865-2011, 2011.
Deffontaines, B. and Chorowicz, J.: Principle of drainage basin analysis from multisource data, Application to the structural analysis of the Zaire Basin, Tectonophysics, 194, 237–263, 1991.
Deffontaines, B., Pubellier, M., Rangin, C., and Quebral, R.: Discovery of an Intra-arc transform zone in Mindanao (Philippines) using morphotectonic data, Zeistchrift für Geomorphologie, Berlin - Stuttgart., Suppl.-Bd. 94, 261–273, 1993.
Deffontaines, B., Lee, J. C., Angelier, J., Carvalho, J., and Rudant, J. P.: New geomorphic data on Taiwan active orogen: a multisource approach, J. Geophys. Res., 99, 20243–20266, 1994.
Deffontaines, B., Lacombe, O., Angelier, J., Chu, H. T., Mouthereau, F., Lee, C. T., Deramond, J., Lee, J. F., Yu, M. S., and Liew, P. M.: Quaternary transfer faulting in Taiwan Foothills: Evidence from a multisource approach, Tectonophysics, 274, 61–82, 1997.
Deffontaines, B., Liu, C. S., Angelier, J., Lee, C. T., Sibuet, J. C., Tsai, Y. B., Lallemand, S., Lu, C. Y., Lee, C. S., Hsu, S. K., Chu, H. C., and Lee, J. C.: Preliminary Neotectonic Map of Onshore-offshore Taiwan, Terr. Atmos. Ocean. Sci., Supplementary issue, 339–348, https://doi.org/10.3319/TAO.2001.12.S.339(T), 2001.
Deffontaines, B., Liu, C. S., and Hsu, H.-H.: Structure and deformation of the Southern Taiwan accretionary prism: The active submarine Fangliao Fault Zone offshore west Hengchun Peninsula, Tectonophysics, 692, 227–240, https://doi.org/10.1016/j.tecto.2016.11.007, 2016.
Deffontaines, B., Chang, K. J., Champenois, J., Fruneau, B., Pathier, E., Hu, J. C., Lu, S. T., and Liu, Y. C.: Active interseismic shallow deformation of the Pingting terraces (Longitudinal Valley – Eastern Taiwan) from UAV high-resolution topographic data combined with InSAR time series, Geomatics, Natural Hazards and Risk, 8, 120–136, https://doi.org/10.1080/19475705.2016.1181678, 2017.
Fernandez Galarreta, J., Kerle, N., and Gerke, M.: UAV-based urban structural damage assessment using object-based image analysis and semantic reasoning, Nat. Hazards Earth Syst. Sci., 15, 1087–1101, https://doi.org/10.5194/nhess-15-1087-2015, 2015.
Giordan, D., Manconi, A., Facello, A., Baldo, M., dell'Anese, F., Allasia, P., and Dutto, F.: Brief Communication: The use of an unmanned aerial vehicle in a rockfall emergency scenario, Nat. Hazards Earth Syst. Sci., 15, 163–169, https://doi.org/10.5194/nhess-15-163-2015, 2015.
Giletycz, S.: Landscape dynamics of the Hengchun Peninsula, Southern Taiwan. PhD dissertation, National Central University, Chungli, Taiwan, 184 pp., 2015.
Giletycz, S., Loget, N., Chang, C. P., and Moutherau, F.: Transient fluvial landscape and preservation of low-relief terrains in an emerging orogen: example from Hengchun Peninsula, Taiwan, Geomorphology, 231, 169–181, 2015.
Hanssen, R. F.: Radar interferometry: Data interpretation and error analysis, Kluwer Academic Publishers, USA, 2001.
Ho, C. S.: A synthesis of geological evolution of Taiwan, Tectonophysics, 125, 1–16, 1986.
Ho, C. S.: An introduction to the geology of Taiwan and explanatory text of the geologic map of Taiwan. Taipei, Taiwan, Central Geological Survey, Ministry of Economic Affairs, 192 pp., 1988.
Hooper, A.: StaMPS/MTI Manual, version 3.1. Delft Institute of Earth Observation and Space Systems Delft University of Technology, The Netherlands, 2009.
Hooper, A., Segall, P., and Zebker, H.: Persistent scatterer InSAR for crustal deformation analysis, with application to Volcán Alcedo, Galapagos, J. Geophys. Res, 112, B07407, https://doi.org/10.1029/2006JB004763, 2007.
Hsu, T. L. and Chang, H. C.: Quaternary faulting in Taiwan, Mem. Geol. Soc. China, 3, 155–165, 1979.
Huang, C. Y.: Some planktic foraminifers from the olistostromes of the Kenting Formation, southern Hengchun Peninsula, Acta Geol. Taiwan, 22, 22–34, 1984.
Huang, C. Y.: Foraminiferal paleoecology of a late Pleistocene lagoonal sequence of the Szekou formation in the Hengchun Peninsula, Southern Taiwan, Proceedings of the geological society of China, 33, 181–206, 2006.
Huang, C. Y., Wu, W. Y., Chang, C. P., Tsao, S., Yuan, P. B., Lin, C. W., and Xia, K. Y.: Tectonic evolution of accretionary prism in the arc-continent collision terrane of Taiwan, Tectonophysics, 281, 31–51, 1997.
Huang, M. J. and Chang, K. J.: Unmanned Aerial Vehicle (UAV) associated DTM quality evaluation and application, Mag. Chinese Inst. Civil Hydraulic Eng., 41, 52–58, 2014 (in Chinese with English abstract).
Lallemand, S., Font, Y., Bijwaard, H., and Kao, H.: New insights on 3-D plates interaction near Taiwan from tomography and tectonic implications, Tectonophysics, 335, 229–253, 2001.
Lee, C. T.: Neotectonics and active fault in Taiwan, Proceedings of 1999 Workshop on Disaster Prevention/Management & Green Technology, Foster City, CA, USA, 61–74, 1999.
Lee, J. C., Angelier, J., Chu, H. T., Yu, S. B., and Hu, J. C.: Plate-boundary strain partitioning along the sinistral collision suture of the Philippine and Eurasian plates: analysis of geodetic data and geological observation in southeastern Taiwan, Tectonics, 17, 159–181, 1998.
Lee, J. C., Jeng, F. S., Chu, H. T., Angelier, J., and Hu, J. C.: A rod-type creepmeter for measurement of displacement in active fault zone, Earth Planets Space, 52, 321–328, 2000.
Lee, J. C., Angelier, J., Chu, H. T., Hu, J. C., and Jeng, F. S.: Continuous monitoring of an active fault in a plate suture zone: a creepmeter study of the Chihshang Fault, eastern Taiwan, Tectonophysics, 333, 219–240, 2001.
Lee, J. C., Angelier, J., Chu, H. T., Hu, J. C., Jeng, F. S., and Rau, R. J.: Active fault creep variations at Chihshang, Taiwan, revealed by creep meter monitoring, 1998–2001, J. Geophys. Res.-Sol. Ea., 108, 2528, https://doi.org/10.1029/2003JB002394, 2003.
Lee, J. C., Angelier, J., Chu, H. T., Hu, J. C., and Jeng, F. S.: Monitoring active fault creep as a tool in seismic hazard mitigation. Insights from creepmeter study at Chihshang, Taiwan, Compt. Rendus Geosci., 337, 1200–1207, 2005.
Lee, J. C., Chu, H. T., Angelier, J., Hu, J. C., Chen, H. Y., and Yu, S. B.: Quantitative analysis of surface coseismic faulting and postseismic creep accompanying the 2003, Mw = 6.5, Chengkung earthquake in eastern Taiwan, J. Geophys. Res.-Sol. Ea., 111, B02405, https://doi.org/10.1029/2005JB003612, 2006.
Liew, P. M. and Lin, C. F.: Holocene tectonic activity of the Hengchun Peninsula as evidenced by the deformation of marine terraces, Memoir of the Geological Society of China, 9, 241–259, 1987.
Lin, C. W., Chang, H. C., Lu, S. T., Shih, T. S., and Huang, W. J.: An introduction to the active faults of Taiwan-Explanatory text of the active fault map of Taiwan, Spec. Central Geol. Sury., 13, 122 pp., 2000 (in Chinese with English abstract).
Lin, C. W., Chen, W.-S., Liu, Y.-C., and Chen, P.-T.: Active Fault of Eastern and Southern Taiwan: Explanatory text for the strip maps of active faults scale 1 : 25 000, Central Geological Survey, MOEA, Chapter 3, 149–163, 2009 (in Chinese).
Lin, S. B. and Wang, Y. R.: Clay minerals in the rock formations on the Hengchun Peninsula, Southern Taiwan, and their tectonic implications, Eastern Pacific Earth Sciences, 1, 157–174, 2001.
Lundberg, N., Reed, D. L., Liu, C. S., and Lieske, J. J.: Structural controls on orogenic sedimentation, submarine Taiwan collision, Acta Geologica Taiwanica, 30, 131–140, 1992.
Lundberg, N., Reed, D. L., Liu, C. S., and Lieske J. J.: Forearc-basin closure and arc accretion in the submarine suture zone south of Taiwan, Tectonophysics, 274, 5–23, 1997.
Malavieille, J., Lallemand, S. E., Dominguez, S., Deschamps, A., Lu, C.-Y., Liu, C.-S., Schnurle, P., and ACT Scientific Crew: Arc-continent collision in Taiwan. New marine observations and tectonic evolution, in: Geology and Geophysics of an Arc-Continent collision, Taiwan, edited by: Byrne, T. B. and Liu, C.-S., Republic of China, Boulder, Colorado, Geological Society of America Special Paper, 358, 187–211, 2002.
Malavieille, J., Mollic, G., Gentia, M., Dominguez, S., Beyssac, O., Taboada, A., Vitale-Brovaroned, A., Lu, C.-Y., and Chen, C.-T.: Formation of ophiolite-bearing tectono-sedimentary mélanges inaccretionary wedges by gravity driven submarine erosion: Insightsfrom analogue models and case studies, J. Geodyn., 100, 87–103, https://doi.org/10.1016/j.jog.2016.05.008, 2016.
Page, B. M. and Lan, C. Y.: The Kenting mélange and its record of tectonic events, Memoir of the Geological Society of China, 5, 227–248, 1983.
Pathier, E., Fruneau, B., Deffontaines, B., Angelier, J. Chang, C. P., Yu, S. B., and Lee, C. T.: Coseismic displacements of the footwall of the Chelungpu fault caused by the 1999, Taiwan, Chi-Chi earthquake from InSAR and GPS data, Earth Planetary Science Letters, 212, 73–88, 2003.
Pelletier, B. and Stephan, J. F.: Middle Miocene obduction and late Miocene beginning of collision registered in the Hengchun Peninsula: Geodynamics implications for the evolution of Taiwan, Memoir of the Geological Society of China, 7, 301–324, 1986.
Pubellier, M., Deffontaines, B., Quebral, R., and Rangin, C.: Drainage network analysis and tectonics of Mindanao, Southern Philippines, Geomorphology, 9, 325–342, 1994.
Reed, D. L., Lundberg, N., Liu, C. S., and Kuo, B.-Y.: Structural relations along the margins of the offshore Taiwan accretionary wedge; implication for accretion and crustal kinematics, Acta Geologica Taiwanica, 30, 105–122, 1992.
Rokkaku, H. and Makiyama, T.: Report on the Geology of the Hengchun oil field, Taiwan. Bureau of Productive Industries, Government-General of Taiwan, 669, 43 pp., 1934 (in Japanese).
Shyu, J. B. H., Sieh, K., Chen, Y.-G., and Liu, C.-S.: Neotectonic architecture of taiwan and its implications for future large earthquakes, J. Geophys. Res., 110, https://doi.org/10.1029/2004JB003251, B08402, 2005.
SSCDLA: available at: http://gps.moi.gov.tw/SSCenter/Introduce_E/IntroducePage_E.aspx?Page=Height_E6, last access: 13 February 2018.
Sung, Q. C.: Explanatory text of the geologic map of Taiwan, 1 : 50 000, sheet 69–72, Hengchun Peninsula, Published by the Central Geological Survey, Ministry of Economics Affaires, 77 pp., 1991 (in Chinese).
Sung, Q. C. and Wang, Y.: Sedimentary environments of the Miocene sediments in the Hengchun Peninsula and their tectonic implication, Memoir of the Geological Society of China, 7, 325–340, 1986.
Suppe, J.: Mechanics of mountain building in Taiwan, Mem. Geol. Soc. China, 4, 67–89, 1981.
Suppe, J.: Kinematics of arc-continent collision, flipping of subduction, and back arc spreading near Taiwan, Mem. Geol. Soc. China, 6, 21–33, 1984.
Tokarczyk, P., Leitao, J. P., Rieckermann, J., Schindler, K., and Blumensaat, F.: High-quality observation of surface imperviousness for urban runoff modelling using UAV imagery, Hydrol. Earth Syst. Sci., 19, 4215–4228, https://doi.org/10.5194/hess-19-4215-2015, 2015.
Tsan, S.: The kenting formation : a note of hengchun peninsula stratigraphy, Proc. Geol. Soc. 17, 131–134, 1974.
Vita-Finzi, C. and Lin, J.-C.: Neotectonics and seismic hazard assessment in hengchun peninsula, southern taiwan, Comptes Rendus Geosciences, 337, 1194–1199, 2005.
Yu, S. B., Chen, H. Y., and Kuo, L. C.: Velocity field of GPS stations in the Taiwan area, Tectonophysics, 274, 41–59, 1997.
Zhang, X., Cawood, P. A., Huang, C. Y., Wang, Y., Yan, Y., Santosh M., Chen, W., and Yu, M.: From convergent plate margin to arc-continent collision: Formation of the Kenting Mélange, Southern Taiwan, Gondwana Research, 38, 171–182, 2016.
- Abstract
- Introduction
- High-resolution DSM obtained from UAS
- Geology of the Hengchun area
- Inputs of PS-InSAR interferometry on the Hengchun Fault
- Discussion: updated Hengchun active tectonic model
- Conclusions and perspectives
- Data availability
- Competing interests
- Special issue statement
- Acknowledgements
- References