the Creative Commons Attribution 4.0 License.
the Creative Commons Attribution 4.0 License.
 | 15 May 2019
Synoptic-scale conditions and convection-resolving hindcast experiments of a cold-season derecho on 3 January 2014 in western Europe
Luca Mathias
Joaquim G. Pinto
A major linear mesoscale convective system caused severe weather over northern France, Belgium, the Netherlands and northwestern Germany on 3 January 2014. The storm was classified as a cold-season derecho with widespread wind gusts exceeding 25 m s−1. While such derechos occasionally develop along cold fronts of extratropical cyclones, this system formed in a postfrontal air mass along a baroclinic surface pressure trough and was favoured by a strong large-scale air ascent induced by an intense mid-level jet. The lower-tropospheric environment was characterised by weak latent instability and strong vertical wind shear. Given the poor operational forecast of the storm, we analyse the role of initial and lateral boundary conditions to the storm's development by performing convection-resolving limited-area simulations with operational analysis and reanalysis datasets. The storm is best represented in simulations with high temporally and spatially resolved initial and lateral boundary conditions derived from ERA5, which provide the most realistic development of the essential surface pressure trough. Moreover, simulations at convection-resolving resolution enable a better representation of the observed derecho intensity. This case study is testimony to the usefulness of ensembles of convection-resolving simulations in overcoming the current shortcomings of forecasting cold-season convective storms, particularly for cases not associated with a cold front.


Mesoscale convective systems (MCSs) often occur in central Europe, particularly in late spring and summer. In some cases, MCSs exhibit a linear structure, last for several hours and lead to both intense wind gusts and precipitation over large areas and are sometimes classified as derechos (Johns and Hirt, 1987). While such events primarily occur over western Europe during the summer half of the year (Gatzen, 2004), they may also occur during wintertime (Gatzen et al., 2011). The majority of such cold-season derechos occur in association with the passage of a cold front from an extratropical cyclone embedded in a northwesterly flow (Ludwig et al., 2015; Gatzen, 2018). However, on 3 January 2014, a linearly organised convective system did not form along a cold front but in a postfrontal air mass within a southwesterly flow and crossed over the northern tip of France, the Benelux region and the northwestern part of Germany, causing mostly non-tornadic wind damage along an approximately 650 km long path (Fig. 1). The magnitude of the convective gusts ranged mostly between 20 and 30 m s−1, but hurricane-force wind gusts (>32.7 m s−1) were measured locally between 13:00 and 22:00 UTC (Fig. 1). Additionally, F1-rated wind damage was reported in western Belgium and northwestern Germany (Fig. 1). According to these observations, this convective event can be classified as a cold-season derecho following the definition of Johns and Hirt (1987), which includes four essential points: (1) a concentrated area with convective gusts >25.7 m s−1 having a major axis length of at least 400 km must be observed, (2) the gust reports within the area defined in (1) must show a non-random pattern of chronological progression, (3) the area defined in (1) must contain at least three reports of F1 wind damage (≥32.5 m s−1) and/or convective gusts ≥33.4 m s−1, which are separated by 64 km or more, and (4) less than 3 h should elapse between the gust reports defined in (1). Moreover, three tornadoes have been confirmed according to the European Severe Weather Database (ESWD; Dotzek et al., 2009). In addition to the non-tornadic and tornadic wind damage, local reports of thick layers of small hail or graupel are archived in the ESWD. Furthermore, the derecho-producing mesoscale convective system (DMCS) was not well anticipated by the national weather services1. The short-term synoptic reports by the German Weather Service (Deutscher Wetterdienst, DWD) and the Royal Netherlands Meteorological Institute (Koninklijk Nederlands Meteorologisch Instituut, KNMI), issued on the morning of 3 January 2014, mentioned the probability of isolated strong thundery showers with the risk of storm-force wind gusts in the afternoon and evening. The online report2 by the European Storm Forecast Experiment (ESTOFEX) pointed out the potential for the development of a convective line that could cause severe winds and isolated tornadoes in the Netherlands. However, the forecast level 1 threat area issued by ESTOFEX did not cover the main region that was affected by the long-lived convective system. All the above-mentioned characteristics motivate a detailed review of this event.
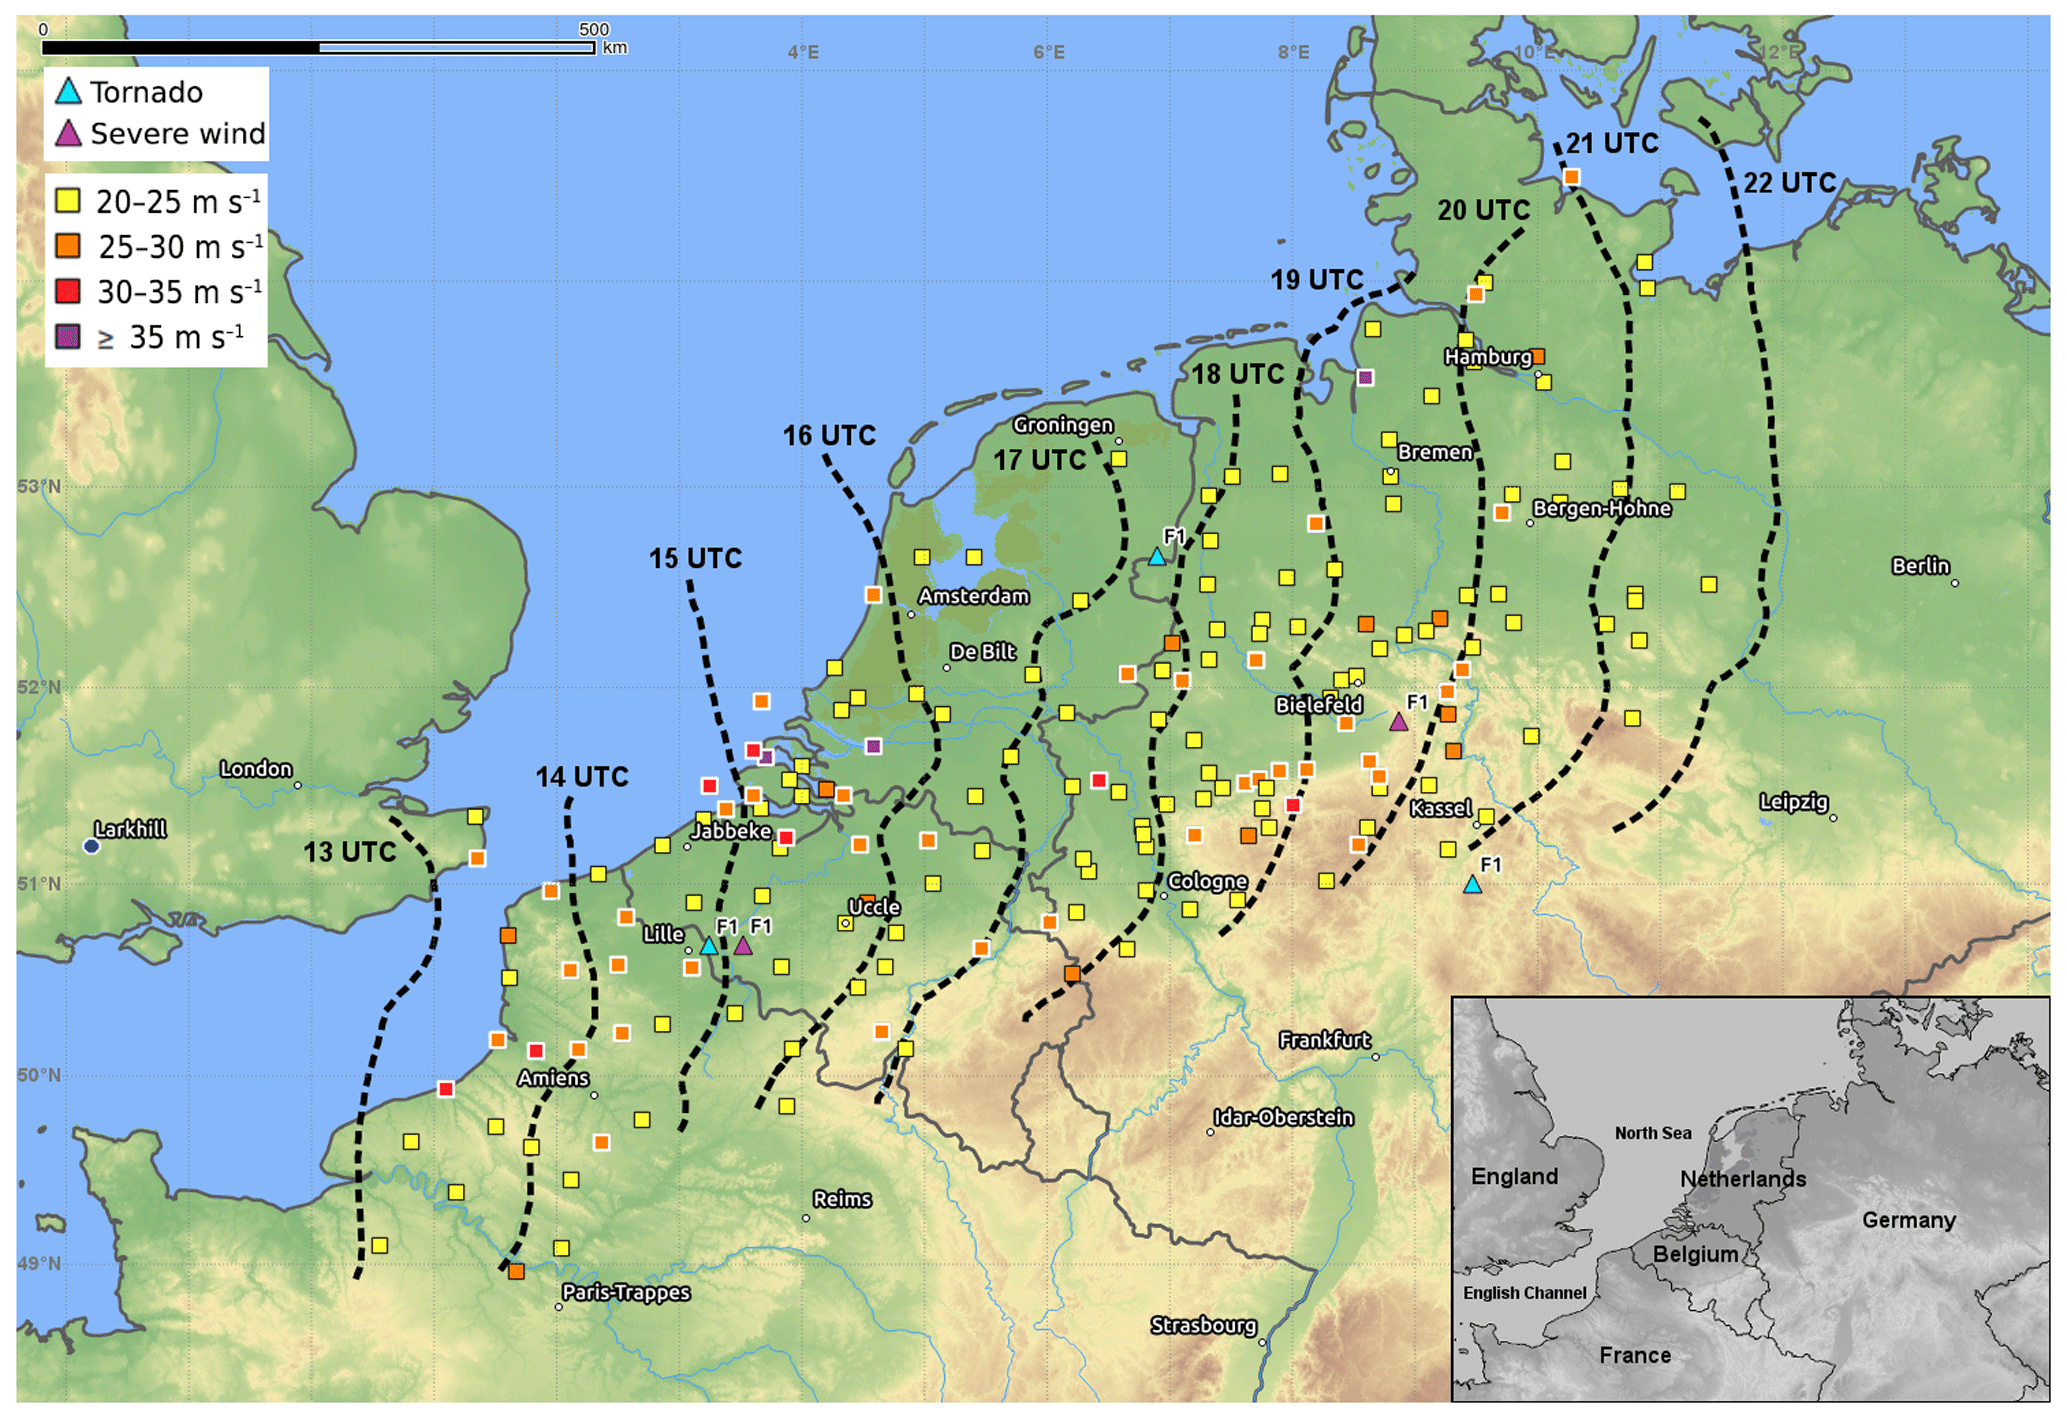
Figure 1The radar-observed position of the leading edge of the derecho-producing mesoscale convective system at hourly intervals between 13:00 and 22:00 UTC on 3 January 2014 is shown by the dashed black lines. The observed maximum wind gusts (m s−1) are denoted by the small coloured squares (see legend). The white-edged squares indicate gusts stronger than 25.7 m s−1. Tornadic and non-tornadic wind damage locations are marked by the small blue and magenta triangles, respectively (see legend). The dark blue dot denotes the location of the sounding shown in Fig. 6. The inset in the bottom-right-hand corner shows the names of the countries and sea areas within the investigation area.
Most of the studies dealing with the environmental conditions, climatology and modelling of DMCSs originate from the United States, which showed that the large-scale conditions associated with derecho events are highly variable (e.g. Evans and Doswell, 2001; Coniglio et al., 2004; Cohen et al., 2007). DMCSs developing in strongly forced synoptic regimes are associated with weak latent instability (i.e. low values of convective available potential energy, CAPE) and high shear values, which is mostly the case during the cold season (e.g. Bentley and Mote, 2000; Evans and Doswell, 2001; Gatzen et al., 2011). In addition, cold-season derechos sometimes occur in environments of very limited low-level moisture (i.e. 2 m above ground level (a.g.l.) dew points below 10 ∘C), which are then referred to as low-dew point derechos (Corfidi et al., 2006). The high-shear, low-CAPE (HSLC) environments are very challenging for the operational forecast of severe convection (Sherburn and Parker, 2014a, b).
Nevertheless, efforts have been made since the mid 2000s towards a better understanding of European derechos (e.g. Gatzen, 2004; Punkka et al., 2006; Lòpez, 2007; Gatzen et al., 2011; Hamid, 2012; Celiński-Myslaw and Matuszko, 2014; Toll et al., 2015; Taszarek et al., 2019). Gatzen (2004), Punkka et al. (2006), Lòpez (2007) and Hamid (2012) examined the large-scale conditions of single derecho events during the warm season in different parts of Europe. Celiński-Myslaw and Matuszko (2014) found that six multi-season derechos affected southern and central Poland between 2007 and 2012. Gatzen (2018) identified and classified 40 derechos that affected Germany during the 18-year period 1997–2014, including 12 winter cases. However, modelling studies about European derechos are rarely found in the literature. For instance, Toll et al. (2015) and Taszarek et al. (2019) performed hindcast experiments of warm-season derechos in eastern Europe. Ludwig et al. (2015) were able to successfully reproduce the derecho intensity of deep convection associated with the cold front of winter storm Kyrill in 2007 (Fink et al., 2009). Hence, more observational and numerical studies about well-organised DMCSs developing in cold-season conditions are needed, for instance to better understand the processes and potentially enhance the predictability of these uncommon events.
The purpose of this study is to analyse the synoptic characteristics and the predictability of this derecho event. With this aim, we examine the presence of the ingredients necessary for the development of the severe cold-season DMCS. In situ observations and numerical weather prediction (NWP) model data enable a detailed examination. Given the poor performance of the operational forecasts, high-resolution hindcast experiments are performed to investigate the reasons for this shortcoming.
This article is structured as follows. Section 2 describes the data and methods. The synoptic-scale situation and the environmental conditions associated with the convective windstorm are highlighted in Sect. 3. Section 4 discusses the predictability issues and analyses the model experiments. The last section includes a short summary and our conclusions.
The in situ wind measurements used in this study include data from the synoptic weather station networks operated by numerous national weather services (Météo-France, Royal Meteorological Institute of Belgium (RMIB), United Kingdom's Meteorological Office (UK Met Office), KNMI, DWD) and by the private weather service MeteoGroup. The 12:00 UTC upper-air sounding from Larkhill (WMO 03743) is considered representative of the environmental conditions in which the DMCS developed. The RMIB radar composite image is produced on a 500 m grid by combining pseudo Constant Altitude Plan Position Indicators (CAPPI) at 1.5 km altitude of four operative C-band radars located in Belgium and France. The KNMI composite image consists of pseudo CAPPI at a height of 1.5 km on a 1 km grid, which are based on the measurements of two Dutch C-band Doppler radars.
In addition to the in situ and radar data, the recently released ERA5 data from the European Centre for Medium-Range Weather Forecasts (ECMWF) are used to examine the synoptic-scale conditions. ERA5 was produced using 4DVar data assimilation with the model cycle Cy41r2 of ECMWF's Integrated Forecast System (IFS). The hourly reanalysis data output have a grid spacing of approximately 31 km (Hersbach et al., 2019). Furthermore, the predictability issue will be briefly described using the operational ECMWF's Ensemble Prediction System (ECMWF-EPS) and the Consortium for Small-scale Modelling Limited-area Ensemble Prediction System (COSMO-LEPS). ECMWF-EPS consists of 50 perturbed members and one control run with a grid spacing of about 32 km (IFS release Cy40r1). COSMO-LEPS includes 16 ensemble members with a grid spacing of approximately 7 km. The initial and lateral boundary conditions (ILBCs) for each of these 16 members are selected based on a cluster analysis from two consecutive ECMWF-EPS runs (Montani et al., 2011).
The COSMO model (version 5.0, subversion 9) is used in its climate version (CLM), henceforth termed CCLM (Rockel et al., 2008), to perform high-resolution hindcast simulations of the event. The CCLM is synchronised regularly with the NWP version of the COSMO model operationally used at the DWD but excluding data assimilation or latent heat nudging. The CCLM has shown its capabilities in several convection-resolving modelling studies in the recent past (e.g. Fosser et al., 2015; Ludwig et al., 2015; Leutwyler et al., 2016; Mathias et al., 2017). For this study, a total of three simulations (each including several nesting steps) have been conducted to analyse the DMCS in more detail. A reference simulation is driven by ILBCs derived from the ERA5 dataset. Additional hindcast experiments have been conducted using ERA-Interim reanalysis (ERAI, IFS release Cy31r2; Dee et al., 2011) and ECMWF operative analysis data (ECAN, IFS release Cy40r1) to investigate the sensitivity of different ILBCs to the DMCS development. Besides the different data assimilation cycles, both datasets differ in their grid spacing (ERAI: T255, Δx≈80 km; ECAN: T1279, Δx≈16 km) and their temporal resolution (hourly data for ERA5, 6-hourly data for ERAI and ECAN).
A three-step nesting approach is necessary to obtain a very fine grid spacing (Δx≈1.1 km) in the ERA5-driven reference simulation. The ERA5 and ECAN data are first downscaled over domain 1 (D1) with a horizontal grid spacing of 7 km, followed by domain 2 (D2, Δx≈2.8 km) and finally domain 3 (D3, only for ERA5, Δx≈1.1 km; see Fig. 2a for domain configuration). For ERAI ILBCs, an additional preceding nesting step (D0, grid spacing of 25 km) is necessary to avoid large resolution jumps (Matte et al., 2017). The ERAI and ECAN simulations are both downscaled to a final grid spacing of 2.8 km (D2) in order to analyse the differences in the atmospheric conditions during the development of the DMCS in comparison to the ERA5 reference simulation. Moreover, the increase in the horizontal resolution from D0 to D3 is accompanied by a simultaneous increase in the vertical resolution, which is a common method implemented by national weather services using COSMO (e.g. DWD, MeteoSwiss) to obtain a numerically stable convection-resolving NWP. The 1.1 km simulation forced with ERA5 data is used for a detailed comparison with radar and wind gust observations.
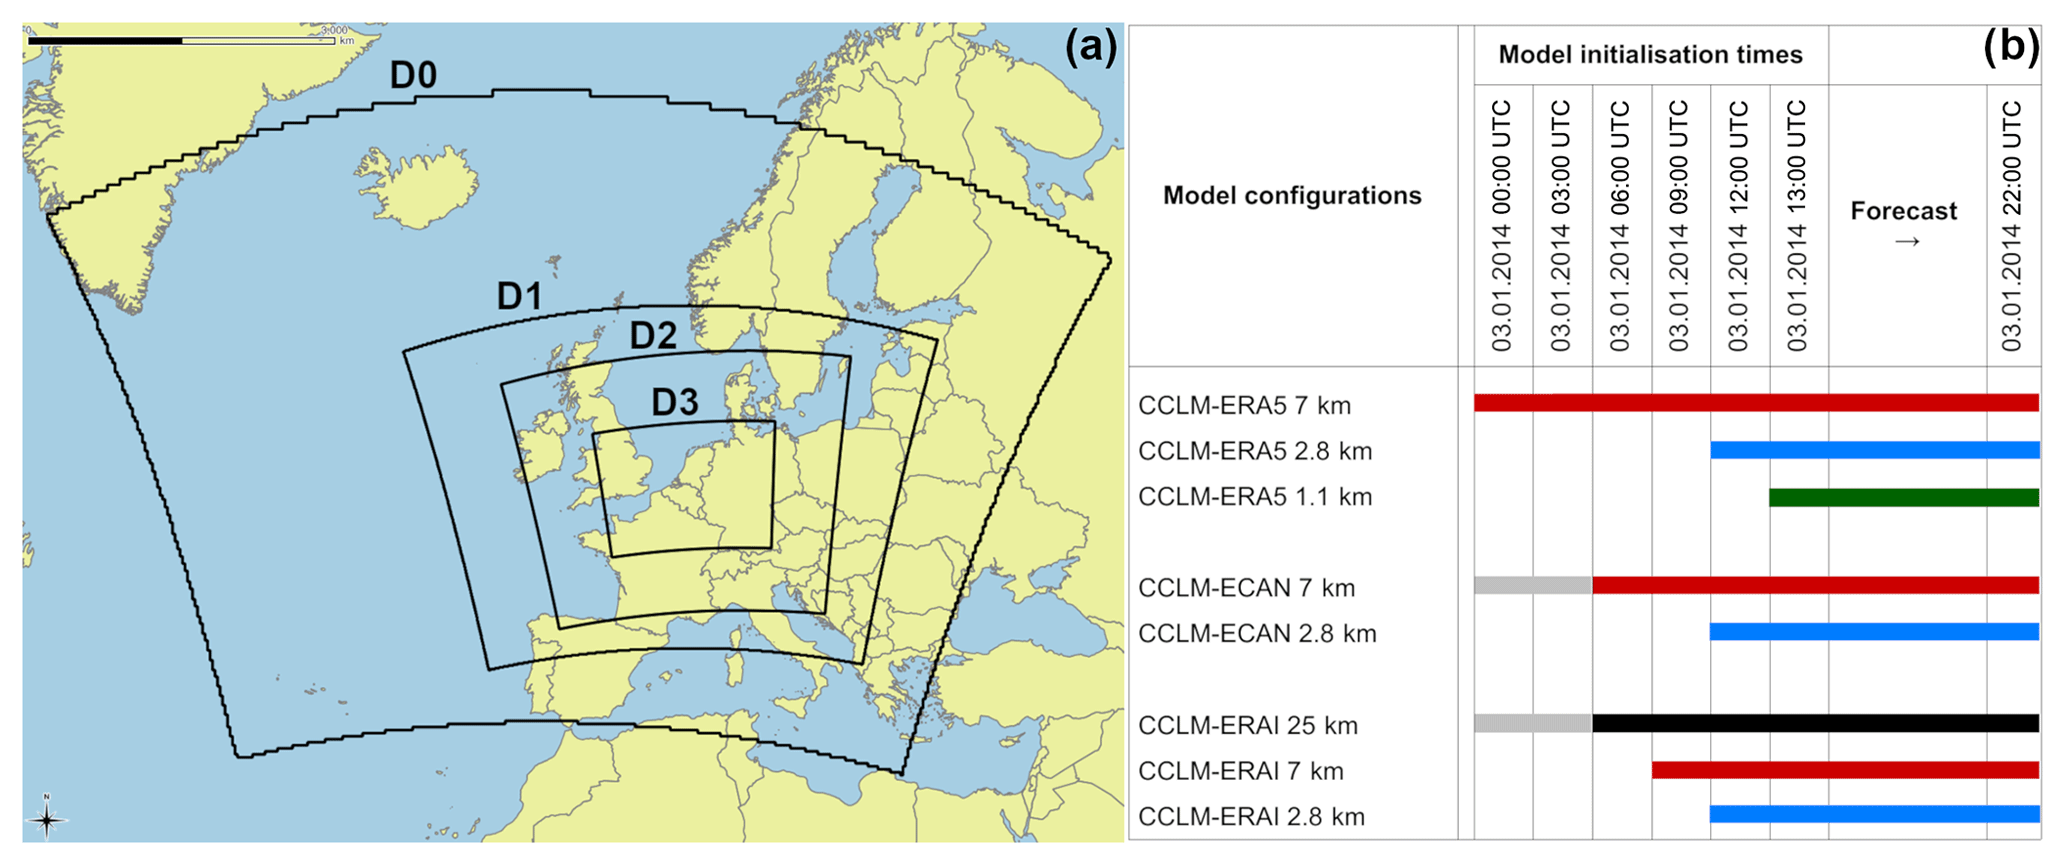
Figure 2(a) Computational domains used for the nesting of the CCLM simulations and (b) Gantt chart overview of the different CCLM configurations and initialisation times.
The CCLM is able to resolve deep moist convection (convection-resolving model; Baldauf et al., 2011; Prein et al., 2015) at grid spacing smaller than 4 km, while shallow convection is still parameterised. Thus, for the first nesting steps (D0, D1) the convective mass flux is parameterised after Tiedtke (1989), while for the higher-resolution runs (D2, D3) this scheme is only applied to shallow convection (see Table 1). As an upper boundary condition, damping against boundary fields is applied. The wind gusts are estimated based on a diagnostic parameterisation depending on the wind speed at 10 m a.g.l. and the friction velocity (Schulz, 2008):
with the empirical factors 3.0 and 2.4 motivated by the Prandtl layer theory (Panofsky and Dutton, 1984). The friction velocity is computed using the drag coefficient for momentum CD and the wind speed at 10 m a.g.l.:
An overview of the physical parameterisations that are used for all domains is given in Table 1 and a more detailed description can be found in Doms et al. (2011). To overcome unbalanced information for the mass and wind field in the initialisation process and to accelerate the spin-up process, a time-filtering approach after Lynch (1997) is applied in CCLM.

To perform a consistent analysis and comparison of the simulated DMCS based on the different datasets for ILBCs, all 2.8 km simulations start at 12:00 UTC (D2). Due to the different spatial resolutions of the individual forcing data, different nesting steps and initial times had to be used (see Gantt chart in Fig. 2b for a detailed overview of the individual nesting strategies). The highest-resolution simulation (1.1 km) based on nesting with ERA5 data started at 13:00 UTC (D3). ECAN- and ERAI-driven simulations with identical starting times to ERA5 (00:00 UTC) in D1 have also been computed but will not be further discussed due to their poorer performance. Additional simulations have been conducted to analyse the sensitivity of ILBCs on the resulting derecho. Regarding the initial conditions, ECAN-driven simulations initialised at 00:00 UTC were performed with initial wind and moisture variables replaced by the respective ERA5 fields, while the ECAN boundary conditions remained unchanged. To consider the importance of the update frequency of the lateral boundary conditions (LBCs), an additional ERA5-driven simulation was performed where the LBCs are updated every 6 h (as opposed to hourly updates in the reference simulation). For all experiments, the model output is stored on an hourly basis for the 7 km simulations and with a 15 min interval for the 2.8 and 1.1 km simulations.
The large-scale environmental conditions associated with the derecho are examined based on ERA5 reanalysis data and an upper-air sounding. At 12:00 UTC on 3 January 2014, a deep low-pressure system (core pressure of 949 hPa) named “Anne” was situated over the North Atlantic close to Scotland (Fig. 3) and high pressure (1022 hPa) was diagnosed north of the Alps. Consequently, a strong horizontal pressure gradient existed over the British Isles and over parts of France, Belgium and the Netherlands. The frontal system of the surface low extended from the Norwegian Sea over Denmark and Germany all the way south to the Iberian Peninsula (Fig. 3). The occluded front had a warm character, meaning that the near-surface air directly behind the front was slightly warmer and moister than the prefrontal air (not shown). Moreover, a surface trough was diagnosed by the UK Met Office over the English Channel (Fig. 3), which was related to the development of the DMCS. At 15:00 UTC, the surface trough reached western Belgium and corresponded to a weak isallobaric gradient (Fig. 4a). This trough was associated with large-scale upward motion located at the cyclonic exit of a mid-level jet (Fig. 4c, e). In addition, the pressure trough was associated with weak baroclinity, because the lower-tropospheric temperature dropped by a few kelvin after the passage of the trough (not shown). At 18:00 UTC, 3 h later, the surface trough was located over northwestern Germany and the isallobaric gradients strengthened (Fig. 4b). The trough also remained in phase with the large-scale forcing for ascent, as it was vertically aligned with strong divergence at the exit of the mid-level jet and ahead of a negatively tilted upper-level trough situated over Belgium (Fig. 4d, f).
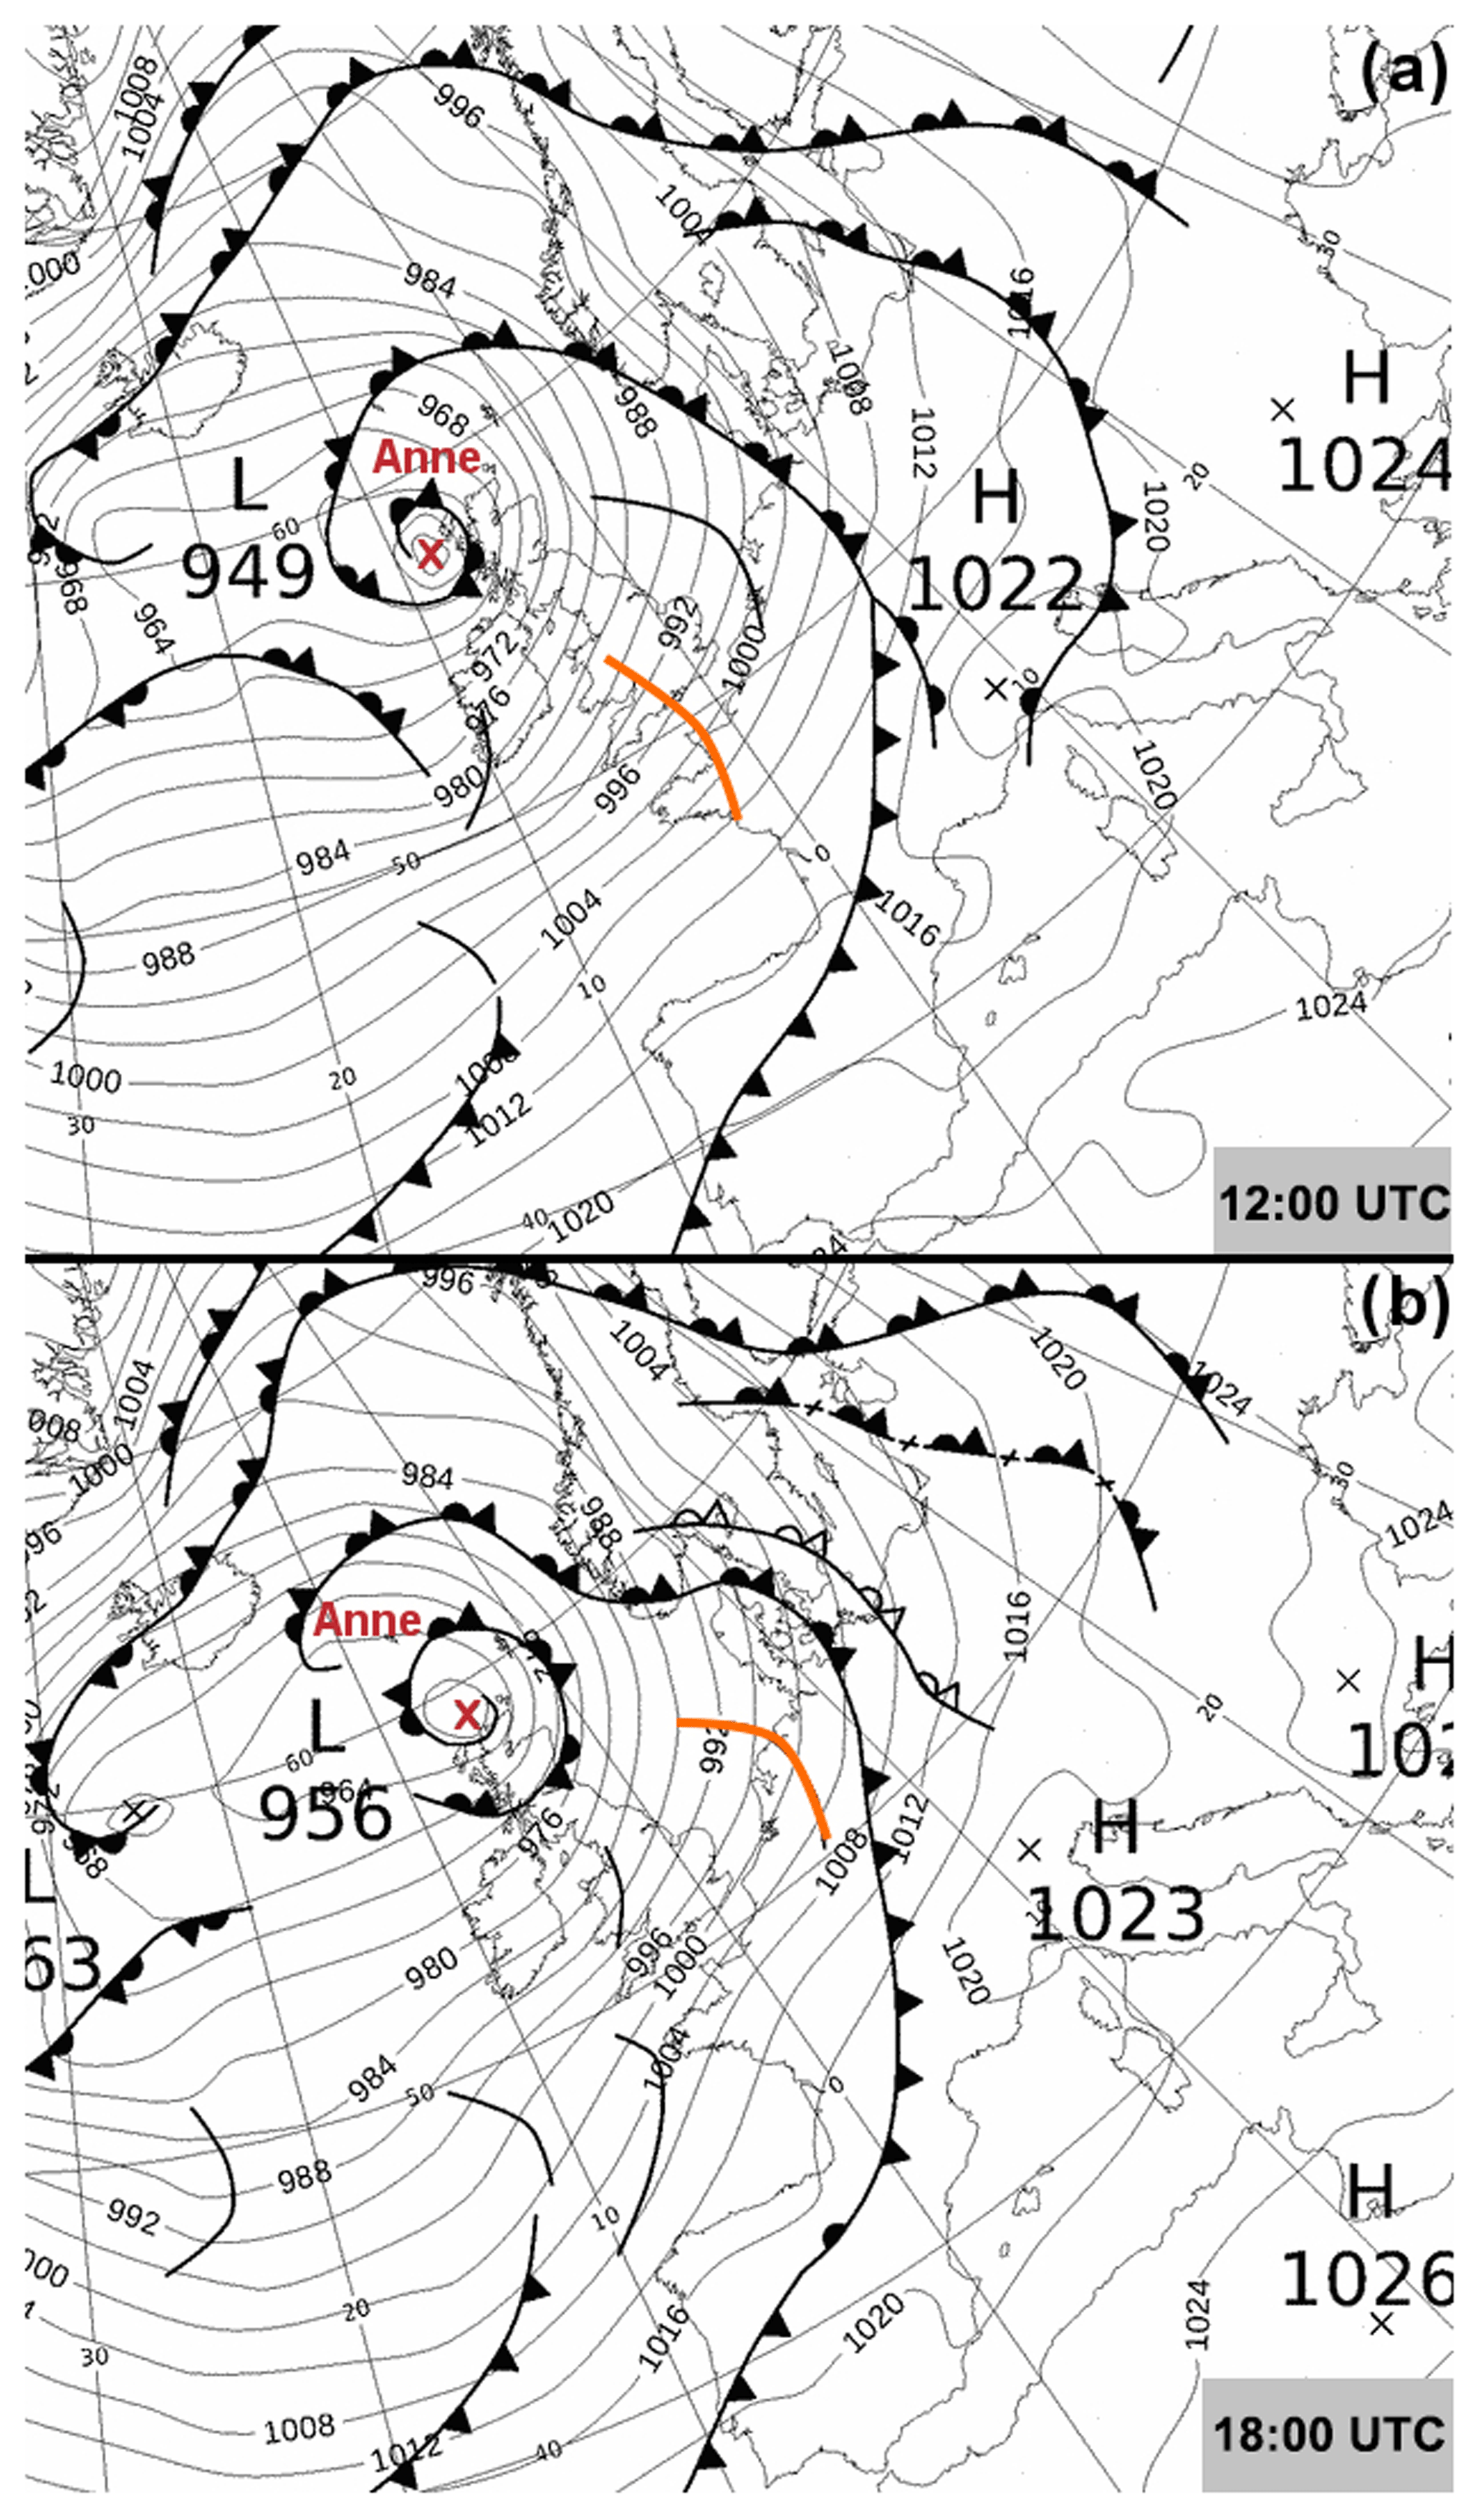
Figure 3Surface weather chart of mean sea level pressure (hPa), fronts and surface troughs at (a) 12:00 UTC and (b) 18:00 UTC on 3 January 2014 (source: UK Met Office). The surface trough associated with the development of the derecho-producing mesoscale convective system is denoted by the orange line.
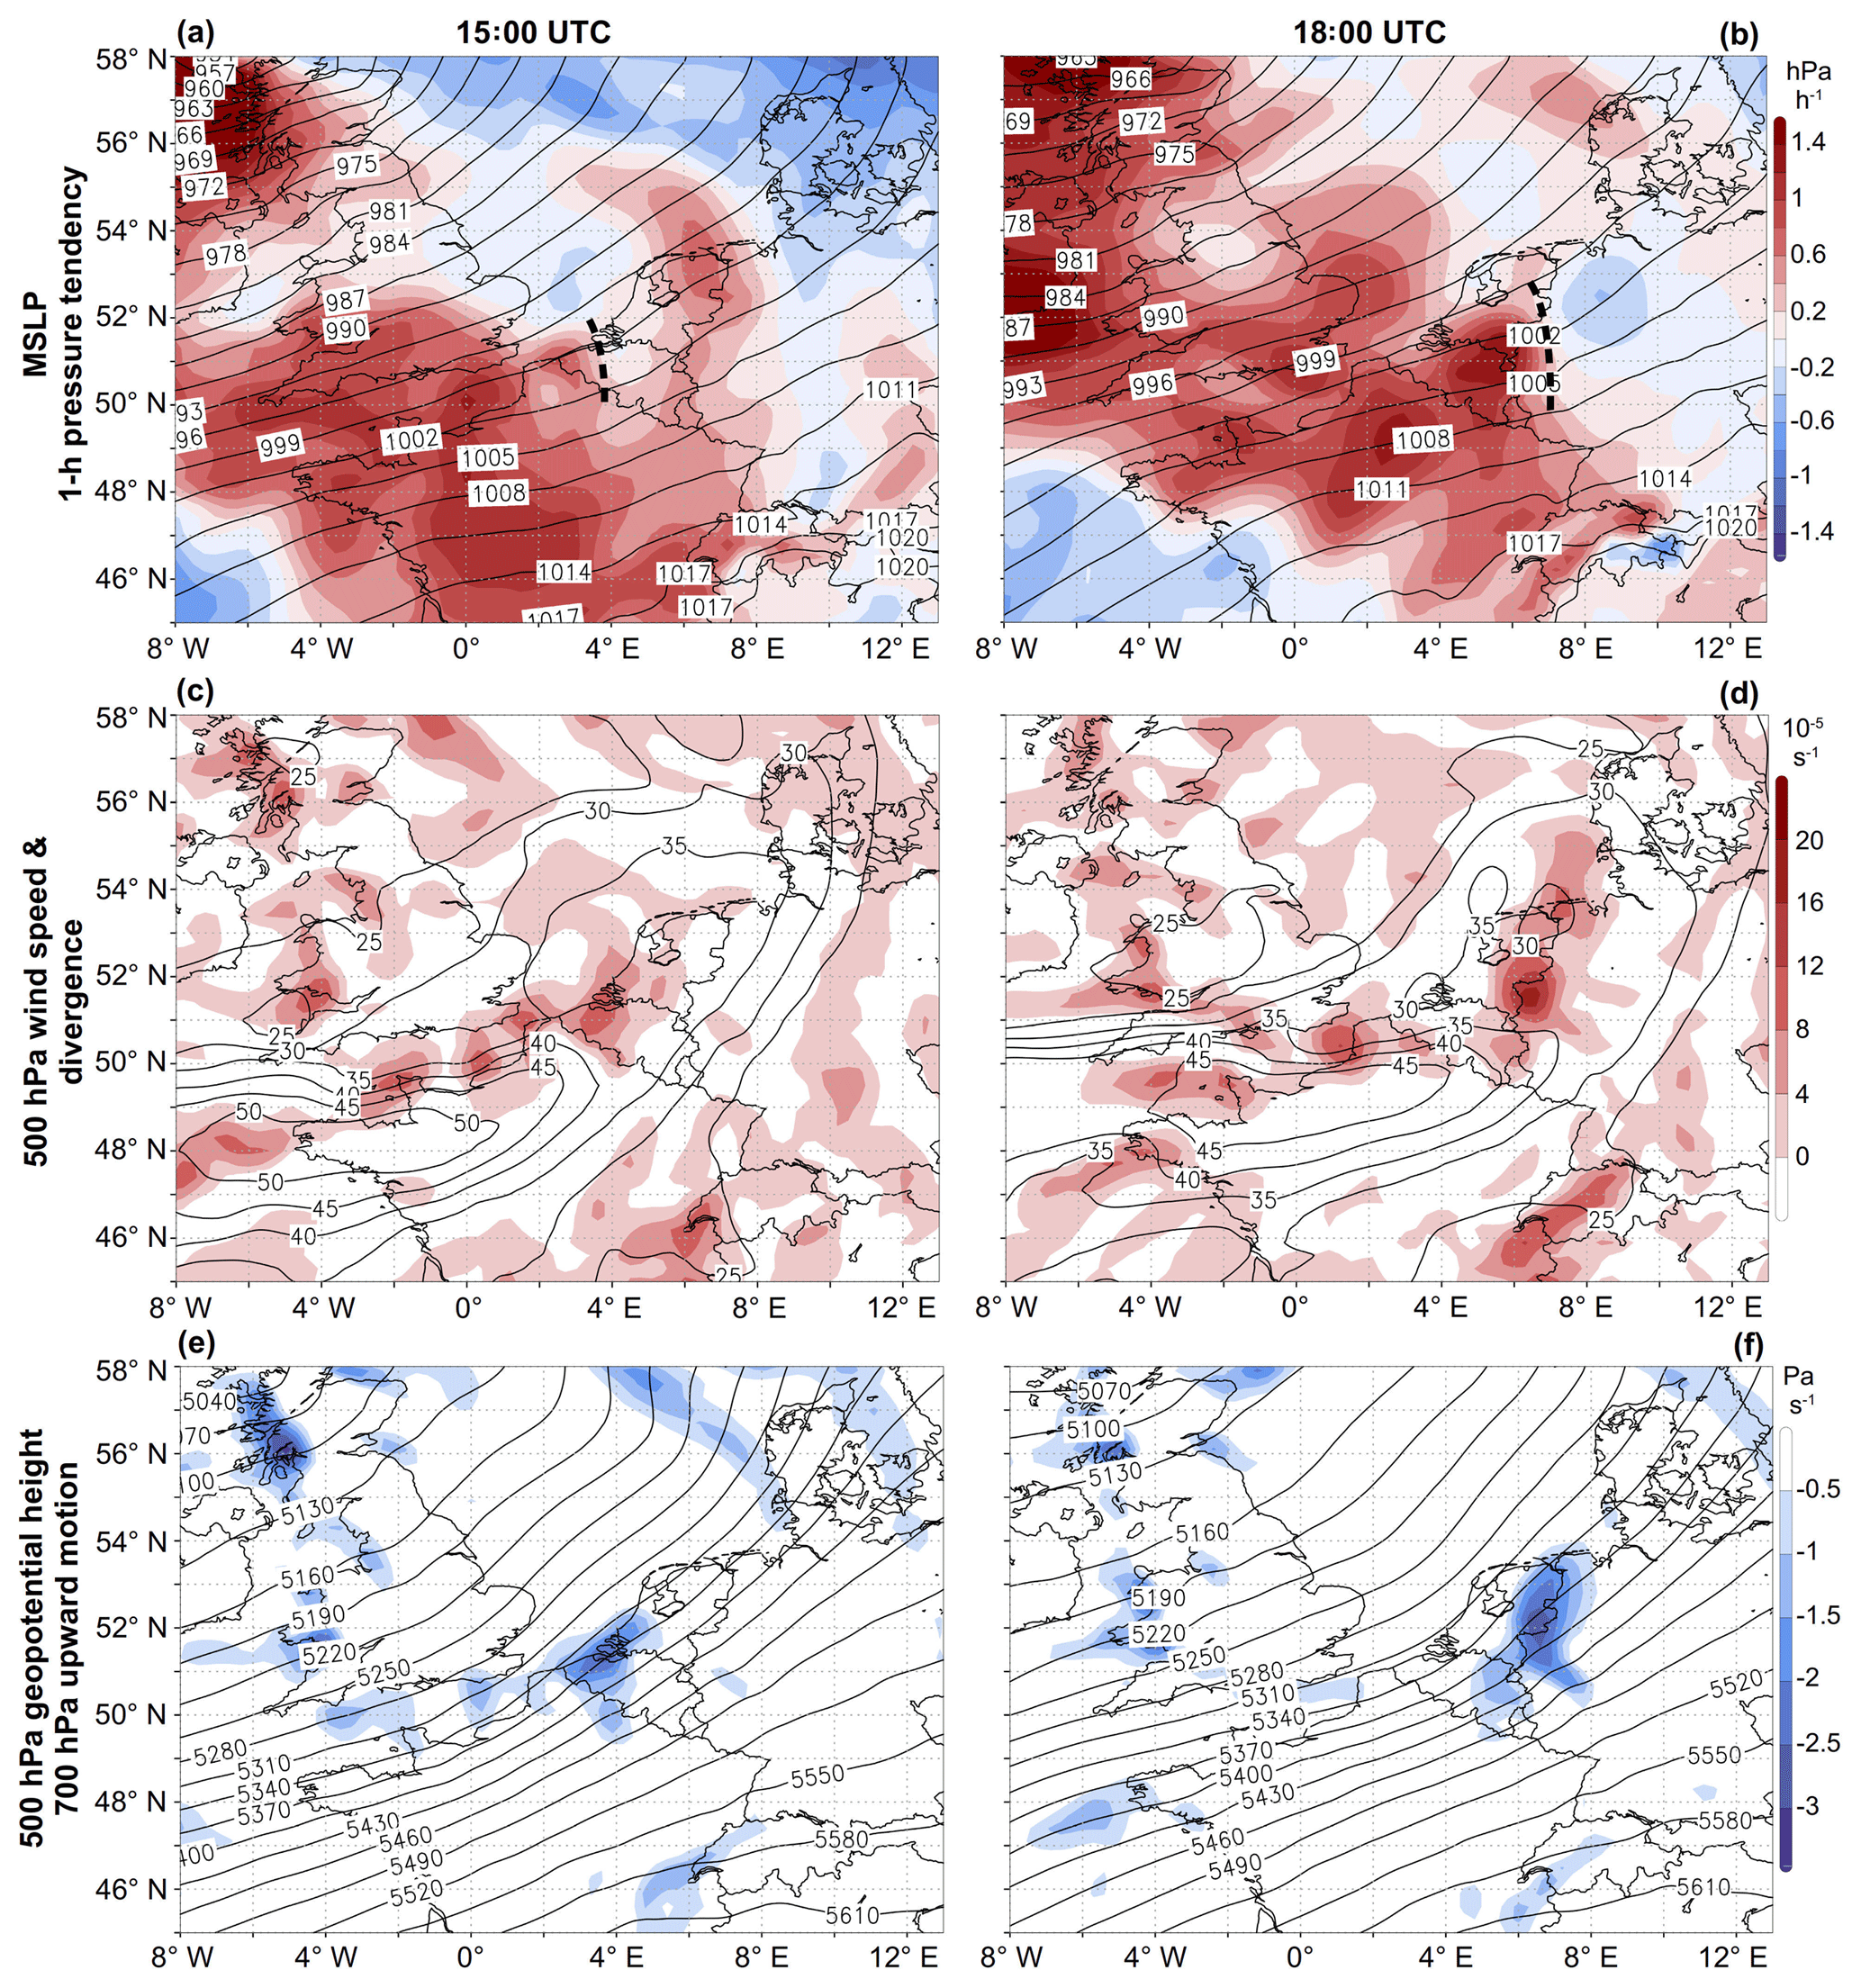
Figure 4ERA5 reanalysis of the synoptic-scale conditions at 15:00 and 18:00 UTC on 3 January 2014. (a–b) Mean sea level pressure (hPa; black lines) and hourly pressure tendency (hPa h−1; shaded), (c–d) 500 hPa wind speed (m s−1; contour lines starting at 25 m s−1) and divergence (10−5 s−1; shaded), (e–f) 500 hPa geopotential height (gpm; black lines) and diagnosed 700 hPa upward motion (Pa s−1; shaded). The dashed black line in (a) and (b) denotes the surface pressure trough.
The ingredients-based method by Johns and Doswell (1992) prescribes three necessary elements for the occurrence of deep moist convection. First, a sufficient amount of moisture in the boundary layer is required. A tongue of enhanced low-level moisture existed between the occluded front and the postfrontal surface trough at 12:00 UTC (cf. Figs. 3a and 5a). Near-surface dew points of 7 to 9 ∘C (not shown) and 950 hPa specific humidity values above 5 g kg−1 were observed over France, western Germany and Benelux (Fig. 5a). Backward trajectories indicate that the unusual moist air mass (for this season) was advected from the northeastern Atlantic over the Bay of Biscay towards western Europe (not shown). At 18:00 UTC, the moisture tongue covered eastern France and large parts of Germany with slightly lower values of specific humidity (Fig. 5b).
The second necessary ingredient is a sufficiently steep lapse rate in the lower to middle troposphere above the moist layer. At 12:00 UTC, lapse rates of 6.5 to 7 K km−1 between 900 and 650 hPa covered the British Isles, the English Channel and northwestern France (Fig. 5c). Upper-air observations revealed a conditionally unstable air mass confined to the layer below 650 hPa with a striking capping inversion between 650 and 600 hPa (e.g. at Larkhill; see Fig. 6), which was induced by the subsiding air from a potential vorticity intrusion (Gatzen, 2018). The combination of steep lapse rates and low-to-moderate boundary layer moisture resulted in low CAPE values of 150 to 250 J kg−1, as indicated by the 12:00 UTC sounding from Larkhill (Fig. 6). At 18:00 UTC, this area of weak latent instability reached northwestern Germany (Fig. 5b, d).
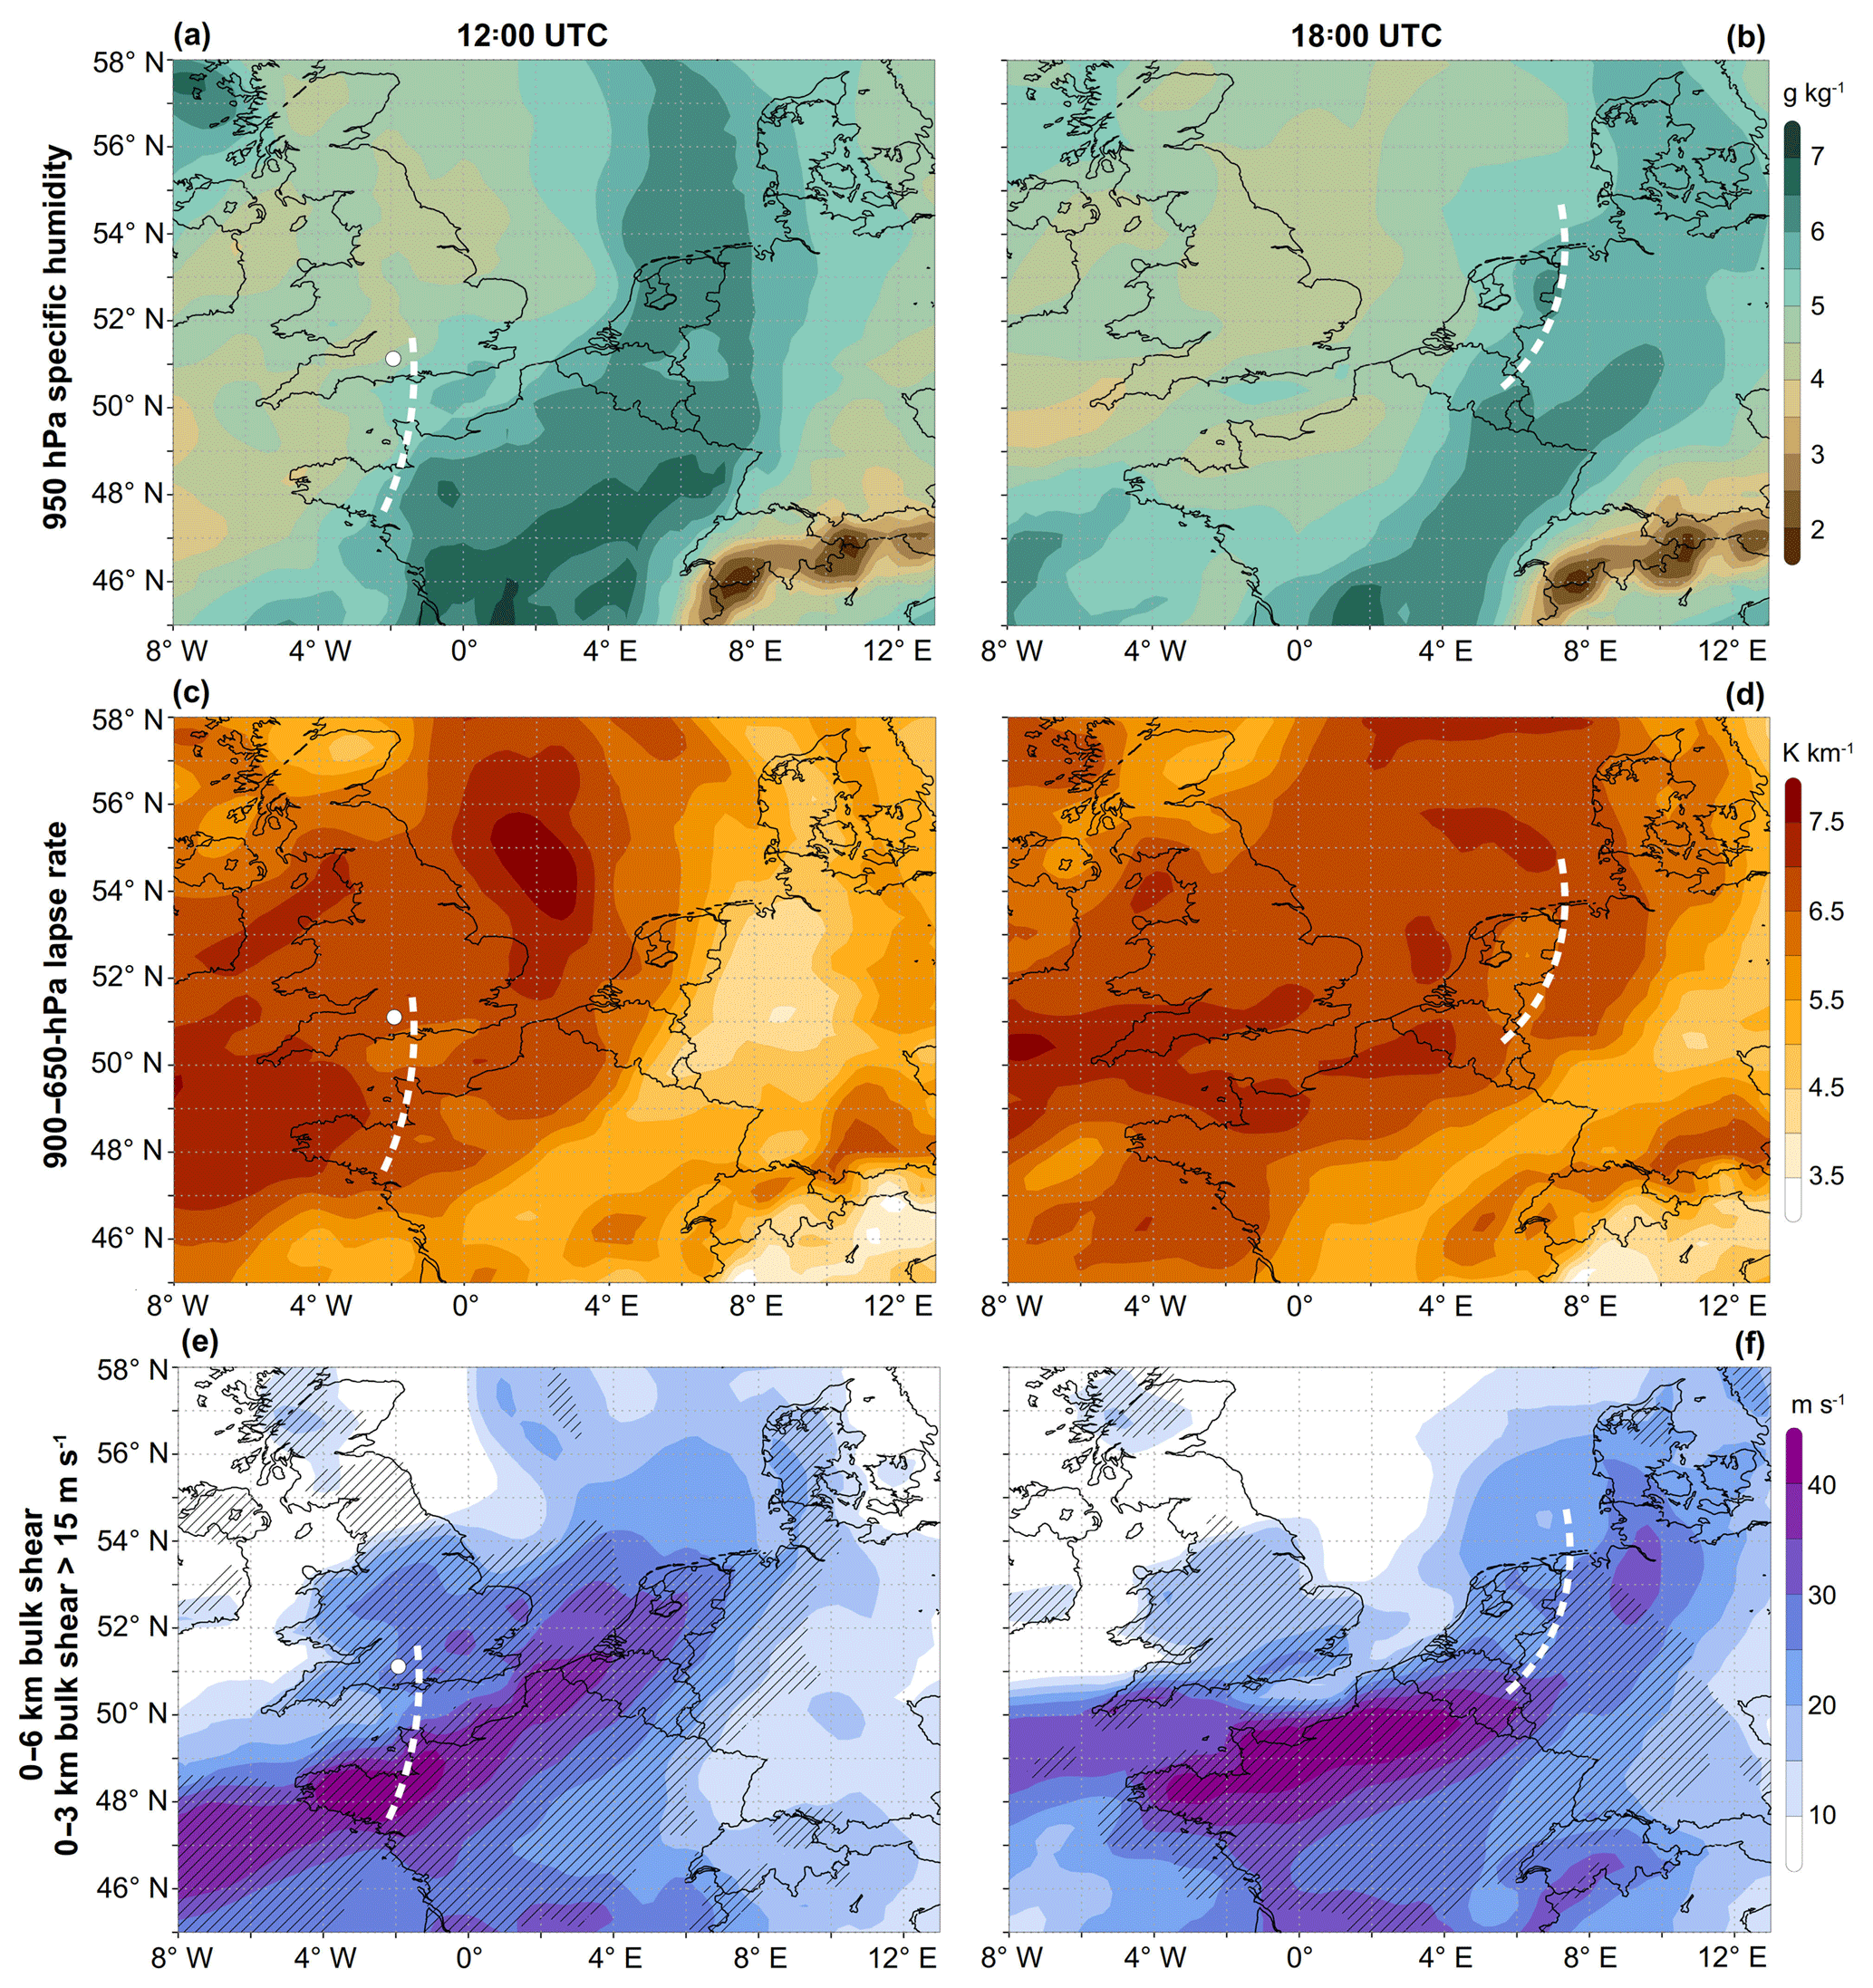
Figure 5ERA5 reanalysis of (a, b) 950 hPa specific humidity (g kg−1), (c, d) 900–650 hPa lapse rate (K km−1), (e, f) 0–6 km bulk shear (m s−1; shaded) and (e, f) 0–3 km bulk shear larger than 15 m s−1 (hatched areas) at (a, c, e) 12:00 UTC and (b, d, f) 18:00 UTC on 3 January 2014. The white dot in (a), (c) and (e) denotes the location of the sounding shown in Fig. 6. The dashed white line indicates the position of the surface trough according to the UK Met Office surface analysis shown in Fig. 3.

Figure 6Skewed T-log p diagram of upper-air measurements from Larkhill (England) at 12:00 UTC on 3 January 2014. The solid (dashed) black line represents temperature (dew point) values in ∘C. The box in the upper-right corner shows the values for 50 hPa mixed-layer and most-unstable CAPE/CIN and different bulk shear values. The insets on the right-hand side show the vertical distribution of the horizontal wind (kn; wind barbs). MUCAPE (MUCIN) is denoted by the red (blue) area between the temperature profile and the parcel ascent curve.
Finally, the vertical wind shear is a crucial ingredient for linearly organised MCSs (e.g. Weisman and Klemp, 1982; Rasmussen and Blanchard, 1998). Here, the DMCS formed in an environment with 0–6 km bulk shear values well above 25 m s−1 (Fig. 5e). The 12:00 UTC sounding from Larkhill also revealed almost unidirectional 0–6 km bulk shear and mean wind speed values of about 30 m s−1 (Fig. 6). Thus, the deep layer shear and mean wind vector were nearly parallel, which favoured the development of a fast downwind-propagating and severe MCS (Corfidi, 2003; Cohen et al., 2007). The lower-tropospheric shear was also very strong, with 0–3 km bulk shear values larger than 15 m s−1 (Fig. 5e). According to ERA5 reanalysis data, these shear magnitudes remained more or less constant at 15:00 UTC over Belgium and at 18:00 UTC over northwestern Germany (Fig. 5f). The lifting mechanism, as the last indispensable ingredient, was provided by the surface pressure trough and the associated low-level convergence.
In brief, the derecho on 3 January 2014 developed in a strongly forced synoptic regime, which was associated with a baroclinic surface trough (Sanders, 1999, 2005). The DMCS evolved within an area characterised by (a) a sufficient amount of lower-tropospheric moisture, (b) steep lower-tropospheric lapse rates of 6.5 to 7 K km−1, (c) weak latent instability (CAPE <250 J kg−1) and (d) strong vertical wind shear, with the majority of the shear and latent instability located in the lowest 3 km of the troposphere. This HSLC environment generally allows the formation of cold-season DMCSs producing severe winds, especially in the presence of strong large-scale forcing for ascent (e.g. Bentley and Mote, 2000; Evans and Doswell, 2001). In comparison with two other European cold-season derechos studied by Gatzen et al. (2011), this event was characterised by much weaker vertical wind shear. For example, the Kyrill derecho formed in a highly baroclinic environment with 0–6 km bulk shear values of up to 65 m s−1 (vs. 30 m s−1 for this case). Similarities were found among the magnitude of low-level specific humidity and lower-tropospheric lapse rates (Gatzen, 2018).
Model hindcast experiments are used to complement the description of this extreme cold-season convective event. The following subsections include a short analysis of the operational ensemble forecasts and a detailed examination of the differences between the ERA5-, ERAI- and ECAN-driven CCLM simulations. Furthermore, the benefit of our highest-resolution simulation will be highlighted in the last subsection.
4.1 Ensemble forecasts
As already mentioned in the introduction, the DMCS on 3 January 2014 was not well forecast. The probabilistic forecast issued from the ECMWF-EPS 00:00 UTC run revealed a probability of 40 % to 60 % for the occurrence of maximum surface wind gusts exceeding 20 m s−1 over Belgium on 3 January 2014 and a much lower probability for western Germany (Fig. 7a). The predicted likelihood for gusts reaching wind speeds larger than 25 m s−1 was zero for the whole investigation area, except for the marine areas of the English Channel and the North Sea (Fig. 7c). COSMO-LEPS provided similar probabilistic forecasts (Fig. 7b, d) and showed an even lower probability for wind gusts exceeding 20 m s−1 over northwestern France, Belgium and western Germany than ECMWF-EPS (cf. Fig. 7a and b). Moreover, ECMWF underestimated the latent instability over Benelux and northwestern Germany, since the EPS revealed a low probability of 5 % to 25 % for CAPE values larger than 50 J kg−1 at 18:00 UTC (not shown).
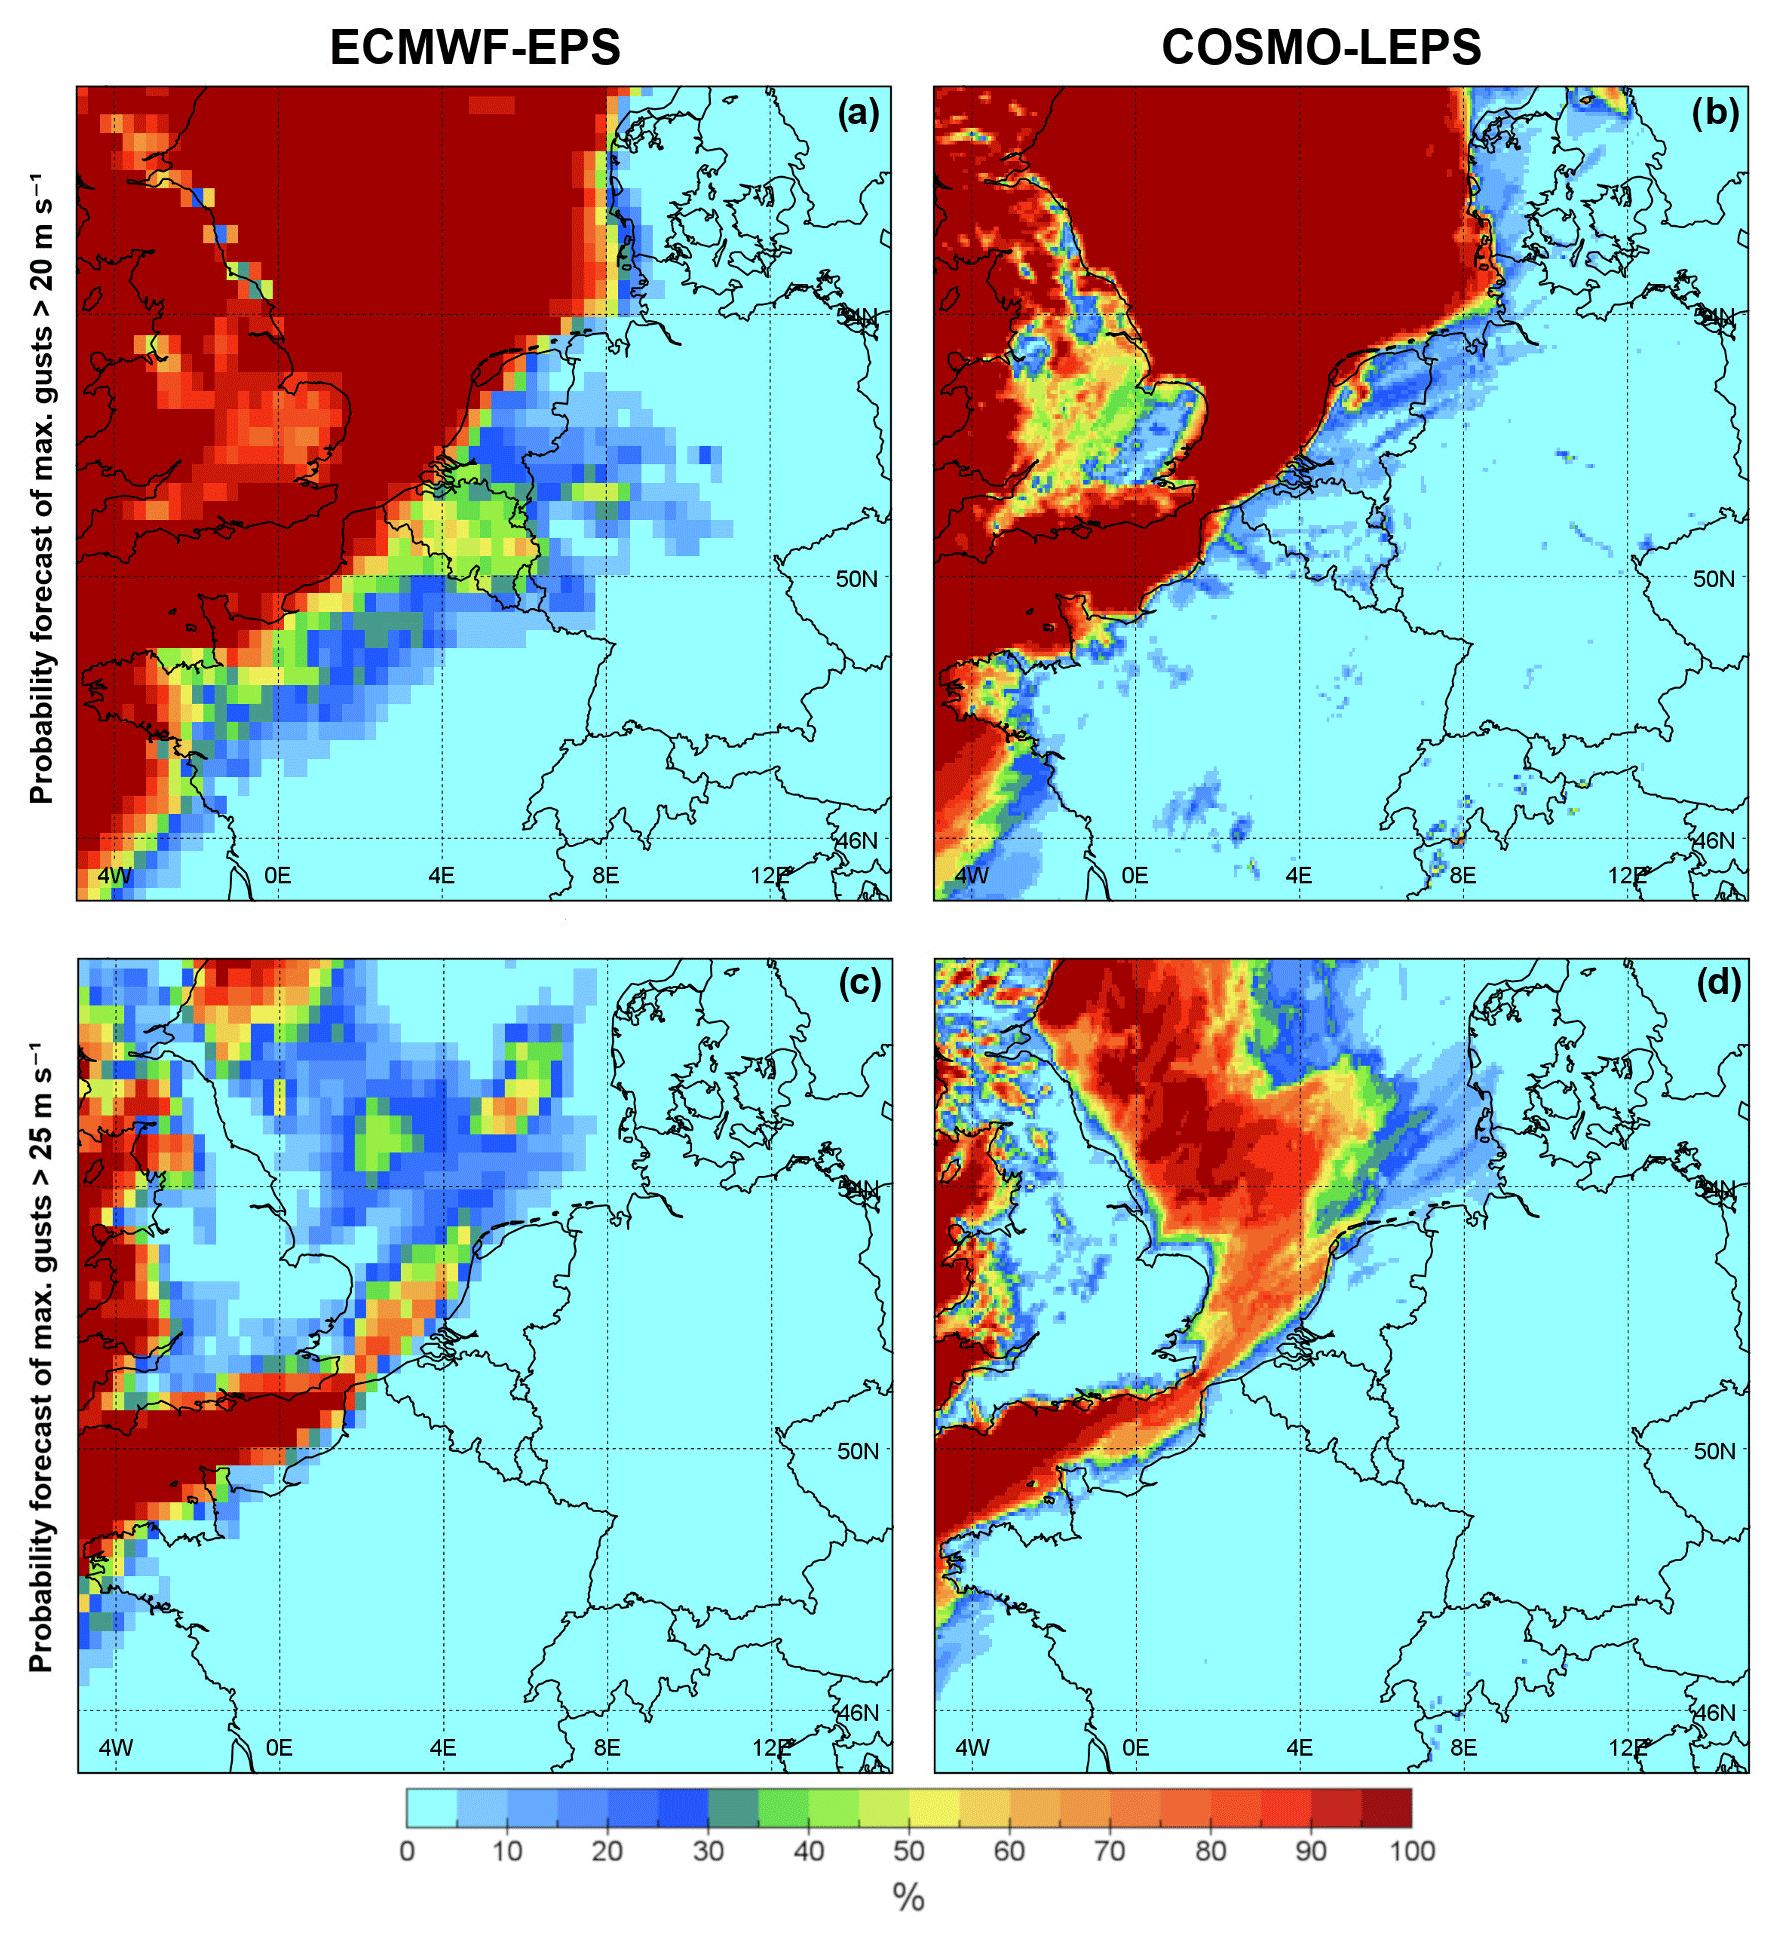
Figure 7Event probability forecast valid for 00:00 UTC on 4 January 2014 by the 00:00 UTC run of (a, c) ECMWF-EPS and (b, d) COSMO-LEPS on 3 January 2014 in terms of (a, b) maximum 10 m a.g.l. wind gusts exceeding 20 m s−1 within 24 h and (c, d) maximum 10 m a.g.l. wind gusts exceeding 25 m s−1 within 24 h.
4.2 Dependence on initial and lateral boundary conditions
To investigate the potential predictability of the derecho event, CCLM hindcasts were performed using the ERA5, ERAI and ECAN data as ILBCs. The ERA5-driven CCLM simulation (CCLM-ERA5) revealed a linearly organised convective system over parts of northern France, Belgium and the North Sea at 16:00 UTC, which was associated with a convergence zone along a surface pressure trough (Fig. 8a, b). In the ERAI-driven CCLM simulation (CCLM-ERAI), deep moist convection formed in a similar way, but the surface trough was located farther north and the convective cells remained initially mostly discrete (Fig. 8c, d). At a later time step in this simulation (20:00 UTC), a linearly organised MCS became apparent (not shown). The ECMWF operative-analysis-driven simulation (CCLM-ECAN) developed discrete and non-severe convective cells over the investigation area along unorganised near-surface convergence zones, as no well-defined surface pressure trough was evident in this simulation (Fig. 8e, f). In general, the CCLM-ECAN simulation is clearly distinct from the results with ERA5 and ERAI reanalysis boundary conditions, despite that no major differences in the simulation of CAPE could be identified (cf. Fig. 8f with b and d). All three simulations featured maximum CAPE values of 200 to 250 J kg−1 over the Netherlands (not shown). Apparently, the differently simulated structure of the convection-initiating convergence zone had a major impact on the subsequent upscale growth of the convection. In general, both CCLM-ERA5 and CCLM-ERAI simulated a nearly closed convergence band in contrast to CCLM-ECAN (cf. Fig. 8a and c with e). Even exchanging the initial specific humidity and wind fields in CCLM-ECAN with ERA5 values did not result in significant improvements. However, considerable sensitivity was found when modifying the update frequency of the LBCs in CCLM-ERA5: The ERA5-driven CCLM simulation with 6-hourly LBCs did not simulate the surface pressure trough associated with the development of the DMCS, which extends from southeastern England to northern France at 14:00 UTC in the reference simulation with hourly LBCs (Fig. 9a, b). The absence of this trough resulted in a weaker and less organised convective system (not shown), similar to the results obtained with CCLM-ECAN. To determine the cause of the missing trough, we investigated the synoptic-scale differences between both CCLM-ERA5 simulations at the western boundary of the computational domain D1. A striking pressure anomaly entered D1 from the west between 07:00 and 09:00 UTC, which had its origin in an additional surface pressure trough located west of Ireland in CCLM-ERA5 with hourly LBCs (Fig. 9c, d). This trough affected the pressure field downstream over the English Channel, leading to the formation of the pressure trough associated with the derecho between 12:00 and 15:00 UTC in the ERA5-driven reference simulation. We thus propose that the realistic representation of the convection-initiating convergence zone and the associated low-level forcing for ascent, which was achieved with initial ERA5 data and hourly LBCs, would have been the key factors to successfully forecasting this cold-season storm.
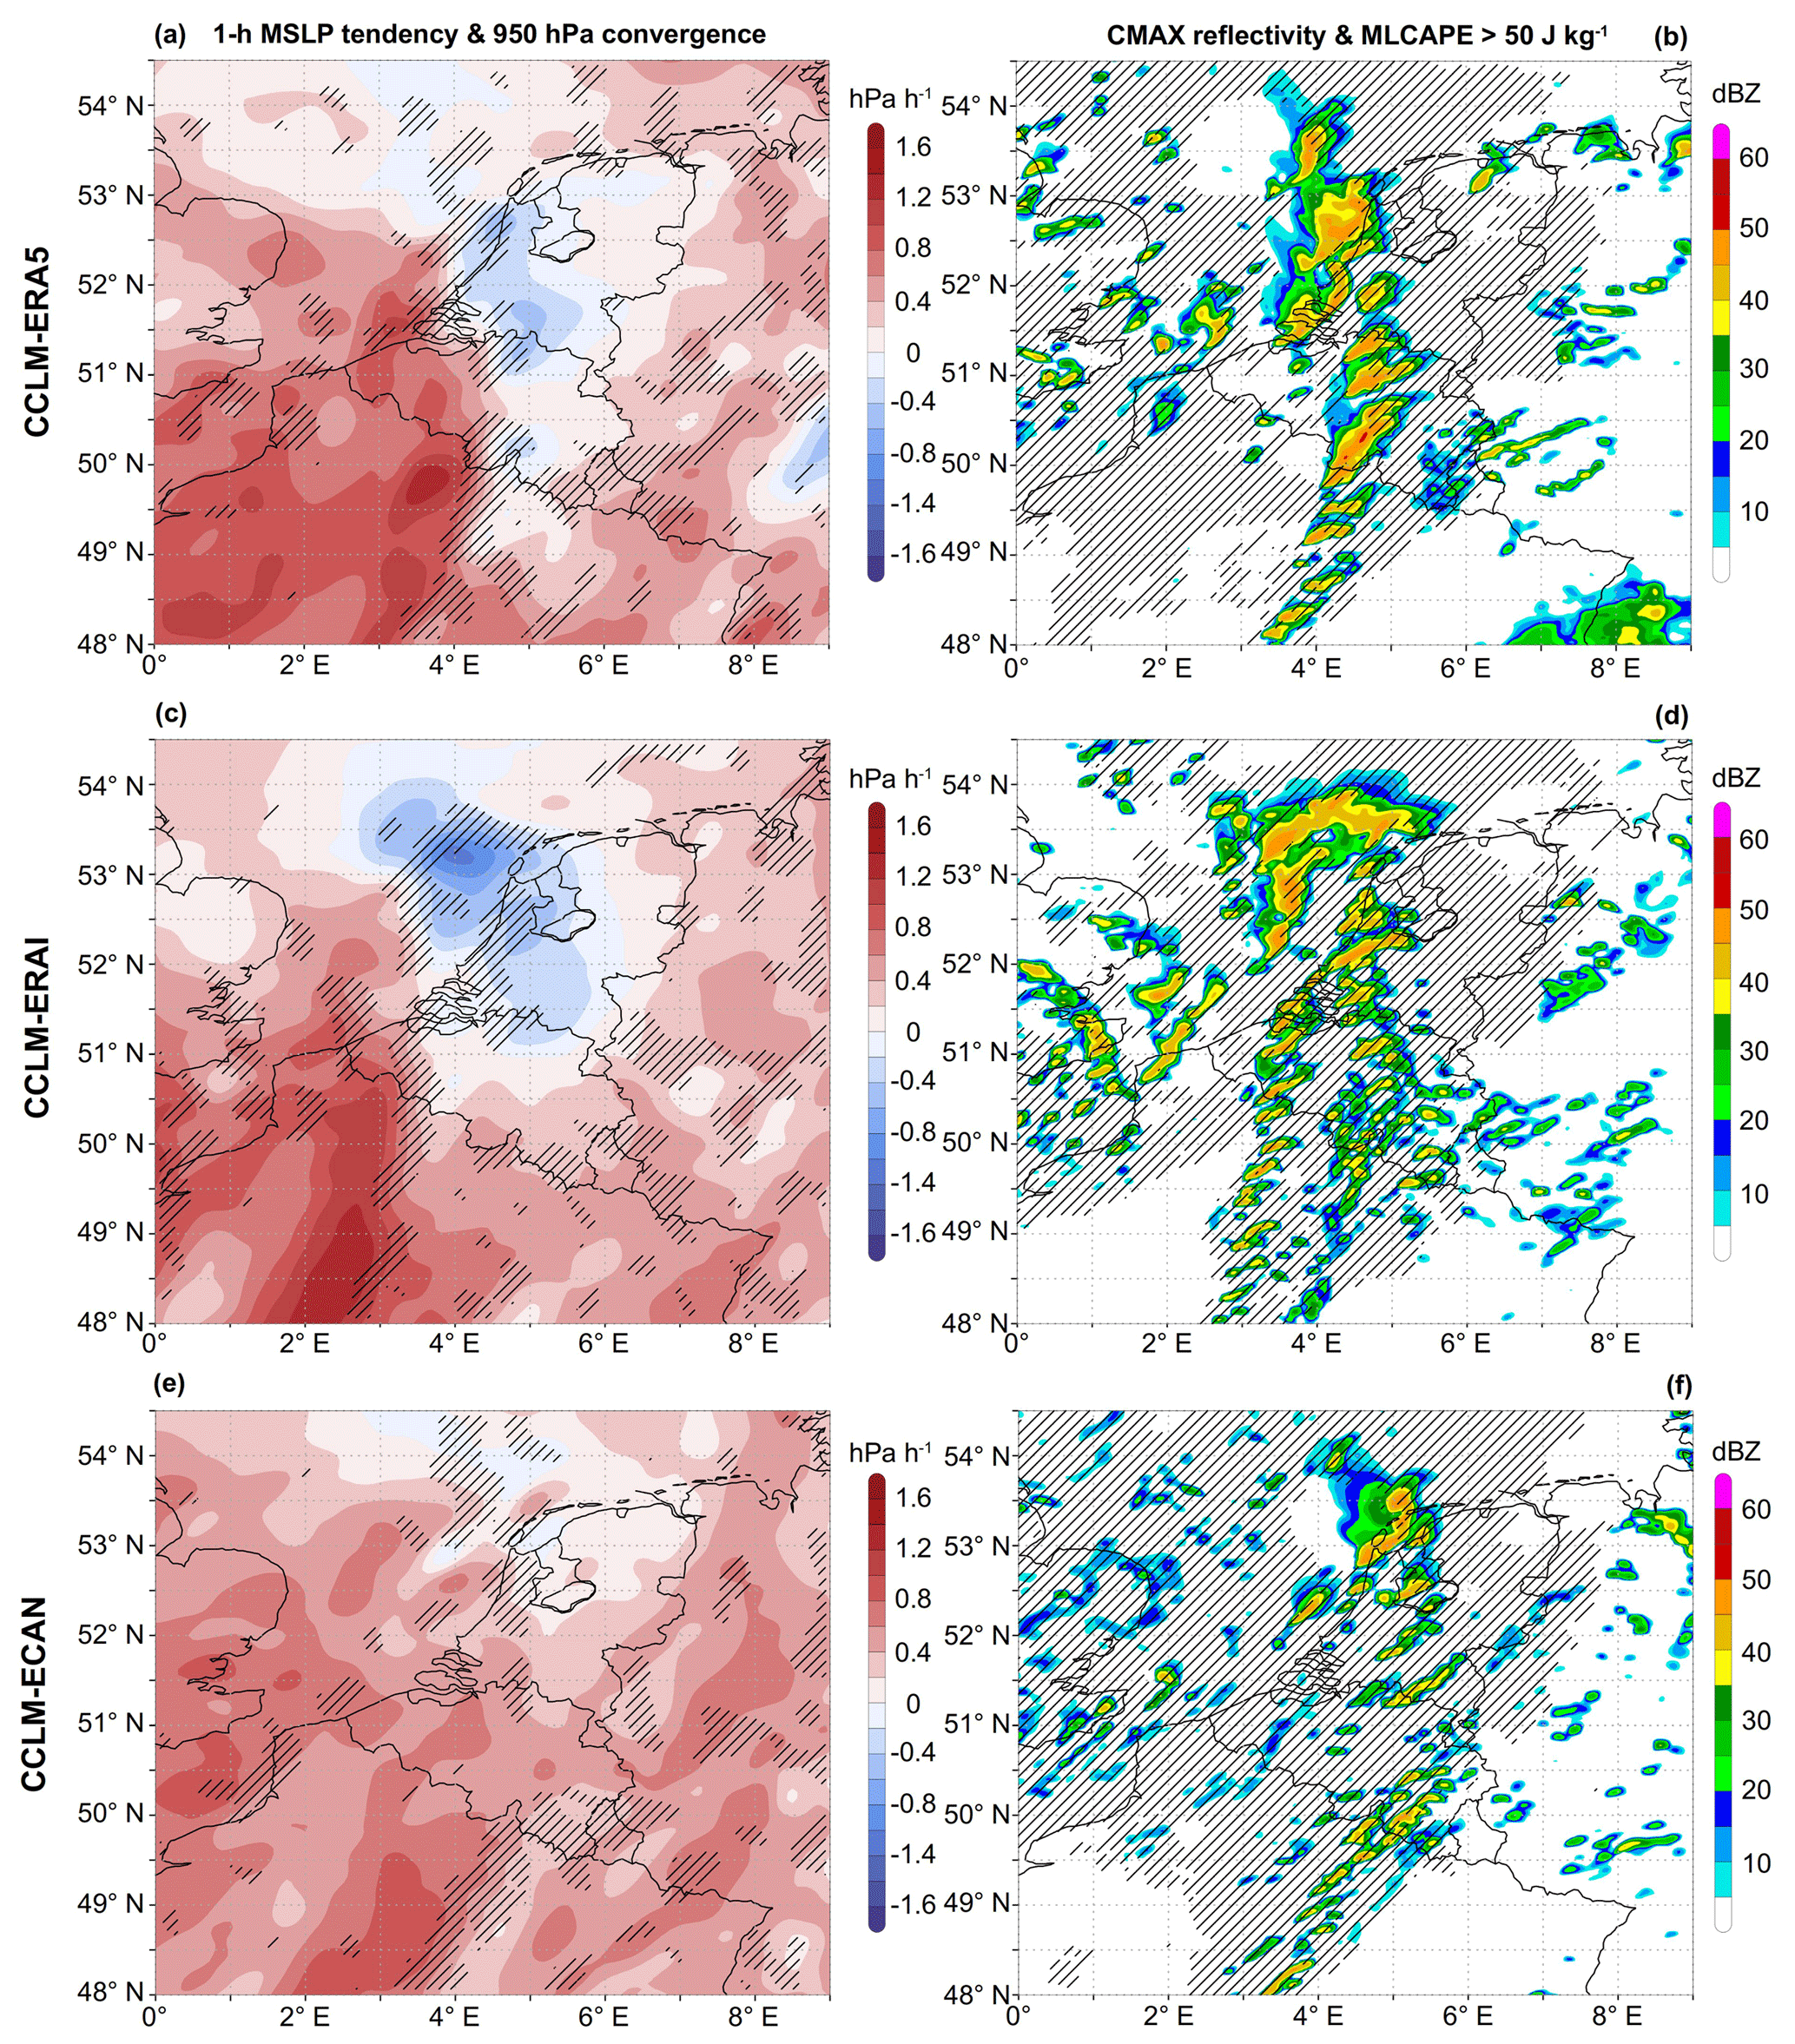
Figure 8Results from (a, b) CCLM-ERA5, (c, d) CCLM-ERAI and (e, f) CCLM-ECAN at 16:00 UTC. (a, c, e) 1-hourly mean sea level pressure (MSLP) tendency (hPa h−1; shaded) and 950 hPa convergence smaller than s−1 (hatched areas) from the 7 km simulation. (b, d, f) Column maximum reflectivity (dBZ; shaded) and 50 hPa mixed-layer CAPE above 50 J kg−1 (hatched areas) from the 2.8 km simulation.
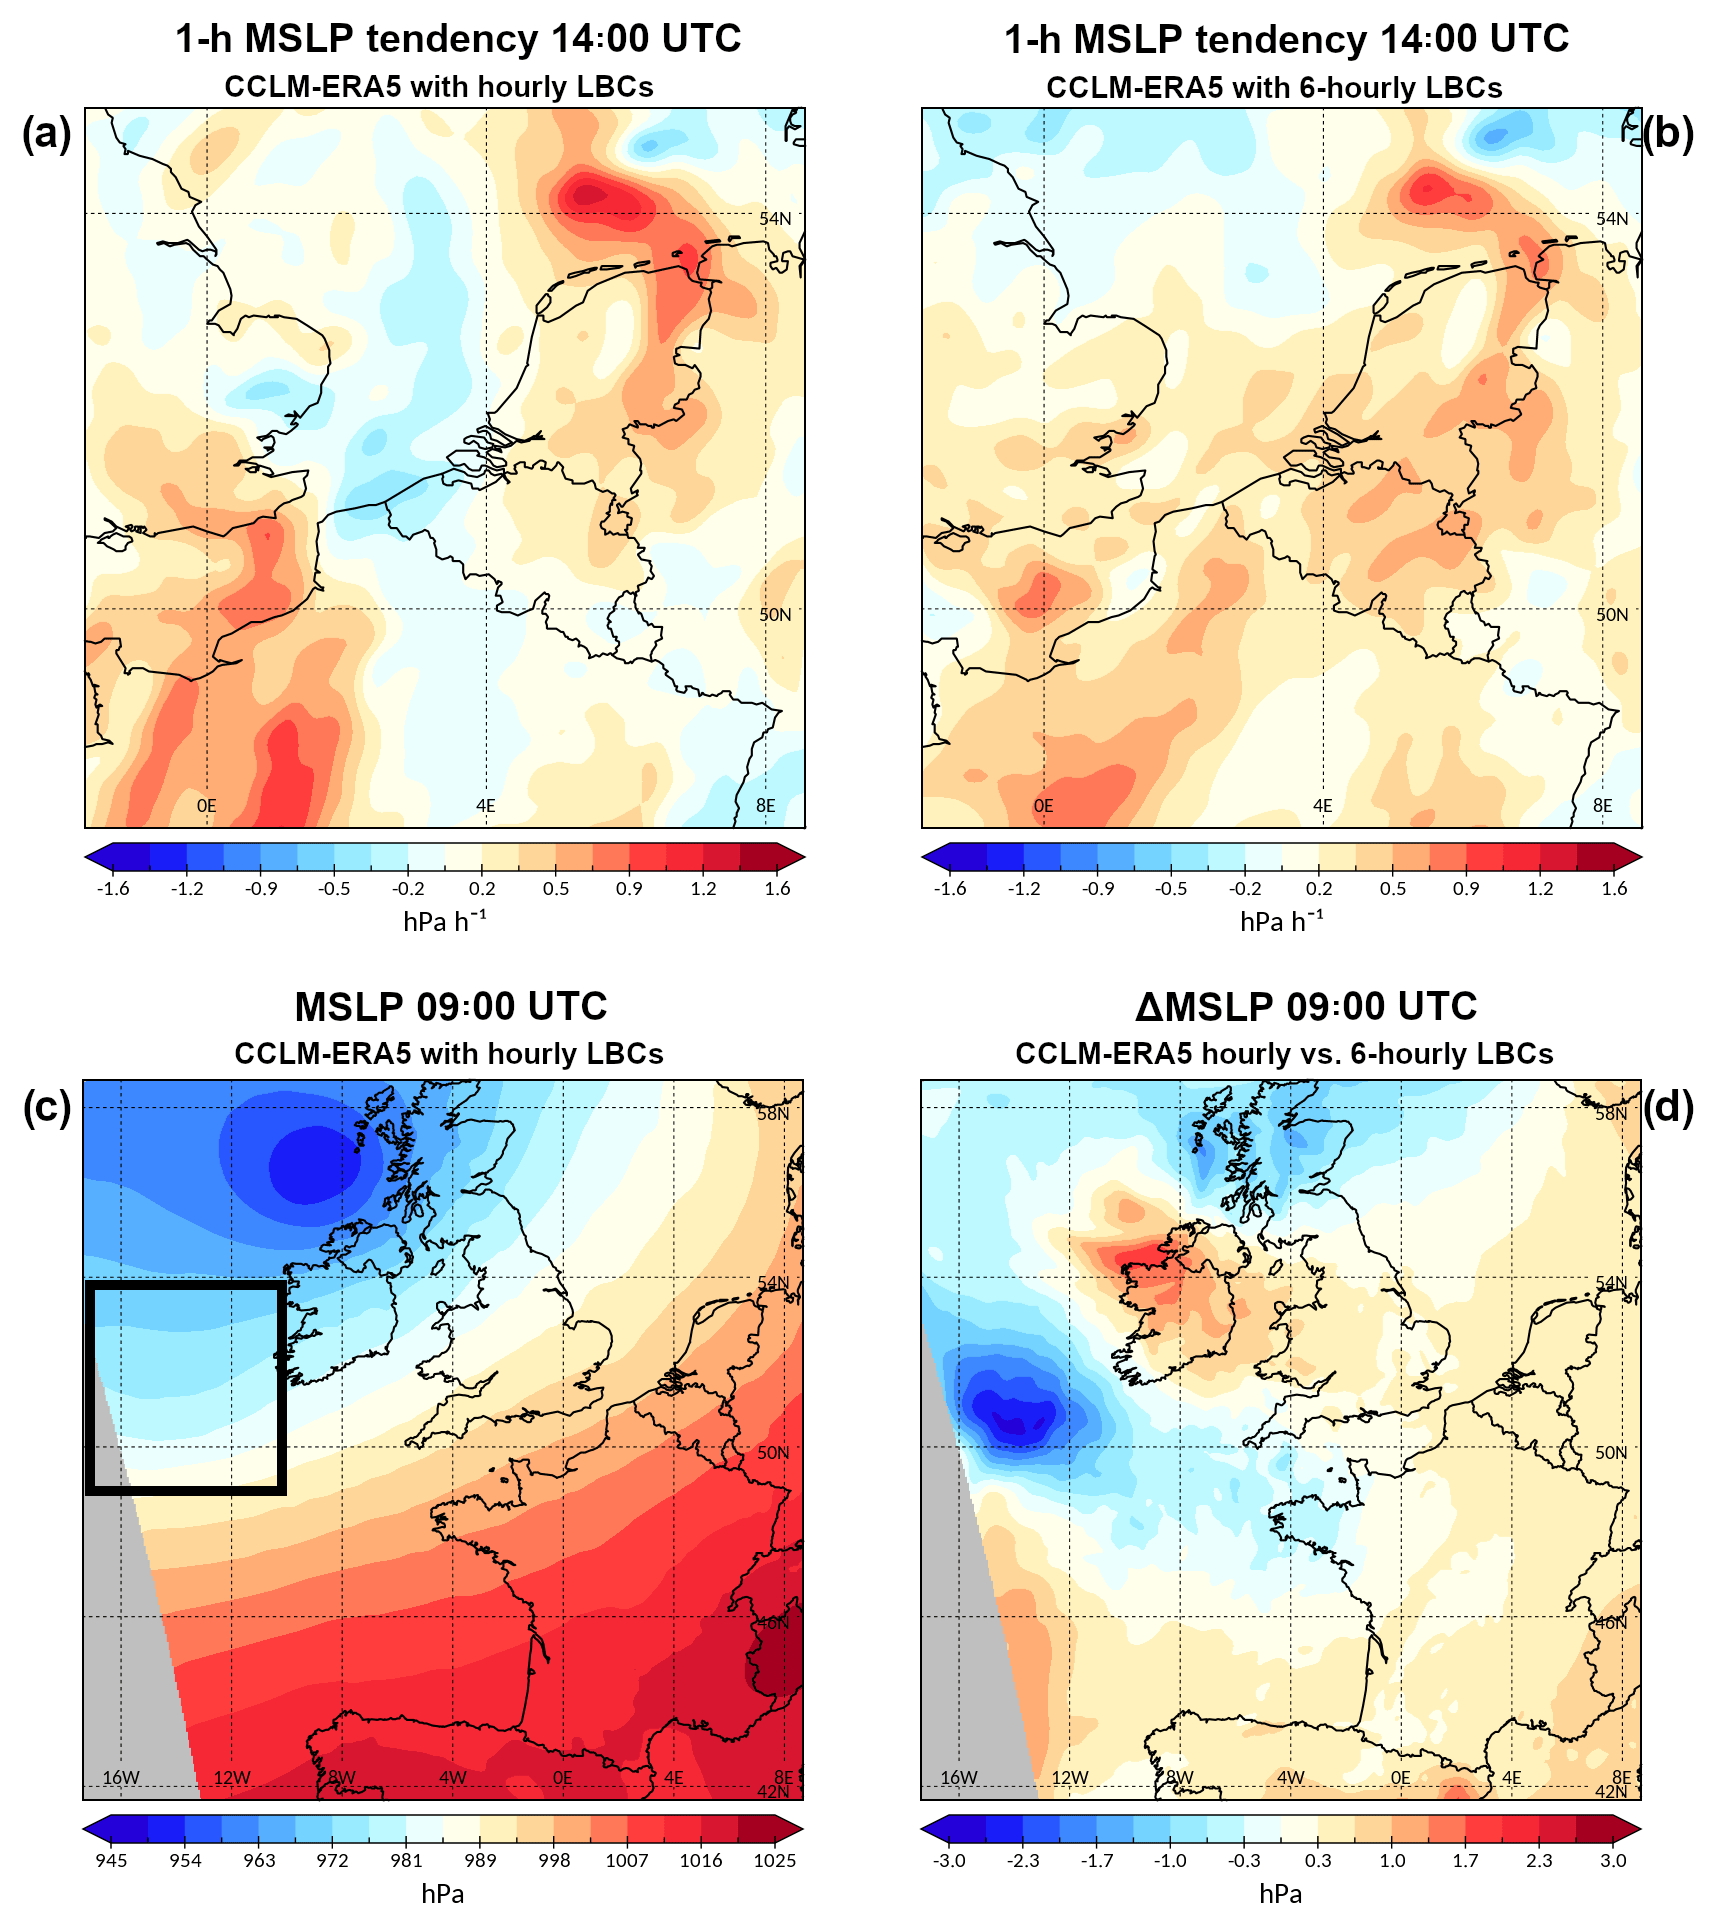
Figure 9Results from CCLM-ERA5 7 km simulation with (a, c) hourly and (b) 6-hourly lateral boundary conditions (LBCs). (a, b) 1-hourly mean sea level pressure (MSLP) tendency (hPa h−1; shaded) at 14:00 UTC, (c) MSLP (hPa; shaded) at 09:00 UTC and (d) MSLP difference (hPa; shaded) at 09:00 UTC between simulations with hourly and 6-hourly LBCs. The black outlined box in (c) highlights the surface pressure trough, which entered the computational domain from the west.
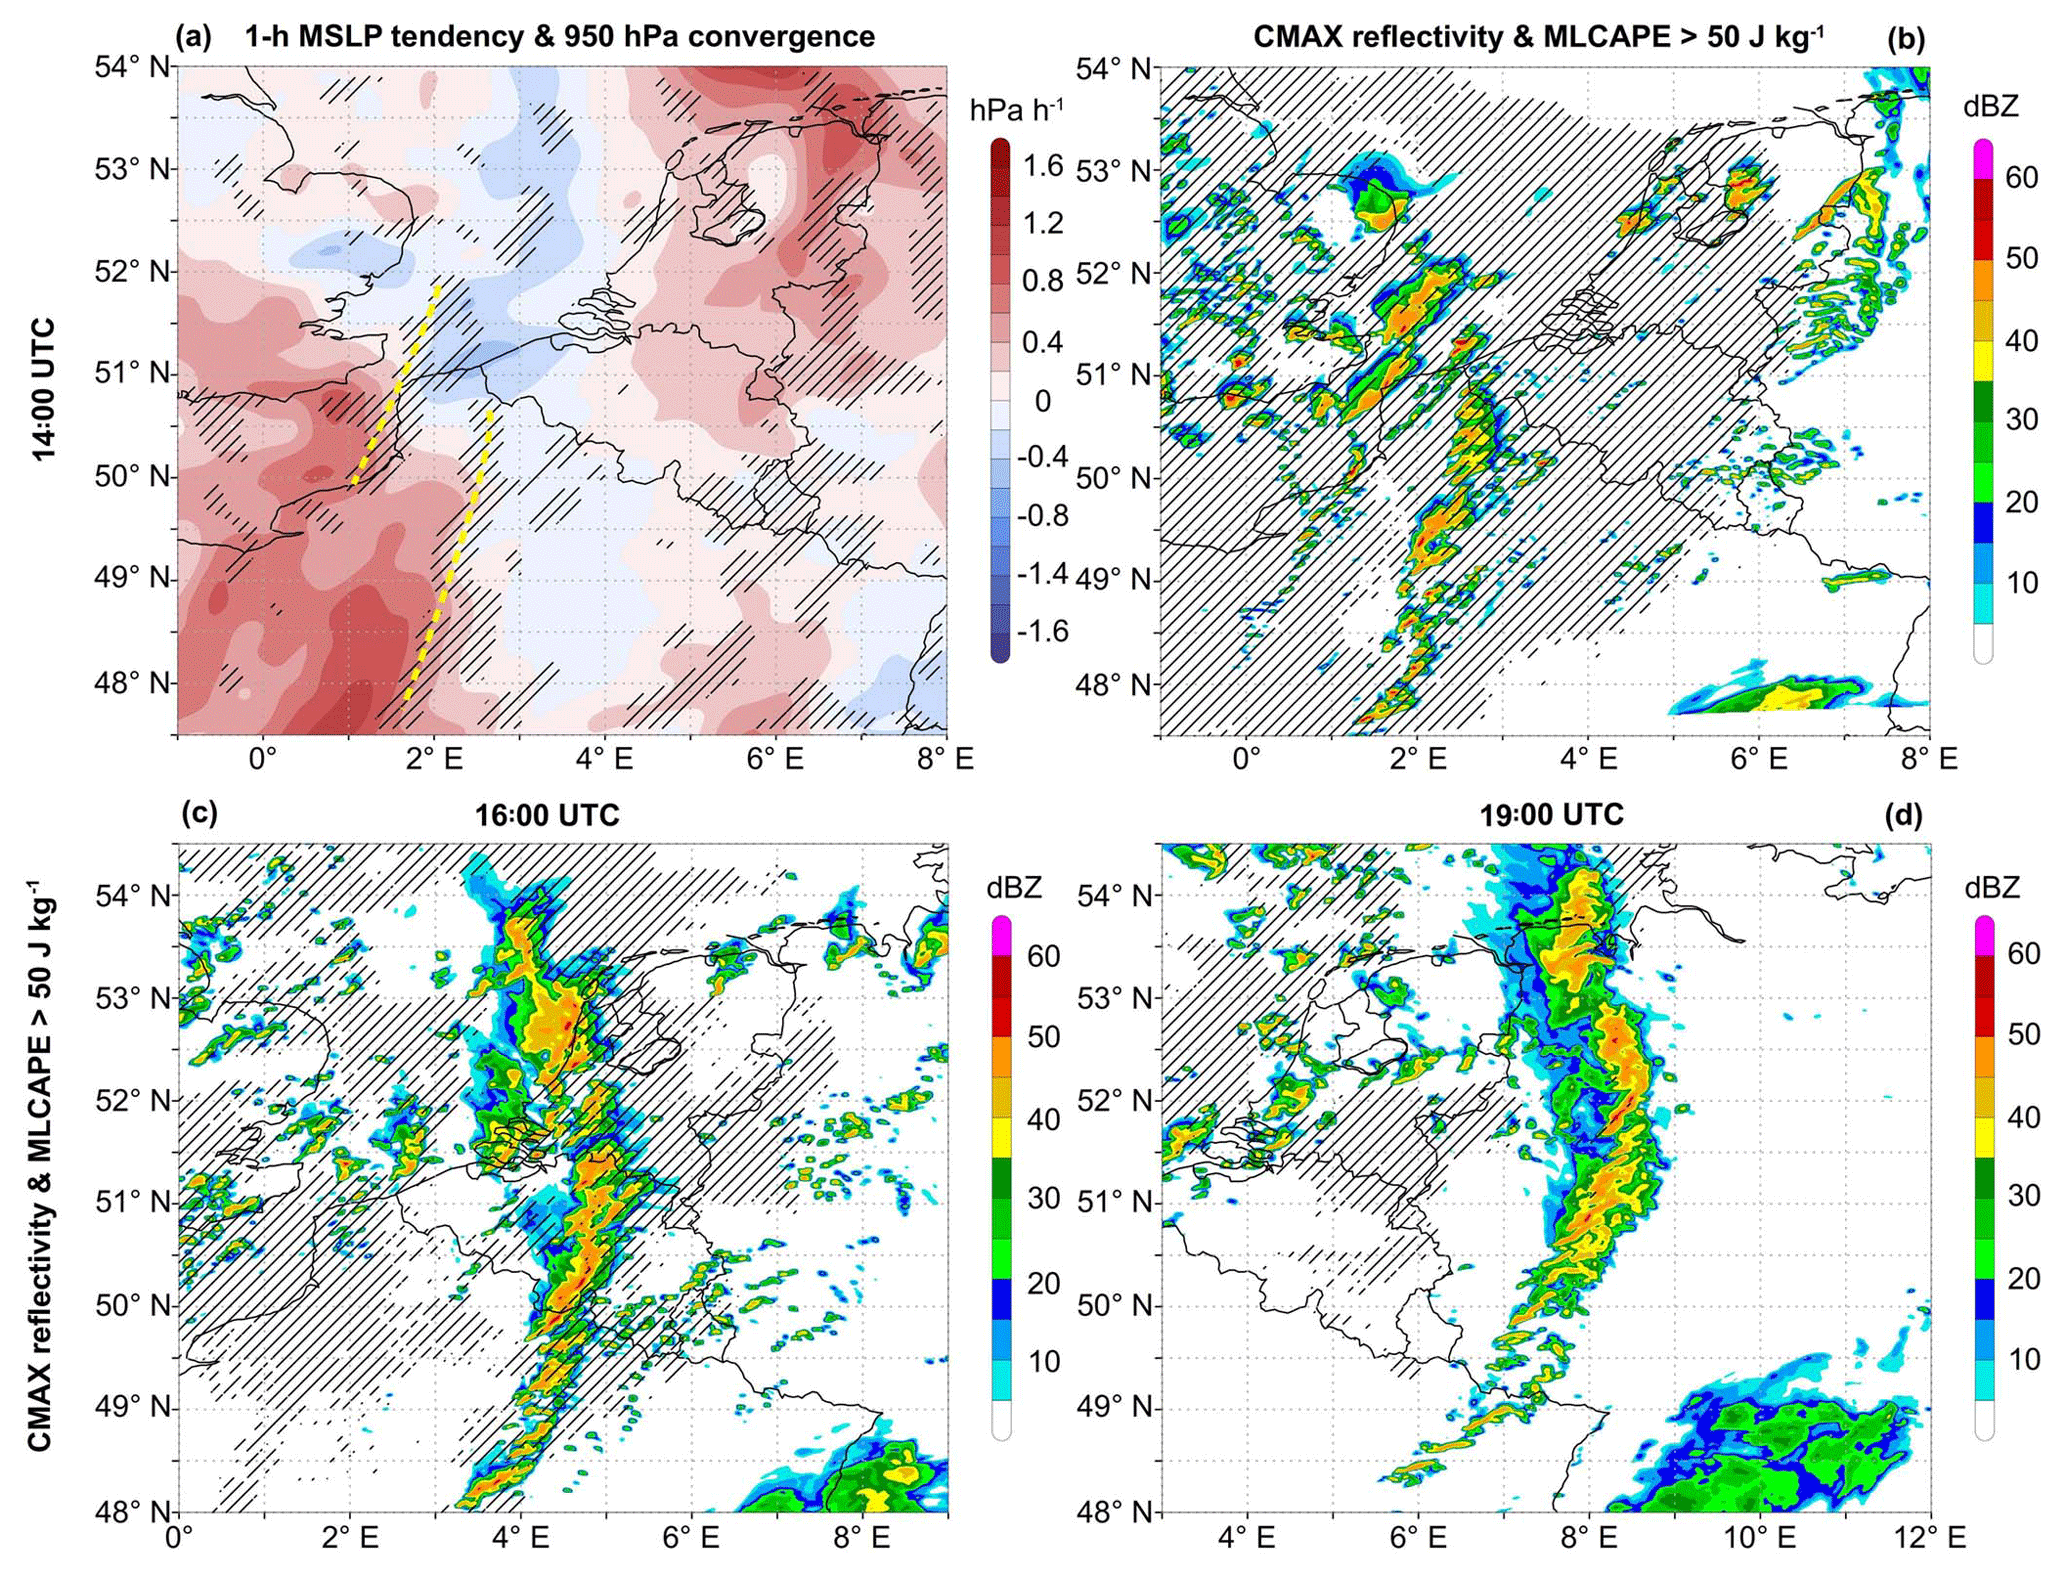
Figure 10Results from CCLM-ERA5 at (a, b) 14:00 UTC, (c) 16:00 UTC and (d) 19:00 UTC. (a) 1-hourly mean sea level pressure (MSLP) tendency (hPa h−1; shaded) and 950 hPa convergence smaller than s−1 (hatched areas) from the 7 km simulation. (b, d) Column maximum reflectivity (dBZ; shaded) and 50 hPa mixed-layer CAPE above 50 J kg−1 (hatched areas) from the 1.1 km simulation. The dashed yellow lines in (a) denote the convection-initiating convergence zones.
4.3 CCLM-ERA5 1.1 km simulation and comparison with the observed event
As the CCLM-ERA5 simulations revealed a good representation of the DMCS in terms of its spatio-temporal evolution, this subsection will include a detailed analysis of the system using the simulation with 1.1 km grid spacing. To show the added value of the smaller grid spacing, the 1.1 km results are compared with the results from the 2.8 km simulation.
Between 13:00 and 14:00 UTC, several convective cells initiated over northern France and the English Channel along two distinct low-level convergence zones (cf. Fig. 10a and b). Both convergence zones were associated with isallobaric gradients (dashed yellow lines in Fig. 10a) and a weak gradient of equivalent potential temperature in 850 hPa (not shown). Since the 0–6 km mean wind vector had a large component perpendicular to the convection-initiating convergence zones (not shown), the convective cells over northern France remained mostly discrete and their upscale growth was initially limited. While the convective cells moved towards the northeast, they were subjected to weak latent instability (CAPE <250 J kg−1; see Fig. 10b). At 16:00 UTC, the convective cells organised and merged to a linearly organised MCS extending from the North Sea over the Benelux region to northern France (Fig. 10c), as both convergence zones phase locked along the surface pressure trough (Fig. 8a). Still, the MCS benefited from low-end CAPE (<150 J kg−1) downstream of the system (Fig. 10c). At 19:00 UTC, the simulated DMCS reached western Germany, exhibiting its peak organisation (Fig. 10d). As the linear storm system moved farther east into an environment with a drier and colder boundary layer, it began to weaken (decreasing reflectivity) and gradually lost its organisation after 20:30 UTC due to the lack of latent instability (not shown). Compared to the evolution of the observed DMCS, the CCLM-ERA5 run featured a broken-line mode of the DMCS, especially during the early stage of the system's life cycle (cf. Fig. 11a with c and e). However, the bowed or hooked segments observed in the real case (see Fig. 11a, b) were also present in the highest-resolution simulation, for example at 16:00 UTC over central Belgium (50.25∘ N 4.5∘ E, Fig. 10c) or at 19:00 UTC over northwestern Germany (52∘ N 8.5∘ E, Fig. 10d). In contrast, the simulated 2.8 km radar reflectivity reveals a more scattered and less organised convective line (Fig. 11c, d), pointing towards the need and added value of high-resolution simulations.
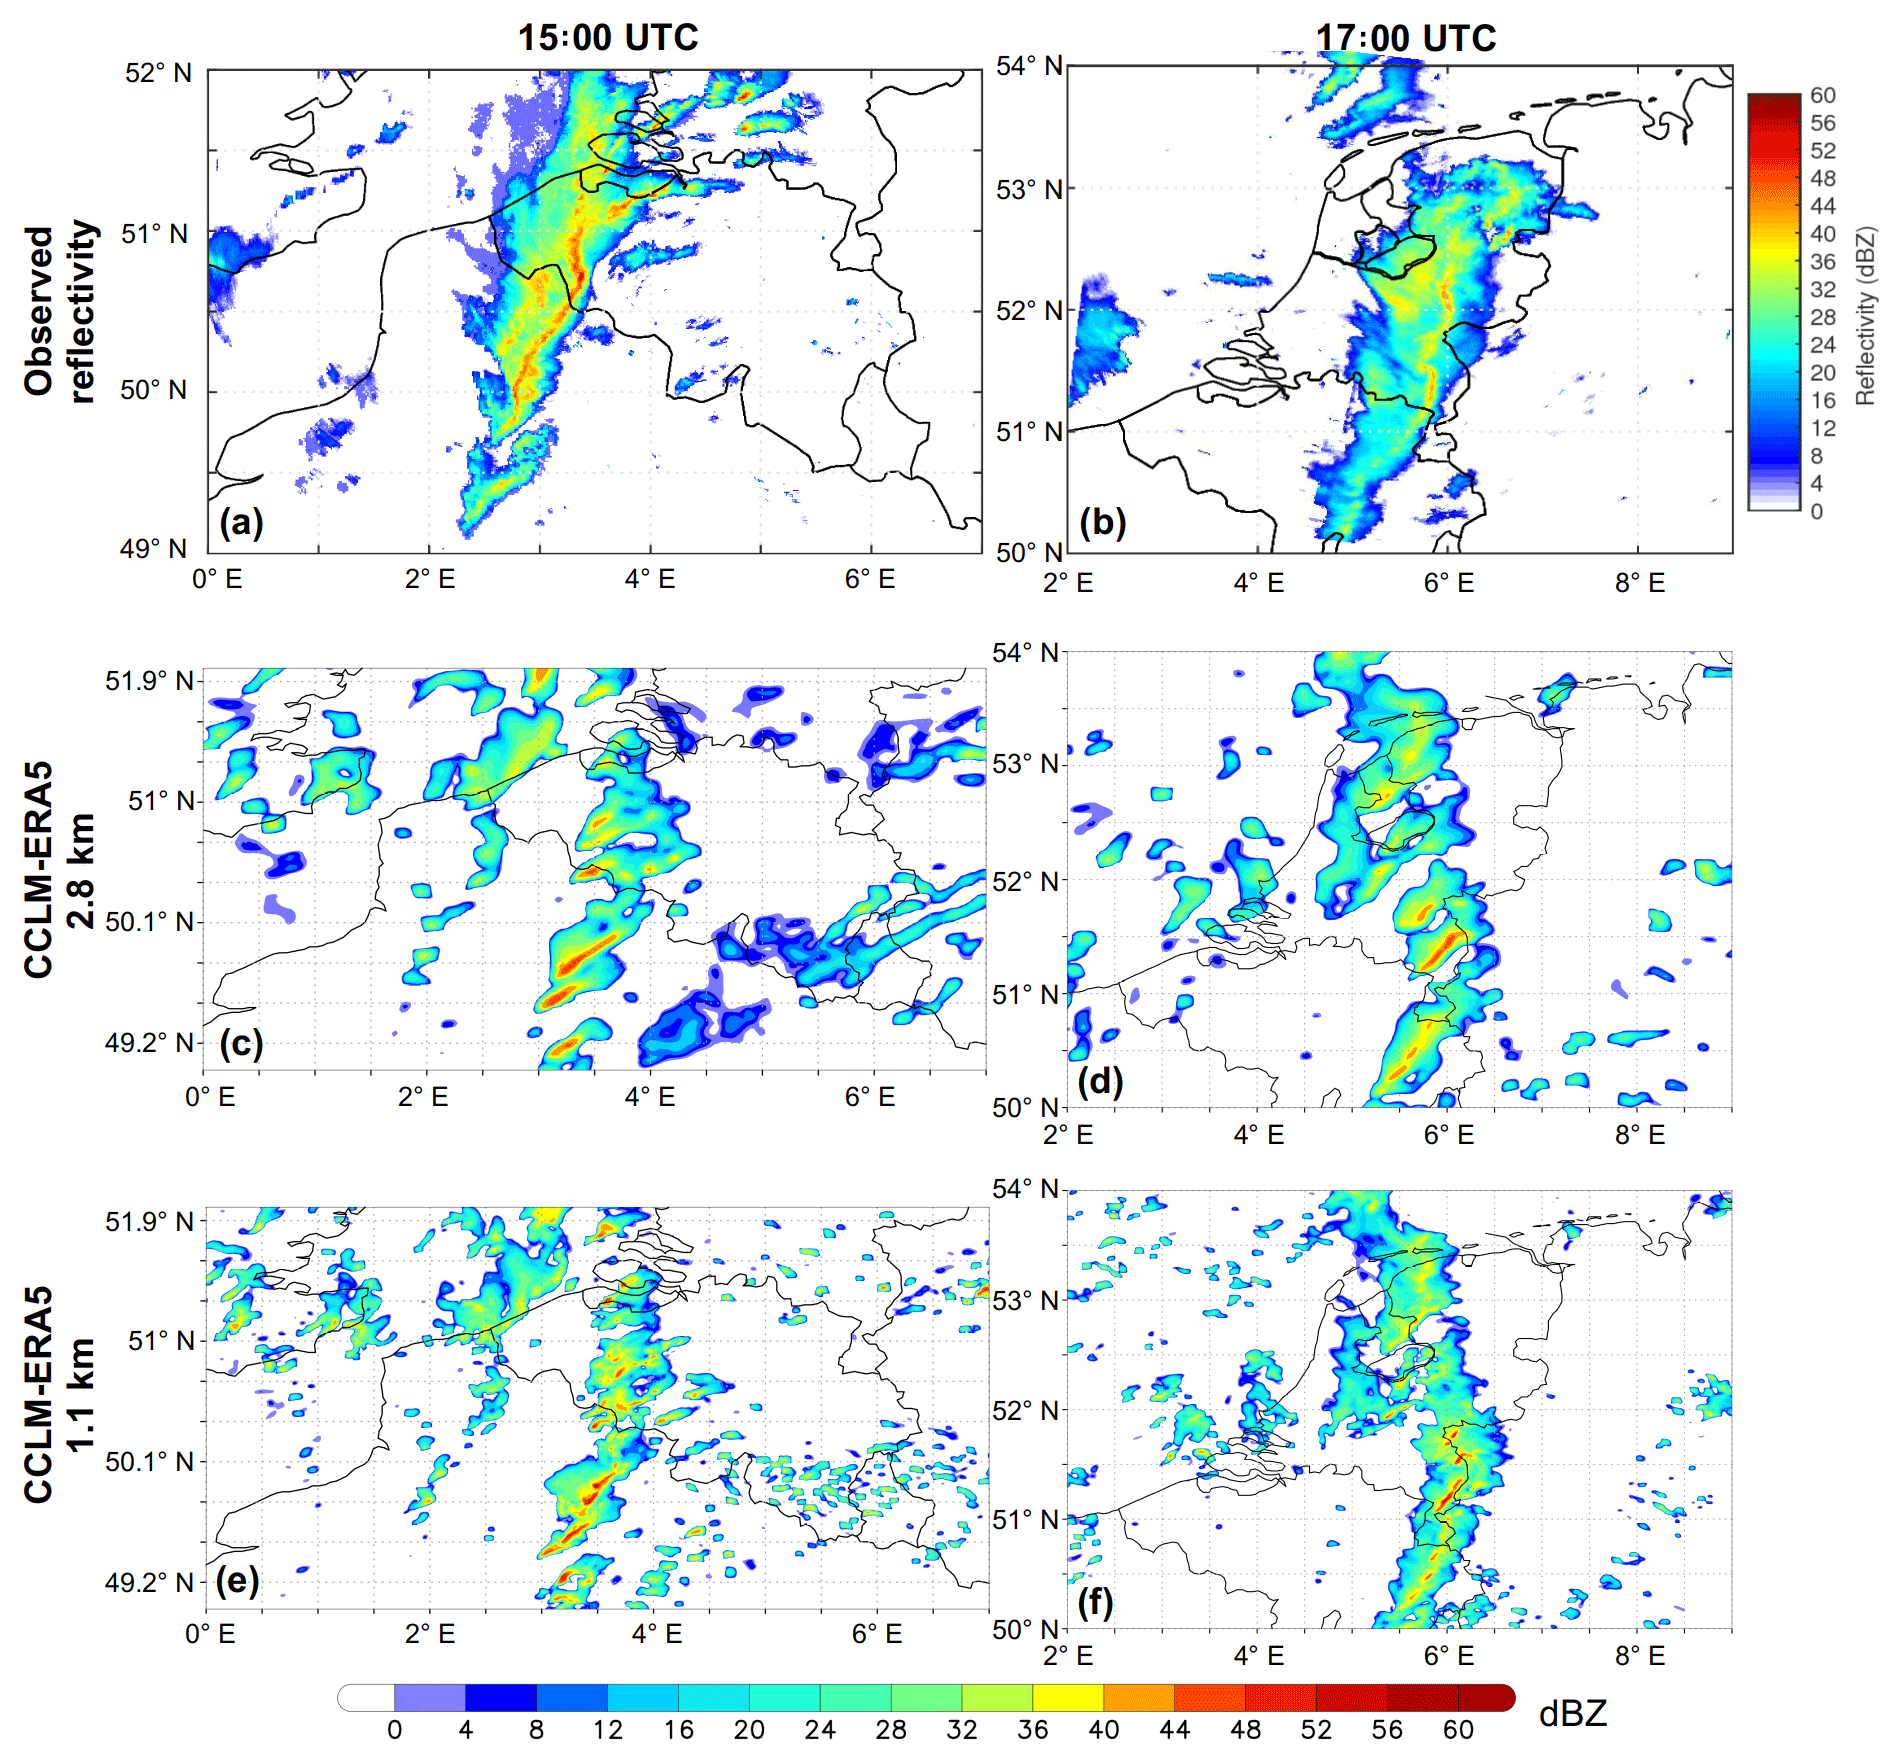
Figure 11Comparison of the observed and modelled reflectivity at approximately 1.5 km altitude at (a, c, e) 15:00 UTC and at (b, d, f) 17:00 UTC. (a) RMIB radar reflectivity composite (dBZ), (b) KNMI radar reflectivity composite (dBZ), (c, d) reflectivity from the CCLM-ERA5 2.8 km simulation and (e, f) reflectivity from the CCLM-ERA5 1.1 km simulation.
The maximum wind gust pattern obtained from CCLM-ERA5 shows some striking differences among the 2.8 and 1.1 km simulations. The former shows multiple stripes of gusts ranging between 20 and 30 m s−1 over the onshore areas, with a single local wind maximum of about 35 m s−1 over the northeastern Netherlands (Fig. 12a). By contrast, the highest-resolution simulation covers a larger area with convective gusts exceeding 20 m s−1, which matches well with the observations (cf. Figs. 1 and 12b). In addition, the 1.1 km simulation highlights the potential for hurricane-force gusts much better, exhibiting local maxima of up to 45 m s−1 over the mountainous regions of eastern Belgium but also over the lowlands of northern Germany (Fig. 12b). This shortcoming of the 2.8 km simulation is probably linked to a less accurate representation of the convective-scale processes due to its lower horizontal and vertical resolution (see Table 1). More precisely, the downdraughts of the individual convective cells are slightly stronger in the 1.1 km simulation, leading to stronger pressure gradients along their gust fronts compared to the 2.8 km simulation (cf. Fig. 12c and d). As the computation of the horizontal wind is affected by the pressure gradient force, the friction velocity will increase due to higher horizontal wind speeds, which will result in stronger gusts following Eqs. (1) and (2).

Figure 12CCLM-ERA5 2.8 and 1.1 km simulations of (a, b) 10 m a.g.l. maximum wind gusts (m s−1) and (c, d) maximum mean sea level pressure (MSLP) gradient (Pa km−1) between 14:00 and 22:00 UTC.
Overall, we demonstrated that simulations with a grid spacing of about 1 km are necessary to realistically approach the severity of deep moist convection within the HSLC environment on 3 January 2014. However, Ludwig et al. (2015) were able to viably reproduce the observed gust intensity of the European derecho on 18 January 2007 using a coarser grid spacing of 2.8 km (see Figs. 8d–f and 12 in Ludwig et al., 2015). The main difference between both simulations is the linear upscale growth of the simulated convection. The DMCS modelled by Ludwig et al. (2015) featured a nearly closed narrow convective line along Kyrill's cold front, which is in contrast to the less organised DMCS of the CCLM-ERA5 simulation in the present study. This disparity is most likely attributable to the nature of the convection-initiating zone (cold front vs. baroclinic trough). Furthermore, the synoptic background flow was stronger during the Kyrill derecho. Thus, we speculate that the magnitude of the simulated wind gusts might be sensitive to the convective upscale growth along the convection-initiating zone when using convection-resolving CCLM configurations with coarser grid spacing.
In this study we have analysed the synoptic characteristics and the predictability of a major linear mesoscale convective system which developed in a postfrontal air mass and caused severe weather in northern France, Belgium, the Netherlands and northwestern Germany on 3 January 2014. The system produced hurricane-force winds and was classified as a moderate low-dew point derecho as it satisfies the criteria of Johns and Hirt (1987), Coniglio and Stensrud (2004) and Corfidi et al. (2006). Cold-season derechos that are not associated with a cold front are uncommon in Germany (Gatzen, 2018).
First, we have investigated the environmental conditions in which this DMCS developed, revealing that the system formed in a strongly forced synoptic regime marked by a strong southwesterly upper-level flow. In particular, the DMCS benefited from large-scale forcing for ascent since it was positioned at the left exit of a strong mid-level jet, which is typical for European cold-season derechos (Gatzen, 2018). The formation of the DMCS was also associated with a baroclinic surface pressure trough in the postfrontal air mass. Moreover, the DMCS evolved in an environment that featured the three necessary ingredients for the occurrence of deep moist convection (Johns and Doswell, 1992). Steep lower- to mid-tropospheric lapse rates and enhanced amounts of boundary layer moisture have been identified. The resulting weak latent instability was mostly concentrated within the lowest 3 km of the troposphere, in which the strongest vertical wind shear was also present. However, the tropospheric speed shear was much weaker in contrast to cold-season derechos developing along a cold front (Gatzen et al., 2011). This lower-tropospheric HSLC regime, in combination with low-level convergence along the surface trough, may have been crucial for the linear organisation of the DMCS and for the development of bowing line segments, which were observed in radar imagery (Fig. 11a, b).
The analysis of NWP model data revealed the poor performance of the operational forecasts. Thus, high-resolution numerical experiments (with up to 1.1 km grid spacing) were performed to investigate the reasons for this shortcoming. Our results provide evidence that the derecho event on 3 January 2014 was predictable given the correct ILBCs. The ERA5-driven CCLM simulation with hourly updated LBCs produced a linearly organised MCS, with timing, track and intensity that coincided well with the development of the observed DMCS. However, our additional simulations with ERAI and ECAN data as ILBCs revealed that the development of the storm was sensitive to the structure of the convection-initiating zone, which depended on the simulated pressure field. In particular, the simulation with ECAN ILBCs failed to reproduce an organised convective system over the affected region, pointing to a possible shortcoming of the observational analysis in such strongly convective situations (cf. also Mathias et al., 2017). Additional sensitivity experiments revealed the importance of temporal high-resolution LBCs for the development of the DMCS. An ERA5-driven simulation with 6-hourly LBCs performed worse with regard to the intensity and the degree of organisation of the convection. The reason for this was most likely the absence of the key precursor, a surface pressure trough which entered the computational domain between 07:00 and 09:00 UTC when considering hourly LBCs.
Moreover, we showed that very high horizontal and vertical resolutions were necessary to reproduce the derecho intensity of the simulated convection. This is partially in contrast to the case modelled by Ludwig et al. (2015), which could represent the strong convection embedded in the cold front from storm Kyrill with a coarser grid spacing of 2.8 km. However, a higher model resolution might not always be necessary for a good representation of DMCSs due to the strong case to case variability (Gatzen, 2018), but it might be needed for systems in some cases. Overall, the 3 January 2014 derecho event revealed the difficulty of forecasting cold-season convective windstorms when they are not associated with a well-defined synoptic-scale cold front, where upward motion is generally given per se. Therefore, convection-resolving ensemble prediction systems might be considered to improve the predictability of such low-probability, high-impact events in the future. Such systems are already employed by the DWD and MeteoSwiss. Future work will focus on a detailed analysis and high-resolution modelling of other DMCSs affecting western Europe based on the database established by Gatzen (2018) and on tests for the sensitivity to the ingredients, particularly in terms of the physical mechanisms leading to the large-scale ascent needed to initiate the event.
The ERA-Interim reanalysis data are available publicly from the ECMWF (2011). ERA5 data are available publicly from the Copernicus Climate Change Service (2017). COSMO-LEPS, ECMWF-EPS and ECMWF operative analysis data are available for ECMWF members upon request via the Meteorological Archival and Retrieval System (MARS, https://apps.ecmwf.int/mars-catalogue/, last access: 13 May 2019). COSMO-CLM simulations were performed at DKRZ and are available upon request. All code is available from the authors.
LM, PL and JGP conceived and designed the research. LM performed the synoptic analysis, while PL performed the COSMO-CLM simulations. LM and PL prepared the figures and wrote the initial draft of the paper. All authors contributed with discussions and revisions.
The authors declare that they have no conflict of interest.
We thank the ECMWF for the provision of ERA5, ERA-Interim and ECMWF analysis data. We thank the RMIB and KNMI for providing radar data. COSMO may be used for operational and for research applications by the members of the COSMO consortium. Moreover, within a license agreement, the COSMO model may be used for operational and research applications by other national (hydro-)meteorological services, universities, and research institutes. We thank the German Climate Computer Center (DKRZ, Hamburg) for computing and storage resources within the context of DKRZ project ANDIVA (no. 105). We thank Christoph Gatzen for the useful and extensive discussions. We are grateful to the European Severe Storm Laboratory (ESSL) for the reports taken from the European Severe Weather Database (ESWD; http://www.eswd.eu/, last access: 13 May 2019) shown in Fig. 1. Joaquim G. Pinto was partially funded by the AXA Research Fund and Patrick Ludwig was partially funded by REKLIM. We acknowledge support by Deutsche Forschungsgemeinschaft (DFG) and Open Access Publishing Fund of Karlsruhe Institute of Technology. Finally, we thank two anonymous reviewers for their constructive comments that helped to improve the manuscript.
This paper was edited by Ricardo Trigo and reviewed by two anonymous referees.
Baldauf, M., Seifert, A., Förstner, J., Majewski, D., Raschendorfer, M., and Reinhardt, T.: Operational Convective-Scale Numerical Weather Prediction with the COSMO Model: Description and Sensitivities, Mon. Weather Rev., 139, 3887–3905, https://doi.org/10.1175/mwr-d-10-05013.1, 2011.
Bentley, M. and Mote, T.: A synoptic climatology of cool-season derecho events, Phys. Geogr., 21, 21–37, https://doi.org/10.1080/02723646.2000.10642696, 2000.
Celiński-Mysław, D. and Matuszko, D.: An analysis of selected cases of derecho in Poland, Atmos. Res., 149, 263–281, https://doi.org/10.1016/j.atmosres.2014.06.016, 2014.
Cohen, A., Coniglio, M., Corfidi, S., and Corfidi, S.: Discrimination of Mesoscale Convective System Environments Using Sounding Observations, Weather Forecast., 22, 1045–1062, https://doi.org/10.1175/waf1040.1, 2007.
Coniglio, M. and Stensrud, D.: Interpreting the Climatology of Derechos, Weather Forecast., 19, 595–605, https://doi.org/10.1175/1520-0434(2004)019<0595:itcod>2.0.co;2, 2004.
Coniglio, M., Stensrud, D., and Richman, M.: An Observational Study of Derecho-Producing Convective Systems, Weather Forecast., 19, 320–337, https://doi.org/10.1175/1520-0434(2004)019<0320:aosodc>2.0.co;2, 2004.
Copernicus Climate Change Service (C3S): ERA5: Fifth generation of ECMWF atmospheric reanalyses of the global climate, Copernicus Climate Change Service Climate Data Store (CDS), available at: https://cds.climate.copernicus.eu/cdsapp#!/home (last access: 13 May 2019), 2017.
Corfidi, S.: Cold Pools and MCS Propagation: Forecasting the Motion of Downwind-Developing MCSs, Weather Forecast., 18, 997–1017, https://doi.org/10.1175/1520-0434(2003)018<0997:cpampf>2.0.co;2, 2003.
Corfidi, S., Corfidi, S., Imy, D., and Logan, A.: A Preliminary Study of Severe Wind-Producing MCSs in Environments of Limited Moisture, Weather Forecast., 21, 715–734, https://doi.org/10.1175/waf947.1, 2006.
Dee, D., Uppala, S., Simmons, A., Berrisford, P., Poli, P., Kobayashi, S., Andrae, U., Balmaseda, M., Balsamo, G., Bauer, P., Bechtold, P., Beljaars, A., van de Berg, L., Bidlot, J., Bormann, N., Delsol, C., Dragani, R., Fuentes, M., Geer, A., Haimberger, L., Healy, S., Hersbach, H., Hólm, E., Isaksen, L., Kållberg, P., Köhler, M., Matricardi, M., McNally, A., Monge-Sanz, B., Morcrette, J., Park, B., Peubey, C., de Rosnay, P., Tavolato, C., Thépaut, J., and Vitart, F.: The ERA-Interim reanalysis: configuration and performance of the data assimilation system, Q. J. Roy. Meteor. Soc., 137, 553–597, https://doi.org/10.1002/qj.828, 2011.
Doms, G., Förstner, J., Heise, E., Herzog, H., Mirononv, D., Raschendorfer, M., Reinhardt, T., Ritter, B., Schrodin, R., Schulz, J.-P., and Vogel, G.: A description of the nonhydrostatic regional COSMO-Model LM. Part I: Physical parametrization, available at: http://www.cosmo-model.org/content/model/documentation/core/cosmoPhysParamtr.pdf (last access: 13 May 2019), 2011.
Dotzek, N., Groenemeijer, P., Feuerstein, B., and Holzer, A.: Overview of ESSL's severe convective storms research using the European Severe Weather Database ESWD, Atmos. Res., 93, 575–586, https://doi.org/10.1016/j.atmosres.2008.10.020, 2009.
European Centre for Medium-range Weather Forecast (ECMWF): The ERA-Interim reanalysis dataset, Copernicus Climate Change Service (C3S), available at: https://www.ecmwf.int/en/forecasts/datasets/archive-datasets/reanalysis-datasets/era-interim (last access: 13 May 2019), 2011.
Evans, J. and Doswell, C.: Examination of Derecho Environments Using Proximity Soundings, Weather Forecast., 16, 329–342, https://doi.org/10.1175/1520-0434(2001)016<0329:eodeup>2.0.co;2, 2001.
Fink, A. H., Brücher, T., Ermert, V., Krüger, A., and Pinto, J. G.: The European storm Kyrill in January 2007: synoptic evolution, meteorological impacts and some considerations with respect to climate change, Nat. Hazards Earth Syst. Sci., 9, 405–423, https://doi.org/10.5194/nhess-9-405-2009, 2009.
Fosser, G., Khodayar, S., and Berg, P.: Benefit of convection permitting climate model simulations in the representation of convective precipitation, Clim. Dynam., 44, 45–60, https://doi.org/10.1007/s00382-014-2242-1, 2015.
Gatzen, C.: A Derecho in Europe: Berlin, 10 July 2002, Weather Forecast., 19, 639–645, https://doi.org/10.1175/1520-0434(2004)019<0639:adiebj>2.0.co;2, 2004.
Gatzen, C.: Climatology and large-scale Dynamics of Derechos in Germany, PhD Thesis, University of Cologne, Germany, 2018.
Gatzen, C., Púčik, T., and Ryva, D.: Two cold-season derechoes in Europe, Atmos. Res., 100, 740–748, https://doi.org/10.1016/j.atmosres.2010.11.015, 2011.
Hamid, K.: Investigation of the passage of a derecho in Belgium, Atmos. Res., 107, 86–105, https://doi.org/10.1016/j.atmosres.2011.12.013, 2012.
Hersbach, H., Bell, B., Berrisford, P., Horányi, A., Muñoz Sabater, J., Nicolas, J., Radu, R., Schepers, D., Simmons, A., Soci, C., and Dee, D.: Global reanalysis: goodbye ERA-Interim, hello ERA5, ECMWF Newsletter, No. 159, ECMWF, Reading, UK, 17–24, https://doi.org/10.21957/vf291hehd7, 2019.
Jacobsen, I. and Heise, E.: A new economic method for the computation of the surface temperature in numericals models, Contribution to Atmospheric Physics, 55, 128–141, 1982.
Johns, R. and Doswell, C.: Severe Local Storms Forecasting, Weather Forecast., 7, 588–612, https://doi.org/10.1175/1520-0434(1992)007<0588:slsf>2.0.co;2, 1992.
Johns, R. and Hirt, W.: Derechos: Widespread Convectively Induced Windstorms, Weather Forecast., 2, 32–49, https://doi.org/10.1175/1520-0434(1987)002<0032:dwciw>2.0.co;2, 1987.
Leutwyler, D., Fuhrer, O., Lapillonne, X., Lüthi, D., and Schär, C.: Towards European-scale convection-resolving climate simulations with GPUs: a study with COSMO 4.19, Geosci. Model Dev., 9, 3393–3412, https://doi.org/10.5194/gmd-9-3393-2016, 2016.
López, J.: A Mediterranean derecho: Catalonia (Spain), 17 August 2003, Atmos. Res., 83, 272–283, https://doi.org/10.1016/j.atmosres.2005.08.008, 2007.
Ludwig, P., Pinto, J., Hoepp, S., Fink, A., and Gray, S.: Secondary Cyclogenesis along an Occluded Front Leading to Damaging Wind Gusts: Windstorm Kyrill, January 2007, Mon. Weather Rev., 143, 1417–1437, https://doi.org/10.1175/mwr-d-14-00304.1, 2015.
Lynch, P.: The Dolph–Chebyshev Window: A Simple Optimal Filter, Mon. Weather Rev., 125, 655–660, https://doi.org/10.1175/1520-0493(1997)125<0655:tdcwas>2.0.co;2, 1997.
Mathias, L., Ermert, V., Kelemen, F., Ludwig, P., and Pinto, J.: Synoptic Analysis and Hindcast of an Intense Bow Echo in Western Europe: The 9 June 2014 Storm, Weather Forecast., 32, 1121–1141, https://doi.org/10.1175/waf-d-16-0192.1, 2017.
Matte, D., Laprise, R., Thériault, J., and Lucas-Picher, P.: Spatial spin-up of fine scales in a regional climate model simulation driven by low-resolution boundary conditions, Clim. Dynam., 49, 563–574, https://doi.org/10.1007/s00382-016-3358-2, 2017.
Mellor, G. and Yamada, T.: Development of a turbulence closure model for geophysical fluid problems, Rev. Geophys., 20, 851, https://doi.org/10.1029/rg020i004p00851, 1982.
Montani, A., Cesari, D., Marsigli, C., and Paccagnella, T.: Seven years of activity in the field of mesoscale ensemble forecasting by the COSMO-LEPS system: main achievements and open challenges, Tellus A, 63, 605–624, https://doi.org/10.1111/j.1600-0870.2010.00499.x, 2011.
Panofsky, H. A. and Dutton, J. A.: Atmospheric Turbulence: Models and Methods for Engineering Applications, John Wiley and Sons, NY, 397 pp., 1984.
Prein, A., Langhans, W., Fosser, G., Ferrone, A., Ban, N., Goergen, K., Keller, M., Tölle, M., Gutjahr, O., Feser, F., Brisson, E., Kollet, S., Schmidli, J., van Lipzig, N., and Leung, R.: A review on regional convection-permitting climate modeling: Demonstrations, prospects and challenges, Rev. Geophys., 53, 323–361, https://doi.org/10.1002/2014rg000475, 2015.
Punkka, A., Teittinen, J., and Johns, R.: Synoptic and Mesoscale Analysis of a High-Latitude Derecho–Severe Thunderstorm Outbreak in Finland on 5 July 2002, Weather Forecast., 21, 752–763, https://doi.org/10.1175/waf953.1, 2006.
Rasmussen, E. and Blanchard, D.: A Baseline Climatology of Sounding-Derived Supercell andTornado Forecast Parameters, Weather Forecast., 13, 1148–1164, https://doi.org/10.1175/1520-0434(1998)013<1148:abcosd>2.0.co;2, 1998.
Reinhardt, T. and Seifert, A.: A three-category ice scheme for LMK, COSMO Newsletter, No. 6, Deutscher Wetterdienst, Offenbach, Germany, 115–120, available at: http://www.cosmo-model.org/content/model/documentation/newsLetters/newsLetter06/cnl6_reinhardt.pdf (last access: 13 May 2019), 2006.
Ritter, B. and Geleyn, J.: A Comprehensive Radiation Scheme for Numerical Weather Prediction Models with Potential Applications in Climate Simulations, Mon. Weather Rev., 120, 303–325, https://doi.org/10.1175/1520-0493(1992)120<0303:acrsfn>2.0.co;2, 1992.
Rockel, B., Raschke, E., and Weyres, B.: A parameterization of broad band radiative transfer properties of water, ice and mixed clouds, Contribution to Atmospheric Physics, 64, 1–12, 1991.
Rockel, B., Will, A., and Hense, A.: The Regional Climate Model COSMO-CLM (CCLM), Meteorol. Z., 17, 347–348, https://doi.org/10.1127/0941-2948/2008/0309, 2008.
Sanders, F.: A Proposed Method of Surface Map Analysis, Mon. Weather Rev., 127, 945–955, https://doi.org/10.1175/1520-0493(1999)127<0945:apmosm>2.0.co;2, 1999.
Sanders, F.: Real Front or Baroclinic Trough?, Weather Forecast., 20, 647–651, https://doi.org/10.1175/waf846.1, 2005.
Schulz, J.: Revision of the turbulent gust diagnostics in the COSMO model, COSMO Newsletter, No. 8, Deutscher Wetterdienst, Offenbach, Germany, 17–22, available at: http://www2.cosmo-model.org/content/model/documentation/newsLetters/newsLetter08/cnl8_schulz.pdf (last access: 13 May 2019), 2008.
Sherburn, K. and Parker, M.: High-shear, low-CAPE environments: What we know and where to go next, Preprints, 27th Conference on Severe Local Storms, Portland, OR, American Meteorological Society, 12B.2, available at: https://ams.confex.com/ams/27SLS/webprogram/Paper254227.html (last access: 13 May 2019), 2014a.
Sherburn, K. and Parker, M.: Climatology and Ingredients of Significant Severe Convection in High-Shear, Low-CAPE Environments, Weather Forecast., 29, 854–877, https://doi.org/10.1175/waf-d-13-00041.1, 2014b.
Taszarek, M., Pilguj, N., Orlikowski, J., Surowiecki, A., Walczakiewicz, S., Pilorz, W., Piasecki, K., Pajurek, Ł., and Półrolniczak, M.: Derecho evolving from a mesocyclone – a study of 11 August 2017 severe weather outbreak in Poland: event analysis and high-resolution simulation, Mon. Weather Rev., in press, https://doi.org/10.1175/MWR-D-18-0330.1, 2019.
Tiedtke, M.: A Comprehensive Mass Flux Scheme for Cumulus Parameterization in Large-Scale Models, Mon. Weather Rev., 117, 1779–1800, https://doi.org/10.1175/1520-0493(1989)117<1779:acmfsf>2.0.co;2, 1989.
Toll, V., Männik, A., Luhamaa, A., and Rõõm, R.: Hindcast experiments of the derecho in Estonia on 8 August, 2010: Modelling derecho with NWP model HARMONIE, Atmos. Res., 158–159, 179–191, https://doi.org/10.1016/j.atmosres.2014.10.011, 2015.
Weisman, M. and Klemp, J.: The Dependence of Numerically Simulated Convective Storms on Vertical Wind Shear and Buoyancy, Mon. Weather Rev., 110, 504–520, https://doi.org/10.1175/1520-0493(1982)110<0504:tdonsc>2.0.co;2, 1982.