the Creative Commons Attribution 4.0 License.
the Creative Commons Attribution 4.0 License.
 | 17 Jun 2019
Towards measuring resilience of flood-prone communities: a conceptual framework
Victor O. Oladokun
Community resilience has become an important policy and research concept for understanding and addressing the challenges associated with the interplay of climate change, urbanization, population growth, land use, sustainability, vulnerability and increased frequency of extreme flooding. Although measuring resilience has been identified as a fundamental step toward its understanding and effective management, there is, however, lack of an operational measurement framework due to the difficulty of systematically integrating socioeconomic and techno-ecological factors. The study examines the challenges, constraints and construct ramifications that have complicated the development of an operational framework for measuring resilience of flood-prone communities. Among others, the study highlights the issues of proliferation of definitions and conceptual frameworks of resilience, challenges of data availability, data variability and data compatibility. Adopting the National Academies' definition of resilience, a conceptual and mathematical model was developed using the dimensions, quantities and relationships established by the definition. A fuzzy logic equivalent of the model was implemented to generate resilience indices for three flood-prone communities in the United States. The results indicate that the proposed framework offers a viable approach for measuring community flood resilience, even when there is a limitation on data availability and compatibility.


Developing resilience of communities has become widely recognized as critical for disaster risk management due to the increased incidents of extreme weather events, such as flooding, which have disrupted economic activities, caused huge losses, displaced people and threatened the sustainability of communities across the world (Cai et al., 2018; Cutter 2018; Mallakpour and Villarini, 2015; Montz, 2009; Oladokun et al., 2017; Su, 2016a; Wing et al., 2018). Major international policy instruments such as the United Nations International Strategy for Disaster Reduction's (UNISDR) 2015 Strategic Framework and the 2005 Hyogo Framework have emphasized and adopted resilience principles in disaster risk management (Cai et al., 2018; Cutter et al., 2016). For instance, the interplay of extreme floods, population growth and rapid urbanization has increased flood hazard risks such that conventional flood risk management (FRM) measures of concrete structures, levees, flood walls and other defenses have become inadequate and unsustainable across various communities (Duy et al., 2018; Guo et al., 2018; Trogrlić et al., 2018; Wing et al., 2018). Resilience has gained a lot of attention, from both policy and research perspectives, involving using it to understand and address the challenges of land use, vulnerability and sustainability in the context of flooding (Cohen et al., 2016, 2017; Folke, 2006; Parsons et al., 2016; Sharifi, 2016). Building community resilience has emerged as particularly relevant in dealing with flooding, which has become the most widespread and destructive of all natural hazards globally (Jha et al., 2012; Mallakpour and Villarini, 2015; Montz, 2009).
Consequently, there has been a shift from relying solely on large-scale flood defense and structural systems towards an approach that emphasizes the concept of community resilience as a strategic component of flood risk management (Hammond et al., 2015; Park et al., 2013). This shift is being reinforced by a consensus that since floods cannot be all together prevented, FRM must focus more on building the resilience of flood-prone communities (Joseph et al., 2014; Oladokun et al., 2017; Schelfaut et al., 2011).
There is a consensus that the first and fundamental step toward understanding and operationalizing resilience for flood disaster and hazard management is to have an acceptable resilience measuring template (NRC, 2012). For instance, the ability to understand and objectively evaluate the impact of FRM programs, interventions and practices on community flood resilience is needed for making political and business cases for proactive FRM investment from both public and private sectors. Cutter (2018) suggested that an acceptable template is a basic foundation for monitoring baselines and progress in building hazard resilience.
Furthermore, a measuring template will be useful as a decision support tool for the efficient deployment of scarce FRM resources and also provides a basis for monitoring resilience changes with respect to resource deployment. For instance, Keating et al. (2017) explained that there is a need for the continued development of theoretically sound, empirically verified and applicable frameworks and tools that help in understanding key components of resilience in order to better target resilience-enhancing initiatives and evaluate the changes in resilience as a result of different capacities, actions and hazards.
Therefore, the search for an acceptable framework and empirical model for measuring resilience remains relevant and continues to attract attention (Cutter et al., 2016; Zou et al., 2018; Cai et al., 2018; Keating et al., 2017). Some existing measuring approaches, as identified in Cai et al. (2018), include the Baseline Resilience Indicators for Communities (BRIC), the Resilience Inference Measurement (RIM) framework, the National Oceanic and Atmospheric Administration (NOAA) Coastal Resilience Index, the PEOPLES Resilience Framework and the Communities Advancing Resilience Toolkit (CART). There is also the “5C-4R” Zurich Alliance framework combining the “five capitals” of the UK's Department for International Development Sustainable Livelihood Framework (Scoones, 1998) and the four properties of a resilient system (Szoenyi and Nash, 2016); the framework incorporates a technical risk grading standard (TRGS) developed by Zurich risk experts (Keating et al., 2017).
Despite the attention resilience has gained, the concept remains difficult to operationalize in the context of community flood risk management due to, among other factors, the difficulty in measuring resilience (Cutter, 2018; Fisher, 2015). Many experts and authors have noted the difficulty in integrating indicators of the natural and human systems as well as socio-environmental factors into resilience by most of the existing frameworks (Cai et al., 2018; Cutter, 2018; Fuchs and Thaler, 2018; Qiang and Lam, 2016). Resilience, as a multifaceted and multidimensional concept, has developed across multiple disciplines and applications such that resilience discourse has attracted multidisciplinary interests from both research and policy perspectives. While the wide spectrum of multidisciplinary and practice interests characterizing resilience discourse has increased its understanding and generated insights, it has also led to the emergence of multiple variants of its definition as well as the absence of consensus on the conceptual framework for its measurement (Brown and Williams, 2015; Cohen et al., 2016; Cutter, 2018). For instance, resilience has been noted to have varied definitions depending on the hazard and disciplinary contexts, with over 70 definitions identified by Fisher (2015).
The multiplicity of definitions has led to proliferation of conceptual models, frameworks and interpretations (Costache, 2017), such that there is difficulty in transforming resilience measurement from an abstract concept into an objective operational quantitative template. According to Cutter (2018), the difficulties in harmonizing and operationalizing these definitions have led to the emergence of a wide array of measurement approaches. Meanwhile, a prerequisite to having an operational model, in the context of resilience measurement, is the adoption or convergence of definition by the resilience research and policy community. Such a definition should meet the following criteria: (i) it emanates from or receives the formal endorsement of a widely recognized institutional platform of stakeholders, (ii) encompasses a wide spectrum of existing resilience concepts, (iii) has some degree of simplicity and (iv) enjoys high acceptance of both the research and policy community. In a widely cited National Research Council report (NRC, 2012), the US National Academy of Sciences defines resilience as the ability of a system to prepare and plan for, absorb, recover from and more successfully adapt to adverse events (Cai et al., 2018; Cutter, 2018). Therefore, this study has adopted this definition as the basis for the proposed framework for measuring the resilience of flood-prone communities.
From a systems perspective, community resilience is a nonlinear collection of socio-ecological, sociopolitical, techno-ecological and socioeconomic entities, each characterized by dynamic and complex spatiotemporal interactions. Essentially, the concept of resilience involves the interactions of several entities each defined by some social, economic, natural, technical and environmental dimensions (Cai et al., 2018; Norris et al., 2008). For instance, the community component was succinctly described by Cai et al. (2018) as a coupled natural and human system that manifests various sources of complexity such as nonlinearity, feedback, uncertainty and dynamic interactions.
Furthermore, coupled with the challenge of complexity and the dynamic nature of community-resilience modeling is the challenge of data and computational analysis. It has been established that information and data items characterizing the community-resilience system are mostly imprecise, incomplete, vague, complex, fuzzy and subjective within the context of flood risk management (Kotze and Reyers, 2016; Oladokun et al., 2017). These characteristics present some operational and analytical challenges for any complex model based on traditional crisp mathematics and hard computational approaches because of data availability, data variability and data compatibility. The resilience measuring problem with its interplay of definitional ambiguities, multidimensionality and spatiotemporal dynamics invariably results in complex mathematical models. Such models, given the level of incompleteness, vagueness and subjectivity that characterizes the human and sociopolitical aspects of resilience, offer little tractability with conventional hard computational tools and are difficult to operationalize. Hence, Oladokun et al. (2017) suggested that a resilience measuring model may be more amenable to a soft computing analytical technique such as fuzzy logic.
1.1 Aim and objectives
Based on the background presented above, this study is aimed at adopting a soft computing approach, a fuzzy logic computational model, for the proposed flood resilience measuring template. In particular, the objectives of the study are (1) the development of a descriptive model that outlines our abstract interpretation of community resilience as a system, using insights from relevant literature, interactions with experts and observations of selected flood-prone communities, (2) the development of an equivalent mathematical model of the resulting descriptive model using an appropriate tool to generate further insights and (3) the development of an equivalent fuzzy inference system suitable for computational and analytical purposes in the face of the aforementioned data issues. The next section briefly describes some relevant fuzzy logic concepts.
1.2 An overview of fuzzy logic
Fuzzy set theory provides a mathematical tool for modeling uncertain, imprecise, vague and subjective data which represent a huge class of data encountered in most real-life situations (Adnan et al., 2015; Lincy and John, 2016). The fuzzy logic (FL) concept, introduced in 1965 by Lot A. Zadeh, is an extension of the classical set theory of crisp sets. FL, like humans, accommodates grey areas where some questions may not have a clear “yes” or “no” answer or black and white categorization. According to Zadeh (1996), fuzzy logic is “computing with words”. FL mimics human reasoning and capability to summarize data and focus on decision-relevant information in problems involving incomplete, vague, imprecise or subjective information. It is a computational concept that allows for the modeling of complex systems using a higher level of abstraction originating from our knowledge and experience. It provides a very powerful tool for dealing quickly and efficiently with imprecision and nonlinearity (Oladokun and Emmanuel, 2014). This capability to mine expert knowledge and use limited or fuzzy data makes fuzzy inference systems (FISs) a suitable tool for resilience measurement modeling.
The concept of membership function (MF) is central to FISs. In traditional logic, an element x is either in or out of crisp set A; in other words, its degree of membership of the set is either 0 or 1. However, in fuzzy logic the element x can be in a fuzzy set B “partially” by using a MF μB(x) which can return any real value between 0 and 1. This returned value is the degree of membership representing the degree to which the element belongs to a fuzzy set. Therefore, in FL, the truth of any statement becomes a matter of degree.
Thus for crisp set .
On the other hand, for a fuzzy set, the MF may be represented as follows
Actually, the crisp set is a special case fuzzy set whose MF returns only 0 or 1. There are many functions that are used as MFs. Some widely used MFs are generalized bell-shaped, Gaussian curves, polynomial curves, trapezoidal, triangular and sigmoid MFs (Oladokun and Emmanuel, 2014; Adnan et al., 2015). The Mamdani FIS approach (Mamdani and Assilian, 1975), adopted for this study, is made up of a fuzzy inference engine characterized by the use of carefully selected MFs and a fuzzy rule base. The rule base is a set of “IF THEN” statements that capture experts' knowledge of the logic governing the problem. The fuzzy inference system will provide a template for experts and other stakeholders to translate their perceptions of the problem and map their linguistics rating of these variables into a resilience index based on the fuzzy relationships we define.
2.1 Descriptive model
The design objective is to have a conceptual framework and its associated mathematical model with sufficient tractability by minimizing the number of model elements and adopting the barest minimum relationships while maintaining a reasonable level of validity. Therefore, as the theoretical basis for the proposed conceptual model, as mentioned earlier, we are adopting the resilience definition put forward by the US National Academies (NRC, 2012). Conceptually this definition implies that a community's resilience is a quantity that reflects capacities such as (1) the community's coping capacities, in terms of a threshold of hazard it can absorb (hazard absorption capacity H), (2) its accessible resources (resource availability G) and (3) its resource utilization efficiency determined by factors like its preparedness and its governance processes (resource utilization processes θ). These capacities interact to define its ability to prepare for, absorb, recover from and more successfully adapt to adverse flooding events. We attempt to conceptualize this understanding as shown in Fig. 1.
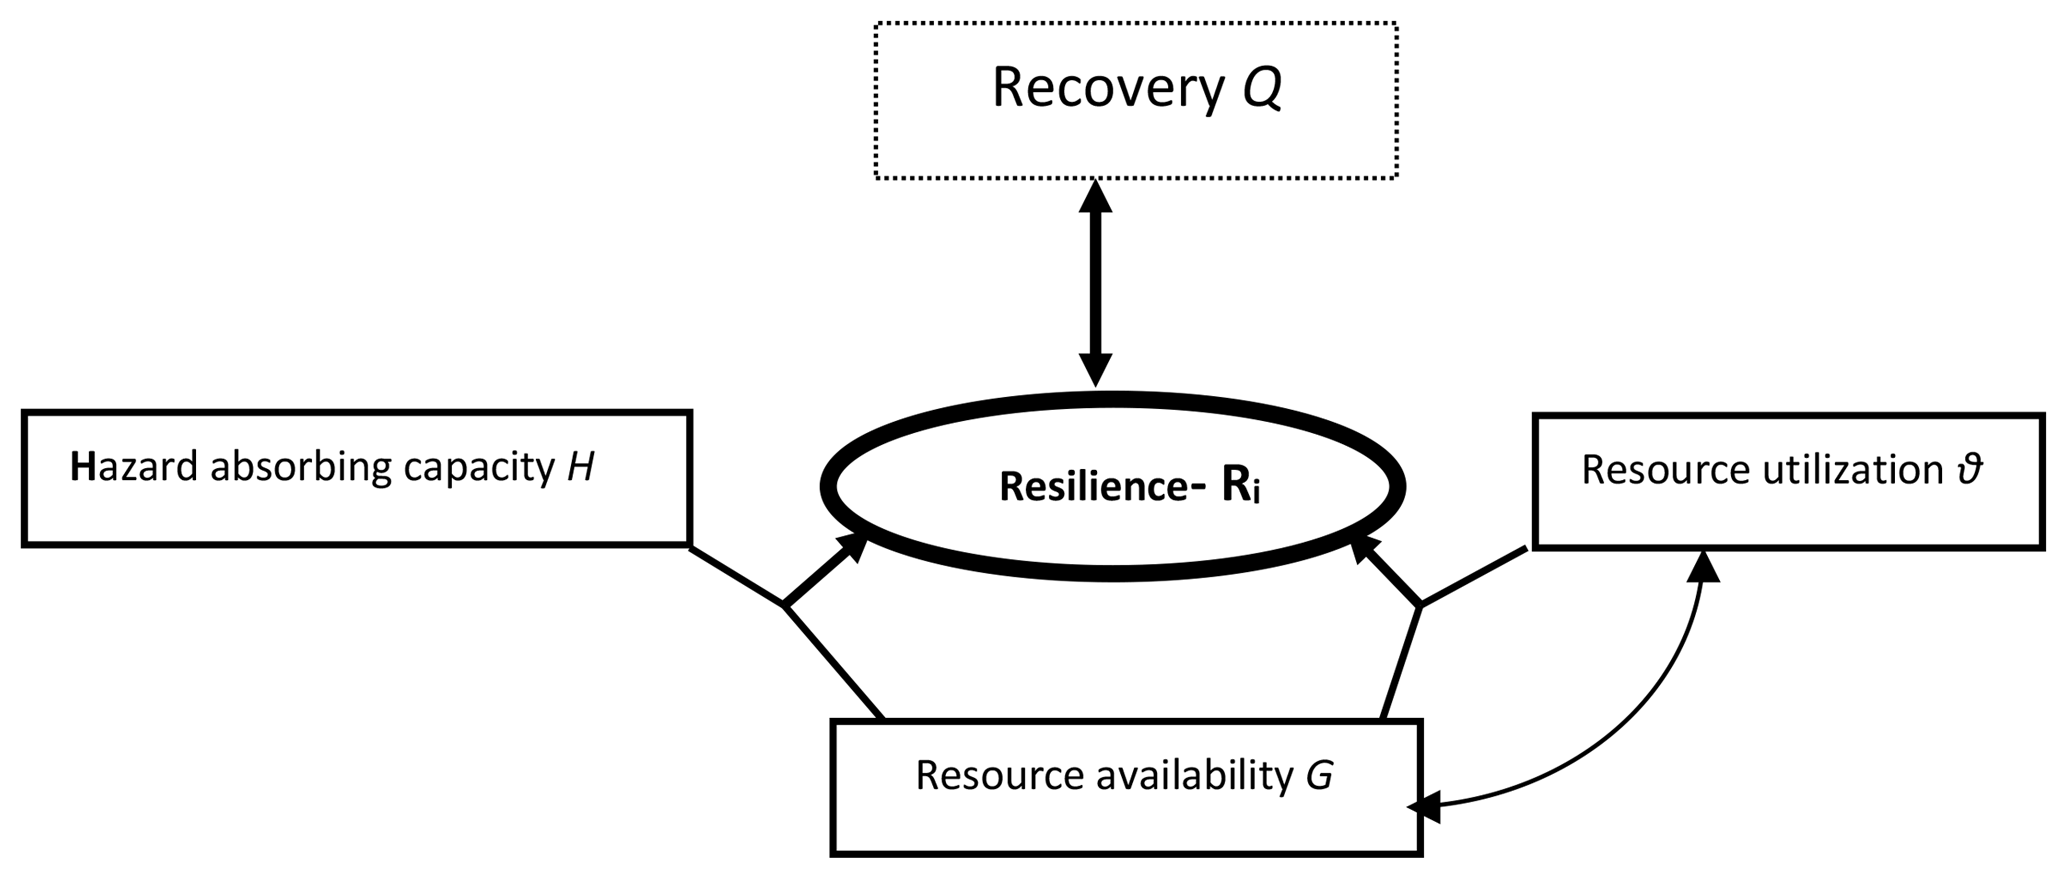
Each of the dimensions in Fig. 1 is influenced by a number of technical, social, ecological, economic and political factors following work that has been reported in the literature which sheds light on these factors and how they influence the dimensions (see Cohen et al., 2016; Lee et al., 2013; Rose, 2017). For example, hazard absorbing capacity H is determined by a number of techno-ecological factors such as adequacy, sophistication and the use of infrastructure and technology as well as redundant capacities. It is also determined by socio-ecological and socioeconomic factors that influence both individual and institutional coping capacities. Resource availability is determined by things like community capital, political influence and economic activities as well as ecological resources accessible to drive the quality and timeliness of recovery. Resource utilization processes are determined by the quality of governance and institutions such as judiciary, police, media and public service. These processes influence policy formulation and implementation, the ease of doing business and the efficiency of use of resources. A detailed structured and operational rendition of the foregoing is presented in Sects. 2.2 and 3.3.
Furthermore, in the context of FRM, the framework of Fig. 1 recognizes that resilience enhances recovery or that recovery is an outcome of resilience, whereby when a community, as a coupled system, becomes more resilient, its capacity to experience post-disaster recovery increases. In other words, recovery, in terms of time taken to attain post-disaster recovery and the degree of recovery attained, is influenced by its resilience. Invariably the conceptual framework implicitly suggests that recovery (recovery speed and recovery quality) can surrogate resilience. This is reasonable because post-disaster recovery is driven by resilience factors such as preparedness, and coping capacity, among others. This understanding is supported by the Disaster Resilience Of Place (DROP) model as illustrated in Cutter et al. (2008), reproduced in Fig. 2.
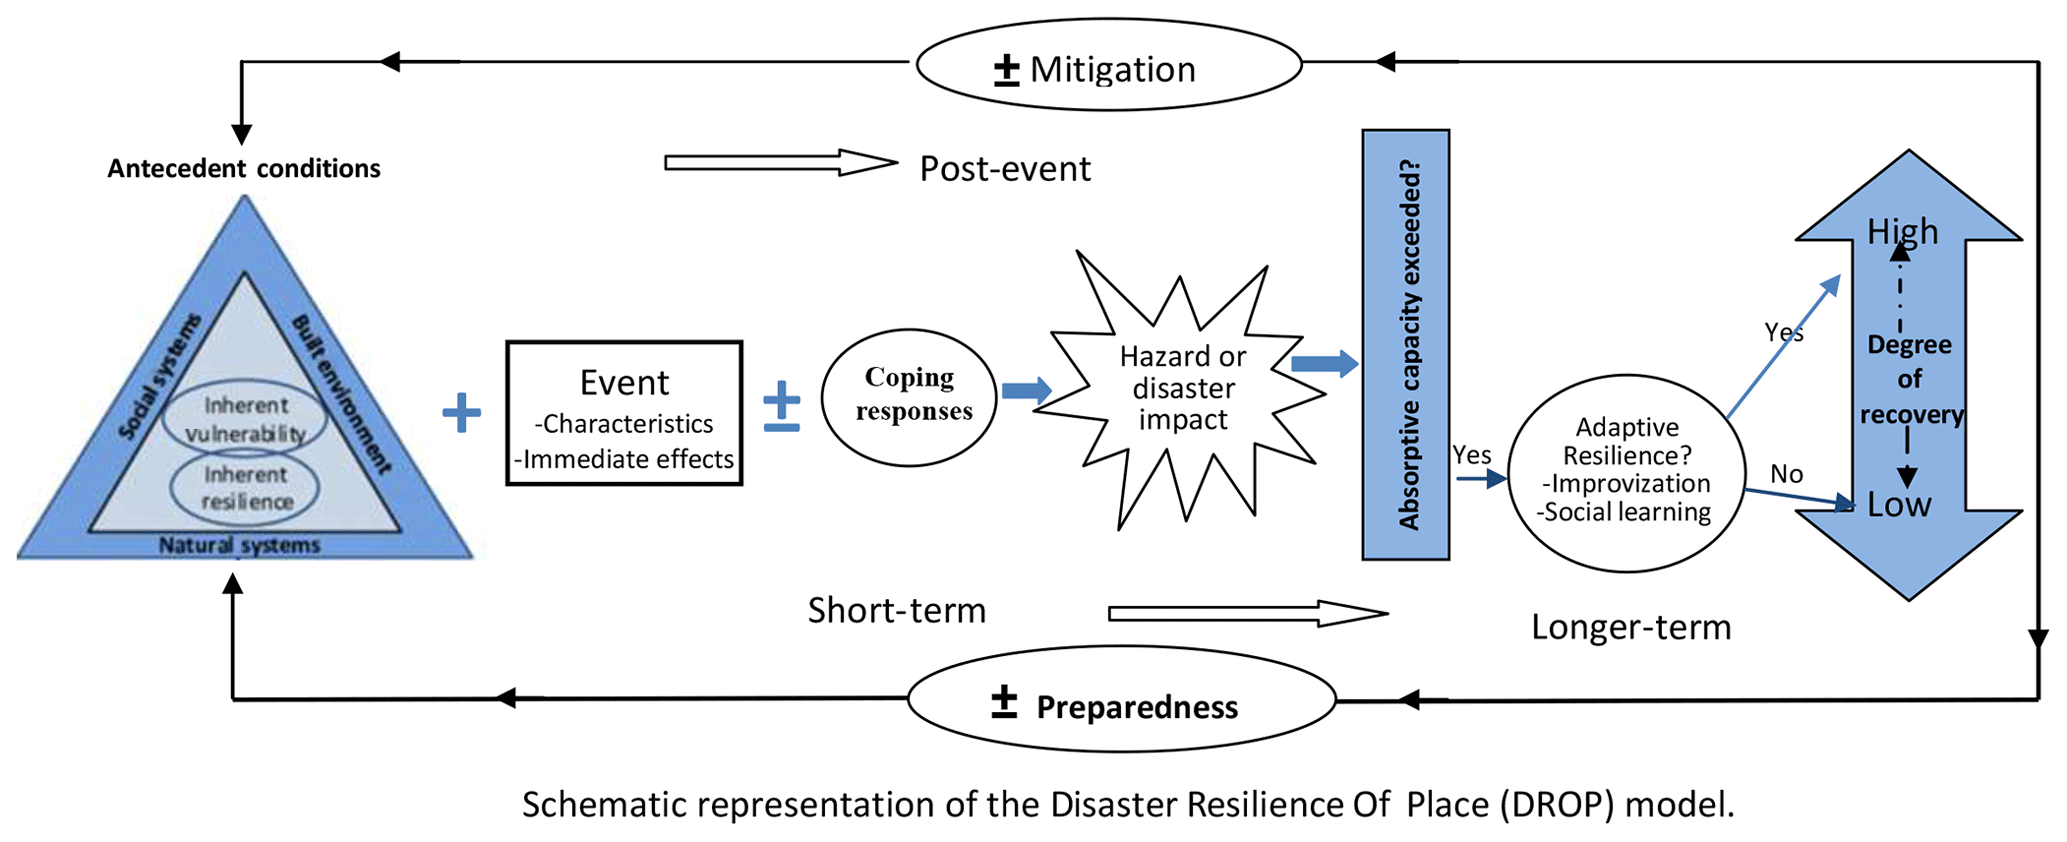
Figure 2The Disaster Resilience of Place (DROP) model reproduced from Cutter et al. (2008). A place-based model for understanding community resilience to natural disasters. This model illustrates the interrelationship between resilience and recovery within the hazard-resilience system.
2.2 Mathematical model
The next stage is to transform the conceptual framework of Fig. 1 into an operational mathematical model. This is accomplished by defining a geometric model of the framework as shown in Fig. 3. This model is then used to derive appropriate mathematical relationships for resilience measurement and provide some insights.
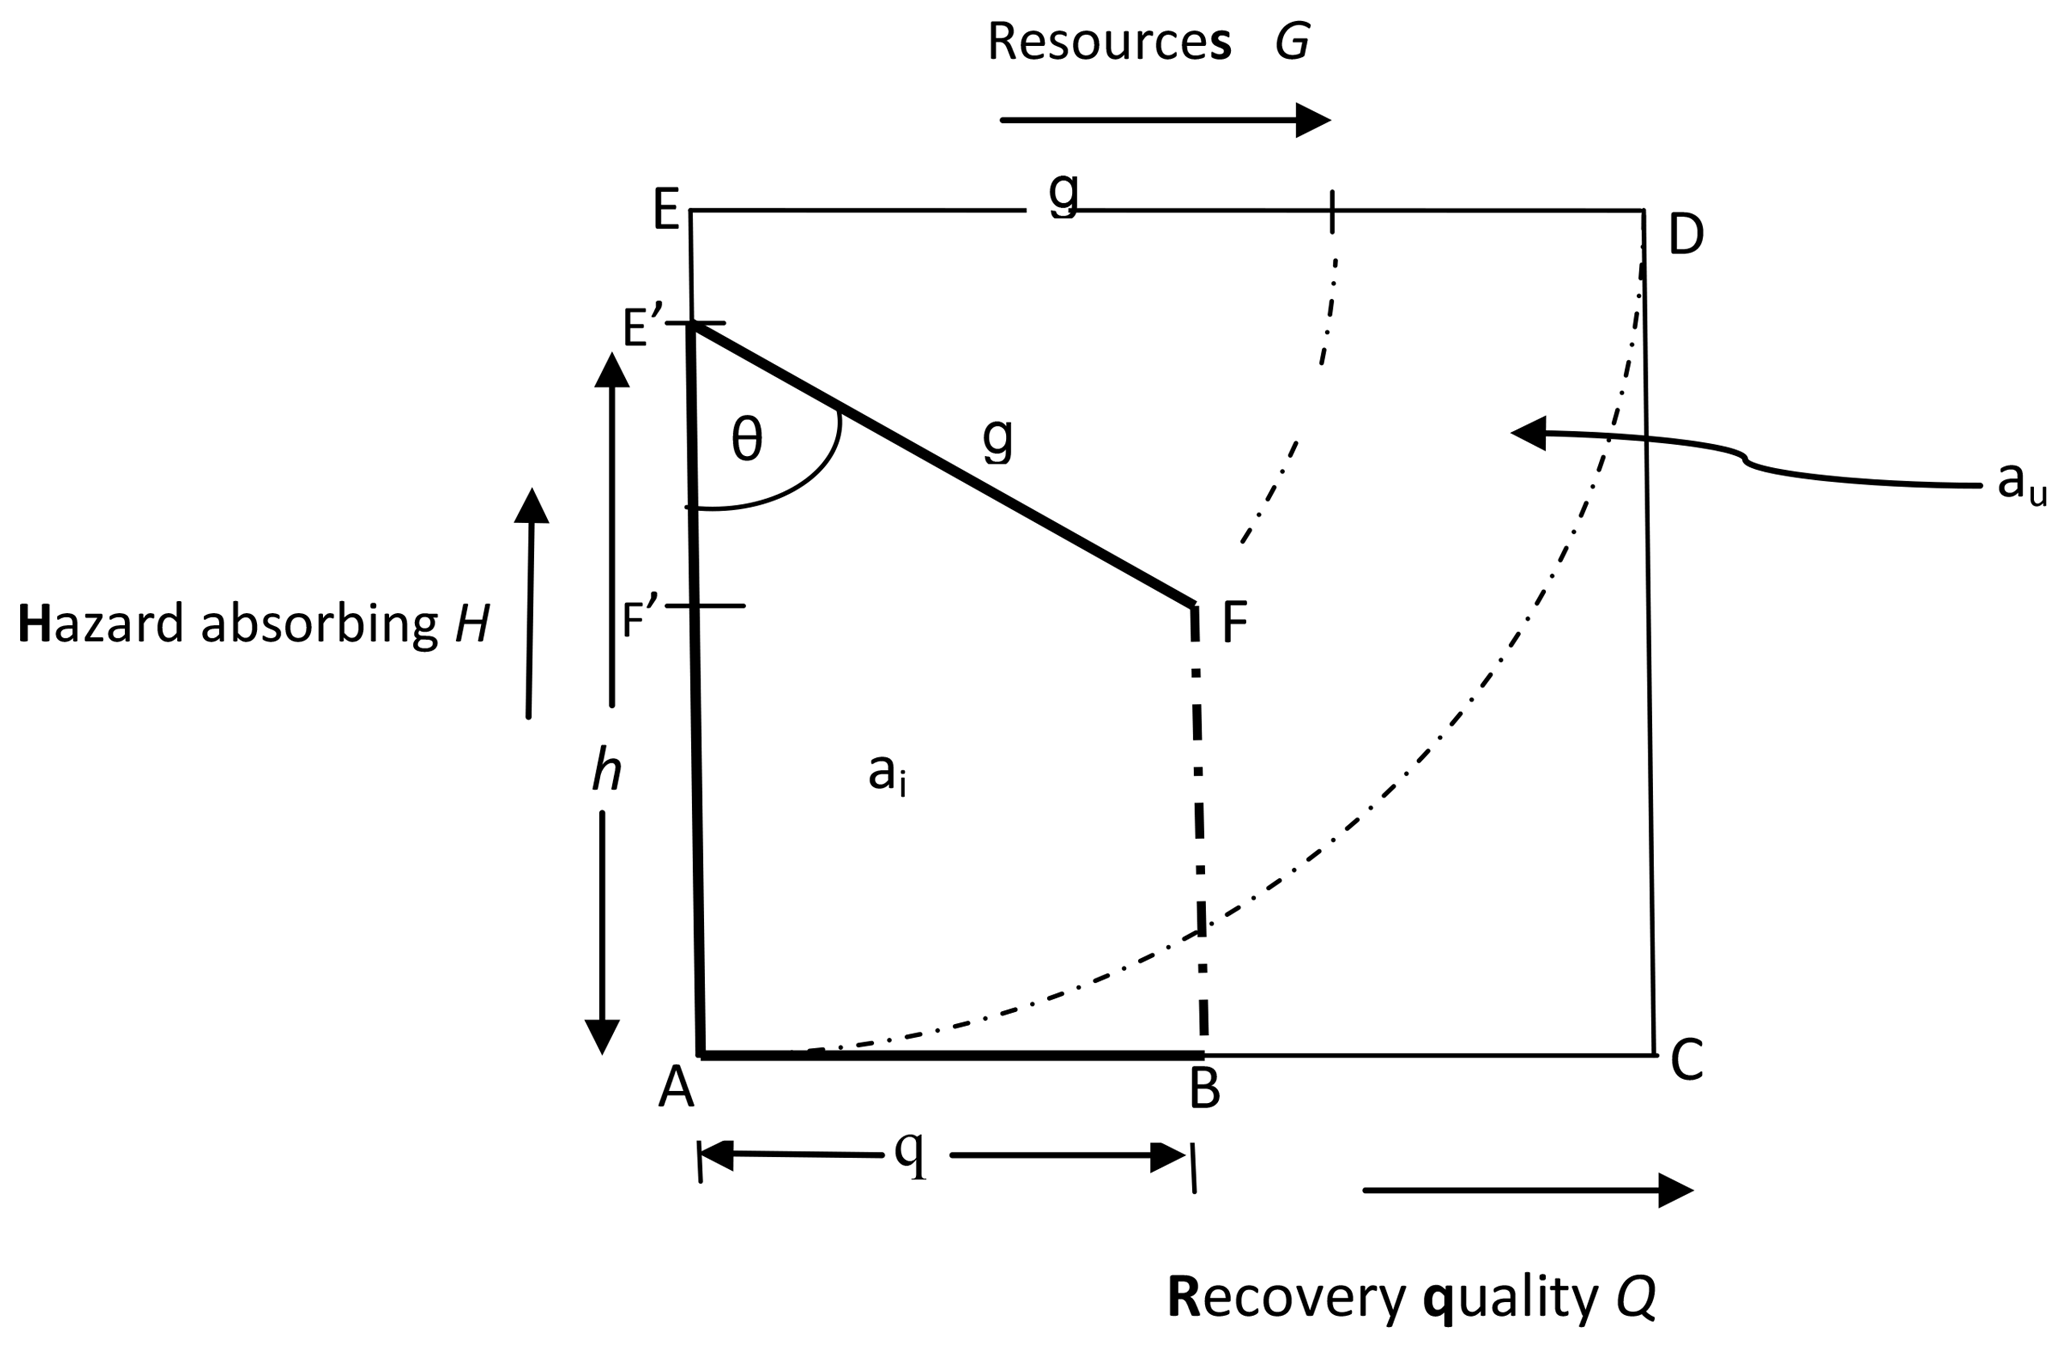
Figure 3Resilience conceptual model. A geometric model used to derive appropriate mathematical relationships of the proposed framework and provide some insights.
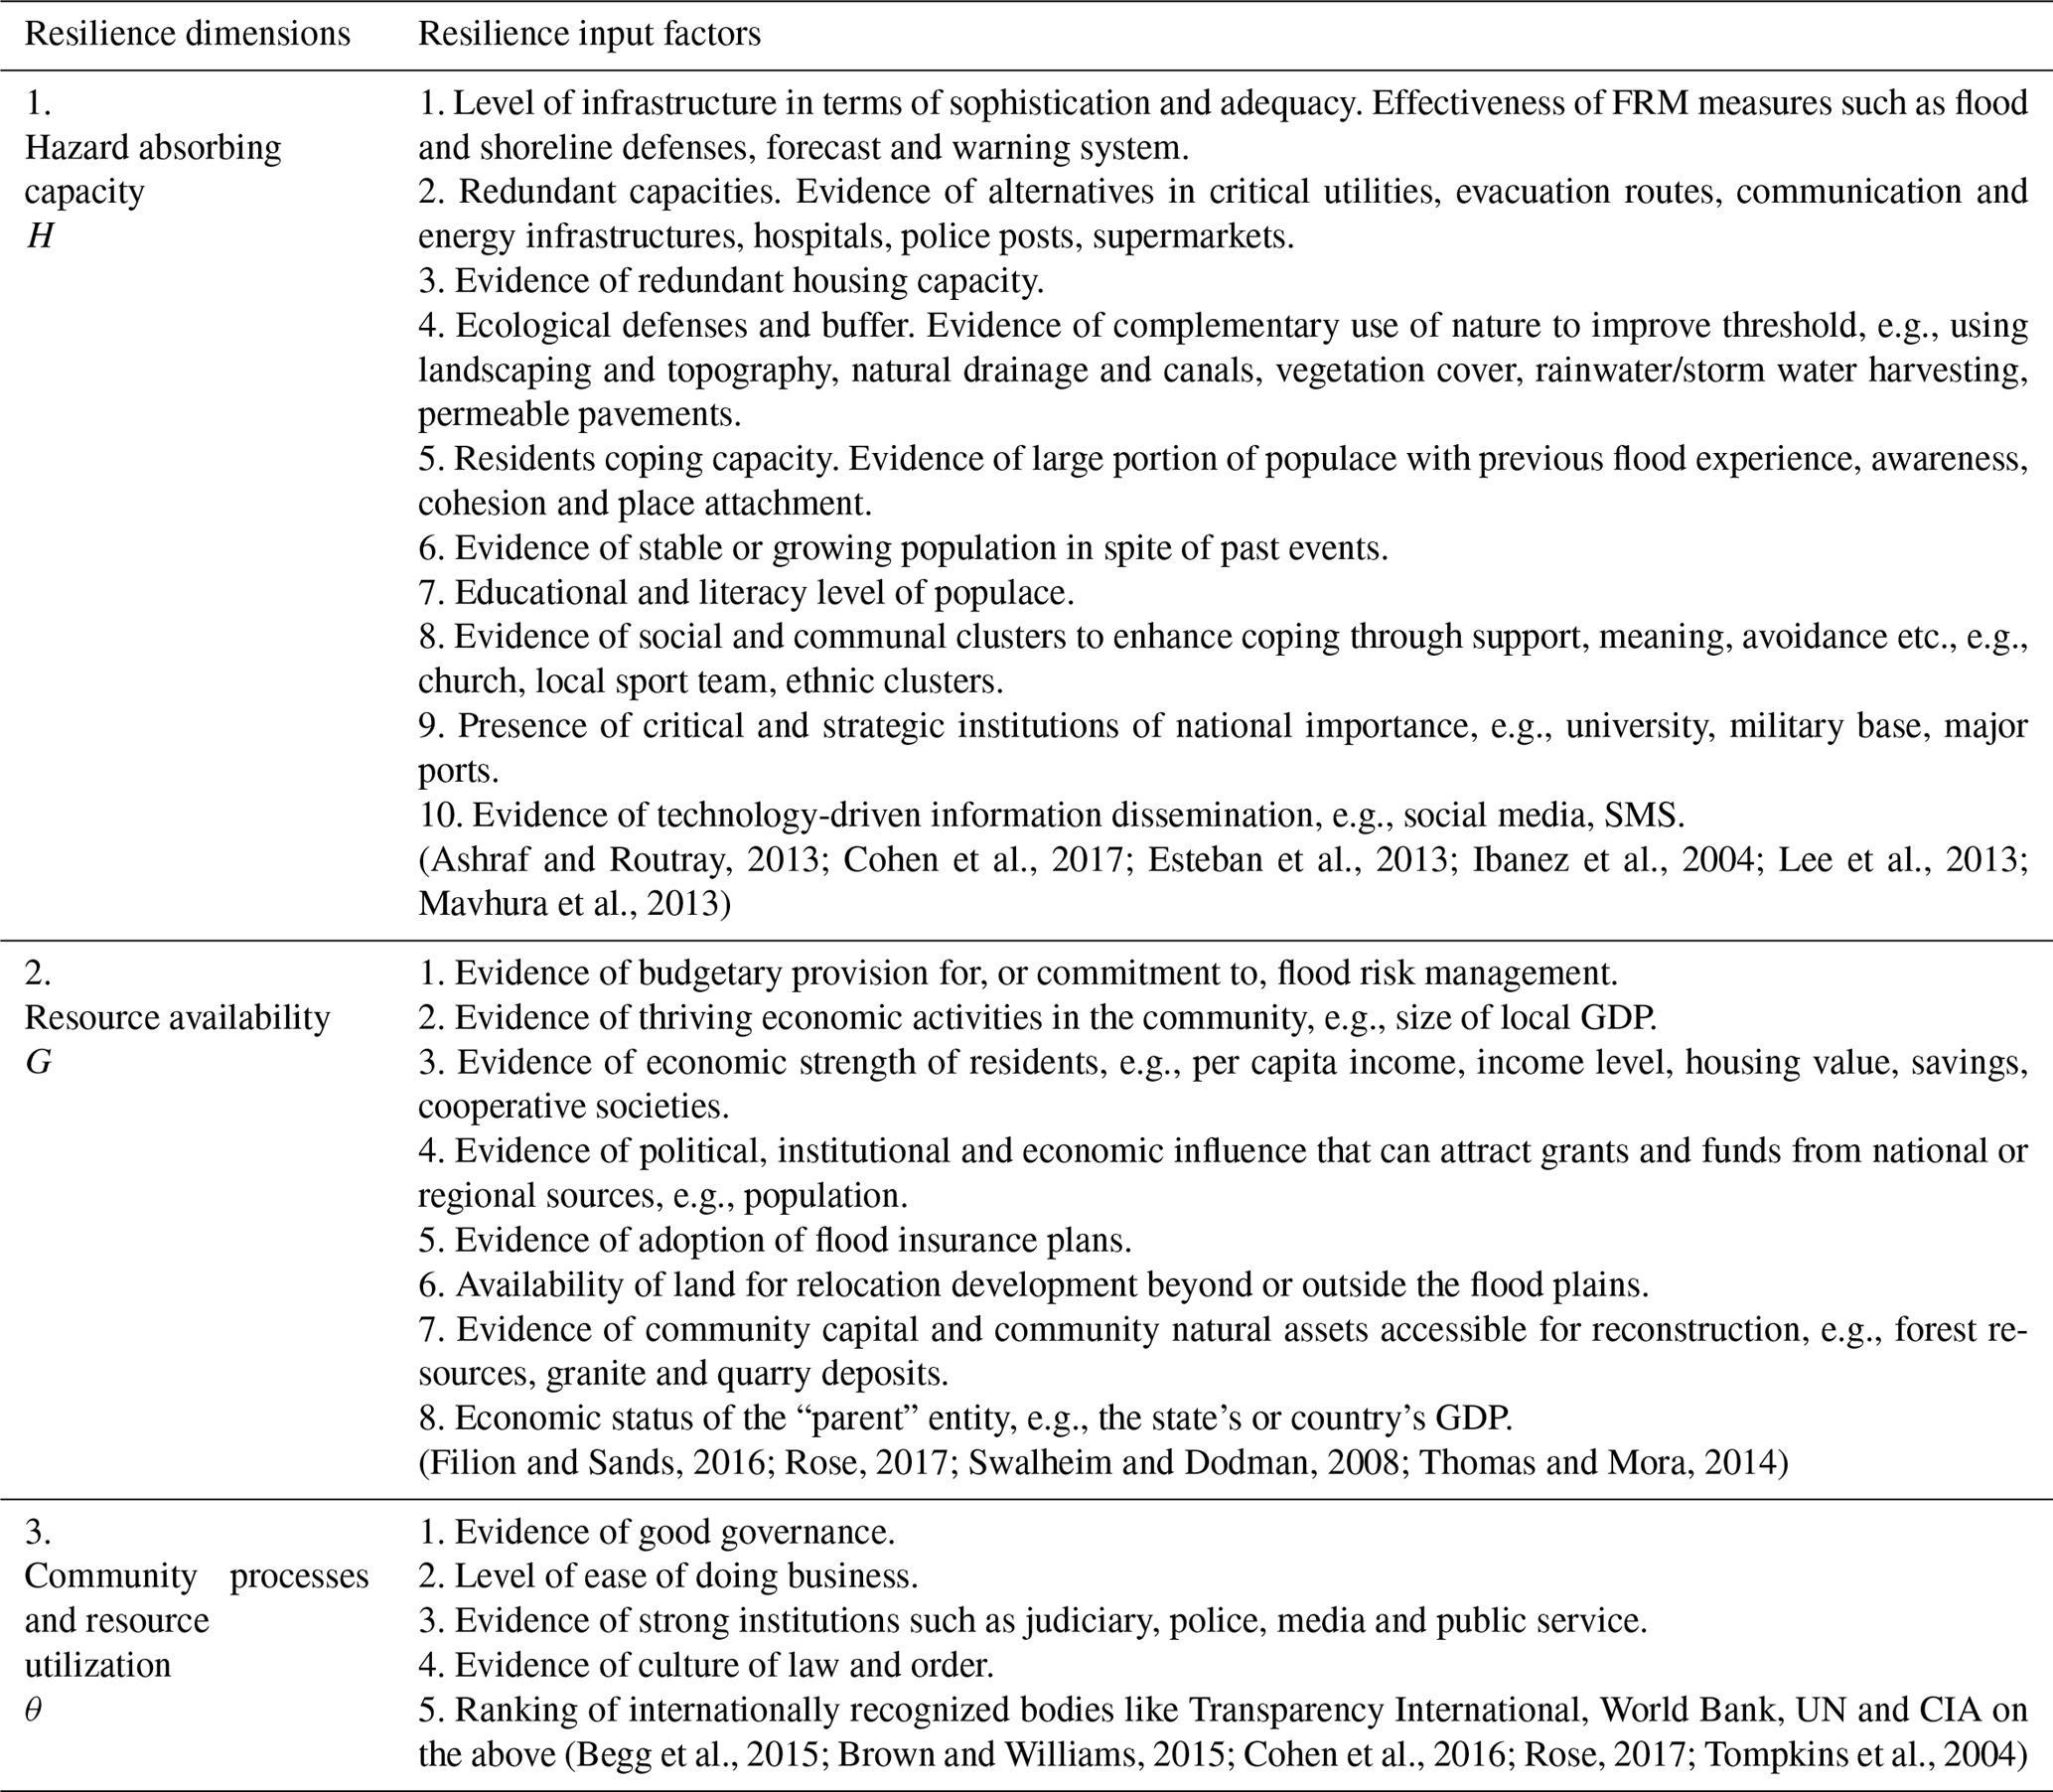
Table 1Resilience dimensions and descriptions of input factors influencing their states.
2.2.1 Notation, definitions and terms
We adopt the following notation, definitions and terms to explain the components of Fig. 3 in the context of flood hazard.
- i.
Hazard absorbing capacity (H) (H=h: ). The resilience of a community depends on the level of the flood hazard the community systems can absorb before totally collapsing or undergoing irreversible disintegration. H=1 is the highest absorbing capacity, whereby the community can absorb and survive the damages and disturbance (both structural and nonstructural) of the most severe category of flooding conceivable. This captures various resilience factors such as coping capacity, redundancy, preparedness, sense of place attachment and other capacities as explained in Table 1.
- ii.
Resource availability (G). This is the quantum of resources available to plan and pursue recovery as well as achieve recovery quality level Q (including adaptive recovery). Note that G=g () captures both economic and community capital. It is the measure of resources the community is able to attract as a result of its overall economic and political influence, its natural assets and human capital assets (see Table 1 for further details).
- iii.
Resource utilization processes (θ). With , we define ρ (ρ=Sinθ) as system efficiency. This is a resilience component that affects recovery and revolves around factors such as preparedness, community governance, institutional systems and processes. It determines the efficiency and effectiveness of the use of resources to achieve recovery and establish adaptive capacity. In other words, how well resources are used is as important as how much of a set of resources is used in building resilience. It measures the probity, level of accountability, level of waste, corruption, red-tapism and bureaucracies within the system. A community with strong institutions such as a functioning judiciary and an efficient civil service, for instance, will tend to return high ρ. So an ideal or utopian community will have its G deployed at , such that .
- iv.
Recovery quality level (Q). This represents the outcome of post-hazard conditions in terms of restoration quality and socio-ecological functionality, among others.
The following definitions apply with reference to Fig. 3.
- v.
ai. The resilience reservoir of a real system i is defined as the area of trapezium ABFE' determined by the hazard absorbing capacity, at H=h, of the system, the available quantum of resources (G=g), the quality of governance processes and resource utilization systems (Sin θ) and the achievable recovery quality (Q=q).
- vi.
au. The resilience reservoir of a utopian (ideal) system is defined as the area of square ACDE. This occurs at ideal FRM conditions: that is, a community system with adequate resources, perfect governance and processes with zero waste of resources and infinite hazard coping threshold when h= AE (or at maximum absorbing capacity), g= ED (maximum resource adequacy) and (perfect or utopian system with 100 % efficiency or Sin θ=1.0). The utopian system can achieve a perfect recovery index or Q= AC.
An extensive review of the literature was carried out to provide an informed basis for mapping FRM factors and inputs to the dimensions of resilience. This is summarized as shown in Table 1. Theoretically, the values of the dimensions H, G and θ can be estimated from adequate data on these input factors and appropriate functions.
2.2.2 Resilience modeling
The utopian resilience reservoir is the benchmark for evaluating resilience such that actual resilience Ri can be defined as the ratio of ai to au as indicated in Eq . (1).
Using the insights from Fig. 1, we attempt to develop the mathematical model implied in Eq. (1) (note R is dimensionless since both ai and au are areas).
Putting Eqs. (4), (5) and (6) into (2),
Recall we define the efficiency of the resource utilization system as ρ= Sinθ:
Putting Eq. (3) and (7) into (1),
Without loss of generality, h and g are treated as indices such that
Then 1 in Eq. (8), which implies
Equation (9) is a valid expression for resilience; that is Ri=f(hgρ), where h, g and ρ are as explained in Sect. 2.2.1, and their values are decided by experts and/or stakeholders, varying depending upon the location and scale of application of the model.
2.2.3 Some insights from model using some extreme values
This section discusses some example cases of the model (Eq. 9) output using selected hypothetical extreme parameters' values to generate further insights into model structure (with reference to Fig. 1). The “extreme” scenarios analysis is used to demonstrate how each of the three dimensions impacts R.
Case 1: As
In fact, R=0 when ρ=0. This may be interpreted as the case when the resource utilization processes have zero efficiency (see Fig. 4) or a collapsed governance system such as when a flood disaster occurs in a community ravaged by civil war with breakdown of law and order. In such situations, community resilience is nil as all resources put into recovery will be “wasted”, irrespective of the level of coping or infrastructure previously in place.
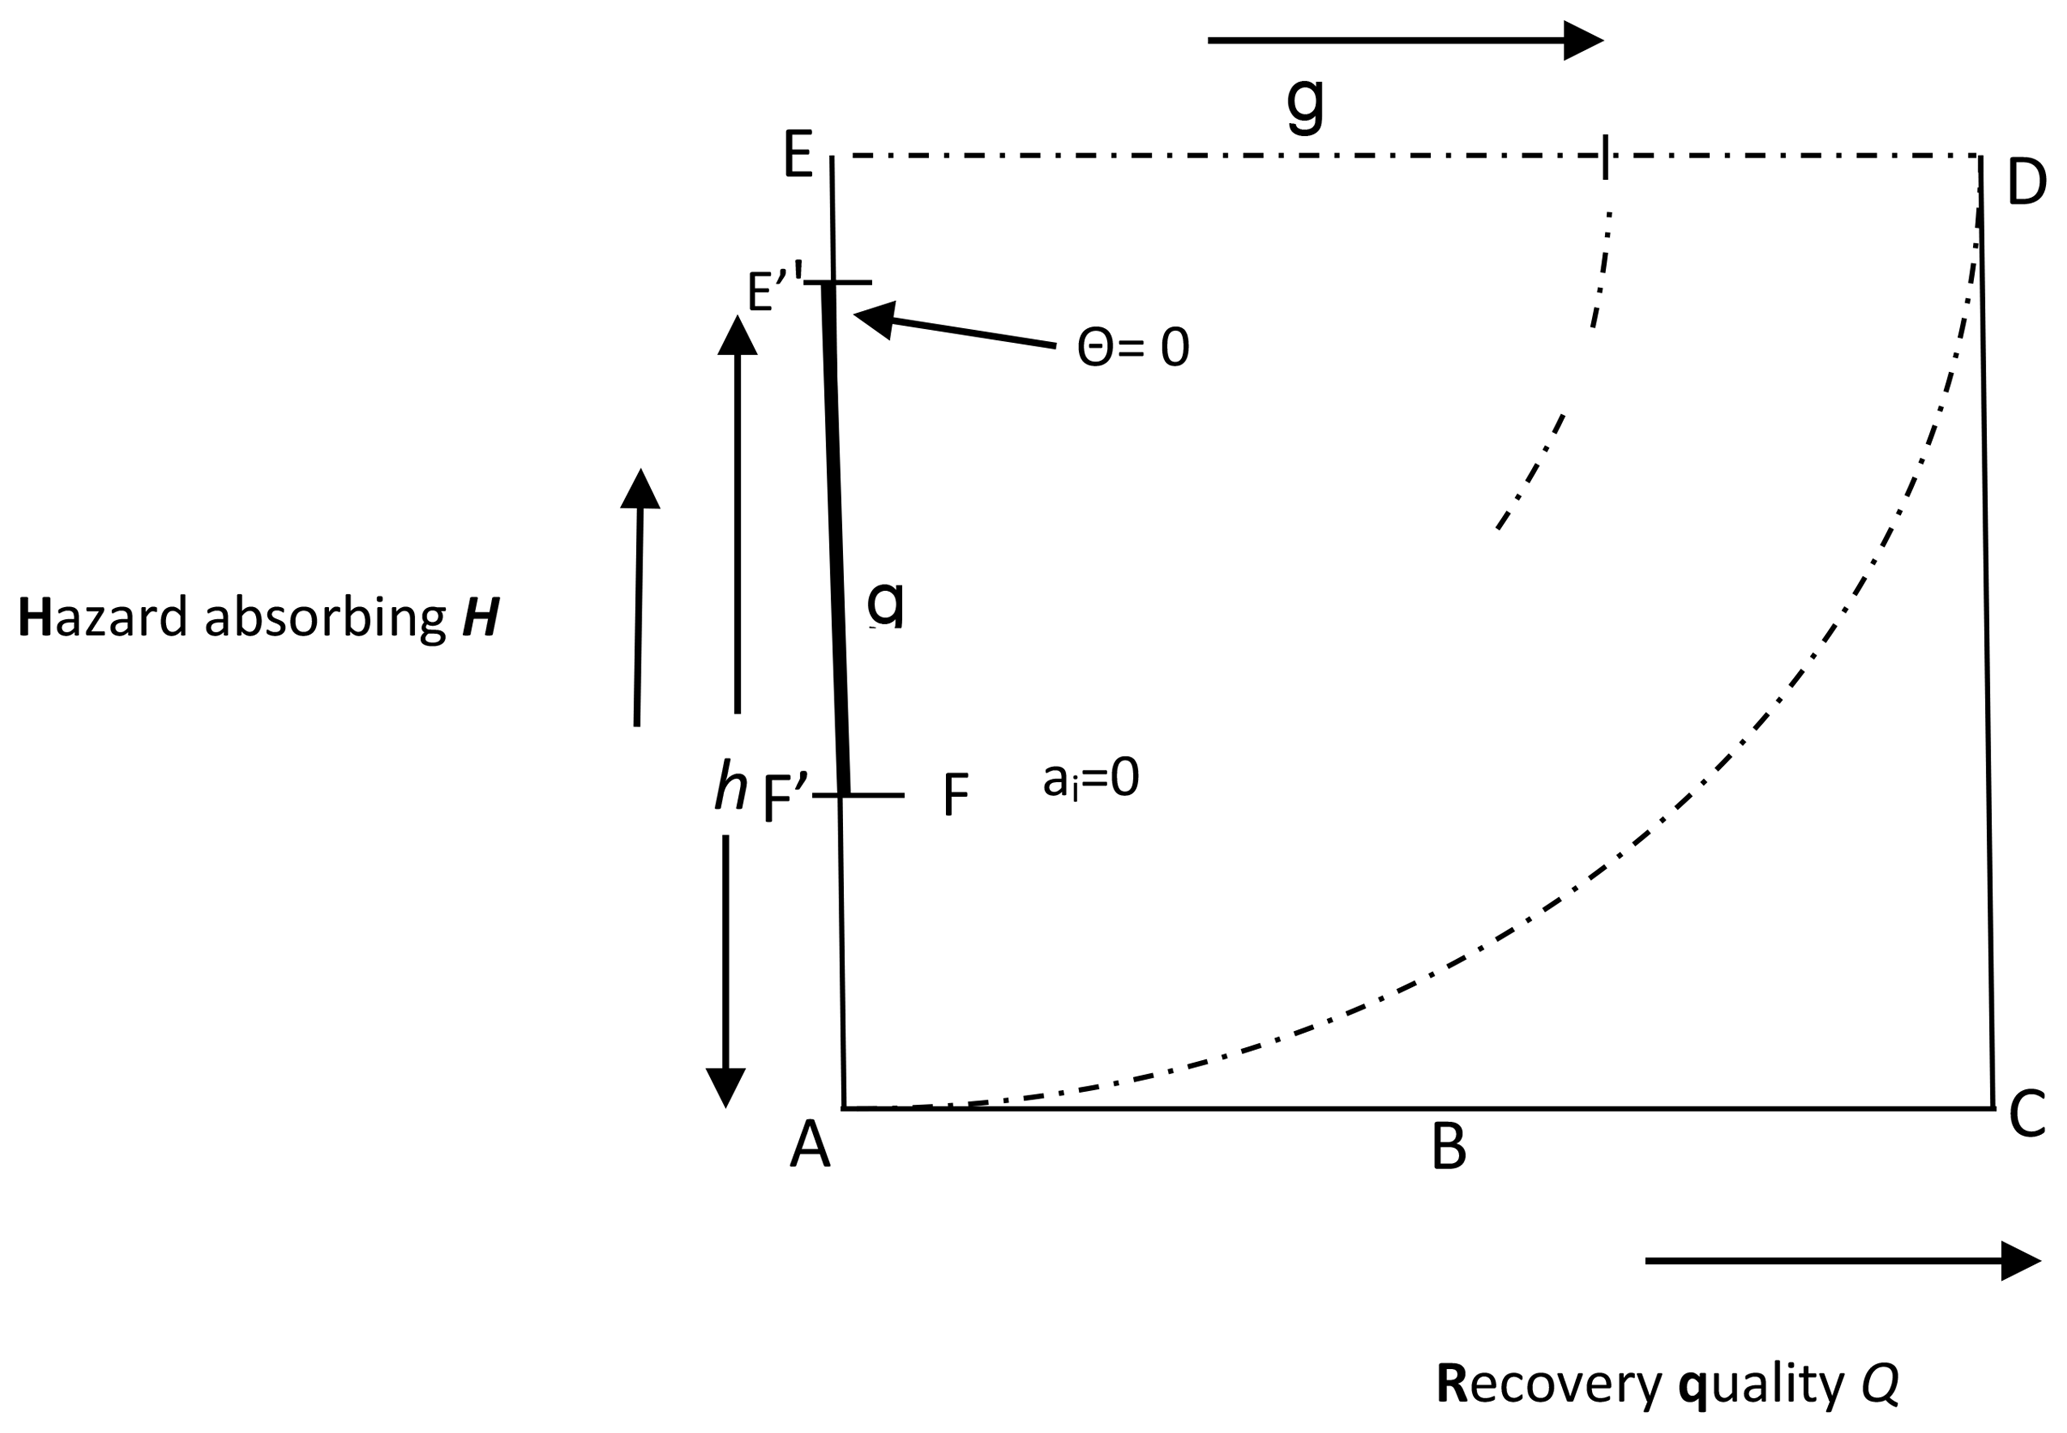
Figure 4Resilience area is 0 when . A variation of model Fig. 3 depicting an extreme case of a community with zero efficiency in resource utilization.
Case 2: As
This implies that or Sinθ=1, which depicts an ideal situation when the communal processes, FRM resource administration and utilization systems are highly efficient and near-perfect. Under this scenario, the resources g and community's coping capacities contribute maximally to resilience (see Fig. 5).
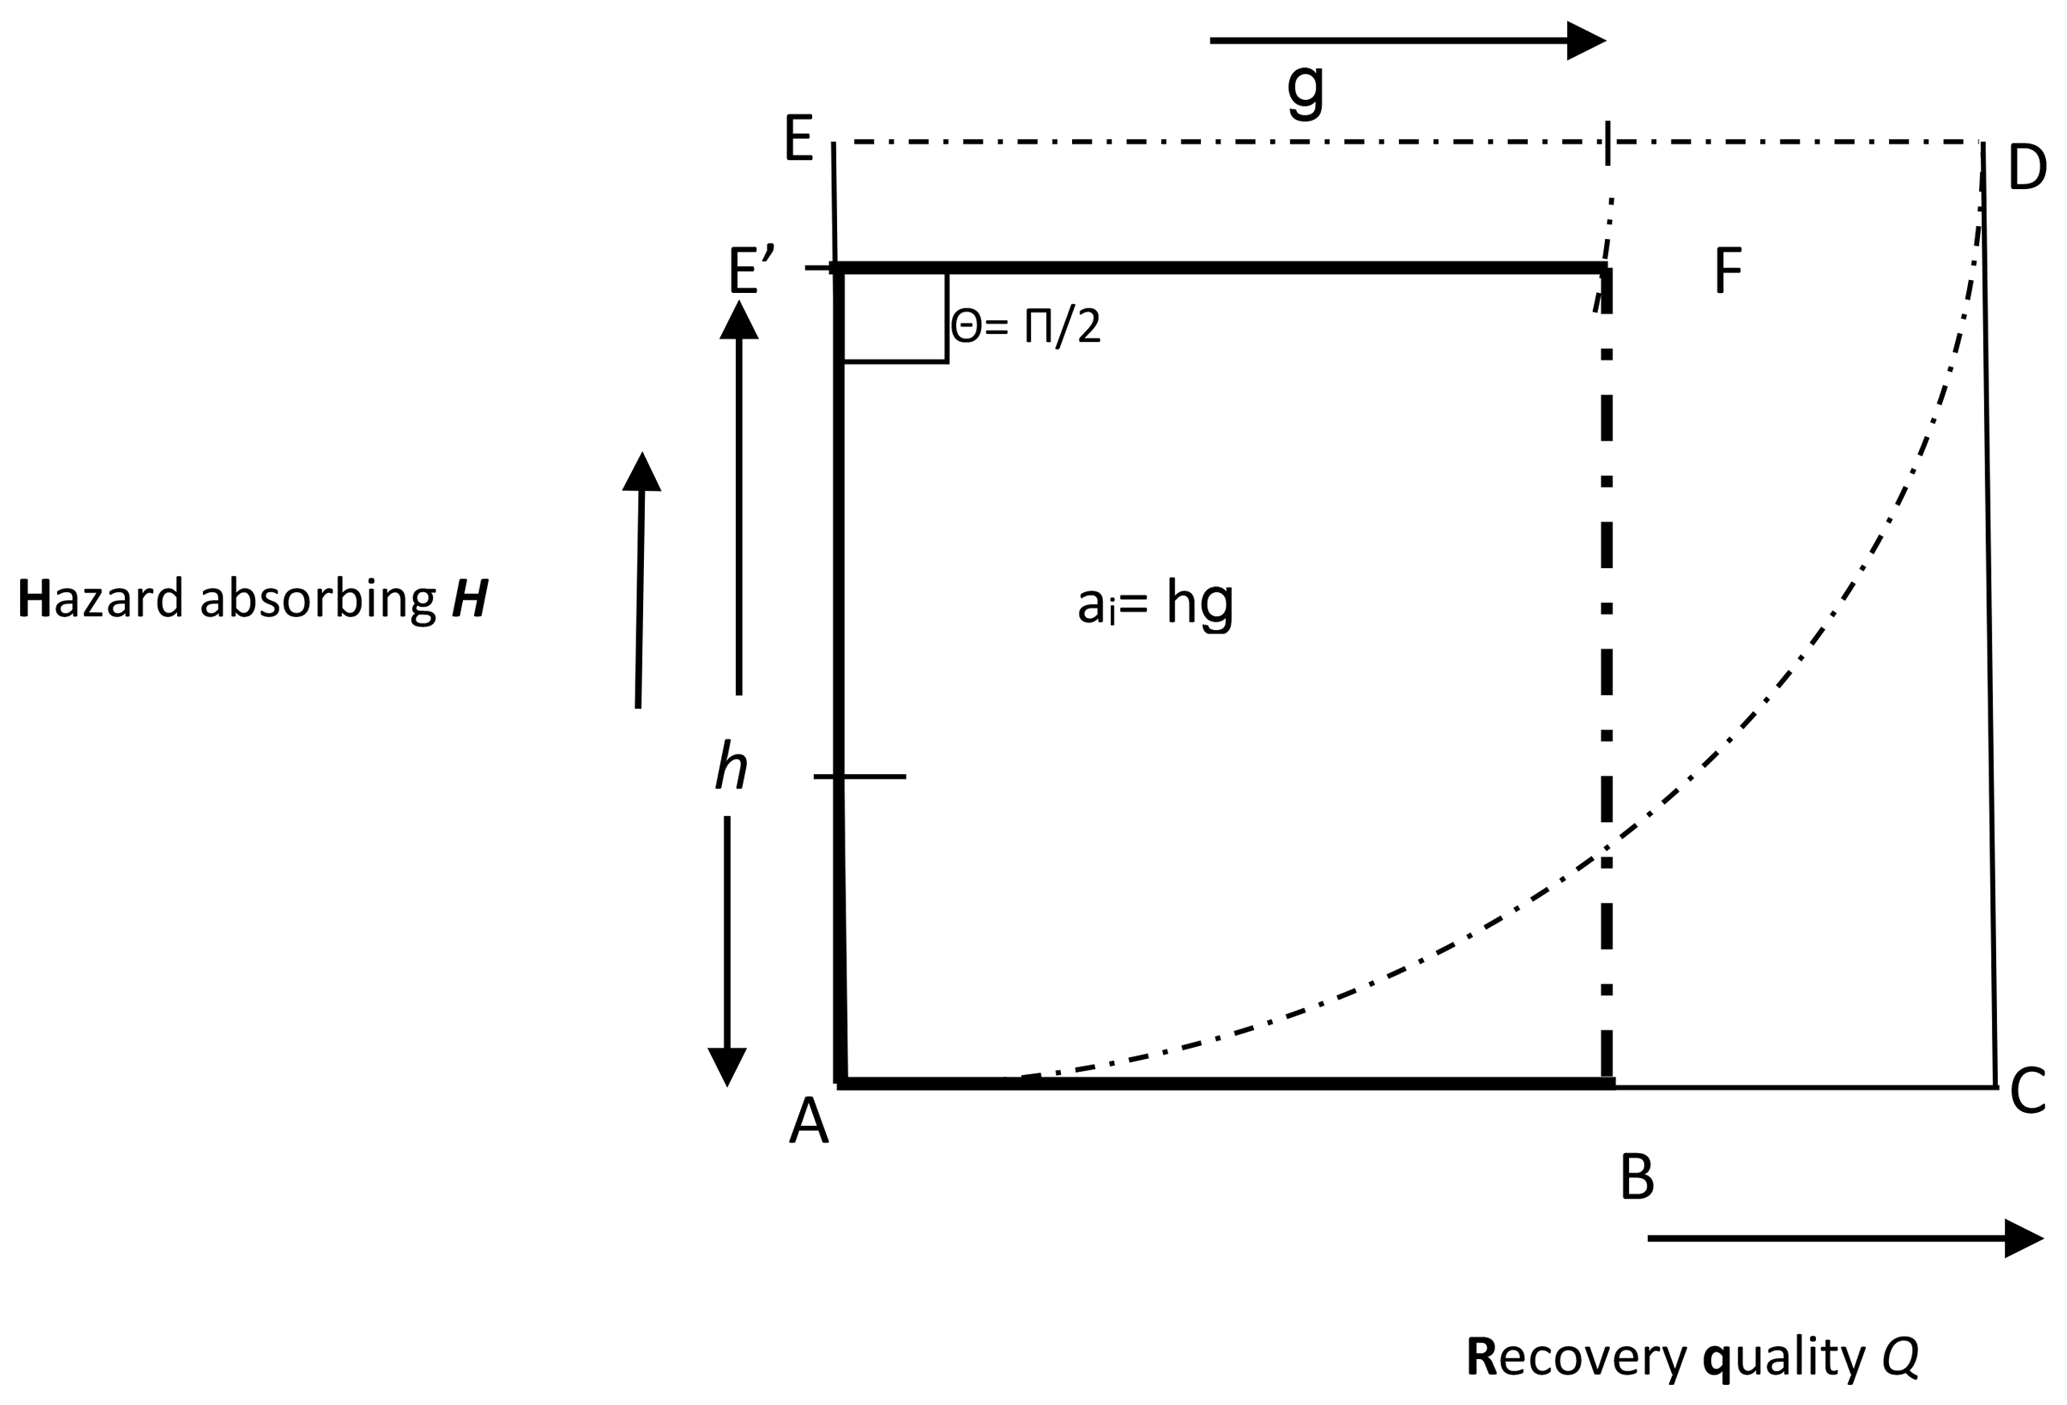
Figure 5Resilience area (ai=hg). A variation of model Fig. 3 depicting an extreme case of a community with a perfect resource utilization system (efficiency of 1.0) which maximizes recovery resources' g on absorbing capacity h.
Case 3:
Resilience disappears when resources dry up.
Case 4: h=1
Resilience is determined by resource availability and utilization.
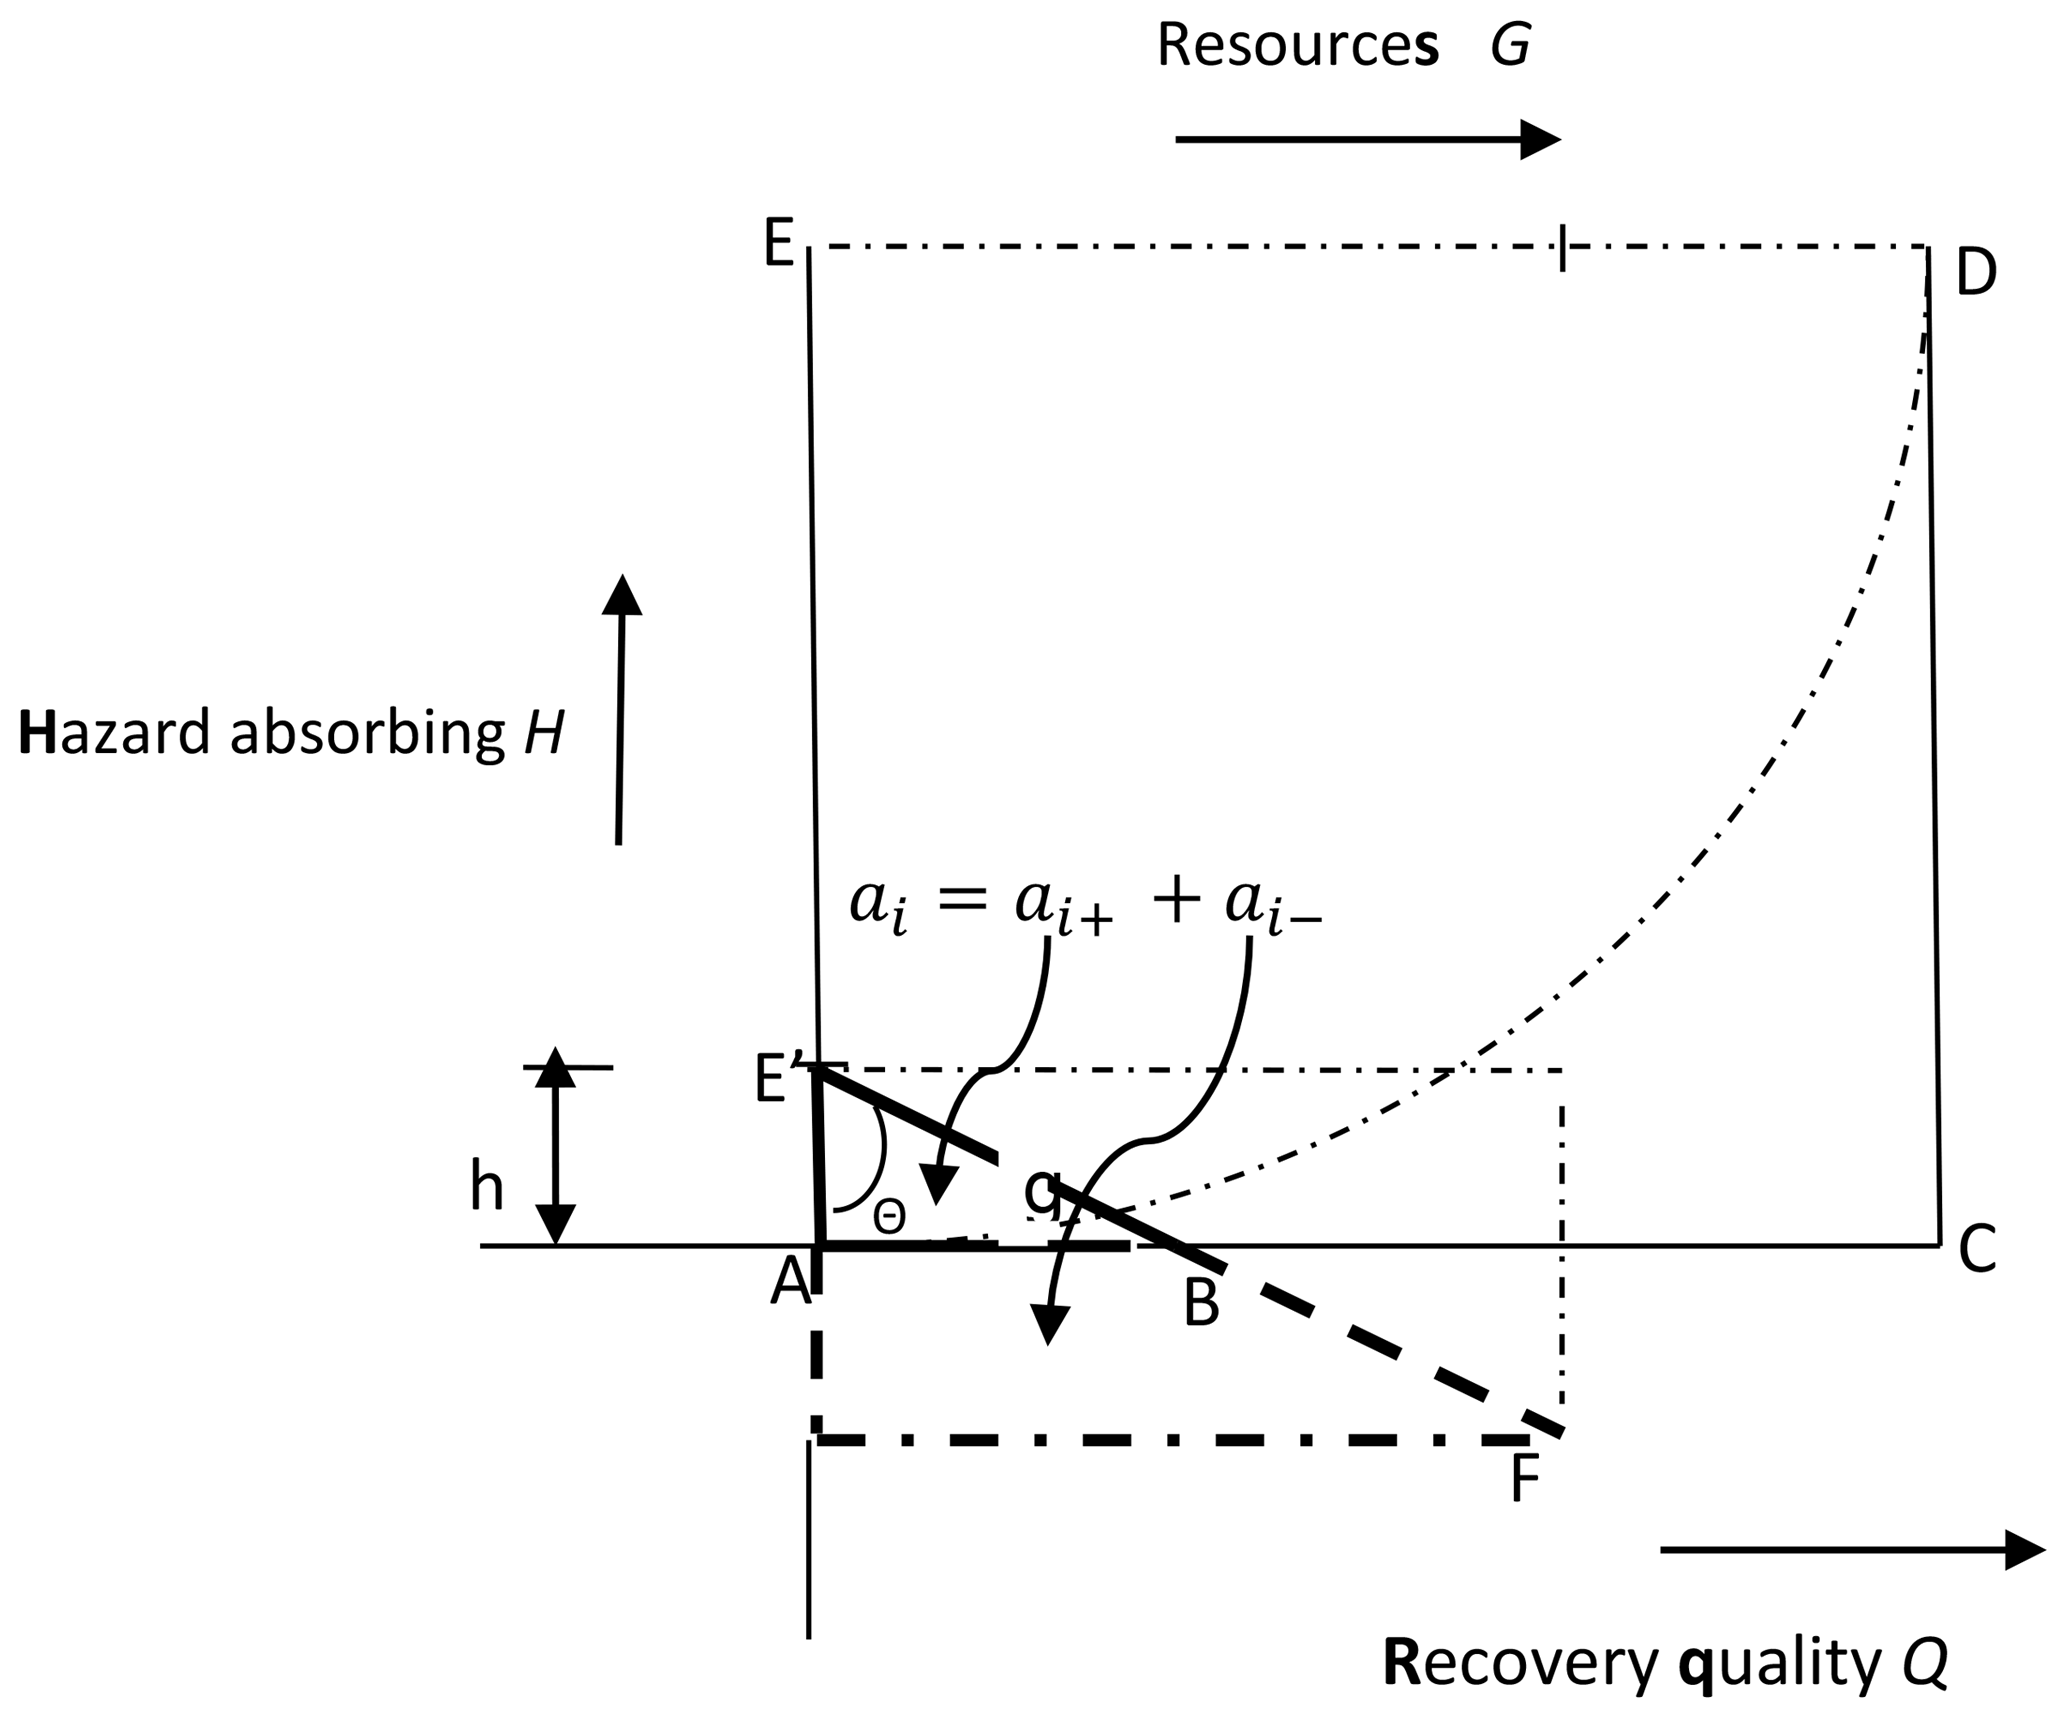
Case 5: As
From Fig. 6, resilience approaches zero from the negative reservoir quadrant when h=0 (i.e., coping and absorbing capacities disappear or collapse) and ρ<1 (efficiencies of resource use, preparedness and governance systems fall below 1). The “negative” resilience reservoir quadrant characterizes vulnerable communities. Note that vulnerability is sometimes seen as the flip side of resilience (Folke et al., 2002) or a complementary community-hazard management concept (Cutter, 2018; Fekete and Montz, 2018; Shah et al., 2018). Hence from Fig. 6 as the absorbing/coping capacity h approaches zero, a community enters vulnerability mode because more resilience area lies below the positive plane. In other words, Eq. (9) suggests that a community without coping or built-in absorbing capacities is vulnerable, especially if its governance structure is poor (i.e., Sinθ→0).
While the resulting model of Eq. (9) provides useful insights, its application however is premised on the availability of clear information on input factors and adequate data for estimating model parameters, that is, complete data as described in Sect. 2.2 and Table 1, for estimating dimensions H, G and θ. However, there are issues of data availability and data compatibility (Parsons et al., 2016) which make it inefficient to do crisp estimation of these parameters. Therefore, to operationalize the proposed framework, a (FIS) equivalent has been developed.
A computer model of the proposed R-FIS (Fig. 7) was designed in the MATLAB fuzzy logic development environment. The environment was adopted because it supports easy-to-use graphical user interface (GUI) tools and has multiple MFs for implementing a FIS. A process consisting of a systematic review of the literature, interactions with experts, meetings with community leaders, interviews of other stakeholders and field observations (described in more detail in Sect. 4.1) was used to gain insights for specifying the R-FIS's design and inference engine's elements (Table 2) as well as determine appropriate IF THEN statements for the rule base (Table 3). With three input linguistic variables, each with three term sets (or possible values), there can be up to 27 explicit input variable combinations or 27 explicit fuzzy rule combinations. Table 3 is a sample extract from the 27 IF THEN statements of the rule base.
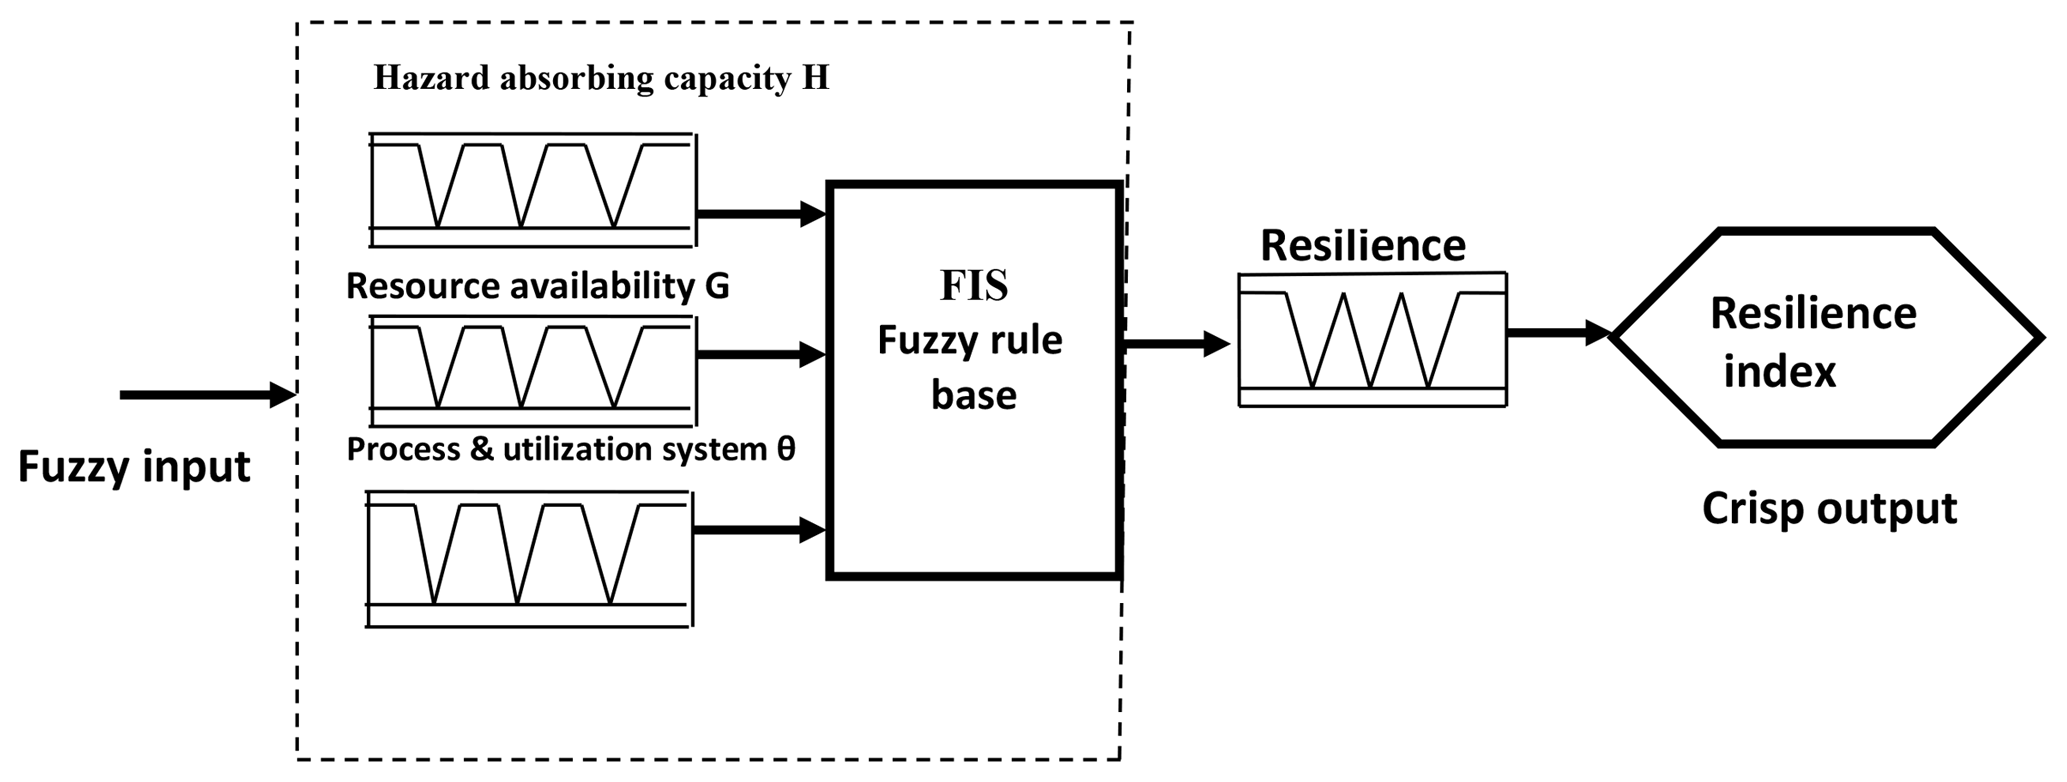
Table 2Fuzzy inference linguistic variables term sets and membership functions (Adnan et al., 2015; Oladokun and Emmanuel, 2014).
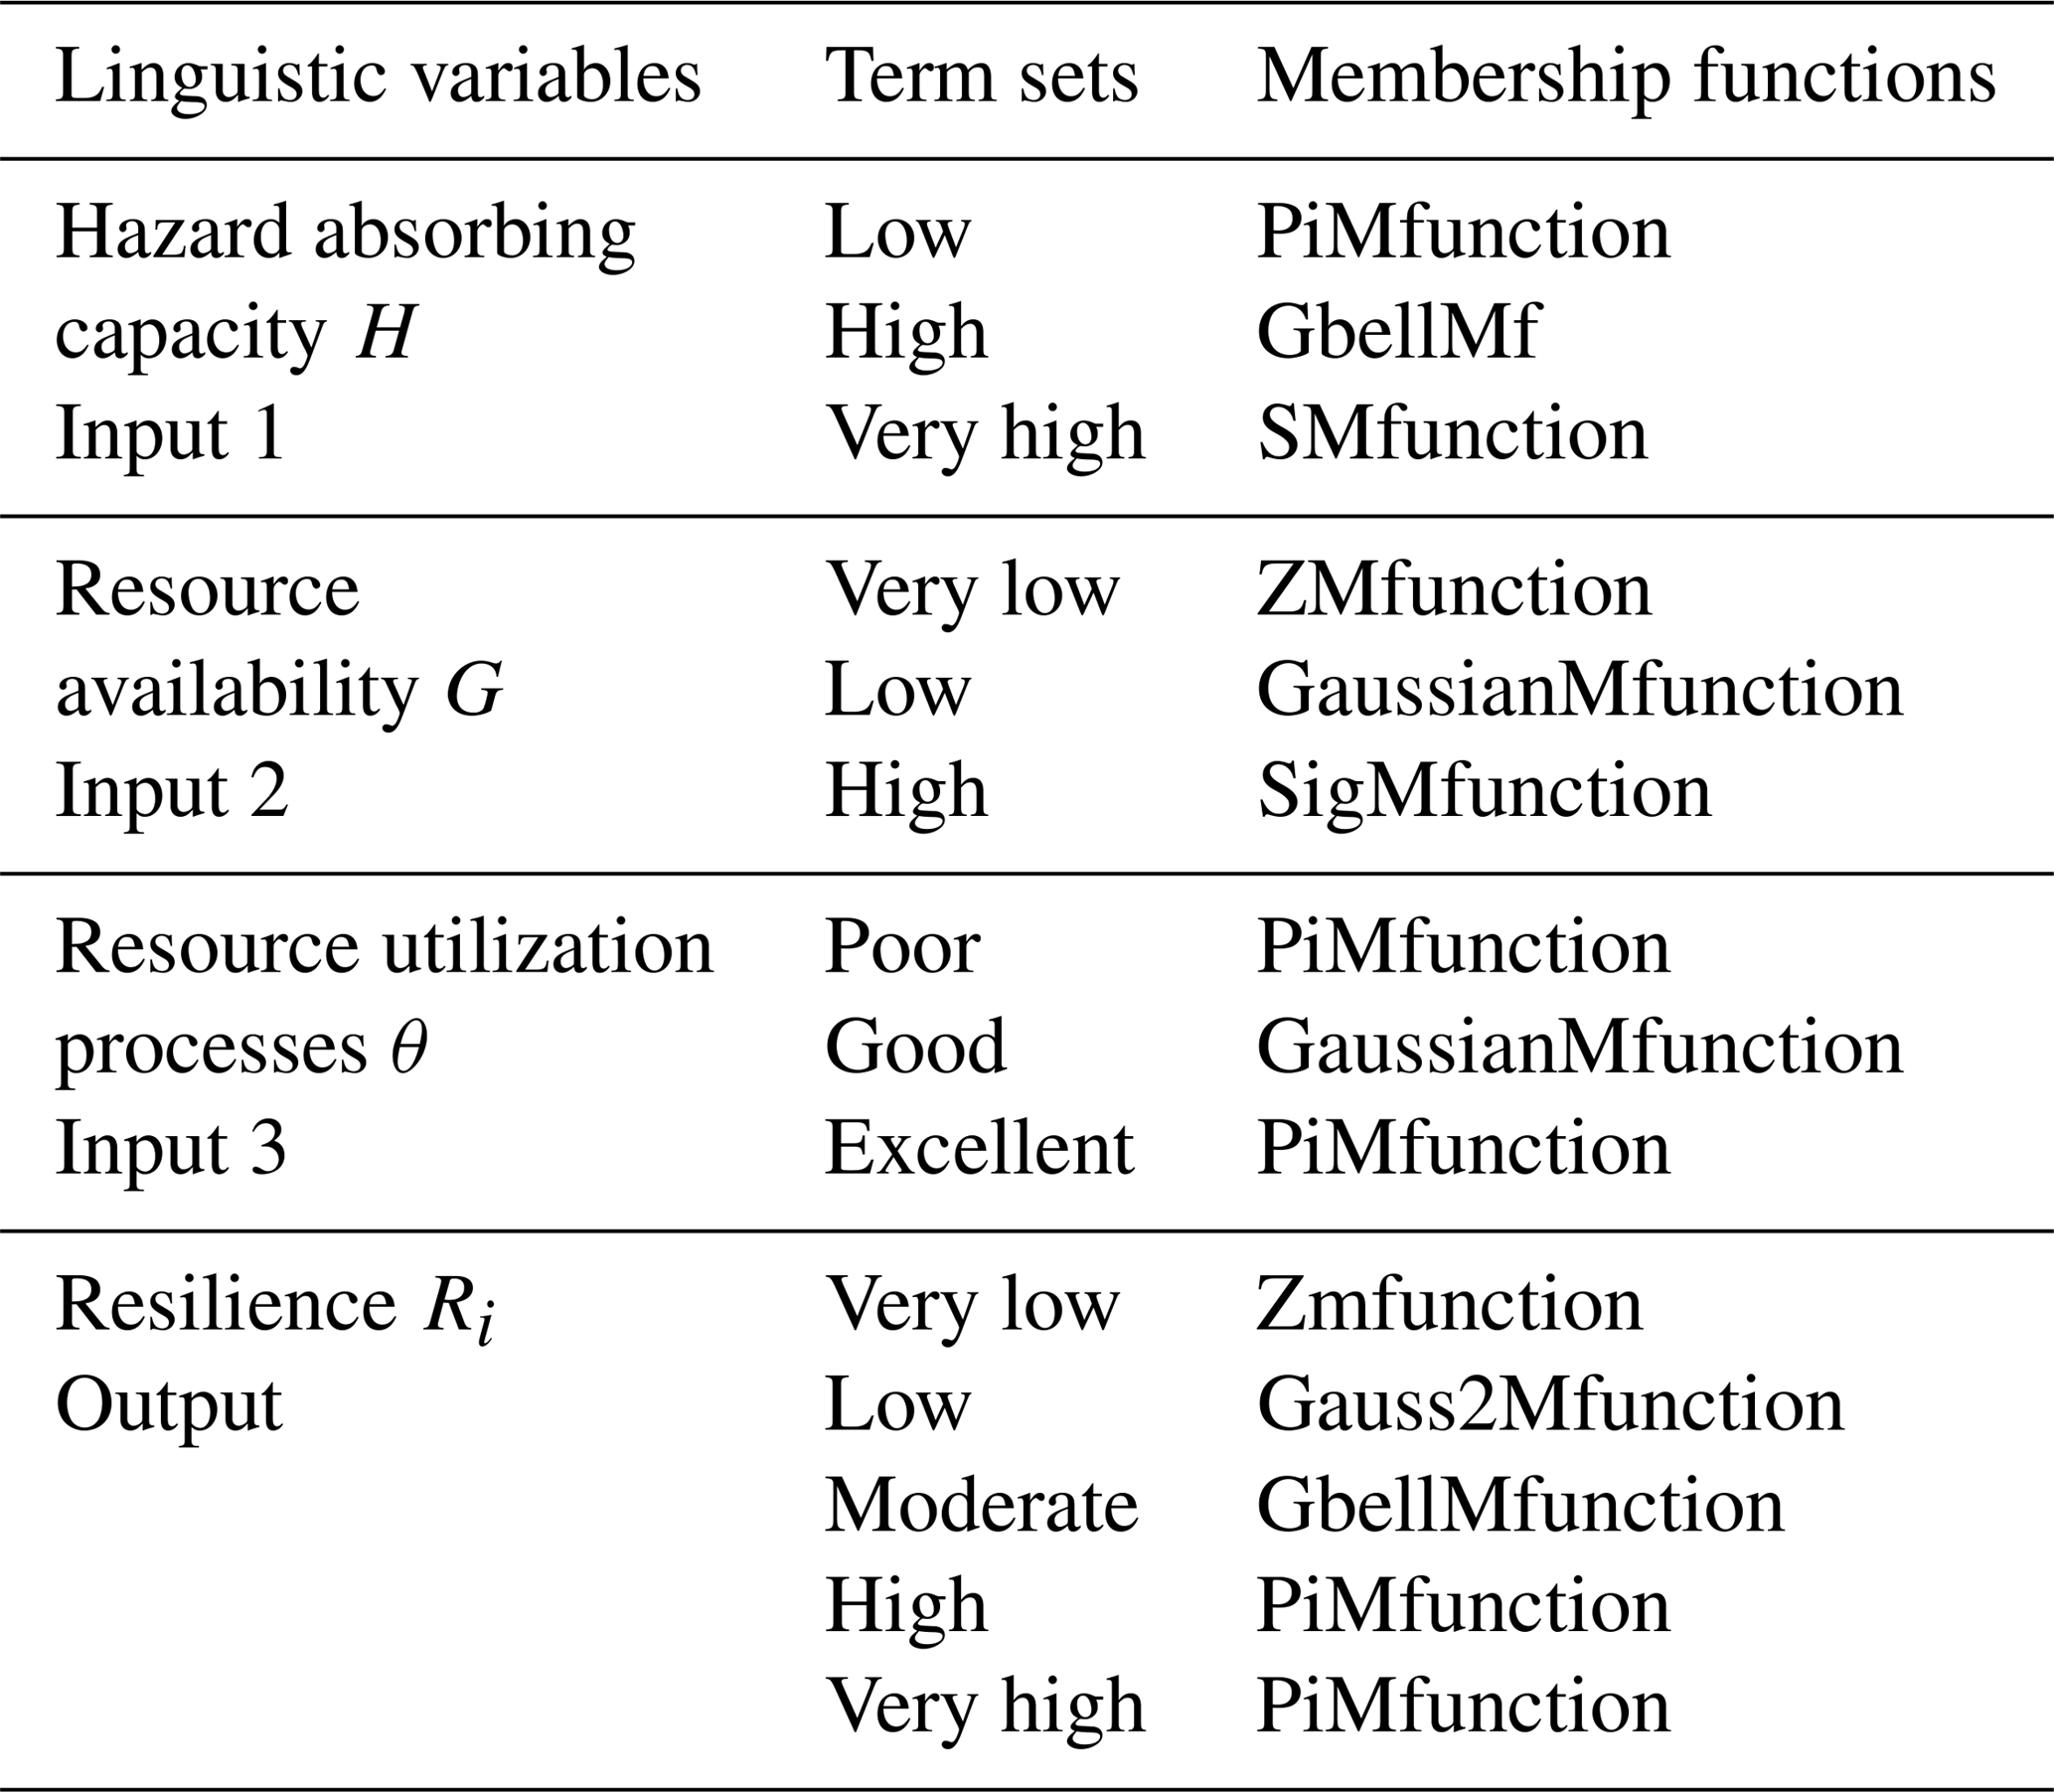
Table 3Sample rules of the R-FIS 27 rule base (rules and weights to be determined by experts and/or stakeholders).
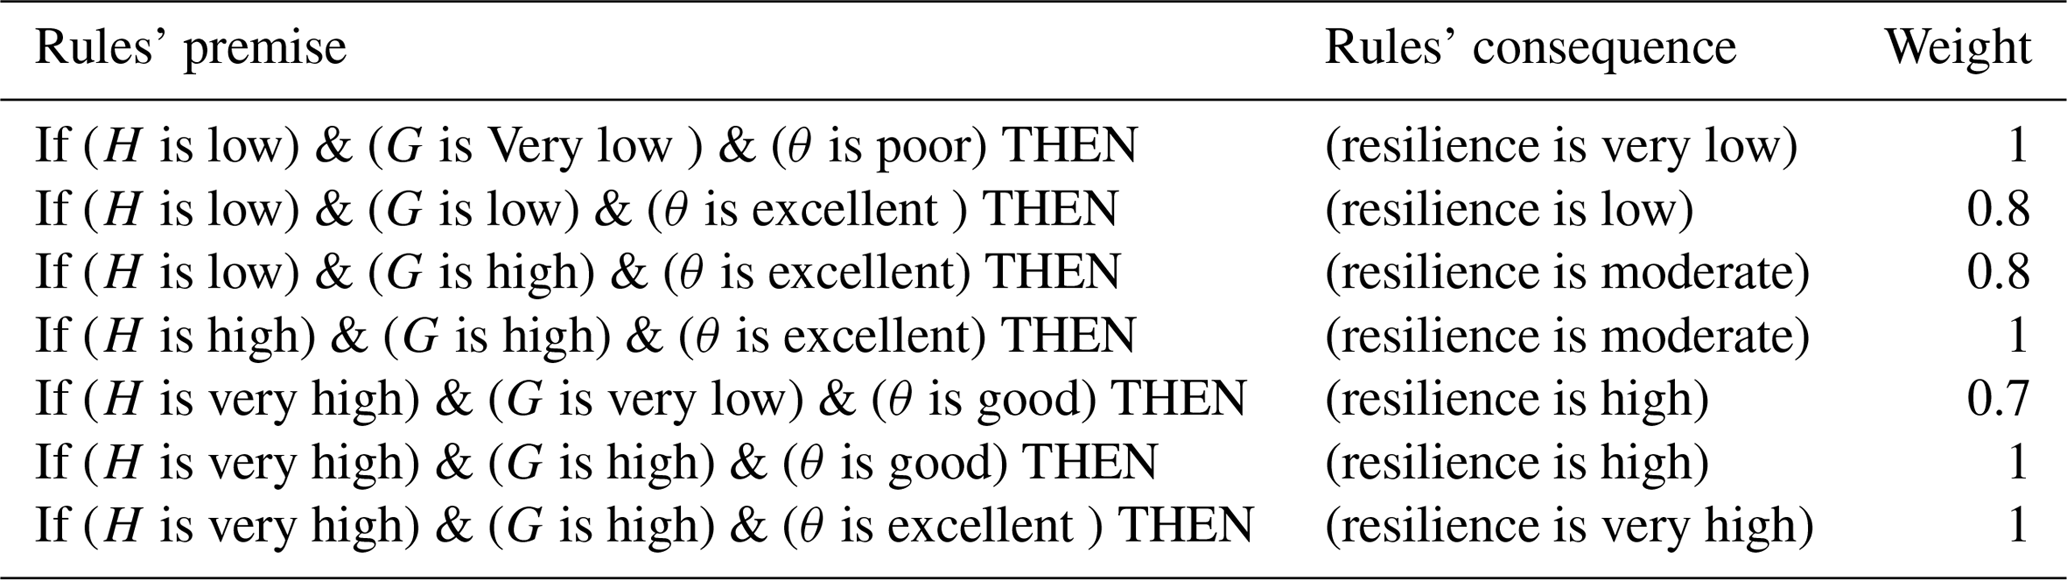
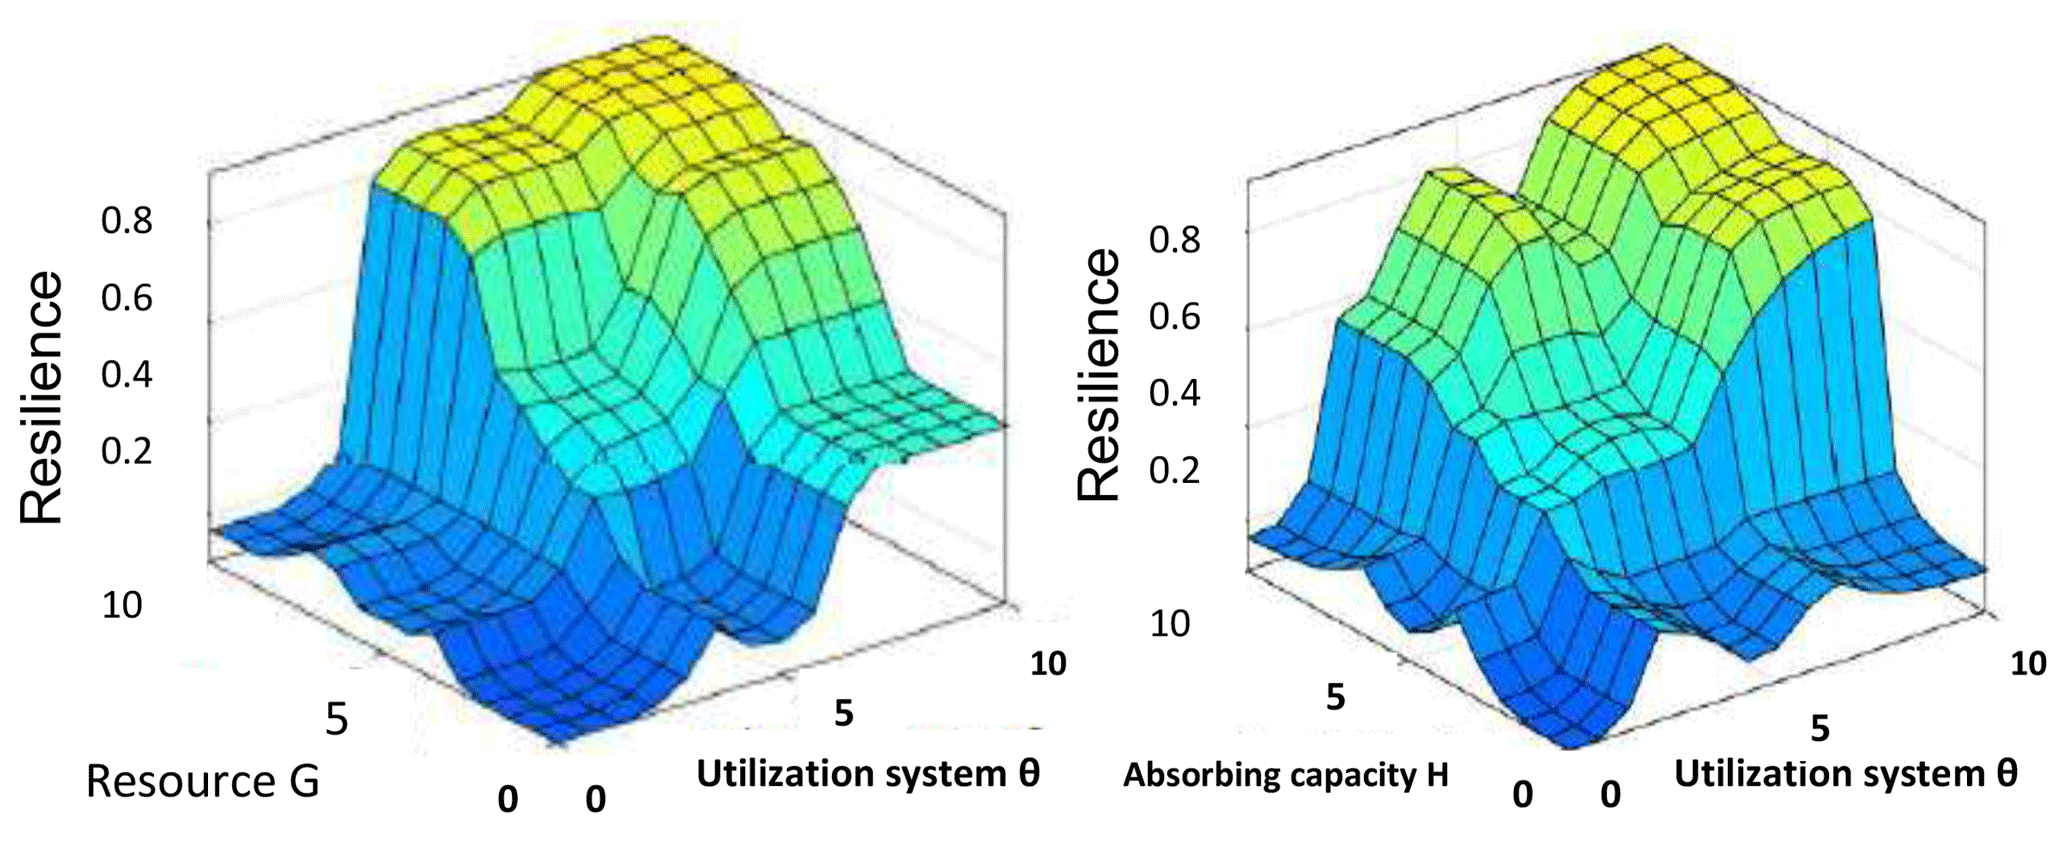
Figure 8 shows the 3-D surface plot resulting from an infinite combination of input factors. The shape of the resilience surface is determined by the rules (Table 3) and the selected membership functions (Table 2) used to express the term sets. This shape can be varied by modifying the membership functions, the term sets, the rules and their weights to reflect new realities and understandings about the resilience systems. This gives flexibility to simulate various combinations of parameters in order to arrive at an optimum design.
3.1 Model expert scoring framework
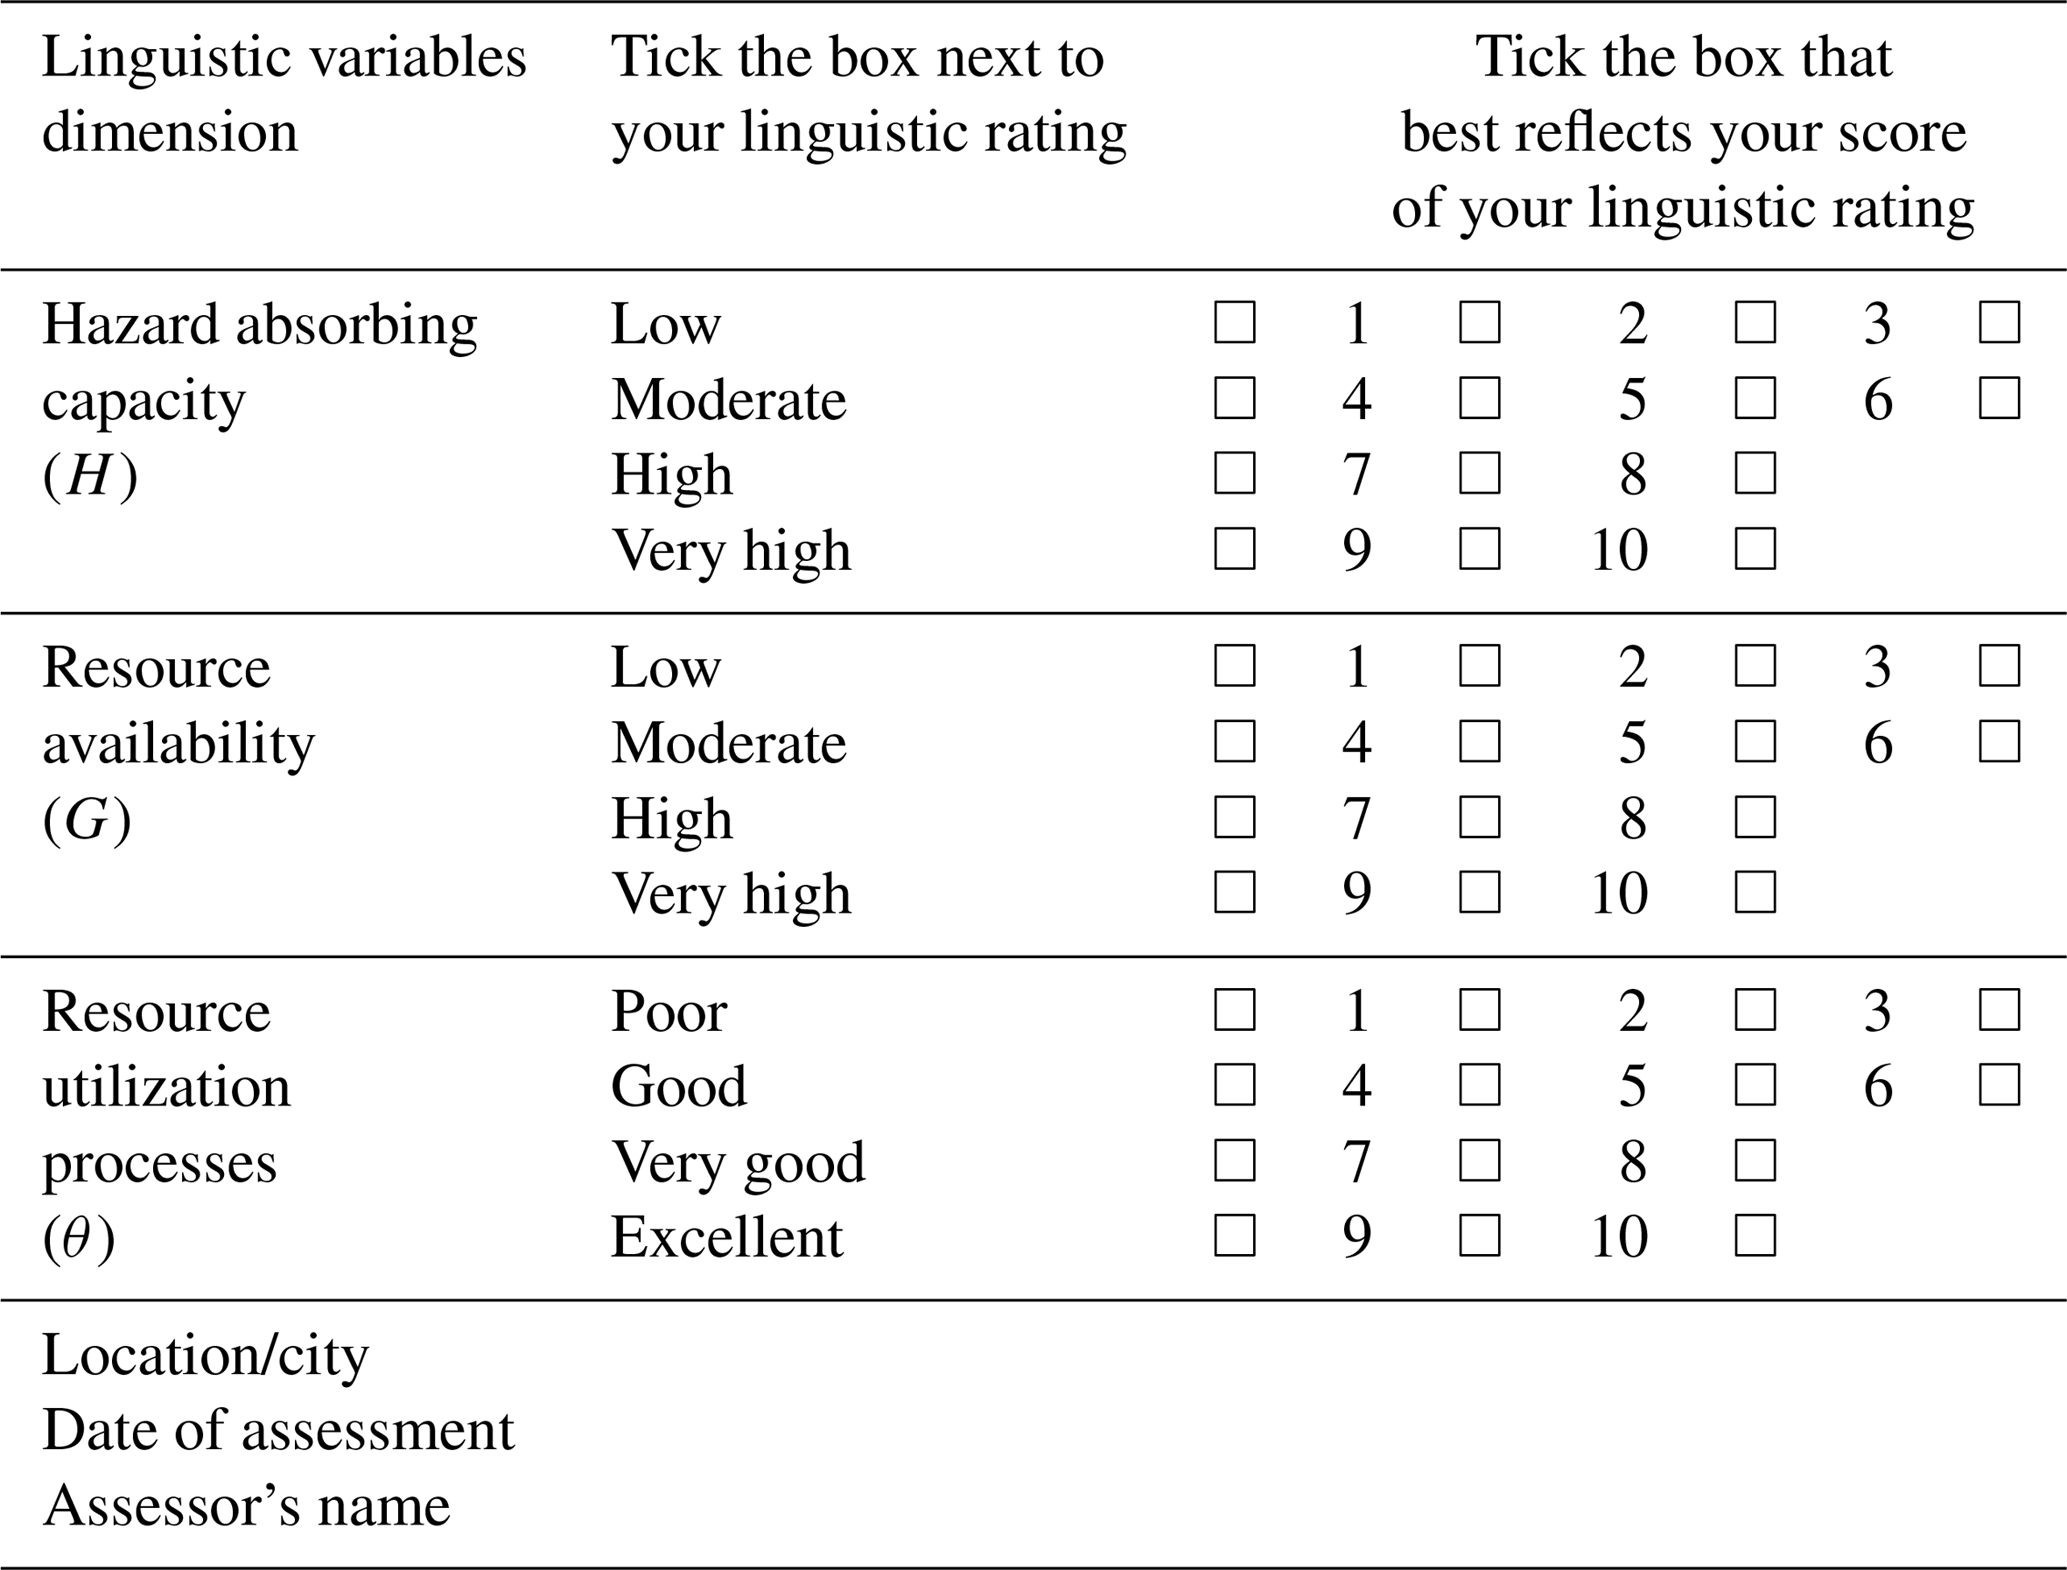
Although information and explanations in Table 1, in principle, give a general guide for evaluating and quantifying these dimensional inputs of the resilience model, there is still the need for an easy-to-use operational template for capturing experts' input into the FIS in a relatively standardized fashion. Table 4 is an example of such an input template designed for this study. A typical application procedure is described in Sect. 4.1 with the case study communities.
Table 4Linguistic variables input template (to be used with Table 1 as a scoring guide).
The following describes the application of the model using three flood-prone communities in the United States. Following decades of experience in dealing with hazards and disasters, cities and institutions in the United States offer considerable information and insights in community resilience systems management (Su, 2016b). The two coastal states of North Carolina and Virginia are home to many flood-prone communities of various sizes with diverse socioeconomic and techno-ecological characteristics that readily lend themselves to a study of resilience. Both states have adopted a number of FRM programs, policies and strategies for building flood resilience across many rural and urban communities (North Carolina NC Flood Mapping Program, 2019; Mogollón et al., 2016). Specifically, Norfolk, VA, a coastal city in Virginia with a massive naval base, Greenville, NC, a large university town, and Windsor, NC, a small riverine rural town, were selected (Fig. 9). Table 5 summarizes some vital socioeconomic features of these communities.
Table 5Study locations – demographic and topographic summary.
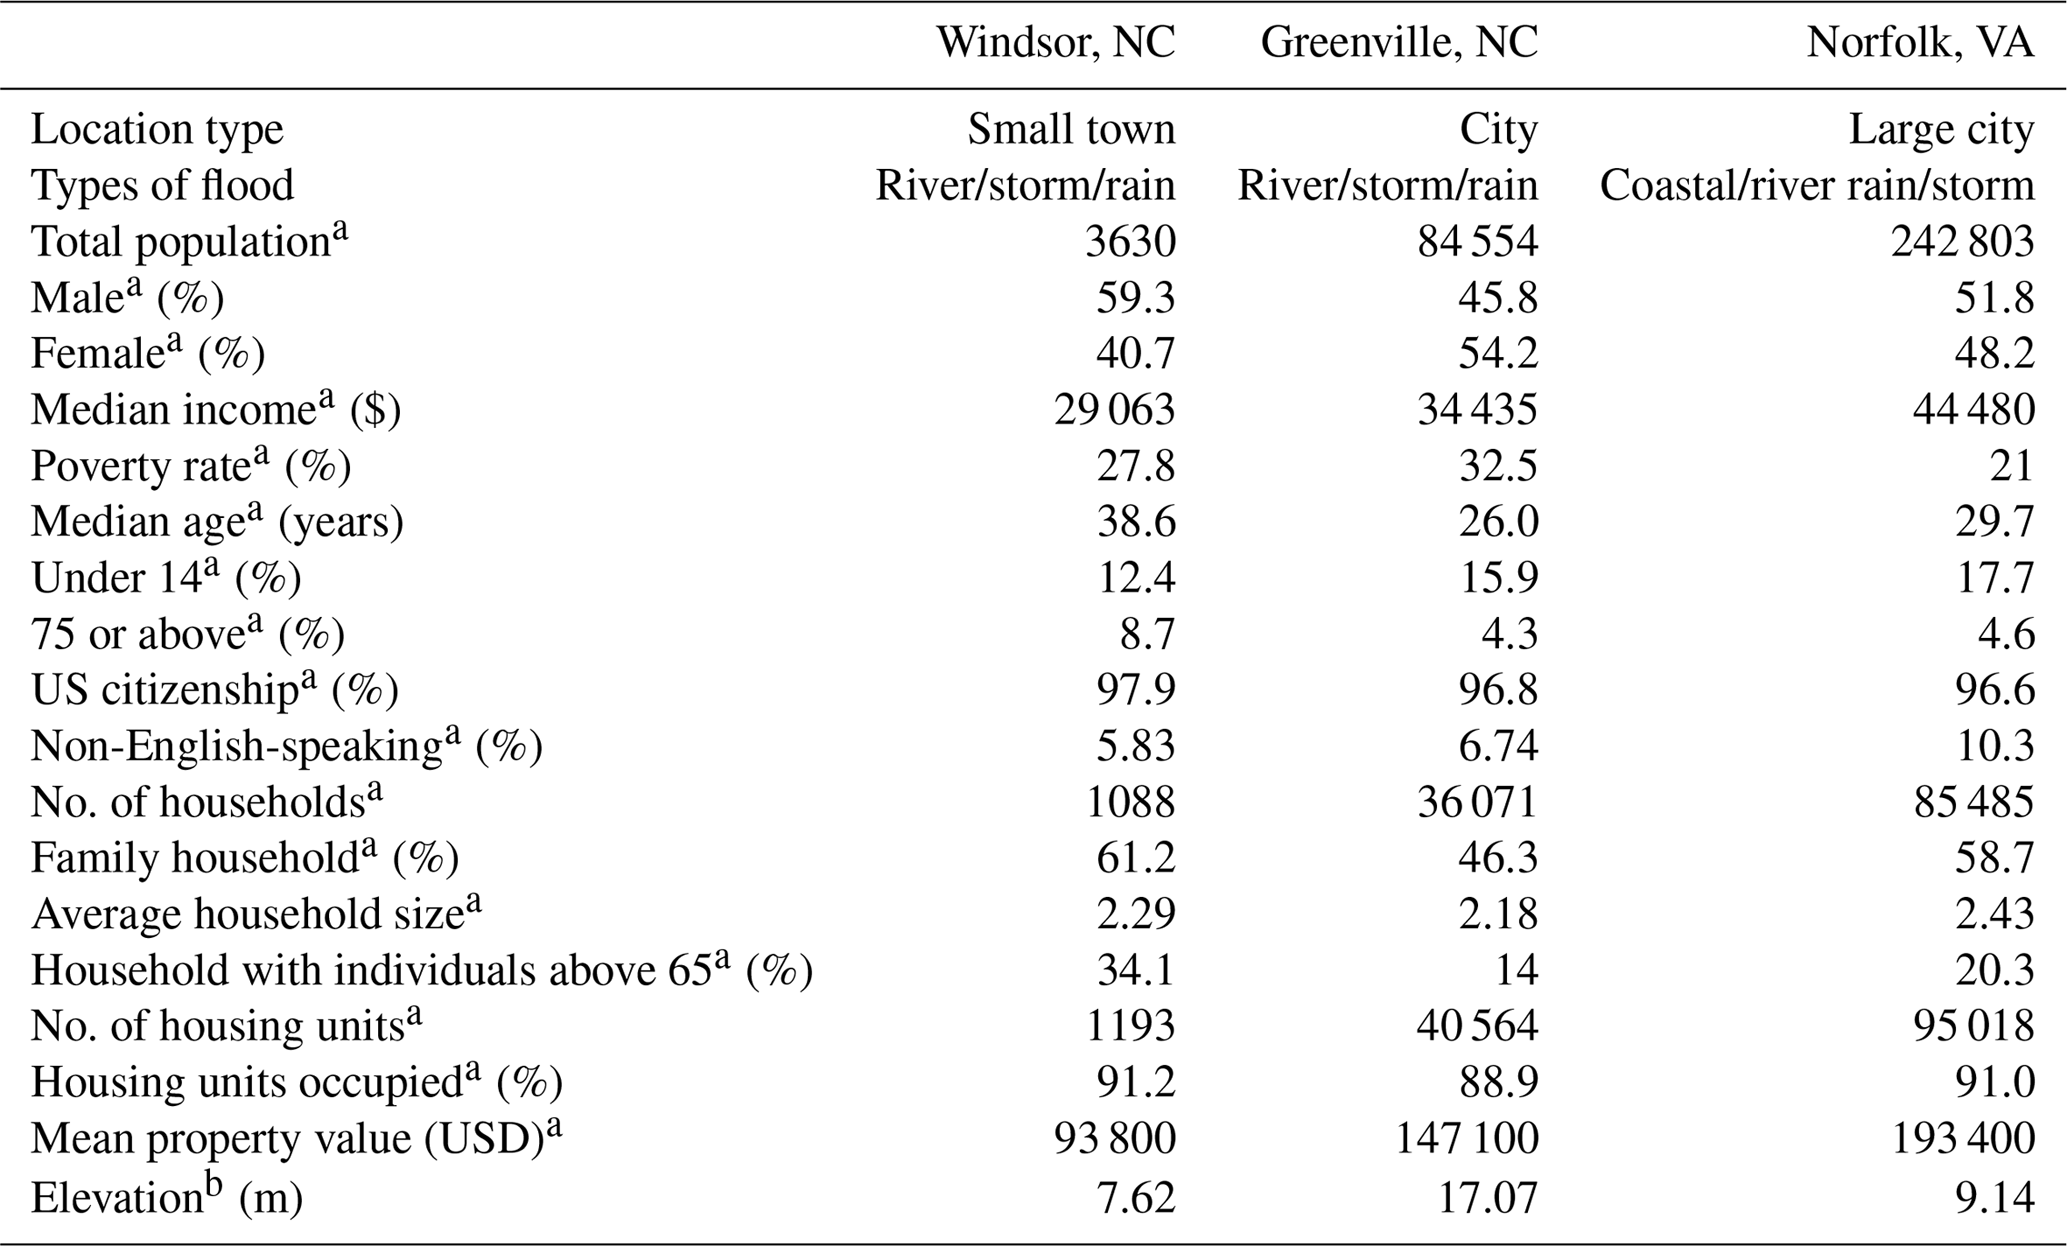
a Source: http://census.gov, last access: 27 May 2019. b United States Geological Survey Topographic Maps.
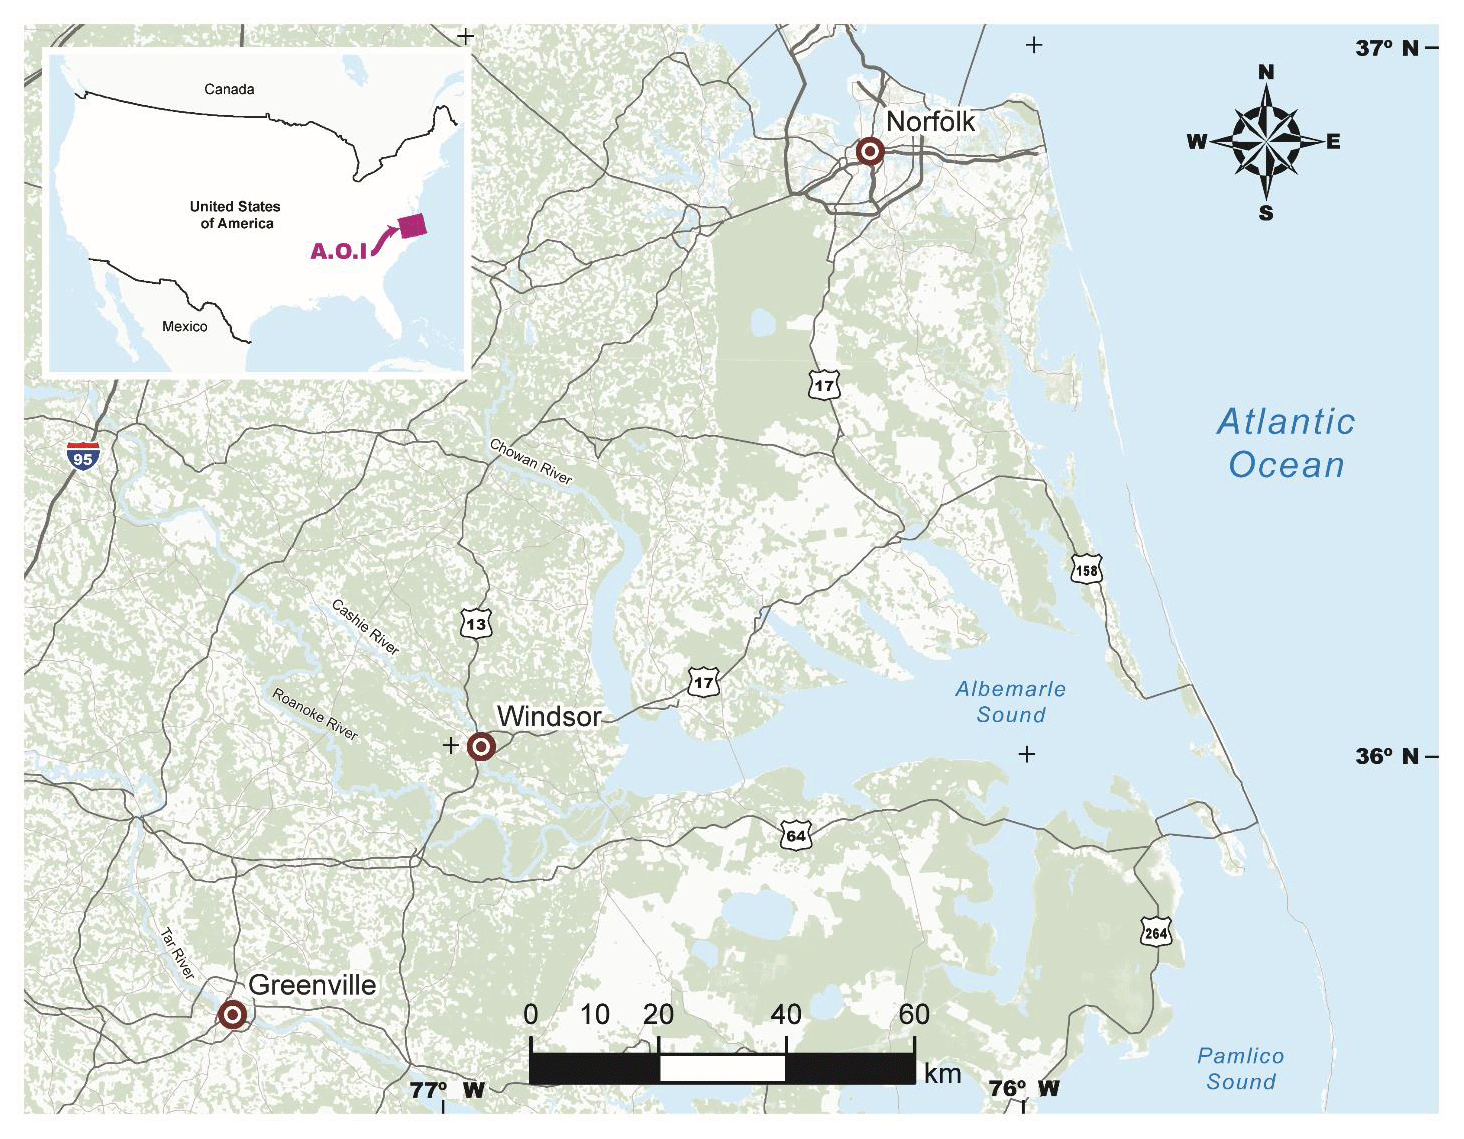
Figure 9The study area on map showing Greenville, NC, Windsor, NC, and Norfolk, VA. Source: produced in the GIScience Center, East Carolina University.
Norfolk, located on the Chesapeake Bay and near several rivers, experiences precipitation flooding when the intensity of rainfall exceeds storm water drainage capacity, storm flooding from hurricanes and nor'easters and tidal flooding due to its elevation and coastal location. Greenville, with relatively flat topography, is located on the Tar River and is traversed by a number of small streams (Pitt County Development Commission, 2019). Besides riverine flooding, the relatively flat topography of its coastal plain location leads to flooding from intense or long-lasting rain events such that the storm water system is incapable of handling the overland flow. Located on the meandering Cashie River in eastern North Carolina, Windsor has experienced four major floods since 1999, all from tropical storms. Thus, not only are the communities different demographically, but they have rather different flood regimes and histories, with Windsor and Greenville experiencing riverine flooding, though with very different patterns of damage, and Norfolk experiencing a combination of coastal and riverine flooding.
4.1 Model application: data gathering and results
For the purpose of illustration, input scores were developed using the template shown in Table 4 along with the guidelines in Table 1 and the communities' information, summarized in Table 5. The sample input data were generated based on the outcome of field studies and reflective interactions with experts and stakeholders familiar with the study locations; these stakeholders include academics, government officials and community leaders. In particular the sample scoring was based on the insights derived from our understanding of their opinions, as well as demographic and socioeconomic information extracted from various historical and government records, including the US census (Pitt County Development Commission, 2019; North Carolina NC Flood Mapping Program, 2019; Mogollón et al., 2016; US Census Bureau, 2019). For instance, during a 2018 workshop by the North Carolina Chapter of the American Planning Association held at Windsor, NC, the authors had the opportunity to interact with and mine the knowledge of academics, students, city managers, community leaders, relevant officials from emergency agencies and curators of landmark centers, among others. The authors also took tours of Norfolk, VA, and Greenville, NC, under the guidance of academics, GIS and FRM experts from the cities' universities. These interactions and the associated field studies provided insights for generating the sample scoring; the studies involved interviews and qualitative assessment from site observations of community flood control projects and individual property FRM retrofit systems. As an example, the perceptions of resident planning experts and other stakeholders on how some ongoing flood risk management interventions would have impacted the capacity of the community to cope with varying flood levels were useful in classifying hazard absorbing capacity, as were the extent and type of flood control and retrofit projects.
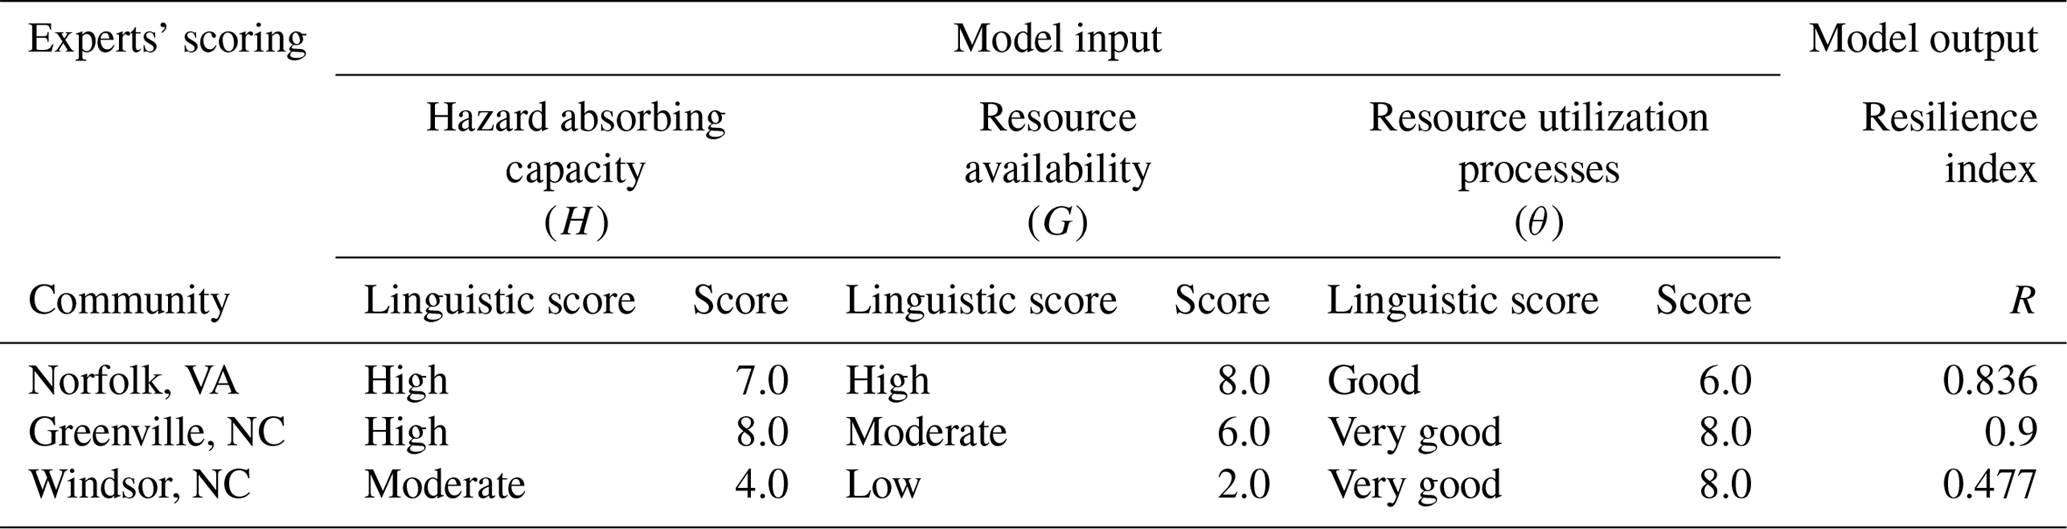
Table 6 shows the results. Norfolk and Greenville both have relatively high hazard absorbing capacities, with Norfolk rated as slightly lower owing to problems associated with the disruption that regularly occurs from overland flooding combined with tidal flooding. Windsor's is lower than Norfolk and Greenville but still moderate because of how the community has adapted to its flood risk. Not surprisingly, Norfolk has the highest resource availability and Windsor the lowest based on their size and relative wealth. At the same time, for the illustrative purposes here, size and diversity of the communities are seen to be inversely related to resource utilization processes. The model output, resilience index R, indicates that, based on the input values, Greenville's resilience is slightly greater than Norfolk's, while, not surprisingly, Windsor lags rather far behind.
The input to output mapping implemented in the MATLAB fuzzy toolbox allows for infinite combinations of input factors either by sliding or inputting the respective input variable axis on the fuzzy rule interface. Figure 10 is a snapshot of the input combinations for Greenville, using the scores from Table 6. The vertical bar (red line on each) can be moved to indicate how resilience changes with a change in one or another (or all) of the three variables. The yellow shapes indicate the rules (see the subset in Table 2) that contribute to each variable's score. All of the output, in both Table 6 and Fig. 8, is based on expert insights and understandings and thus provides a dynamic template to measure resilience under different conditions. The proposed framework accommodates the understanding that community resilience should be treated as a multifaceted and multidimensional construct that can only be achieved by focusing on all aspects of a community system. While the fuzzy implementation of the framework can be used both as a resilience index tool and a resilience classification scheme, it is however, like many existing resilience measuring models, still dependent on the subjective opinions of experts and other stakeholders.
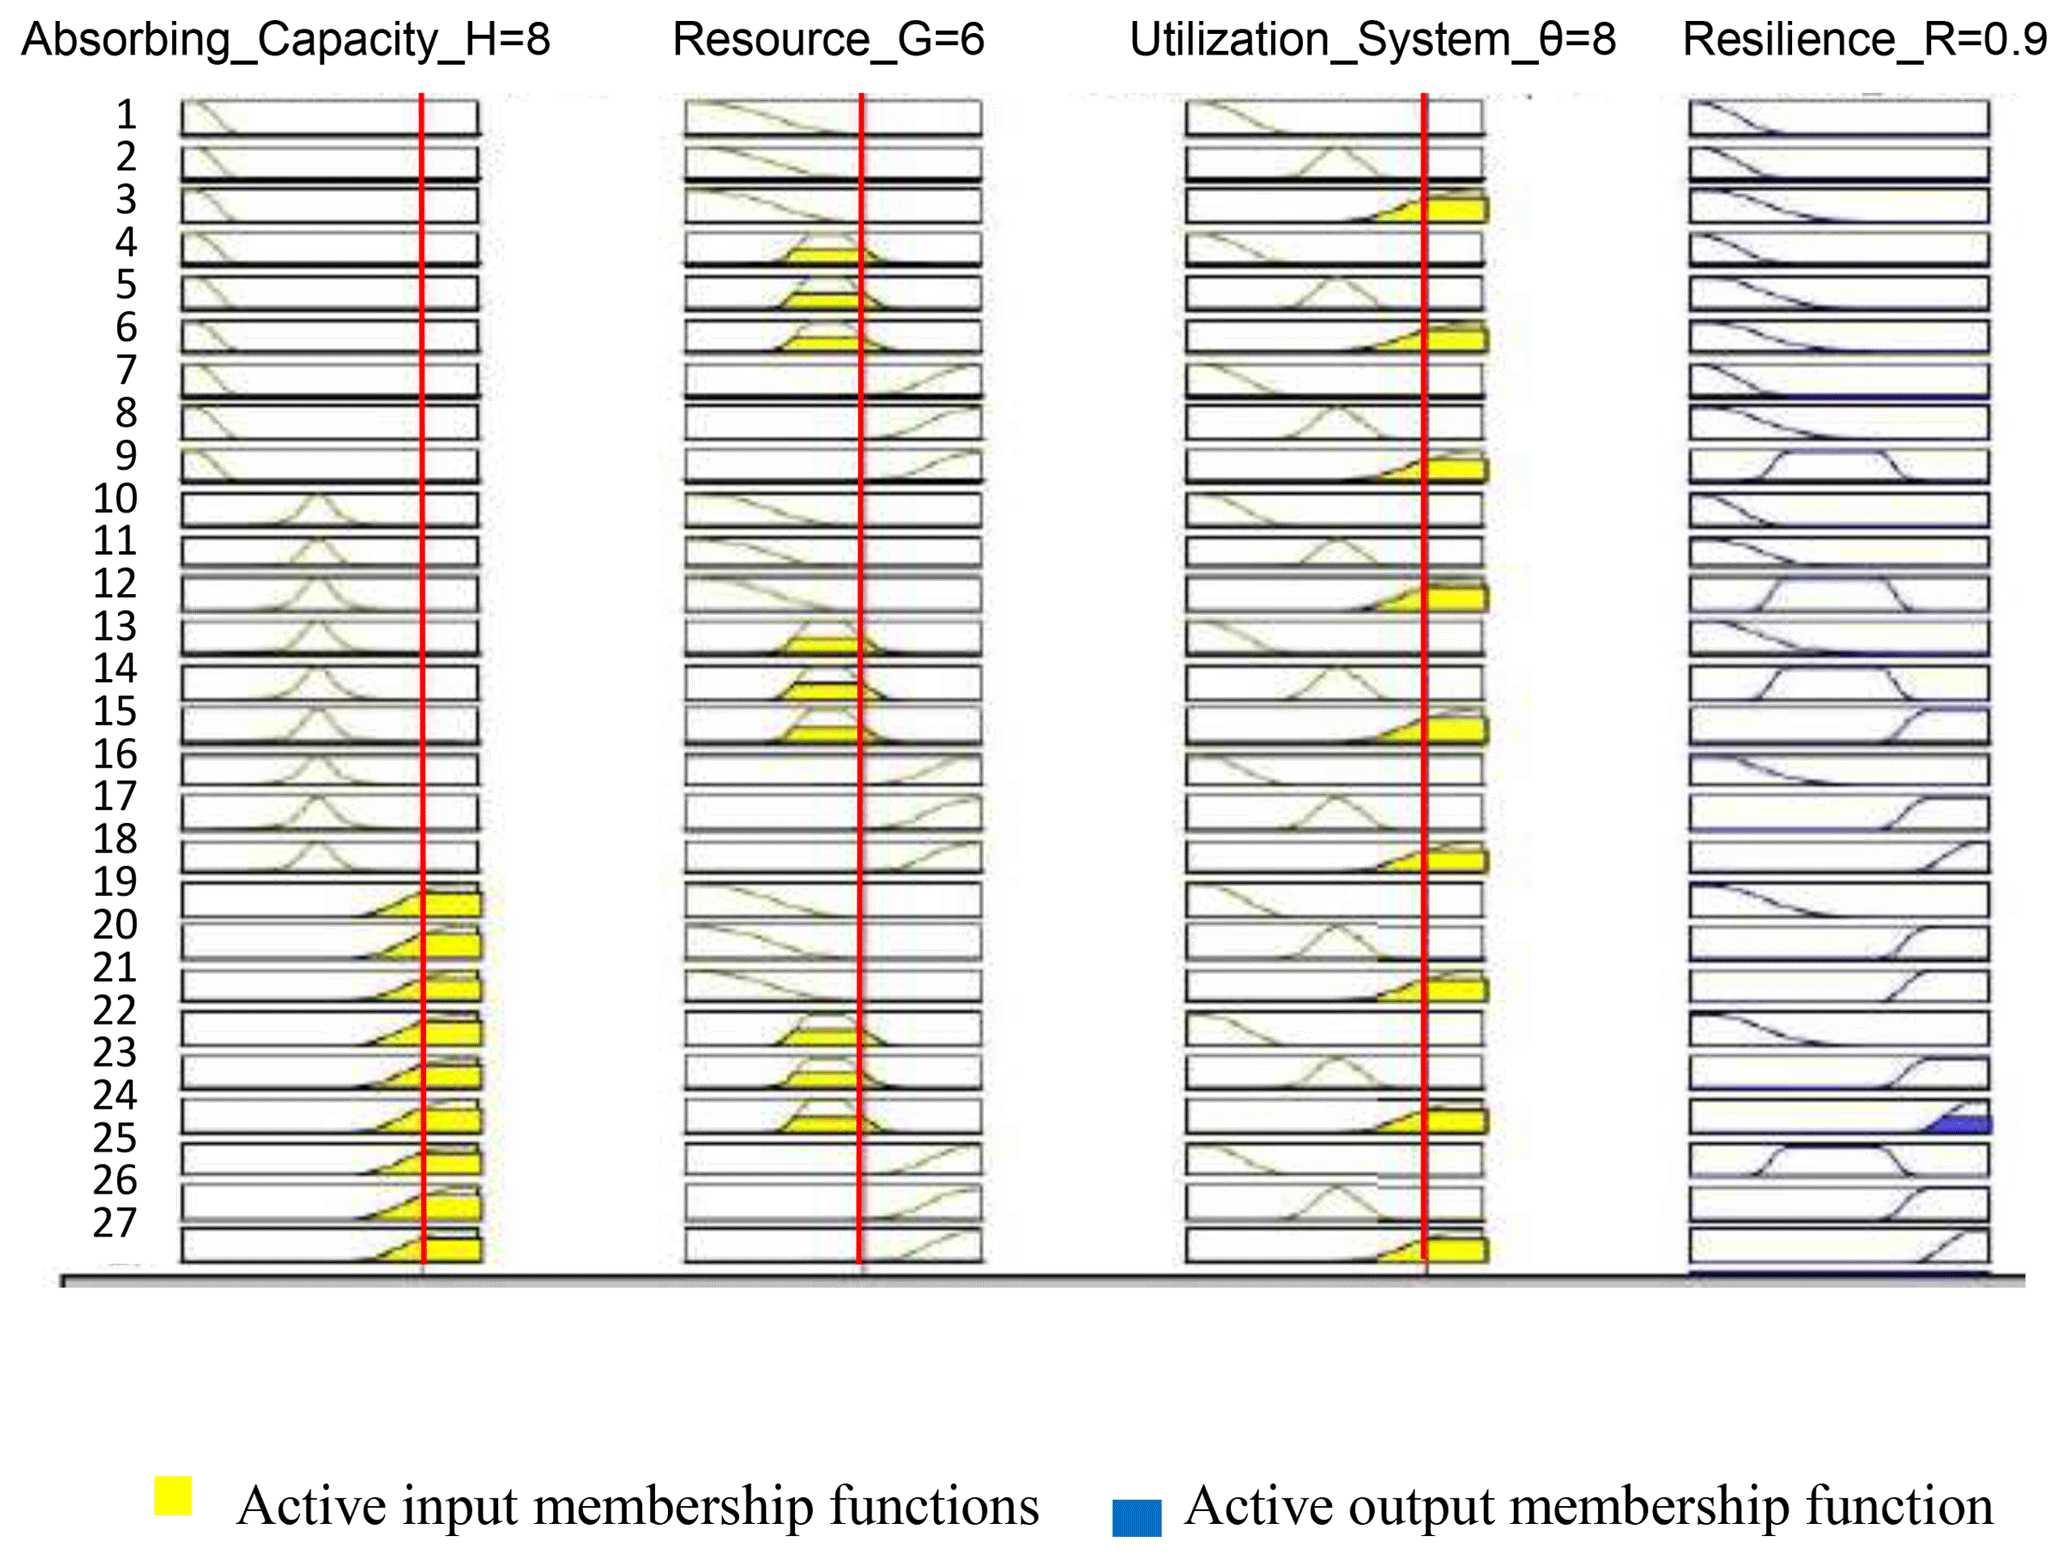
Figure 10Rule setting and output for Greenville active input membership functions and the active output membership function.
Many previous studies have identified the multiplicity of definitions as one of the major difficulties in transforming resilience measurement from an abstract concept into an objective operational framework (Costache, 2017; Fisher, 2015; Oladokun et al., 2017). This study proposes three criteria for adopting a suitable definitional basis for a framework conceptualization. These criteria which address issues such as the need to achieve model simplicity and accommodate the multidimensional nature of resilience (Brown and Williams, 2015; Cohen et al., 2016; Cutter, 2018) were used to recommend the National Academies' definition of resilience (NRC, 2012) as a robust and viable basis for developing a measurement model.
Similarly, many scholars have highlighted dealing with the complexity involved in the integration of indicators of natural and human systems into a community resilience model (Cai et al., 2018; Cutter, 2018; Fuchs and Thaler, 2018; Qiang and Lam, 2016) as a key to transforming resilience measurement from an abstract concept into an objective operational framework. To that end, we adopt a three-component system in a way that reflects key relationships among technical, social, ecological, economic and political factors that have been reported in literature (Cohen et al., 2016; Lee et al., 2013; Rose, 2017) as key to the multidimensional treatment of resilience.
Transforming the conceptual model into a quantitative template requires some sound theoretical basis, a condition noted in Keating et al. (2017) as a prerequisite for developing an acceptable framework. Hence this study recognizes that such a framework must show clear logical relationships among the various indicators and dimensions of resilience and provide logical linkages between their abstraction and empirical requirements. The geometric-based mathematical modeling approach we have adopted shows these relationships and provides the linkage between conceptual model and operational requirements. Based on this, mathematical functions were developed to establish logical relationships among key socio-technical parameters and quantities that characterize the community resilience system, thus infusing a theoretical basis into the framework. To enhance the integration of both technical and nontechnical communal resiliency factors and reduce model complexity, the conceptual framework was defined using a minimum number of integrated components and interactions. This approach allows the adoption of a soft computing tool for model analysis. While the study developed a template for data collection and illustrated its application, the template still relies on subjective opinions of experts which may be seen as a drawback of the model. Hence further research is suggested to explore the automation and standardization of the R-FIS input process by integrating it with web-based socioeconomic and ecological rankings or indices of communities. Yet, from computational and operational perspectives, the adoption of a fuzzy inference system as an analytical tool is presented as a viable approach for harnessing the opinions and experiences of experts and residents.
In conclusion, this study which is centered on the need for an acceptable template to measure flood resilience examines the challenges, conceptual constraints and construct ramifications that have complicated the development of an operational framework for measuring the resilience of communities prone to flood hazard. Although the proliferation of conceptual models and frameworks for understanding resilience has indeed posed some challenges for the development of an acceptable scenario-based measurement framework, there has been evidence of rich multidisciplinary insights resulting from the continuously evolving collaborative platforms for driving resilience research, policy and discourse. Nonlinearity, multiple feedbacks and other sources of complexity constitute major challenges to achieving operational practicality and model tractability while maintaining reasonable validity. There has also been the challenge of compatibility between the natural and human variables due to the well recognized complexity inherent in community resilience. In terms of insights, the models from this study provide some explanations into the relationships existing among resilience factors and dimensions. For instance, the importance of good community governance, processes and resource utilization systems becomes obvious in the various scenario analyses. Furthermore, the model was able to document the relative impact of variables that contribute to or detract from resilience. Although only sample values were used, the model application was able to illustrate the relative impacts that varying levels of institutional strength and resource availability, for example, have on progress toward resilience at a place.
Hence, the R-FIS provides a pathway for dealing with challenges of data issues such as missing data, spatiotemporal variations and the use of subjective information because the critical input variables are locally and/or contextually defined. Thus, the proposed framework offers a viable approach for measuring flood resilience, even when there are limitations of data availability and compatibility.
All underlying research data used in this paper are publicly accessible at https://factfinder.census.gov/faces/nav/jsf/pages/community_facts.xhtml (US Census Bureau, 2019) and http://locateincarolina.com/geography-climate/ (Pitt County Development Commision, 2019).
VOO conceived the presented idea and developed the theoretical formalism, the mathematical model and the computational framework. VOO and BEM carried out the field studies, data gathering and computational analysis. Both authors developed the manuscript.
The authors declare that they have no conflict of interest.
This work is part of research carried out under the Fulbright African Research Scholar Program Award (2017/18) funded by the United States Government.
This research has been supported by the US Fulbright African Research Scholar Program Award.
This paper was edited by Margreth Keiler and reviewed by Heejun Chang and two anonymous referees.
Adnan, M. M., Sarkheyli, A., Zain, A. M., and Haron, H.: Fuzzy logic for modeling machining process: a review, Artif. Intell. Rev., 43, 345–379, https://doi.org/10.1007/s10462-012-9381-8, 2015.
Ashraf, M. and Routray, K. K.: Perception and understanding of drought and coping strategies of farming house holds in north-west Balochistan, Int. J. Disast. Risk Re., 5, 49–60, https://doi.org/10.1016/j.ijdrr.2013.05.002, 2013.
Begg, C., Walker., G., and Kuhlicke, C.: Localism and flood risk management in England:the creation of new inequalities?, Government and Policy, 33, 685–702, https://doi.org/10.1068/c12216, 2015.
Brown, E. D. and Williams, B. K.: Resilience and Resource Management, Environ. Manage., 56, 1416–1427, https://doi.org/10.1007/s00267-015-0582-1, 2015.
Cai, H., Lam, N. S., Zou, L., and Qiang, Y.: Modeling the Dynamics of Community Resilience to Coastal Hazards Using a Bayesian Network, A. Am. Assoc. Geogr., 108, 1260–1279, https://doi.org/10.1080/24694452.2017.1421896, 2018.
Cohen, O., Bolotin, A., Lahad, M., Goldberg, A., and Aharonson-Daniel, L.: Increasing sensitivity of results by using quantile regression analysis for exploring community resilience, Ecol. Indic., 66, 497–502, https://doi.org/10.1016/j.ecolind.2016.02.012, 2016.
Cohen, O., Goldberg, A., Lahad, M., and Aharonson-Daniel, L.: Building resilience: The relationship between information provided by municipal authorities during emergency situations and community resilience, Technol. Forecast. Soc., 121, 119–125, https://doi.org/10.1016/j.techfore.2016.11.008, 2017.
Costache, A.: Conceptual delimitations between resilience, vulnerability and adaptive capacity to extreme events and global change, Annals of Valahia University of Targoviste. Geographical Series, 17, 198–205, https://doi.org/10.1515/avutgs-2017-0018, 2017.
Cutter, S. L.: Linkages between Vulnerabilty and Resilience, in: Vulnerabilty and Resilience to Natural Hazards, edited by: Fuchs, S. and Thaler, T., Cambridge Press, New York, 257–270, 2018.
Cutter, S. L., Barnes, L., Berry, M., and Burton, C.: A place-based model for understanding community resilience to natural disasters, Global Environ. Chang., 18, 598–606, https://doi.org/10.1016/j.gloenvcha.2008.07.013, 2008.
Cutter, S. L., Ash, K. D., and Emrich, C. T.: Urban–Rural Differences in Disaster Resilience, A. Am. Assoc. Geogr., 106, 1236–1252, https://doi.org/10.1080/24694452.2016.1194740, 2016.
Duy, P. N., Chapman, L., Tight, M., Thuong, L. V., P. D., and Linh, P. N.: Urban Resilience to Floods in Coastal Cities: Challenges and Opportunities for Ho Chi Minh City and Other Emerging Cities in Southeast Asia, J. Urban Plan. D., 144, 05017018(1-10), 2018.
Esteban, M., Tsimopoulou, V., Mikami, T., Yun, N. Y., Suppasri, A., and Shibayama, T.: Recent tsunamis events and preparedness: Development of tsunami awareness in Indonesia, Chile and Japan, Int. J. Disast. Risk Re., 5, 84–97, https://doi.org/10.1016/j.ijdrr.2013.07.002, 2013.
Fekete, A. and Montz, B.: Vulnerability: an introduction, in: Vulnerability and resilience to natural hazards, edited by: Fuchs, S. and Thaler, T., Cambridge University Press, 2018.
Filion, P. and Sands, G.: Enhancing Hazard Resilience among Impoverished Urban Communities in Ghana: The Role of Women as Catalysts for Improvement, in: Cities at Risk: Planning for and Recovering from Natural Disasters, edited by: P. Filion,and G. Sands, Routledge, 31–46, 2016.
Fisher, L.: Disaster responses: More than 70 ways to show resilience, Nature, 518, 35–35, https://doi.org/10.1038/518035a, 2015.
Folke, C.: Resilience: the emergence of a perspective for social–ecological systems analyses, Global Environ. Chang., 16, 253–267, https://doi.org/10.1016/j.gloenvcha.2006.04.002, 2006.
Folke, C., Carpenter, S., Elmqvist, T., Gunderson, L., Holling, C. S., and Walker, B.: Resilience and sustainable development: building adaptive capacity in a world of transformations, AMBIO, 31, 437–440, https://doi.org/10.1579/0044-7447-31.5.437, 2002.
Fuchs, S. and Thaler, T.: Vulnearabilty and Resilience to Natural Hazards, edited by: Fuchs, S. and Thaler, T., New York, Cambridge Press, 2018.
Guo, L., He, B., Chang, M., Chang, Q., Li, Q., Zhang, K., and Hong, Y.: A comprehensive flash flood defense system in China: overview, achievements, and outlook, Nat. Hazards, 92, 1–14, https://doi.org/10.1007/s11069-018-3221-3, 2018.
Hammond, M. J., Chen, A. S., Djordjević, S., Butler, D., and Mark, O.: Urban flood impact assessment: A state-of-the-art review, Urban Water J., 12, 14–29, https://doi.org/10.1080/1573062X.2013.857421, 2015.
Ibanez, G. E., Buck, C. A., Khatchikian, N., and Norris, F. H.: Qualitative Analysis of Coping Strategies Among Mexican Disaster Survivors, Anxiety Stress Copin., 17, 69–85, https://doi.org/10.1080/10615800310001639628, 2004.
Jha, A. K., Bloch, R., and Lamond, J.: Cities and Flooding: A guide to Integrated Urban Flood Risk Management the 21st Centuries, Washington, The World bank, 2012.
Joseph, R., Proverbs, D., and Lamond, J.: Resilient reinstatement: what can we learn from the 2007 flooding in England?, in: Flood Recovery, Innovation and Response IV, edited by: Proverbs, D. and Brebbia, C. A., 184, WIT Press, 175–186, 2014.
Keating, A., Campbell, K., Szoenyi, M., McQuistan, C., Nash, D., and Burer, M.: Development and testing of a community flood resilience measurement tool, Nat. Hazards Earth Syst. Sci., 17, 77–101, https://doi.org/10.5194/nhess-17-77-2017, 2017.
Kotze, I. and Reyers, B.: Piloting a social-ecological index for measuring flood resilience: A composite index approach, Ecol. Indic., 60, 45–53, https://doi.org/10.1016/j.ecolind.2015.06.018, 2016.
Lee, A. V., Vargo, J., and Seville, E.: Developing a Tool to Measure and Compare Organizations' Resilience, Nat. Hazards Rev., 14, 29–41, https://doi.org/10.1061/(ASCE)NH.1527-6996.0000075, 2013.
Lincy, G. R. and John, C. J.: A multiple fuzzy inference systems framework for daily stock trading with application to NASDAQ stock exchange, Expert Syst. Appl., 44, 13–21, https://doi.org/10.1016/j.eswa.2015.08.045, 2016.
Mallakpour, I. and Villarini, G.: The changing nature of flooding across the central United States, Nat. Clim. Change, 5, 250–254, https://doi.org/10.1038/nclimate2516, 2015.
Mamdani, E. H. and Assilian, S.: An experiment in linguistic synthesis with a fuzzy logic controller, Int. J. Man Mach. Stud., 7, 1–13, https://doi.org/10.1016/S0020-7373(75)80002-2, 1975.
Mavhura, E., Manyena, S. B., Collins, A. E., and Manatsa, D.: Indigenous knowledge,coping strategies and resilience to floods in Muzarabani, Zimbabwe, Int. J. Disast. Risk Re., 5, 38–48, https://doi.org/10.1016/j.ijdrr.2013.07.001, 2013.
Mogollón, B., Frimpong, E. A., Hoegh, A. B., and Angermeier, P. L.: Recent changes in stream flashiness and flooding, and effects of flood management in North Carolina and Virginia, JAWRA Journal of the American Water Resources Association, 52, 561–577, https://doi.org/10.1111/1752-1688.12408, 2016.
Montz, B.: Emerging Issues and Challenges: Natural Hazards, Journal of Contemporary Water Research and Education, 142, 42–45, https://doi.org/10.1111/j.1936-704X.2009.00051.x, 2009.
Norris, F. H., Stevens, S. P., Pfefferbaum, B., Wyche, K. F., and Pfefferbaum, R. L.: Community resilience as a metaphor, theory, set of capacities and strategy for disaster readiness, Community Psychology, 4, 127–150, https://doi.org/10.1007/s10464-007-9156-6, 2008.
North Carolina NC Flood Mapping Program: from Flood.NC.Gov, available at: https://flood.nc.gov/ncflood/, last access: 4 May 2019.
NRC: Disaster resilience: a national imperative, Washington, DC, National Academies Press, 2012.
Oladokun, V. O. and Emmanuel, C. G.: Urban Market Fire Disasters Management in Nigeria: A Damage Minimization based Fuzzy Logic Model Approach, Int. J. Comput. Appl., 106, 1–6, 2014.
Oladokun, V. O., Proverbs, D. G., and Lammond, J.: Measuring flood resilience: A fuzzy logic approach, International Journal of Building Pathology and Adaptation, 35, 470–487, https://doi.org/10.1108/IJBPA-12-2016-0029, 2017.
Park, J., Seager, T. P., Rao, P. S., Convertino, M., and Linkov, I.: Integrating risk and resilience approaches to catastrophe management in engineering systems, Risk Anal., 33, 356–367, https://doi.org/10.1111/j.1539-6924.2012.01885.x, 2013.
Parsons, M., Glavac, S., Hastings, P., Marshall, G., McGregor, J., McNeill, J., Morley, P., Reeve, I., and Stayner, R.: Top-down assessment of disaster resilience: Aconceptual framework using coping and adaptive capacities, Int. J. Disast. Risk Re., 19, 1–11, https://doi.org/10.1016/j.ijdrr.2016.07.005, 2016.
Pitt County Development Commision: Geography and Climate, from Pitt County Development Commision, available at: http://locateincarolina.com/geography-climate/, last access: 4 May 2019.
Qiang, Y. and Lam, N. S.: The impact of Hurricane Katrina on urban growth in Louisiana: An analysis using data mining and simulation approaches, Int. J. Geogr. Inf. Sci., 30, 1832–1852, https://doi.org/10.1080/13658816.2016.1144886, 2016.
Rose, A.: Broader Dimensions of Economic Resilience, in: Defining and Measuring Economic Resilience from a Societal, Environmental and Security Perspective, Integrated Disaster Risk Management, Singapore, Springer, 2017.
Schelfaut, K., Pannemans, B., van der Craats, I., Krywkow, J., Mysiak, J., and Cools, J.: Bringing floodresilienceintopractice:theFREEMAN project, Environ. Sci. Policy, 14, 825–833, https://doi.org/10.1016/j.envsci.2011.02.009, 2011.
Scoones, I.: Sustainable rural livelihoods: a framework for analysis, Institute for Development Studies, Brighton, UK, available at: http://opendocs.ids.ac.uk/opendocs/handle/123456789/3390 (last access: 4 June 2019), 1998.
Shah, A. A., Ye, J., Abid, M., Khan, J., and Amir, S. M.: Flood hazards: household vulnerability and resilience in disaster-prone districts of Khyber Pakhtunkhwa province, Pakistan, Nat. Hazards, 93, 147–165, https://doi.org/10.1007/s11069-018-3293-0, 2018.
Sharifi, A.: A critical review of selected tools for assessing community resilience, Ecol. Indic., 69, 629–647, https://doi.org/10.1016/j.ecolind.2016.05.023, 2016.
Su, Y. S.: Discourse, Strategy, and Practice of Urban Resilience against Flooding, Business and Management Studies, 2, 73–87, https://doi.org/10.11114/bms.v2i1.1348, 2016a.
Su, Y. S.: Urban Flood Resilience in New York City, London, Randstad, Tokyo, Shanghai, and Taipei, Journal of Management and Sustainability, 6, 92–108, https://doi.org/10.5539/jms.v6n1, 2016b.
Swalheim., S. and Dodman, D.: Building resilience: how the urban poor can drive climate adaptation, London, IIED, 2008.
Szoenyi, M. and Nash, D.: Measuring flood resilience – our approach, Zurich, Zurich Insurance Company Ltd, 2016.
Thomas, J. A. and Mora, K.: Community resilience, latent resources and resource scarcity after an earthquake: Is society really three meals away from anarchy?, Nat. Hazards, 74, 477–490, https://doi.org/10.1007/s11069-014-1187-3, 2014.
Tompkins, E. and Adger, W. N.: Does adaptive management of natural resources enhance resilience to climate change?, Ecol. Soc., 9, 10, https://www.ecologyandsociety.org/vol9/iss2/art10/ (last access: 4 June 2019), 2004.
Trogrlić, R. Š., Wright, G. B., Adeloye, A. J., Duncan, M. J., and Mwale, F.: Taking stock of community-based flood risk management in Malawi: different stakeholders, different perspectives, Environ. Hazards, 17, https://doi.org/10.1080/17477891.2017.1381582, 2018.
US Census Bureau: American fact finders [Online], from United States Census Bureau, available at: https://factfinder.census.gov/faces/nav/jsf/pages/community_facts.xhtml, last access: 7 June 2019.
Wing, O. E., Bates, P. D., Smith, A. M., Sampson, C. C., Johnson, K. A., Fargione, J., and Morefield, P.: Estimates of present and future flood risk in the conterminous United States, Environ. Res. Lett., 13, 9034023, https://doi.org/10.1088/1748-9326/aaac65, 2018.
Zadeh, L. A.: Fuzzy logic = computing with words. Fuzzy Systems, T. IEEE, 4, 103–111, https://doi.org/10.1109/91.493904, 1996.
Zou, L., Lam, N. S., Cai, H., and Qiang, Y.: Mining Twitter Data for Improved Understanding of Disaster Resilience, A. Am. Assoc. Geogr., 108, 1–20, https://doi.org/10.1080/24694452.2017.1421897, 2018.
- Abstract
- Introduction
- Resilience measuring: a conceptual framework
- Resilience fuzzy inference system (R-FIS): computer model
- Model application: study location
- Discussion and conclusions
- Data availability
- Author contributions
- Competing interests
- Acknowledgements
- Financial support
- Review statement
- References