the Creative Commons Attribution 4.0 License.
the Creative Commons Attribution 4.0 License.
 | 21 Jan 2019
Economic damage and spillovers from a tropical cyclone
Manfred Lenzen
Arunima Malik
Steven Kenway
Peter Daniels
Ka Leung Lam
Arne Geschke
Tropical cyclones cause widespread damage in specific regions as a result of high winds and flooding. Direct impacts on commercial property and infrastructure can lead to production shortfalls. Further losses can occur if business continuity is lost through disrupted supply of intermediate inputs from, or distribution to, other businesses. Given that producers in modern economies are strongly interconnected, initially localised production shortfalls can ripple through upstream supply-chain networks and severely affect regional and wider national economies. In this paper, we use a comprehensive, highly disaggregated and recent multi-region input–output framework to analyse the negative impacts of Tropical Cyclone Debbie, which battered the north-eastern Australian coast in March 2017. In particular, we show how industries and regions that were not directly affected by storm and flood damage suffered significant job and income losses throughout upstream supply chains. Our results indicate that the disaster resulted in the direct loss of about 4802 full-time-equivalent jobs and AUD 1544 million of value added, and an additional indirect loss of 3685 jobs and AUD 659 million of value added. The rapid and detailed assessment of the economic impact of disasters is made possible by the timely data provision and collaborative environment facilitated by the Australian Industrial Ecology Virtual Laboratory (IELab).
- Article
(3685 KB) -
Supplement
(1168 KB) - BibTeX
- EndNote


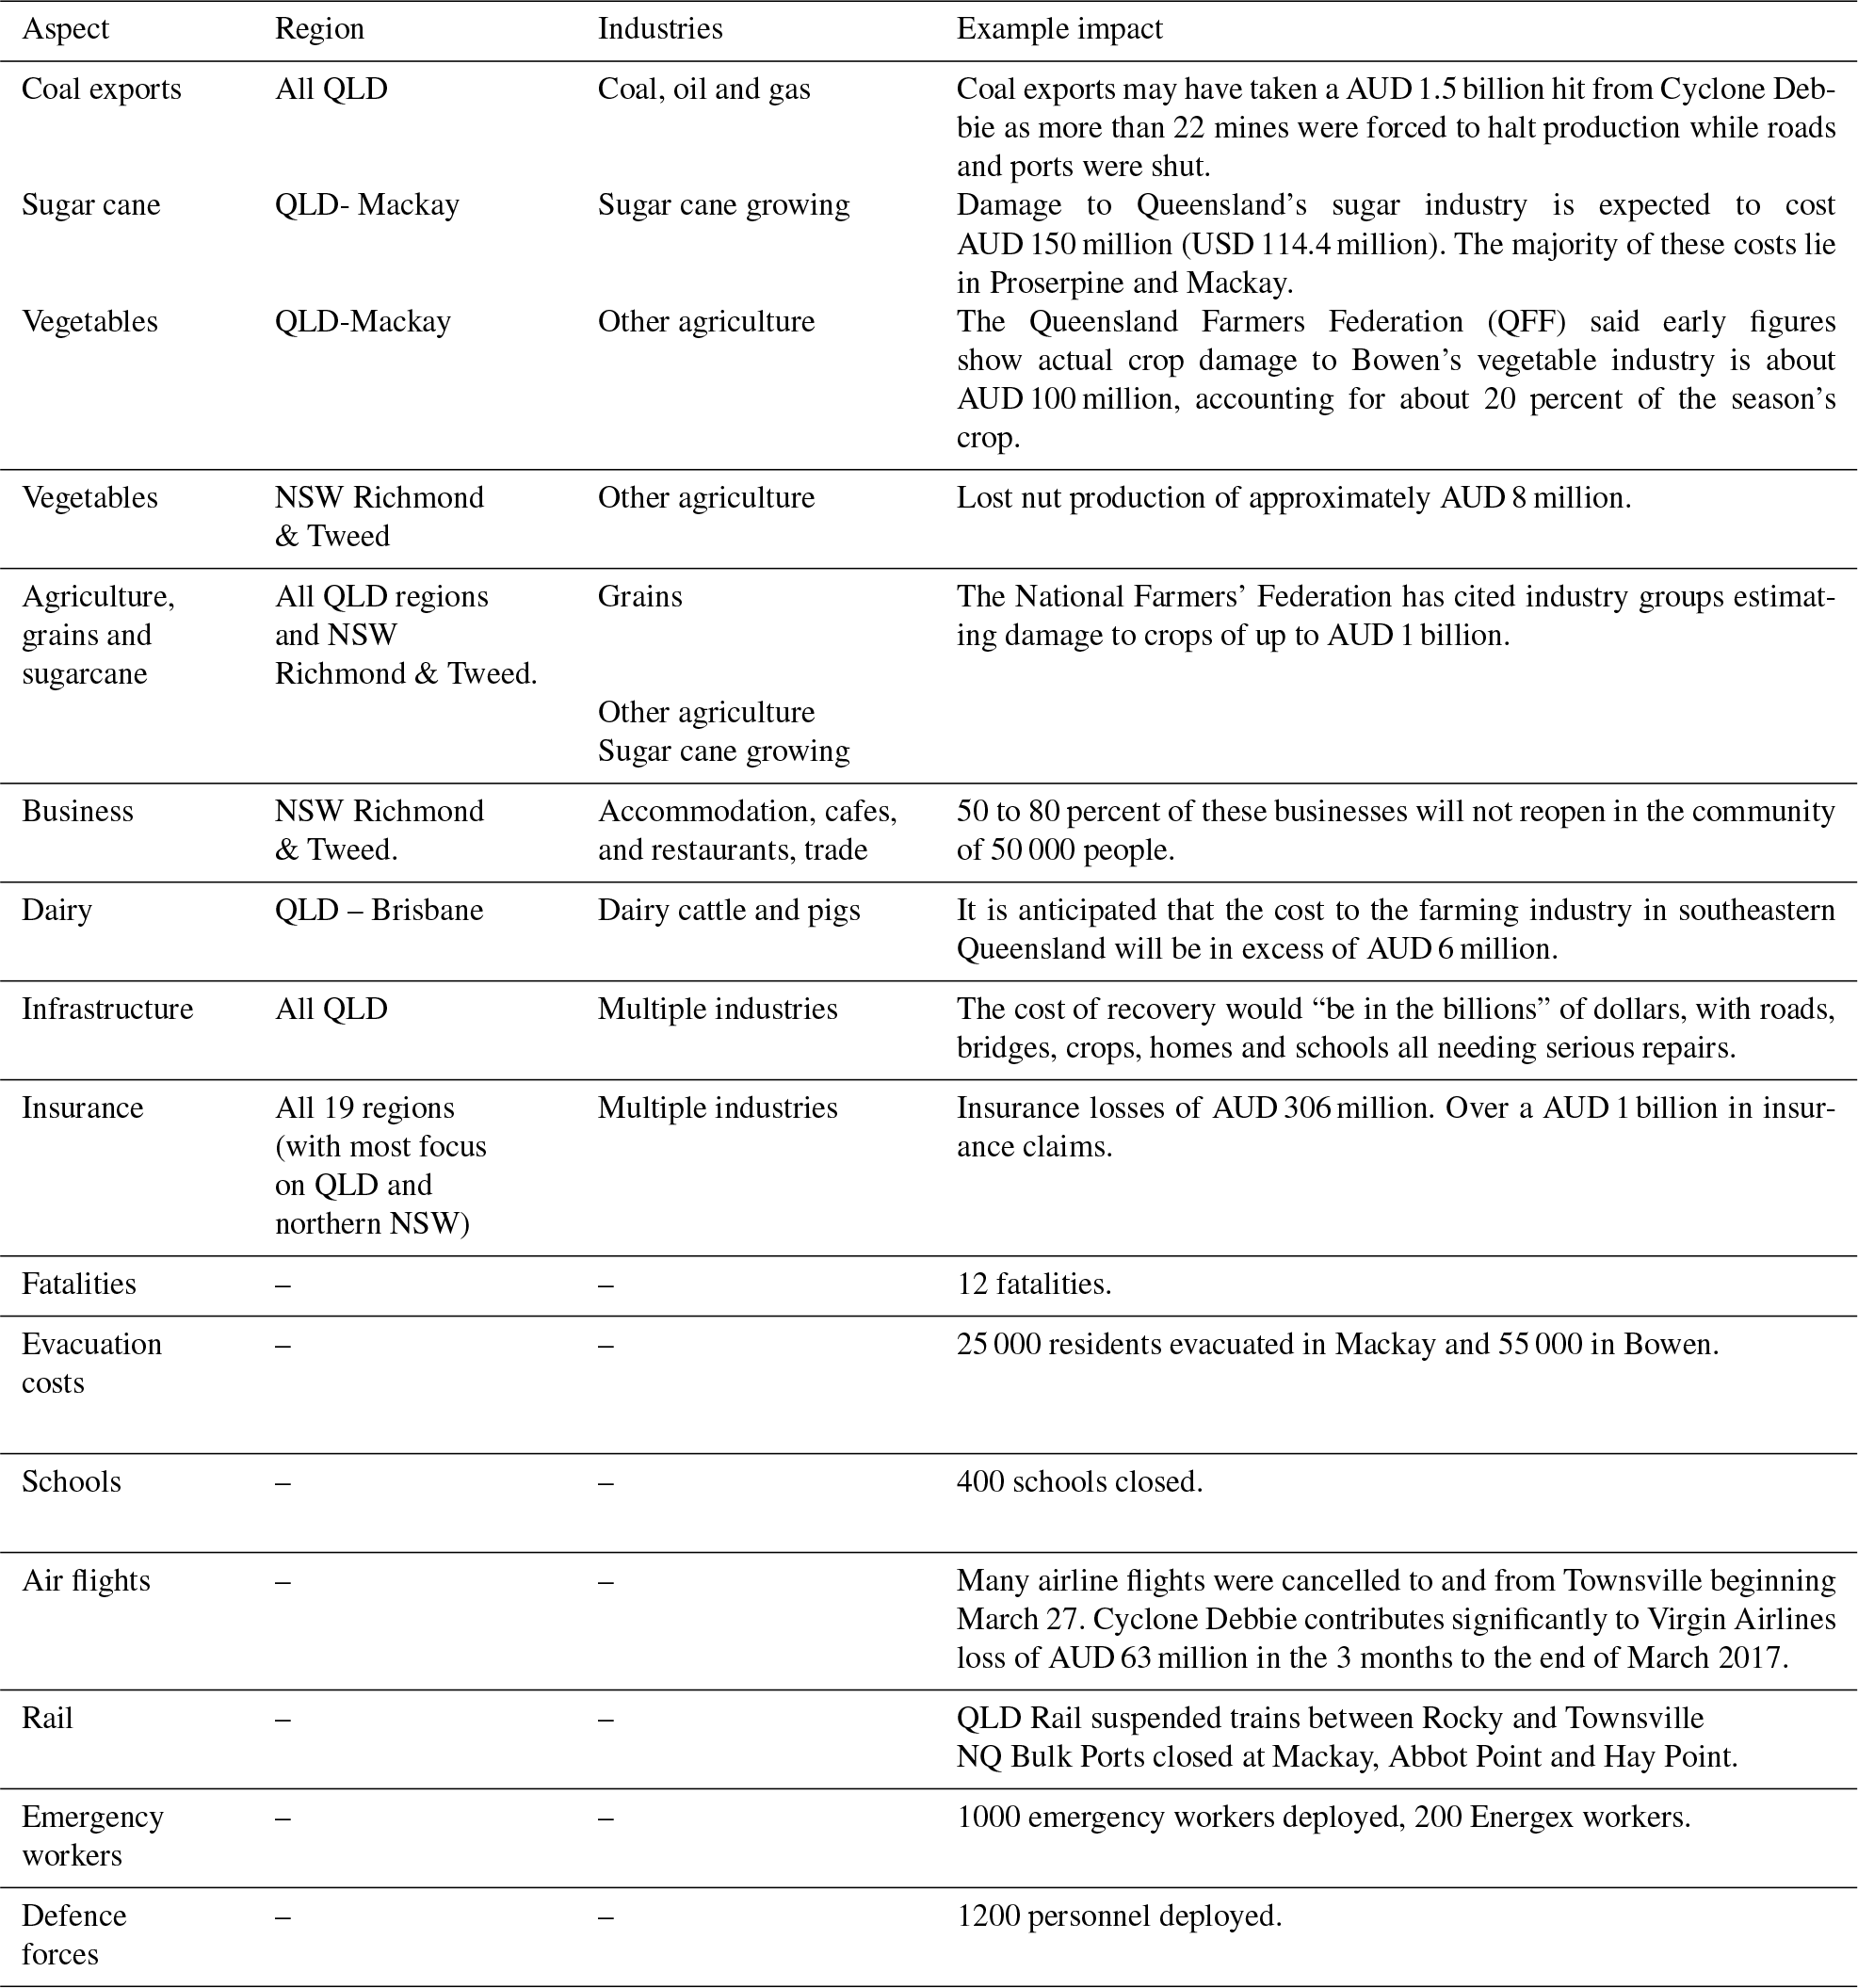
On Tuesday 28 March 2017, severe Tropical Cyclone Debbie made landfall at Airlie Beach, in North Queensland, Australia (QLD-N). As a Category 4 system (equivalent to a major hurricane or a typhoon), it hit coastal communities with torrential rain and wind gusts up to 265 km h−1, destroying or damaging homes, businesses, crops and infrastructure and, tragically, led to 12 fatalities (Queensland Government, 2017). The initial impact was felt mainly on the iconic Great Barrier Reef coral ecosystems of the Whitsunday Coast and the surrounding communities including Bowen and Proserpine. Within 24 h, Debbie was approximately 250 km inland and had degenerated into a high-rainfall low-pressure system. The system progressively tracked over 1000 km south, where it moved back out to sea around the Queensland–New South Wales border on 31 March after significant flooding across the region. Rainfall of 150–250 mm was recorded regionally, with peaks of 400–1000 mm, swamping remote rural, coastal and urban communities. More than a week later, widespread flooding was still being felt in the region (Queensland Government, 2017).
Dubbed the “lazy cyclone”, Debbie moved at under 6 km h−1 at times, causing atypically high levels of social, economic and environmental destruction. Over 63 000 emergency calls were made and over 50 000 insurance claims subsequently logged (Queensland Government, 2017). Particular impact was felt in the farming, mining and tourism industries in the northern part of the afflicted region and by flooded businesses in the south. Annual and perennial crops and trees were destroyed, export-oriented coal mines were closed and tourism industries were heavily impacted. Roads, rail systems and bridges were damaged or destroyed, along with community halls, airfields, telecommunications and other systems. All schools and many businesses were temporarily closed. The Australian Government responded at all levels including federal military deployment of air, sea and land support, Queensland Police, Fire and Emergency and State Emergency Systems.
Severe tropical cyclones are not an isolated phenomenon. Past tropical cyclones, in Australia and elsewhere, have disrupted food systems, for example in Madagascar (Cyclone Gafilo in 2004), Vanuatu (Cyclone Pam in 2015) and Fiji (Cyclone Winston in 2016). In 2006, Cyclone Larry and 2011 Cyclone Yasi (Staff, 2017) led to shortages of bananas in Australia (Brown, 2017).
Direct economic damage caused by Debbie is significant: it has been estimated to include AUD 1.5 billion in lost coal sales and approximately AUD 0.5 billion in agriculture, with major adverse impacts on sugar cane and winter horticulture supplies to southern Australia. Infrastructure damage has been estimated at over AUD 1 billion (Queensland Government, 2017). Flood damage to business and trade was also significant in northern New South Wales (the state south of Queensland). Debbie also caused temporary shortages to water and energy supplies (Parnell, 2017), damaged information technology infrastructure and led to price increases for tomatoes, capsicums, eggplants and other vegetables (Hatch, 2017), affecting winter vegetable supply for Sydney and Melbourne. Across all sectors insurance claims of over AUD 300 million were lodged (Underwriter, 2017).
Given that the frequency of extreme weather events such as tropical cyclones will increase due to climate change (Mendelsohn et al, 2012), developing and testing methods for assessing economic consequences of natural disasters is of growing importance. In our case study, this significance is reinforced in view of the importance of northern Australia in plans for the nation's ongoing economic development, notably in mining and agriculture (Regional Institute of Australia, 2013).
In this work, we use multi-region economic input–output (MRIO) analysis to investigate the economy-wide repercussions of the biophysical damage wrought by Tropical Cyclone Debbie upon the North Queensland region of Australia. More specifically, we quantify the upstream supply chain impacts of the cyclone using input–output (IO) analysis. As developed from Leontief's work in the 1930s, IO analysis is capable of interrogating economic data on inter-industry transactions, final consumption and value added, in order to trace economic activity rippling throughout complex supply-chain networks and to unveil both immediate and indirect impacts of systemic shocks (Leontief, 1966). Over the past 70 years, IO analysis has been used extensively for a wide range of public policy and scientific research questions (Rose and Miernyk, 1989). Over the past two decades, IO analysis has experienced a surge in applications, especially in carbon footprints (Wiedmann, 2009) and global value chains (Timmer et al., 2014), and in the disciplines of life cycle assessment (Suh and Nakamura, 2007) and industrial ecology (Suh, 2009).
This article is structured as follows: Sect. 2 provides a review of relevant prior work and the state of knowledge in IO-based disaster analysis and describes the methodology underlying the disaster analysis undertaken using IO modelling. In particular, we build on prior work (Schulte in den Bäumen et al., 2015) and present an innovative approach for estimating infrastructure damages resulting from the disaster. We present the results and a discussion of key findings in Sect. 3, followed by conclusions in Sect. 4.
In this paper, we determine the supply-chain impacts of Tropical Cyclone Debbie, using highly disaggregated MRIO tools (Sect. 2.2 and 2.3) developed within the new Australian Industrial Ecology Virtual Laboratory (IELab) (see Sect. 2.5). Our approach incorporates a number of unique and powerful capabilities. First, we are able to identify the consequences of the cyclone, not only for the directly affected regions and industry sectors but for the wider Australian economy. Such indirect effects stem from afflicted businesses being unable to supply goods and services and from their inability to acquire necessary production inputs from suppliers. As the economy is an integrated chain of production and consumption, suppliers and consumers associated with damaged business are also affected, and economic activity winds down elsewhere. Such effects are called indirect impacts or spillovers (regional and sectoral). Capturing spillovers highlights the innovative strength of the Australian IELab, which offers unprecedented spatial resolution and hence allows for a comprehensive assessment of the direct as well as indirect supply-chain effects of disasters. In addition, the IELab offers sophisticated tools that, to our knowledge, have so far not been applied to disaster analysis: for example, production layer decomposition is able to pinpoint the sequence of indirect impacts rippling across the regional supply-chain network. One additional advanced capability is the in-built data-updating functionality in the IELab, allowing for the inclusion of recent economic and social data and enabling the timely and cost-effective analysis of disaster impacts to support expeditious decision-making. Finally, the IELab also offers data sets and analytical tools for assessing the local and regional effects in terms of a range of physical indicators, such as carbon dioxide emissions, water use, energy use and waste, to name a few. While such an assessment is beyond the scope of this study, this is surely an area of research that warrants further investigation.
In the following we will first provide a review of prior work on IO-based disaster analysis and then explain IO theory, disaster analysis, our case study, and utilised data and updating processes.
2.1 Input–output based disaster analysis – a review
IO analysis studies feature a sub-stream dealing with disaster analysis. Okuyama (2007) provides a comprehensive review of the use of IO analysis for economic analysis of disasters. Quantitative disaster analysis is needed for understanding the impacts of a disaster, for driving effective disaster response, for informing disaster risk reduction and adaptation efforts and for pre-emptive planning and decision-making (Cannon, 1993; Lesk et al., 2016; Prideaux, 2004; Temmerman et al., 2013). It is intuitively clear that a disaster results in direct losses in the form of infrastructure damages and indirect higher-order effects in the form of subsequent losses in business activity (Rose, 2004). The ability of IO analysis to capture the upstream interconnected supply chains of an industry or region affected by a disaster makes it an ideal tool for assessing the full scope of impacts of a disaster event. In addition to IO analysis, computable general equilibrium (CGE) models, econometric models and social accounting matrices (SAM) are alternative modelling frameworks for estimating the indirect higher-order effects of a disaster (Cole, 1995; Guimaraes et al., 1993; Koks et al., 2016; Koks and Thissen, 2016; Okuyama, 2007; Okuyama and Santos, 2014; Rose and Guha, 2004; Rose and Liao, 2005; Tsuchiya et al., 2007). A discussion of these models is beyond the scope of this study and we focus on IO analysis, in particular the post-disaster consumption possibilities and possible spillovers (explained further below). IO modelling has been applied to many disasters such as earthquakes in Japan (Okuyama, 2014, 2004), floods in Germany (Schulte in den Bäumen et al., 2015) and London (Li et al., 2013), terrorism (Lian and Haimes, 2006; Rose, 2009; Santos and Haimes, 2004), hurricanes (Hallegatte, 2008) and blackouts (Anderson et al., 2007) in the USA, as well as diseases and epidemics (Santos et al., 2013, 2009), to name a few.
Prior research on disaster impact analysis, based on IO analysis, has sought ways of improving the standard IO model, for example by extending the standard framework to include temporal and spatial scales (Okuyama, 2007). For example, Donaghy et al. (2007) propose a flexible framework for incorporating short- and long-time frames using the regional econometric IO model (REIM), and Yamano et al. (2007) apply a regional disaggregation method to a MRIO model to estimate higher-order effects according to specific districts. Furthermore, a so-called “inoperability index” within the inoperability input–output model (IIOM) has been proposed as a way of assessing the effect of a disaster or initial perturbation on interconnected systems (Haimes et al., 2005). Both the static and the dynamic versions of IIOM have been applied to the case of terrorism for assessing the economic losses resulting from interdependent complex systems (Lian and Haimes, 2006; Santos and Haimes, 2004). Using the dynamic version of IIOM, it is possible to assess recovery times and also to identify and prioritise systems and sectors that are most economically critical for guiding the recovery process (Haimes et al., 2005).
One particular type of disaster IO analysis, proposed by Steenge and Bočkarjova (2007) aims to investigate post-disaster consumption possibilities as a consequence of production shortfalls resulting from a disaster. As this method uses Leontief's demand-driven model, it captures backward, upstream supply-chain impacts resulting from a disaster. Such an assessment has been applied, for example to widespread flooding in Germany (Schulte in den Bäumen et al., 2015) and electricity blackouts from possible severe space weather events (Schulte in den Bäumen et al., 2014). Here, we apply this method for the first time to undertake an estimation of post-disaster consumption possibilities, and subsequent losses in employment and economic value added resulting from the 2017 Tropical Cyclone Debbie in Australia. To this end, we use the Australian IELab to construct a customised subnational MRIO table for Australia with extensive detail on regions directly affected by the cyclone. In particular, and this is the novelty of our research, we examine detailed, disaggregated regional and sectoral spillovers including the consequences of this cyclone not only for directly affected regions and industry sectors, but also for the wider national economy.
2.2 Input–output disaster analysis – mathematical formulation
A specific stream of IO analysis is disaster analysis (Okuyama, 2014, 2007), focused on IO databases employed to explore how an economy can be affected by a sudden slowdown or shutdown of individual industries. Since we are primarily interested in post-disaster consumption possibilities and ensuing employment and value-added loss, we utilise the approach by Steenge and Bočkarjova (2007). In essence, a disaster reduces total economic output x0 of industry sectors to levels
where Γ is a diagonal matrix of fractions describing sectoral production losses as a direct consequence of the disaster, and I is an identity matrix with the same dimensions as Γ. The entries of Γ are populated on the basis of primary data, in our case about cyclone Debbie (Sect. 2.4). Post-disaster consumption possibilities y1 are then the solution of the linear problem
where is a summation operator, is a matrix of input coefficients, T is the intermediate transaction matrix, the “” (hat) symbol denotes vector diagonalisation, and x1 is the post-disaster total economic output. Constraint (i) in Eq. (2) is the standard fundamental IO accounting relationship stating that in every economy intermediate demand T and final demand y sum up to total output x. This can be seen by writing . Constraint (ii) states that in the short term, post-disaster total output is limited by pre-disaster total output minus disaster-induced losses. Constraint (iii) ensures that final demand is strictly positive.
Condition (i) is different from the approach in Steenge and Bočkarjova, because we need to ensure the positivity of final demand y. Taking these authors' equation (Eq. 23) and recalculating for
we obtain negative post-disaster consumption possibilities
Our approach would yield the post-disaster situation
with non-negative post-disaster final demand and with post-disaster output
2.3 Disaster impact on value added and employment
A disaster-induced transition to lower consumption levels has implications for the state of regional economies, as it causes losses in value added and employment
where q holds value-added and employment coefficients. The sequence of these losses can be enumerated by carrying out a production layer decomposition, that is by unravelling the inverse in Eq. (3) into an infinite series (see Waugh, 1950) as
where the term qΔy represent the job and value-added losses borne by producers immediately affected by the reduction of consumption possibilities due to the cyclone, qAΔy describes first-order losses fielded by suppliers of cyclone-affected producers, qA2Δy 2nd-order losses for suppliers of suppliers and so on for subsequent upstream production layers. First- and higher-order upstream losses can in principle occur anywhere in Australia, depending on the reach of the supply-chain network of local northern Queensland producers.
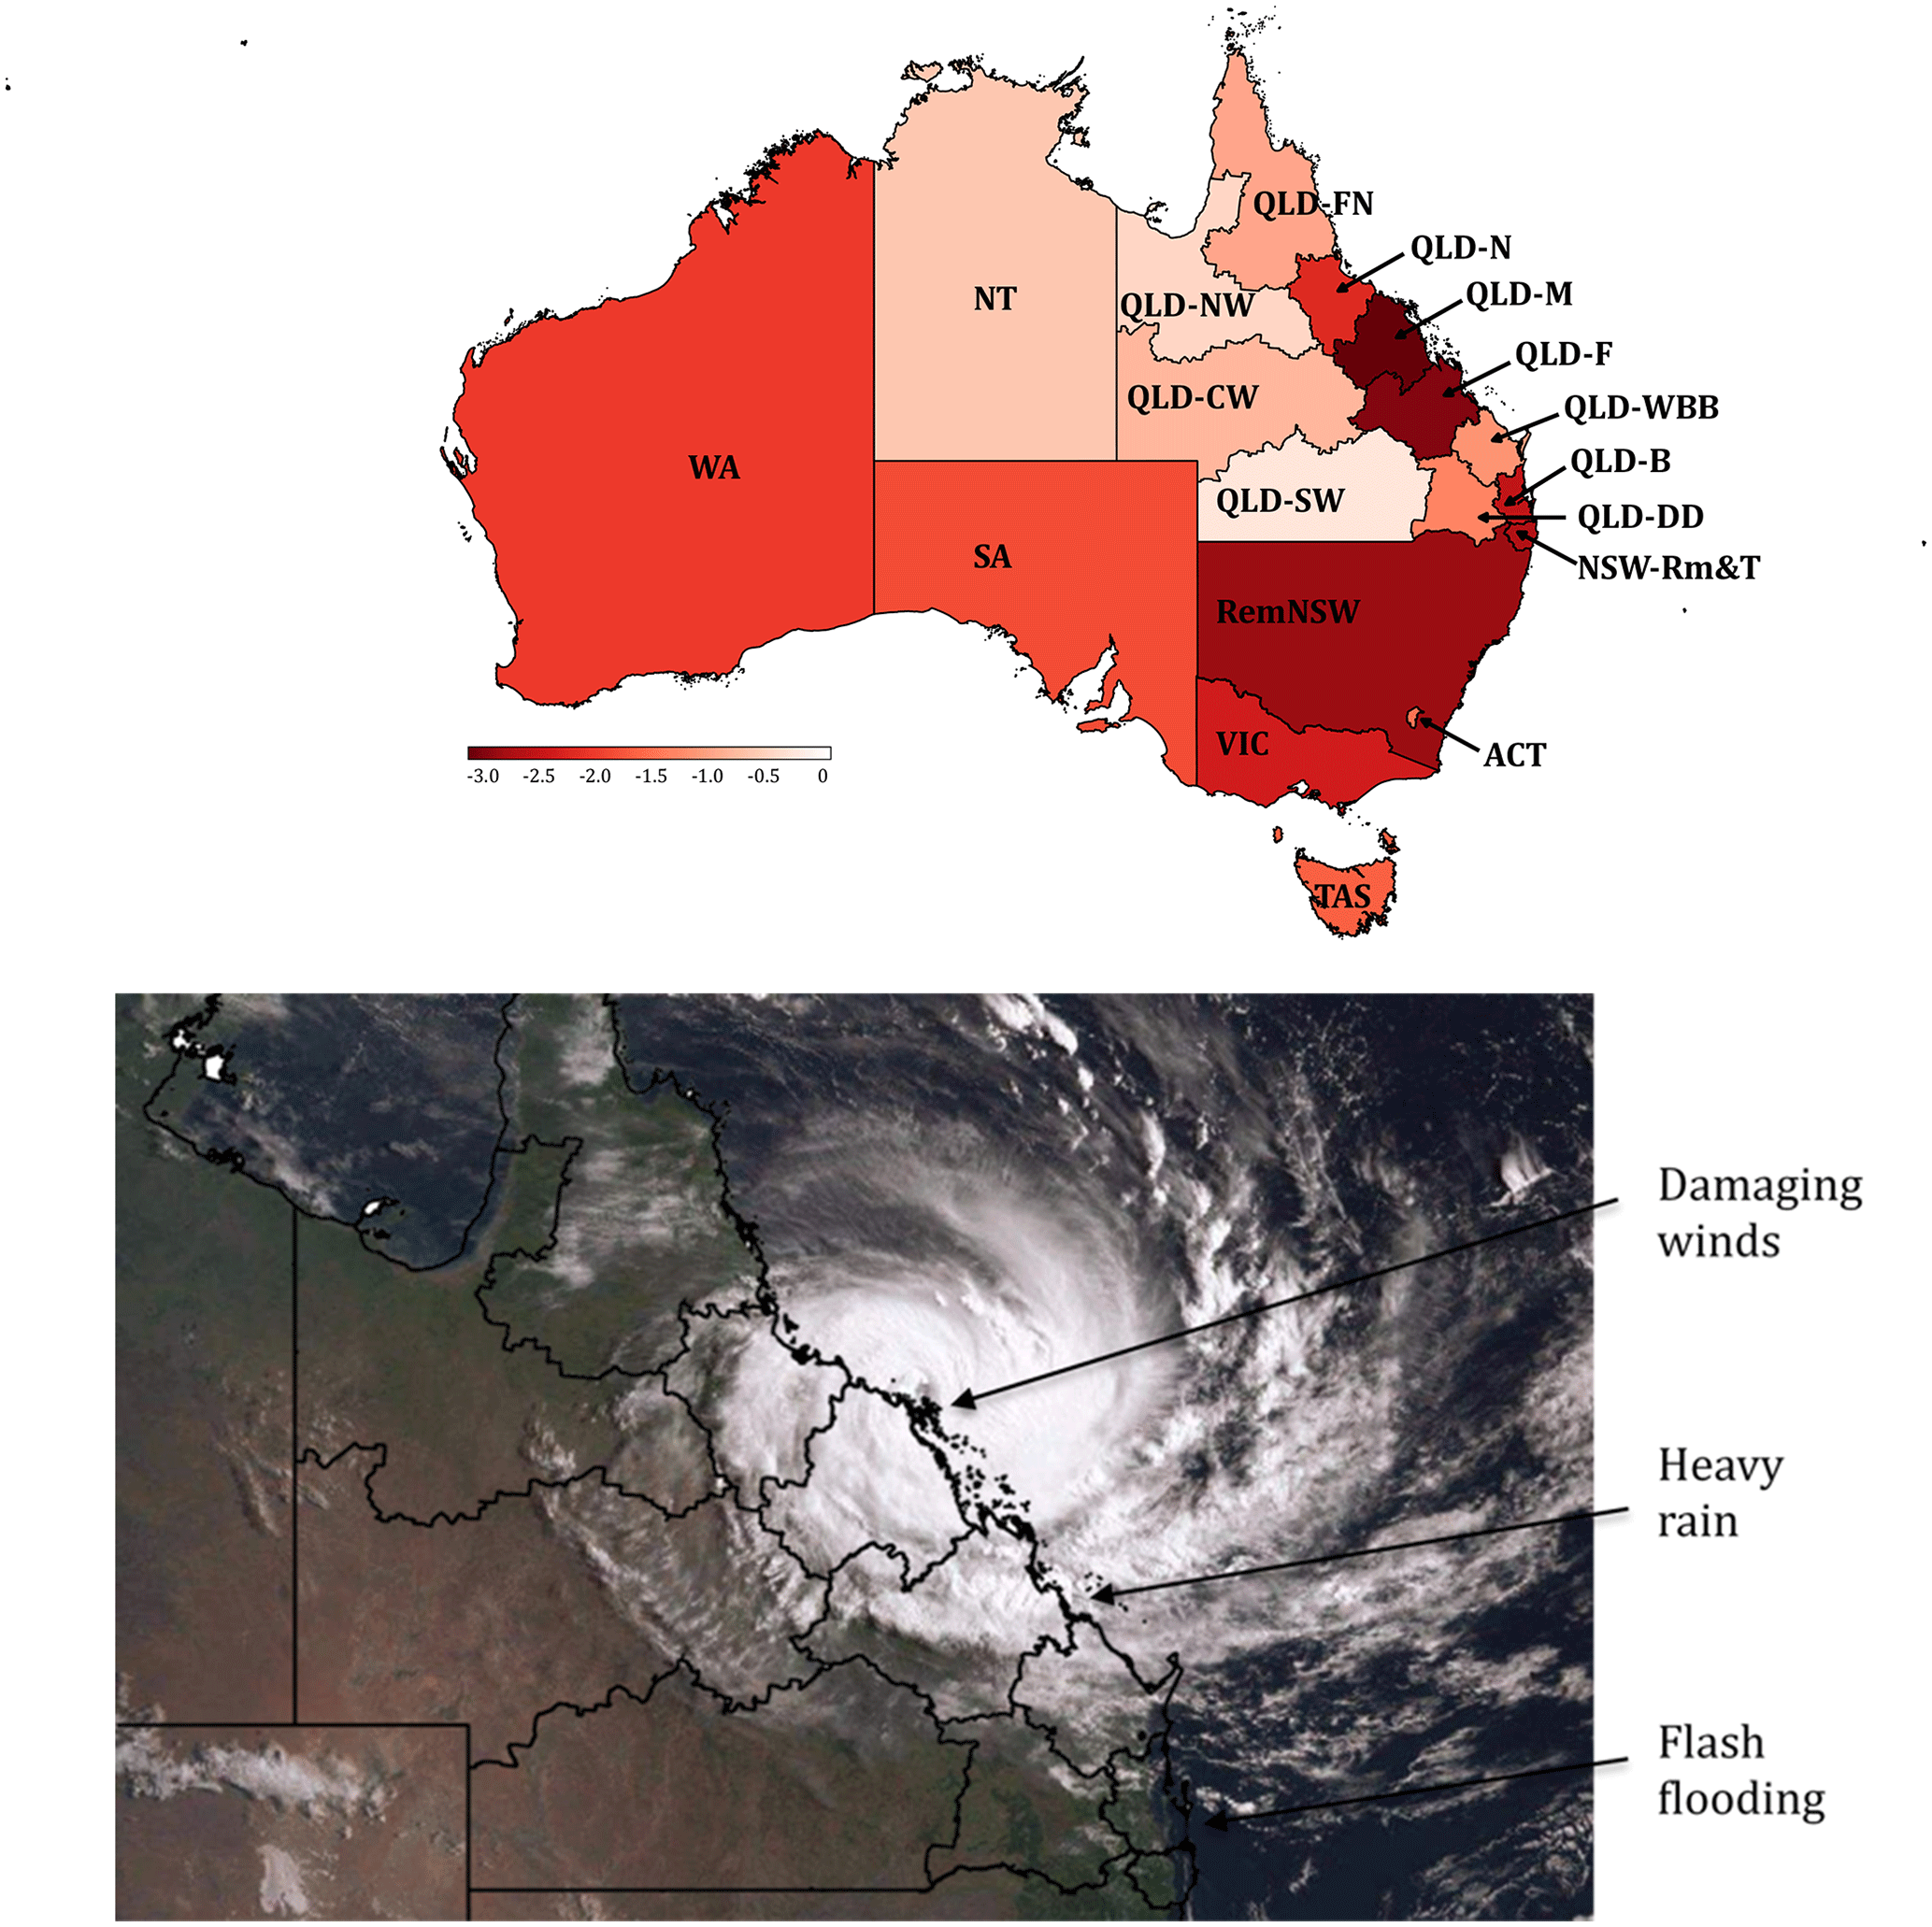
Figure 1Geographical distribution of value-added loss caused by Tropical Cyclone Debbie. Value-added (VA) loss is expressed as Δ VA = . A comparison of our results (top, −log10 (ΔVA), with ΔVA in AUD m) with a satellite image of the cyclone (ABC, 2017) (bottom) shows losses in northern Queensland regions as a direct consequence of the destructive winds and losses in southern Queensland and northern NSW as a result of heavy rain and floods occurring in the cyclone's wake. Region acronyms: RemNSW is the rest of New South Wales (NSW), NSW-Rm & T is NSW Richmond & Tweed, VIC is Victoria, QLD-B is Queensland (QLD) – Brisbane, QLD-WBB is Wide Bay Burnett, QLD-DD is Darling Downs, QL-SW is South West, QLD-F is Fitzroy, QLD-CW is Central West, QLD-M Mackay, QLD-N is North, QLD-FN is Far North, QLD-NW is North West, SA is South Australia, WA is Western Australia, TAS is Tasmania, ACT is Australian Capital Territory, NT is Northern Territory. Note that the Brisbane region in this study covers and area similar to an area generally referred to as “South-east Queensland”.
2.4 Case study: Tropical Cyclone Debbie
In order to quantify indirect economic impacts of Cyclone Debbie, we first constructed a 19-region-by-34-sector IO model of Australia, with a particular regional detail for the regions close to disaster centres, that is, 10 subregions of Queensland as well as northern New South Wales (see also Fig. 1). The compilation of this table and underlying data are outlined in Sect. 2.5.
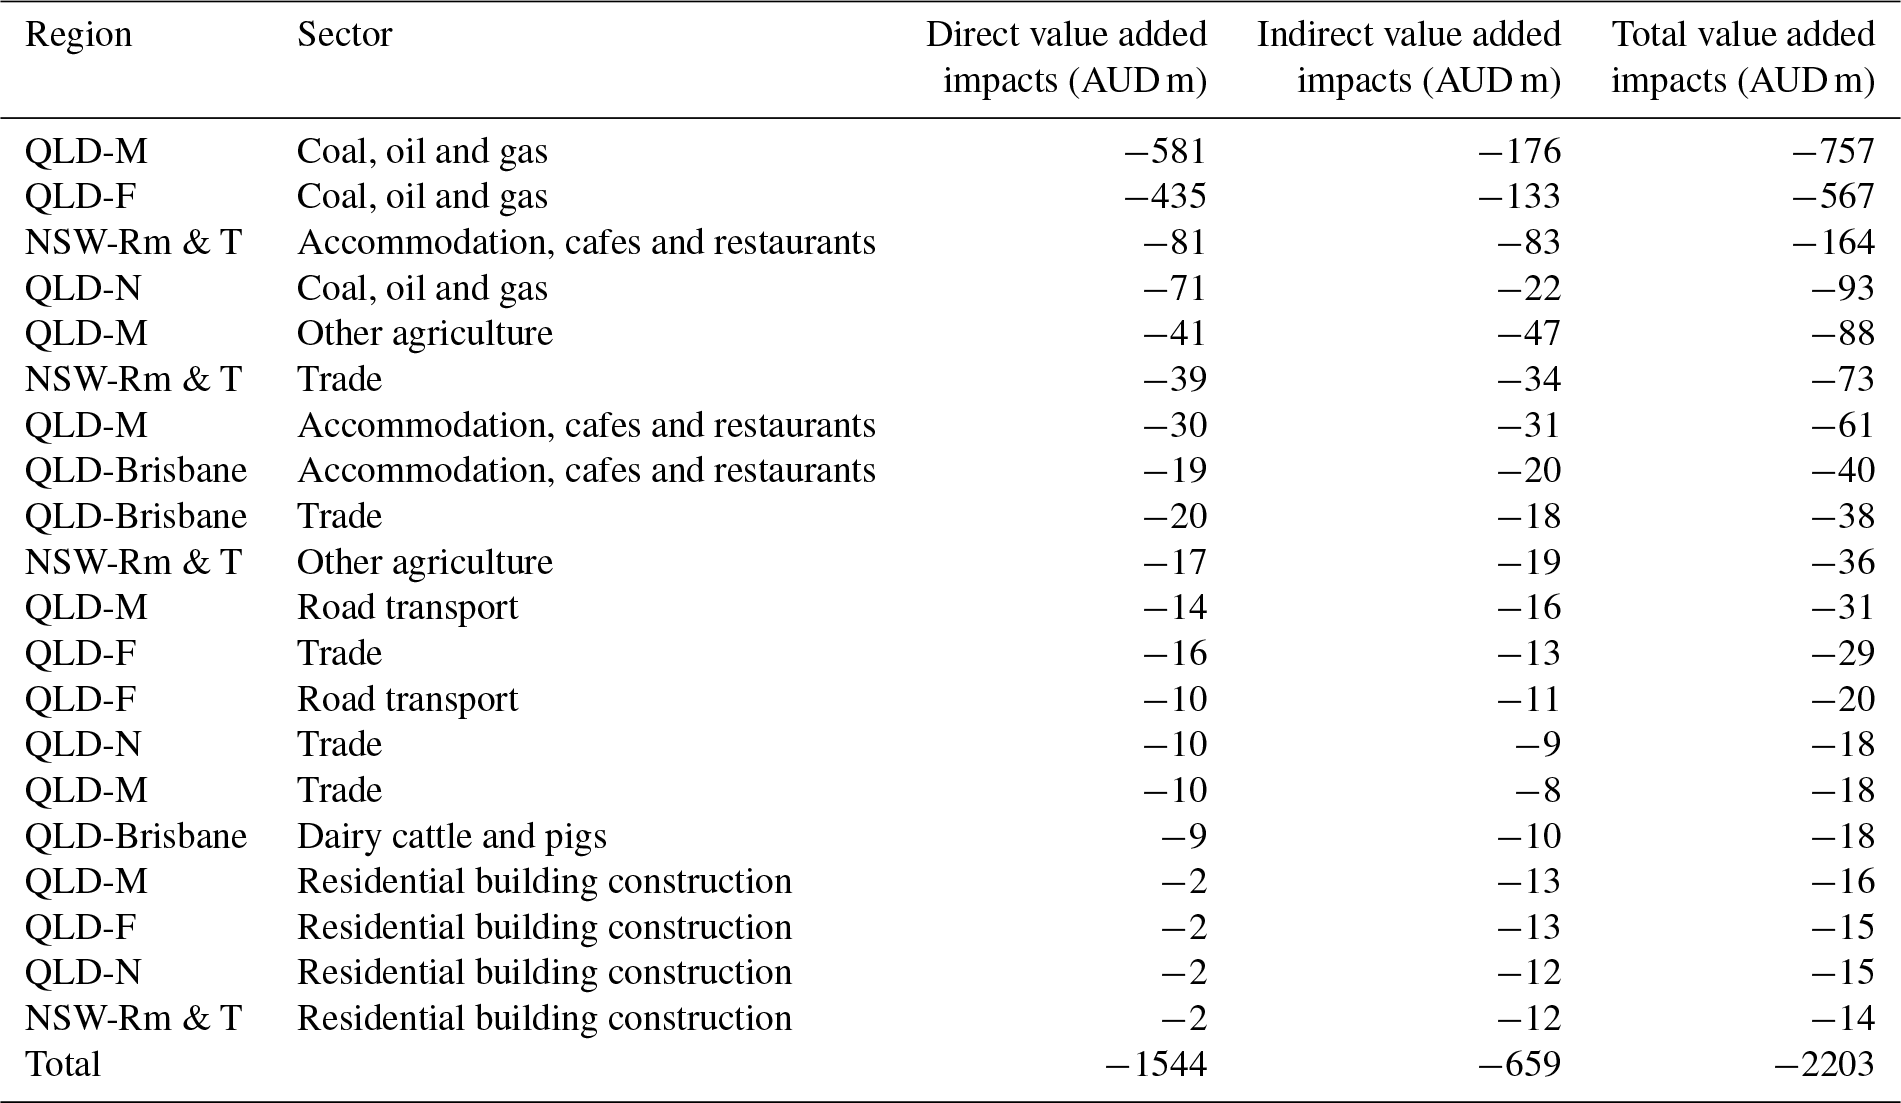
Table 1Summary of major direct impacts (see Sect. S2 for details and sourcing).
2.4.1 Reduction in industry output and creation of the gamma matrix
In order to estimate indirect consequences of Cyclone Debbie, we further developed the method of Schulte in den Bäumen et al. (2015) and created the so-called gamma matrix, a diagonal matrix of fractions Γi (see Eq. 1), describing reduced post-disaster production possibilities (19×34 region-sector pairs). We determined the relative reductions in industry output by (a) sourcing public information on actual or estimated financial damages and (b) dividing these by gross output taken from our MRIO table. Information on damages included (a) the reduction of total industry output (in 2017 compared to 2016), plus (b) an annualised value of infrastructure damage, as explained below. A value of Γi=0.1 indicates a 10 % loss of production value (including related infrastructure costs) from 2016 to 2017. Information on the direct damages by the cyclone was sourced from a range of published government reports, informal enquiries to government offices, government and research websites, media releases and many other media and industry reports and online sources. Table 1 provides a summary of the main impacts – further details and related data sources are provided in Sect. S2.2 in the Supplement, including a summary of infrastructure damage caused by the cyclone shown in Table S2.3 in the Supplement. The reliability of the damage estimates varies, as they were sourced from different data sets. Cross-validation using multiple sources was attempted where possible. This was possible for some major sector groups (notably coal with its close monitoring by government authorities). The rapid nature of the assessment also creates some uncertainties and error potential, and the values should be treated as estimates. Ideally, they should be validated or updated when the more accurate costs become known.
2.4.2 Estimation of infrastructure damage
Infrastructure damage from the cyclone in the state of Queensland was estimated at well over a billion dollars (Queensland Government, 2017). The localities of Mackay and Fitzroy had bridges, roads, airport, community infrastructure, water and wastewater treatment plants that were damaged or destroyed. Severe damage was also noted in Richmond–Tweed (from significant flooding) and in the Brisbane region (over seven bridges were damaged, significant degradation of at least 350 local roads and 200 major culverts etc.), as well as in northern Queensland (see Supplement Sect. S2 for details).
Table 2Entries of the Γ matrix (fractional production losses) including (a) industry output and (b) infrastructure costs annualised over 25 years. Note that a fraction of 0.1 means a 10 % reduction in reduced production (between 2016 and 2017) including both lost productivity plus a share of cost relating to infrastructure damage (annualised over 25 years).

As an innovation of the work of Schulte in den Bäumen et al. (2015), we estimated infrastructure damage and its attribution to sectors of the economy using an “infrastructure gamma matrix” and added this to the matrix describing production shortfalls (Sect. 2.4.1). In addition to the conventional current output losses, we attempted to estimate production shortfalls Δx caused by damages to capital infrastructure such as roads. In principle, gamma matrix entries describing infrastructure damages can be estimated using information on the productivity of capital π, as , where Δci are annual losses of fixed capital inputs. To this end, we approximated capital productivity by the ratio of gross output and gross operating surplus: . Values for annual losses of fixed capital inputs Δci were obtained by annualising the total value of infrastructure damages, using a 25-year time frame for capital depreciation. A similar, more generalised approach has been outlined by Hallegatte (2008). The total production loss coefficients (fractions in Γ) were calculated by adding the current output losses and the losses induced by infrastructure damage (Table 2). The main infrastructure impacts of the cyclone were borne in sectors such as electricity, gas, water, trade, accommodation, cafes, restaurants, road transport, rail and pipeline transport, other transport and communication services.
2.4.3 Qualifications
First, since this study uses Leontief's demand-driven IOA version, we are only able to quantify backward or upstream supply-chain effects, such as impacts from decline of demands due to damages to production facilities and changed consumption possibilities. We are unable to quantify the forward or downstream effects of supply-side shocks, due to the unavailability of non-replaceable production inputs, or substitution effects, due to the unavailability of replaceable production inputs. As such, this study covers only a subset of Oosterhaven (2017) classifications of potential disaster impacts. A more comprehensive but also significantly more data-hungry approach would be to use dynamic CGE modelling; however in this context Steenge and Bočkarjova (2007) warn against overly optimistic assumptions regarding market flexibility and substitution. A promising way forward is the linear programming approach by Oosterhaven and Bouwmeester (2016) in which the authors minimise the information gain between pre- and post-disaster inter-regional IO tables.
Second, in compiling the gamma matrices, damages were only considered where we could find empirical monetary information. With respect to modelling the effect of capital infrastructure damages on production, we were bound by the gamma-matrix formalism of the Steenge-Bočkarjova method. We note that other more detailed and sophisticated modelling frameworks have been used, such as Tsuchiya et al. (2007).
Finally, beneficial effects can result from natural disasters. In Queensland for example, the replacement or repairs to damaged buildings and infrastructure, or any other demand for commodities required especially for post-disaster recovery, is likely to have created additional employment and value added and may have spawned technology updates. In addition, above-average rainfall may have been beneficial for pastures and water supply, and increased freshwater run-off and turbidity could have increased catches of prawn trawling. As no data were available for quantifying such repercussions, these effects are not accounted for in our study.
2.5 Data
We used the Australian Industrial Ecology Virtual Laboratory (IELab; Lenzen et al., 2014) to construct a customised subnational MRIO table (including the input coefficients matrix A and initial total output x0) for Australia with extensive detail on regions directly affected by the cyclone. The IELab is a cloud-computing environment that allows for the construction of customised IO databases. IO tables document the flow of money between various industries in an economy – national IO tables present national data on intra- and inter-industry transactions between industries in a national economy, whereas MRIO tables harbour detailed data on trade between two different regions (Tukker and Dietzenbacher, 2013); see Leontief (1953) for an account of MRIO theory. MRIO tables can either be global or subnational. Global tables feature more than one country and provide detailed data on international trade between countries, whereas subnational MRIO tables provide detailed trade data for regions within one country. These tables have been extensively used for undertaking environmental, social and economic footprint assessments (Alsamawi et al., 2014; Hertwich and Peters, 2009; Lenzen et al., 2012; Oita et al., 2016; Simas et al., 2014; Wiedmann et al., 2013). Coupling of economic MRIO data with so-called physical accounts, as conceived by Nobel Prize winner Wassily Leontief in the 1970s, allows for the enumeration of direct as well as indirect supply-chain impacts (Leontief, 1970, 1966).
The IELab is capable of generating MRIO databases, wherein industry sectors can be distinguished for a number of Australian regions. Users are able to choose from a set of 2214 statistical areas (level 2; ABS, 2016f) to delineate MRIO regions with their specific research question. The regional and sectoral flexibility of the IELab (see Lenzen et al., 2017a) was exploited by generating a regional partition of Australia that is more detailed around the regions where the cyclone caused most of its damage (Queensland and northern New South Wales) and less detailed elsewhere (Fig. 1). As a sectoral breakdown we used the 34-sector industry classification from the Queensland regional IO database (OGS, 2004); see Supplement Sect. S1).
A number of national, state and region-specific data sources were used for constructing the MRIO database used in this work. These are the income, expenditure and product accounts (ABS, 2016c); the IO tables (ABS, 2016b, 2017b) for the national level; the accounts (ABS, 2016a) and the Queensland IO tables (OGS, 2002) for the state level; the household expenditure survey (ABS, 2011); Queensland regional IO tables (OGS, 2004); the business register (ABS, 2016d); the census (ABS, 2012) and the agricultural commodities survey (ABS, 2016g) for the regional level. Detailed regional employment data were taken from the labour force survey (ABS, 2016e).
Table 3Summary of primary economic data used as constraints in compilation of the MRIO. (All values in AUD 2017 unless period otherwise specified).
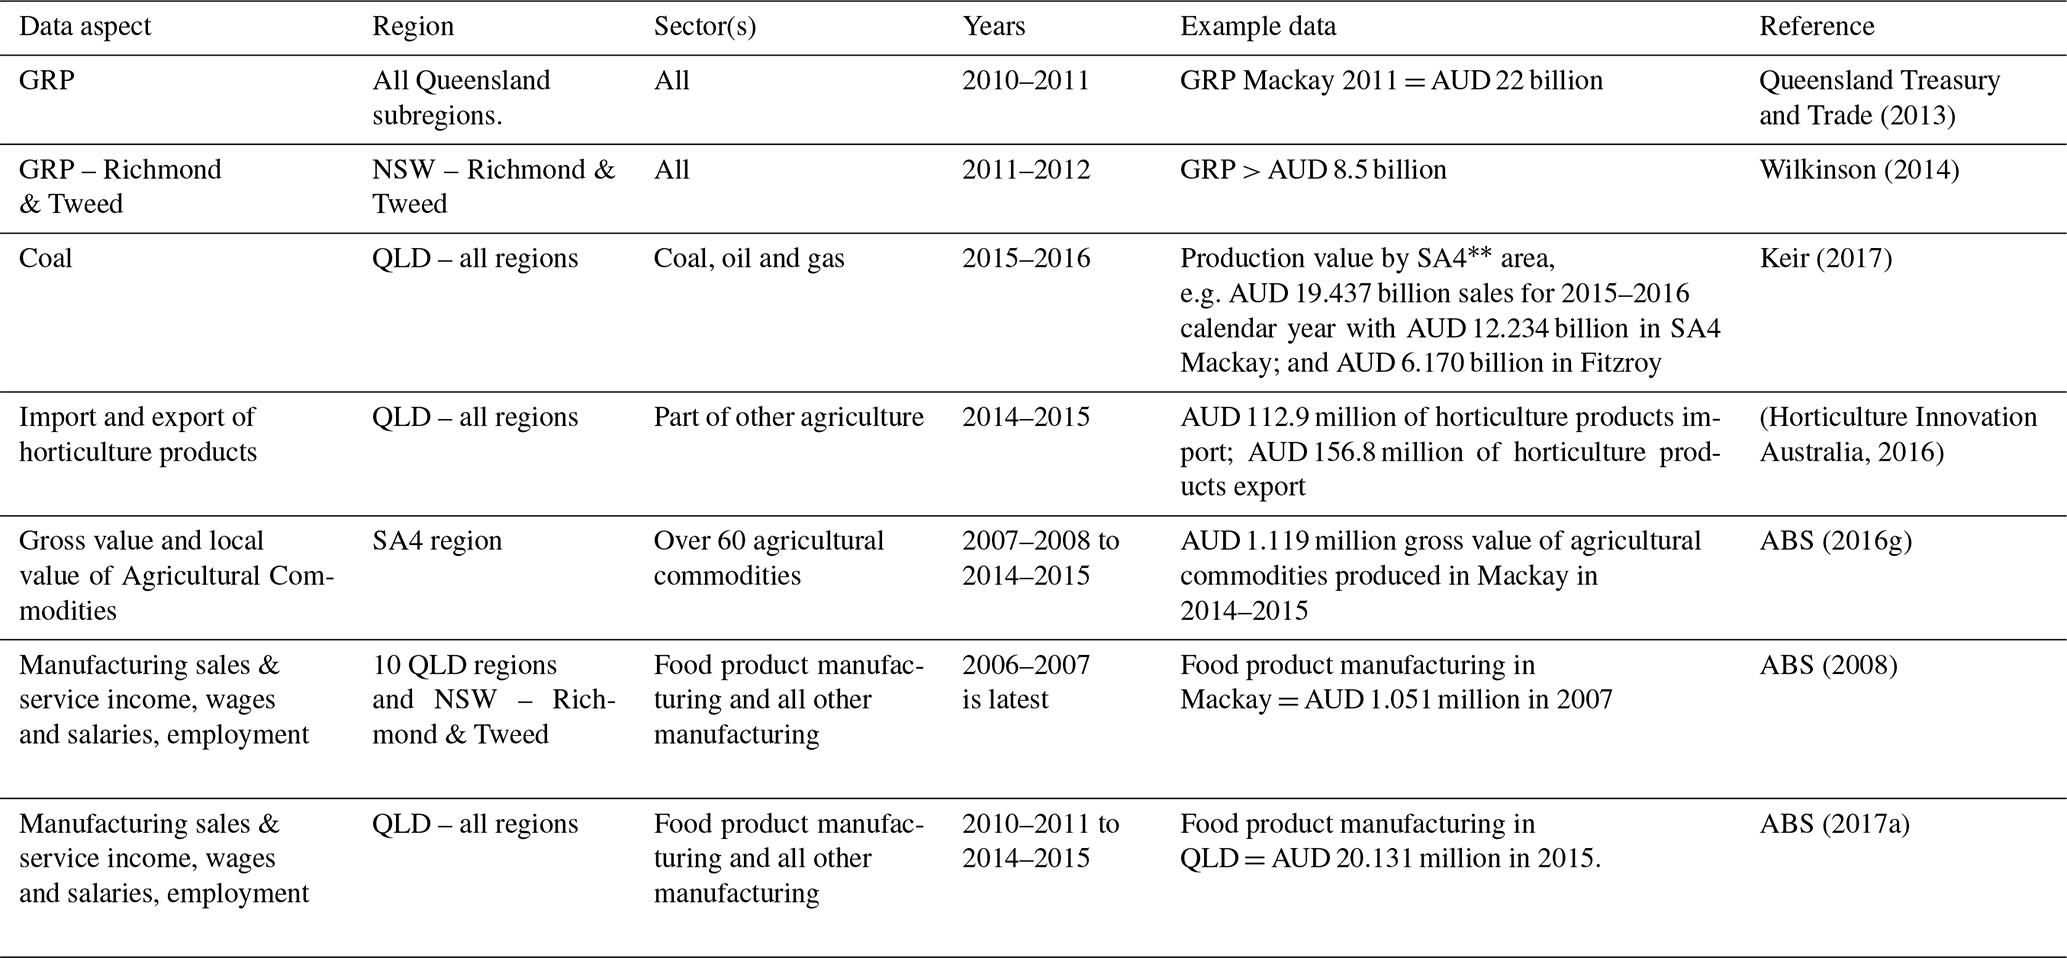
∗ GRP is gross regional product. SA4 is statistical area 4
2.5.1 Primary economic data
In order to be meaningful, any regional IO analysis needs to be supported by specific regional data (see an IELab-based analysis of Western Australia by Lenzen et al. (2017a). We therefore sourced primary economic data to update the IO data for subregions and sectors most affected by Cyclone Debbie, with the most recent financial and economic information available. In particular, data were sought covering value of production, total output, salaries paid, gross operating values, regional export, turnover and regional economic productivity (Table 3). Key resources identified included detailed government analyses of gross regional product in the 10 Queensland regions (Queensland Treasury and Trade, 2013) and northern NSW (Wilkinson, 2014).
Primary data collection was also targeted to those sectors most influenced by the cyclone in order to improve the reliability of the estimate of primary damage. For example, to improve the accuracy of coal productivity data, correspondence and consultation were initiated with the Queensland Department of Natural Resources and Mines. This yielded high-resolution information on production value data at SA4 level (statistical area level 4) across Queensland. Importantly, this also identified which of the study regions produced negligible coal and this information was also included as a constraint in the MRIO balancing process.
Key sources of information included accounts published by the Australian Bureau of Statistics (ABS), e.g. covering the gross value of agriculture and manufacturing sales and wages. Grey literature including regional economic studies, value of production accounts kept by state agencies, and treasury investigations also provided important data within which to constrain the reconciliation of our MRIO base table.
In this section, we first present an analysis of the magnitude of the direct impacts and economic spillovers of Cyclone Debbie (in Sect. 3.1). We then further explore the nature of these spillovers by production layers and by detailed products (Sect. 3.2). Finally, the implications for disaster recovery plans (Sect. 3.3) and the outlook (Sect. 3.4) are discussed.
3.1 Overview of spillovers
Not surprisingly, Tropical Cyclone Debbie wreaked the most intense havoc where it made landfall, in the regions of Mackay (QLD-M), Fitzroy (QLD-F) and northern Queensland (QLD-N), and where heavy rains caused widespread flooding, around Brisbane (QLD-B) and in northern New South Wales (NSW-Rm & T; see Fig. 1). There is not a single region in the remainder of Australia that is unaffected by the cyclone. In the multi-region IO disaster model in Eq. (2), these spillovers come about because businesses experiencing production losses are unable to supply their clients and also cancel orders for their own inputs, thus leaving businesses elsewhere with reduced activity. Our results for indirect damage are obtained from a model and as such might only approximate the damage that really occurred in the regions. However, an application of the same model to a case study in which indirect effects were known (see Fig. 5 in Lenzen et al., 2017b) shows that measured outcomes were reproduced with reasonable accuracy.
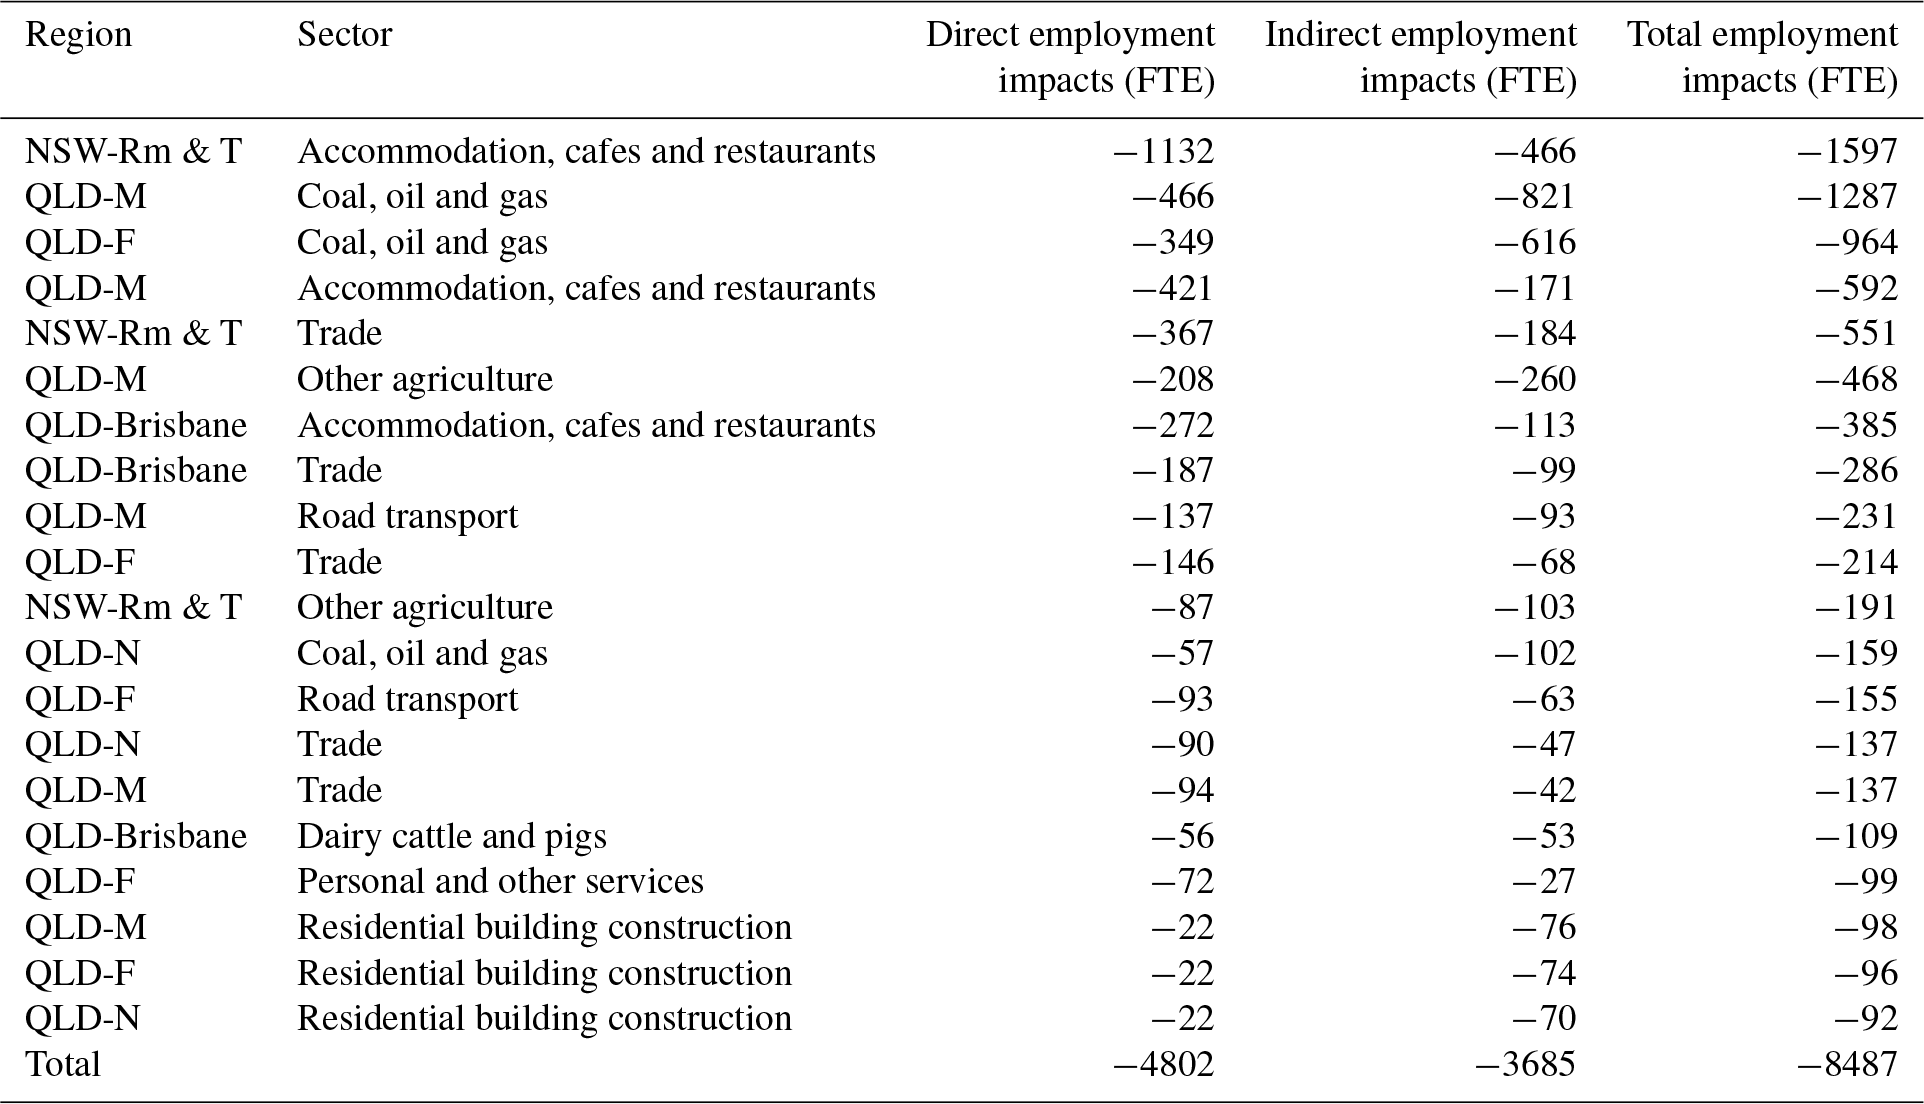
Table 4Direct, indirect and total employment affected by Cyclone Debbie, by state and sector.
Our results show that tropical Cyclone Debbie affected about 8487 jobs (Fig. 2) and caused a loss in value added of about AUD 2.2 billion (Fig. 2). Employment losses are expressed in terms of full-time equivalent (FTE) employment temporarily affected. Full-time equivalent means that part-time jobs are expressed as fractional full-time jobs, so that they are added into a total. The time span of a job disruption may range between a number of weeks, for example for coal mines that could be re-opened soon after the cyclone; (Ker, 2017; Robins, 2017) and 1 year (for example tree crops that will not yield until 1 year later).
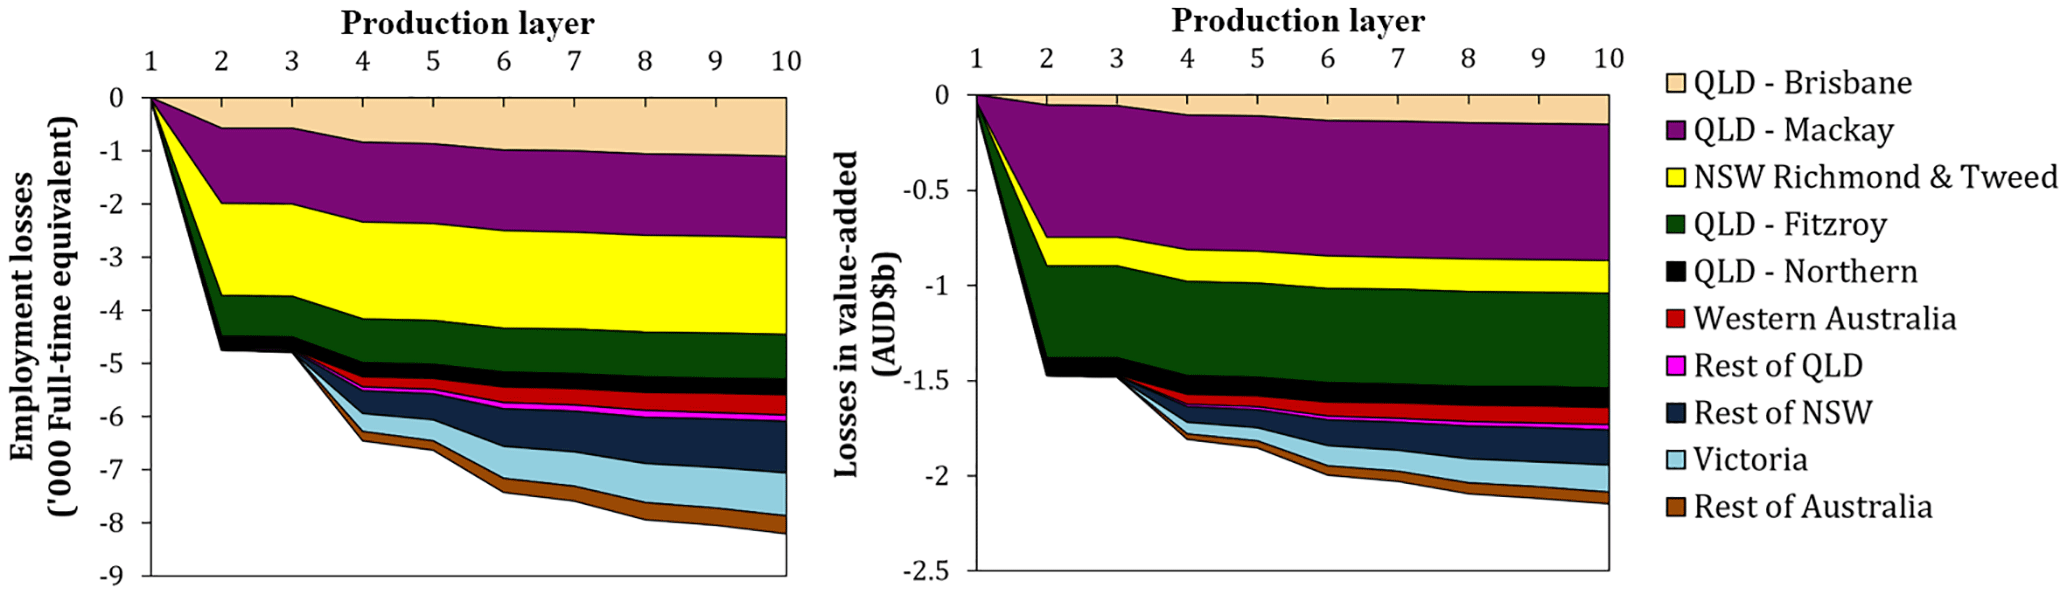
Figure 2Total losses in value added and employment resulting from Tropical Cyclone Debbie for various regions across a number of upstream production layers. The figure shows the first 10 production layers, which are upstream layers of the supply chain (see Sect. S3 for underlying data).
3.2 Spatial analysis of spillovers by production layers and by products
The production layer decomposition defined in Eq. (4) indicates how the direct and spillover impacts of the cyclone unfolded regionally. In Fig. 2, production layers 1 & 2 indicate that the total value-added losses in all regions physically affected were about AUD 1.5 million. In addition, the cyclone caused another AUD 660 million of value-added lost across the supply-chain network of the directly affected businesses. These additional losses are shown in the production layers that follow.
As shown in Fig. 2, about 4800 jobs were directly affected (production layers 1 & 2) and an additional 3700 indirectly (from production layer 2 onward). The combined sectoral and regional spillovers are therefore significant.
While the coastal areas of northern Queensland, Mackay, Fitzroy, Brisbane (in South Queensland) and northern New South Wales (Richmond–Tweed area) were affected immediately by storm and flood damage, repercussions were subsequently felt in the rest of the affected regions and later on within the rest of Australia. Losses in value added and employment cascaded throughout inter-regional supply chains, as subsequent transactions were cancelled. Shortfalls were noticeable even by distant suppliers, removed from directly affected producers by four or more transaction nodes (Fig. 2).
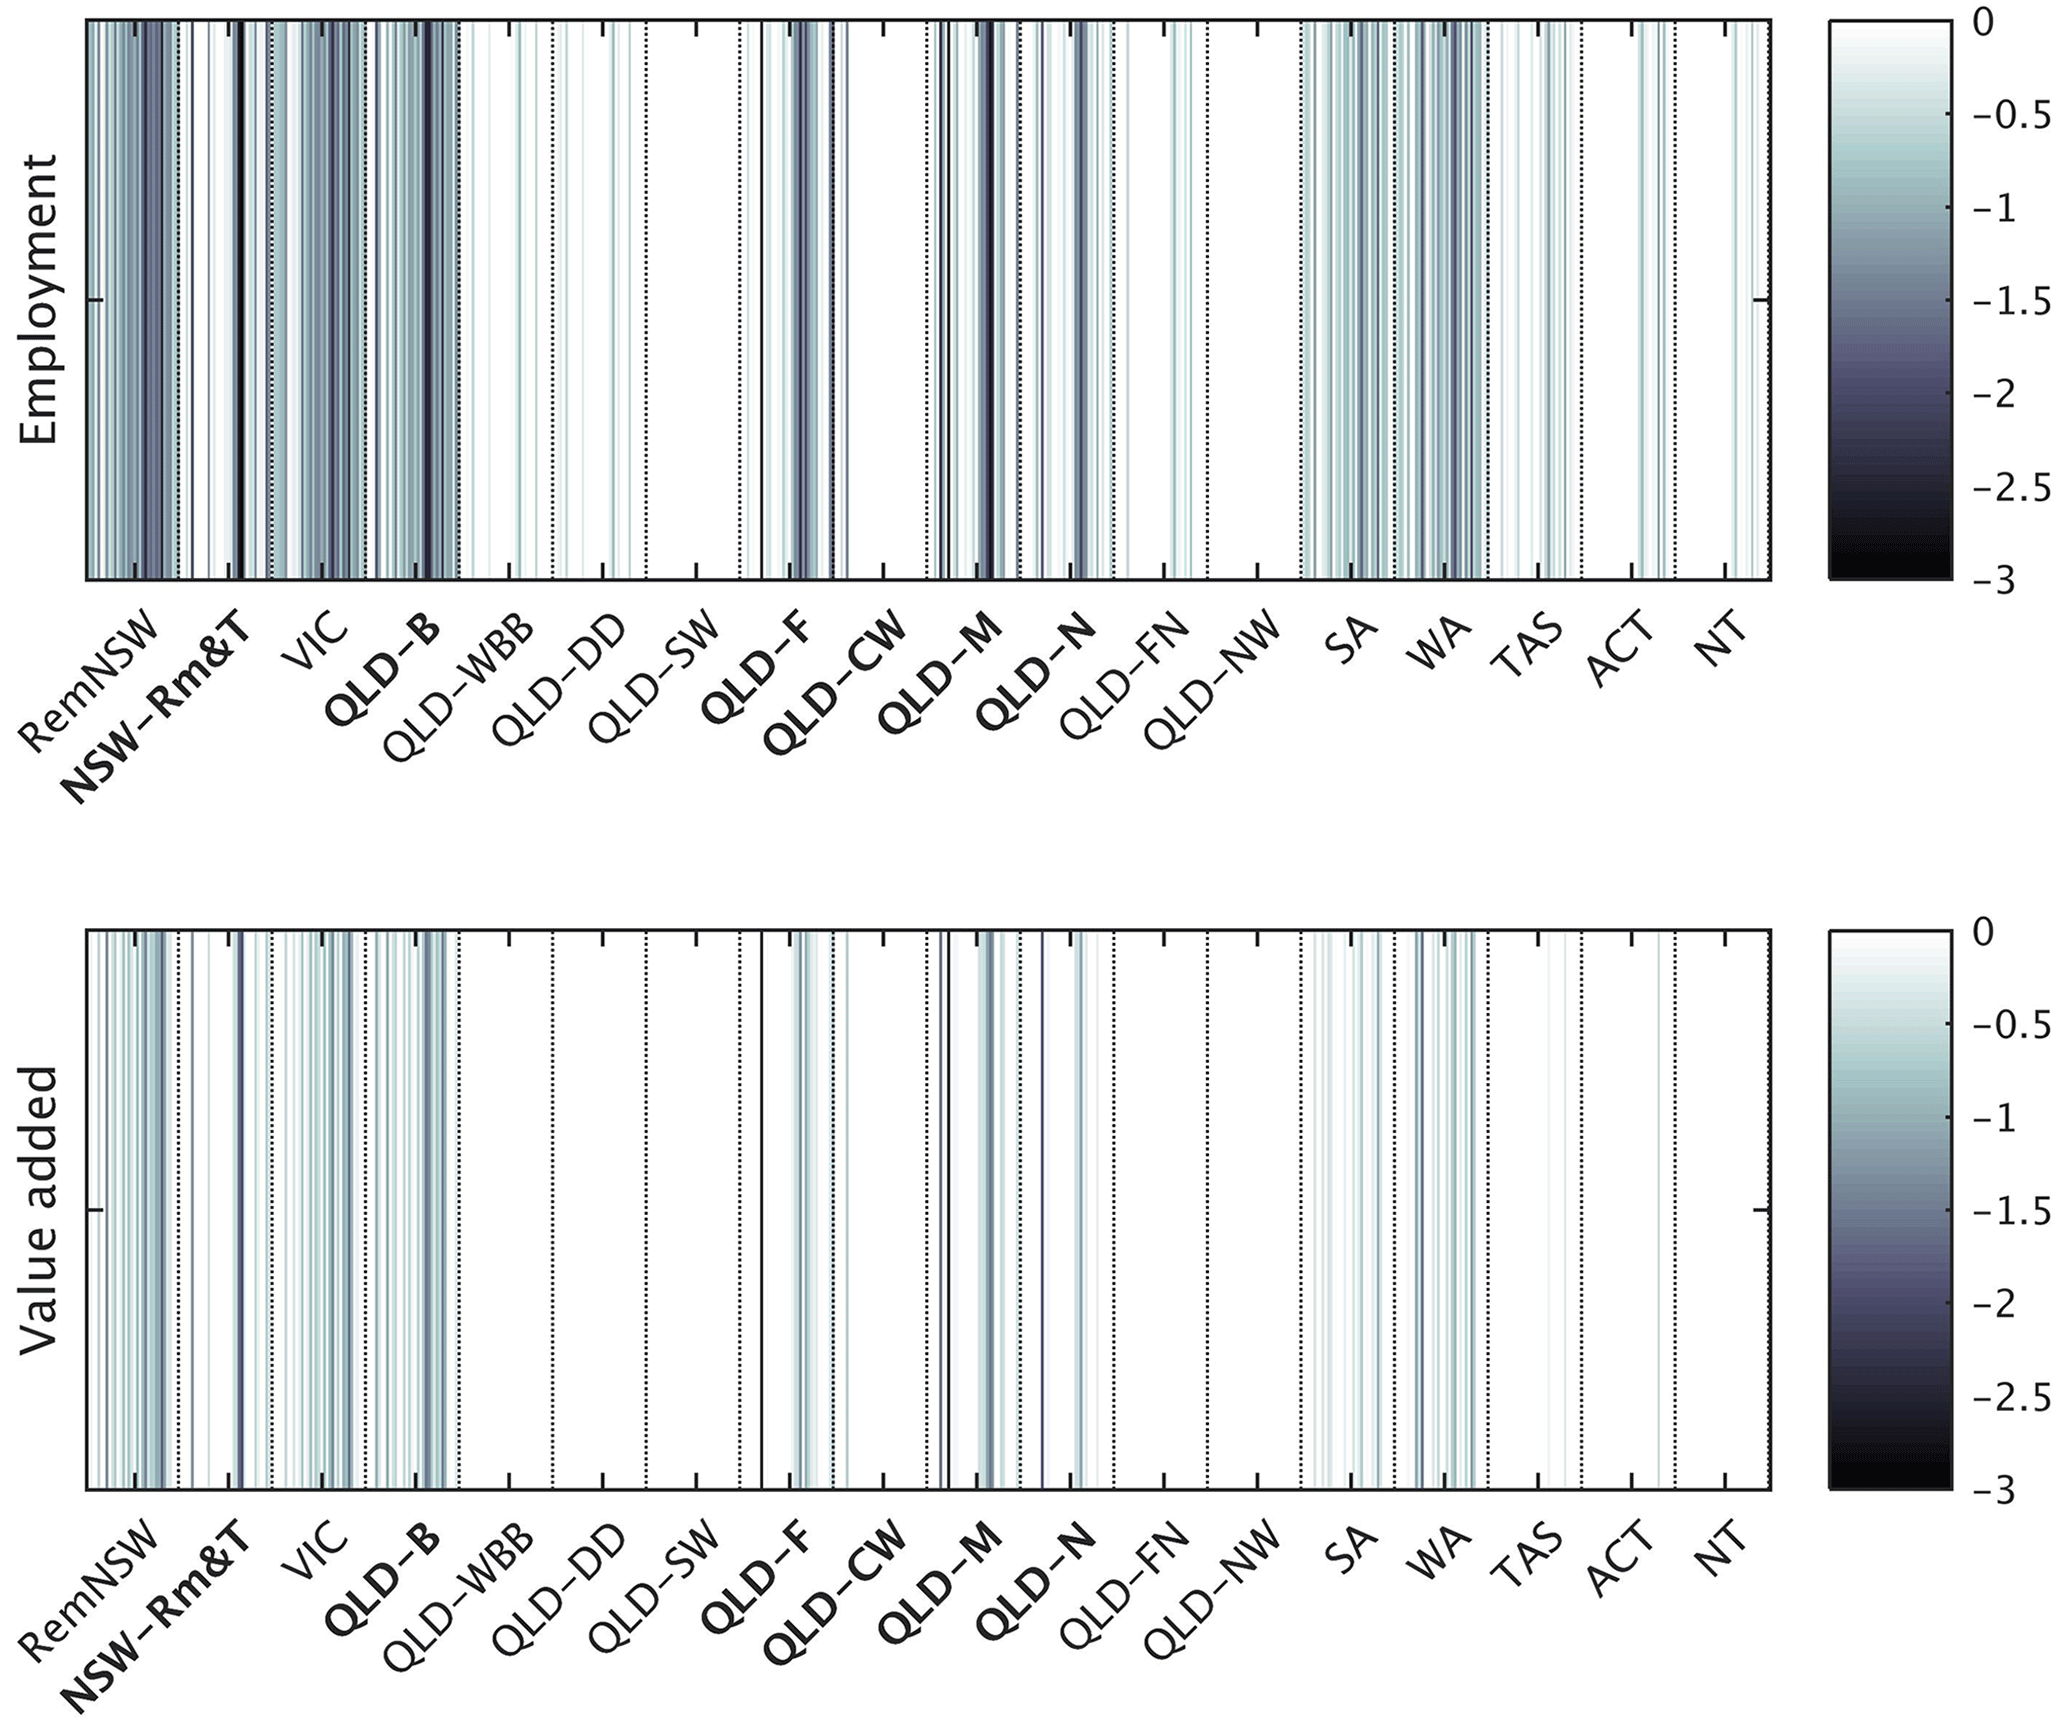
Figure 3Spillover in employment and value-added losses resulting from a tropical cyclone, by state and sector. The magnitude of employment and value-added losses is expressed as log10|ΔQ| and visualised as lines on a grey scale. Each line represents one of the 34 industries in each region, in the sequence order listed in Sect. S1. Region acronyms as in Fig. 1; bold regions are those directly affected. See also Sect. S4.
Our production layer assessment reveals the employment and value-added losses in different layers of production. Each of these layers are comprised of a range of industries. It is important to identify the industries affected in different layers of production. Our assessment shows that while only a selected number of industries and regions were directly affected by the storm and flooding (coal, tourism, sugar cane, road transport, vegetable growing; black stripes in Fig. 3), these direct losses resulted in many more indirect losses in the upstream supply chain. We further analysed the losses in different layers of production (Fig. 2) and identified the top 20 sectors that experienced the greatest total (direct and indirect) employment and value-added losses.
The top-ranking industries affecting employment directly and elsewhere are those connected to tourism (such as accommodation, restaurants, recreational services and retail trade (see Table 4 and Fig. 3). In the Richmond–Tweed area of New South Wales, 1132 jobs were affected directly in accommodation, cafes and restaurants, and about 466 indirectly in other industries and regions due to supply-chain effects (spillover). Similar effects are observed in Mackay and Brisbane in Queensland. The temporary coal mine shutdown in Mackay and Fitzroy affected as many jobs indirectly as directly. Damaged and closed roads affected road transport establishments and almost equally the industries that depended on them. Likewise, value-added losses are observed both directly and indirectly in the upstream supply chain (Table 5).
3.3 Implications for disaster recovery plans
Analysis of the impacts of disasters, such as that undertaken in this paper, can have constructive uptake by informing disaster recovery plans as well as regional plans more generally. In August 2017, the government of the Australian state of Queensland released a management review of Cyclone Debbie and recommended improved Business Continuity Planning (BCP) as a way to build “… business and organisational resilience […] Enhanced BCP within state agencies, businesses and communities will help all to be more resilient to the impact of events. [… and..] should feature permanently in disaster management doctrine.” In addition, the report noted that “BCP needs to consider supply chains, and the numbers and skills of frontline staff required to ensure functioning of critical services”. (IGEM, 2017).
Consideration of the large indirect impacts identified in this article would help to improve future planning while recognising that only part of the impacts of the cyclone have been considered, and that wider analysis of positive and downstream impacts would be beneficial as suggested by Oosterhaven (2017). However, a step forward in consideration of negative upstream impacts could be achieved, for example, by considering the large number of employees indirectly affected by the disaster (as shown in Table 4), and the related services and products they provide. For instance, as shown in Table 4 for the indirect employment impacts for the “Accommodation, cafes and restaurants” sector, some 466 employees providing services were affected in the Richmond–Tweed area. However, this impact is currently not mentioned in disaster recovery planning documents.
Table 5Direct, indirect and total value added affected by Cyclone Debbie, by state and sector.
3.4 Outlook
In this work, we have focused on losses of employment and value added, because these are currently of immediate importance for governments, insurers and the media. Future work could investigate possibilities for restructuring the geography of production and supply-chain networks with the aim of finding more disaster-resilient configurations. In addition, there are variants of IO analytical methods that allow optimal recovery paths to be established (Koks et al., 2016), and these approaches could be integrated into the Australian Industrial Ecology Virtual Laboratory.
Future work could also consider the effects of cyclones beyond national borders. The disruptions of coal exports due to Tropical Cyclone Debbie, for example, caused bottlenecks in Indian and Chinese steel mills (The Barrel, 2017), and during the aftermath of the storm, steel producers were looking for alternative sources of coal such as Russia, Mongolia or Mozambique (Serapio, 2017). Such trade relationships can be taken into account using nested, multi-scale, global multi-region IO frameworks (Bachmann et al., 2015; Tukker and Dietzenbacher, 2013; Wang et al., 2015).
Our approach can be applied to other regions and ultimately extended to include impacts well beyond employment and value added, such as wider environmental or social consequences of disasters. The IELab already has many satellite accounts (and is being expanded) to assess broader environmental and social flow-on effects. The growing number of “virtual laboratories” for IO analysis (Geschke and Hadjikakou, 2017) for countries in disaster-prone zones (Indonesia, Taiwan, China) means that the work described in this paper can be readily applied to other geographical settings.
Powerful tropical cyclones have the ability to cause severe disruptions of economic production that are felt far beyond the areas of landfall and flooding. Here, we used an IO-based analytical tool for enumerating the post-disaster consumption possibilities and ensuing direct and indirect losses of employment and value added as a consequence of the Tropical Cyclone Debbie that hit the Queensland regions of Australia in March and April 2017. Our work contributes an innovative approach for (a) quantifying the impact of disasters in a detailed and timely manner and (b) incorporating infrastructure damages into the assessment of losses in employment and value added.
Our results from this Australian case study suggest that Cyclone Debbie caused substantial damage to spill over into regions and sectors not directly affected: industries directly hit by the cyclone suffered approximately 4802 job losses, but some 3685 jobs were affected in these industries' upstream supply chains. A total of AUD 2203 million losses in value added was observed, AUD 1544 million of which were direct with particular impact around Mackay and Fitzroy, as well as the coastal areas of northern Queensland, Brisbane and northern New South Wales (Richmond–Tweed area). These findings demonstrate that the full supply-chain effects of major disruptions on national economies are significant, and that this type of study will become increasingly important in a future likely to be fraught with extreme weather events, as the frequency and intensity of tropical cyclones increase as a result of climate change (Mendelsohn et al., 2012).
This work demonstrates rapid analysis of the wide indirect impacts of Cyclone Debbie. It shows how significant consequences can be felt as spillovers in regions well outside the landfall and flood zones caused by the cyclone. Our work suggests that improved planning could help account for these impacts, minimise them in future and thereby help transition the affected economies towards greater resilience.
Data are available on request. Please email the corresponding author.
The supplement related to this article is available online at: https://doi.org/10.5194/nhess-19-137-2019-supplement.
The authors declare that they have no conflict of interest.
This work was financially supported by the Australian Research Council
through its Discovery Projects DP0985522 and DP130101293, and the National
eResearch Collaboration Tools and Resources project (NeCTAR) through its
Industrial Ecology Virtual Laboratory VL201. The authors thank Sebastian
Juraszek for expertly managing the Global IELab's advanced computation
requirements, and Charlotte Jarabak for help with collecting data.
Edited by: Bruno Merz
Reviewed
by: two anonymous referees
ABC: http://www.abc.net.au/news/2017-03-28/cyclone-debbie-edges-closer-to-the-mainland/8392702, last access: 20 June 2017.
ABS: Australian Bureau of Statistics, 2008, 8221.0 – Manufacturing Industry, Australia, 2006-07, Australian Bureau of Statistics, Canberra, Australia, ABS Catalogue No. 5215.0.55.001, 2008.
ABS: Census of Population and Housing 2011, Australian Bureau of Statistics, Canberra, Australia, Internet site http://www.abs.gov.au/census, 2012.
ABS: Australian National Accounts – State Accounts, 2015-16, Australian Bureau of Statistics, Canberra, Australia, ABS Catalogue No. 5220.0, 2016a.
ABS: Australian National Accounts, Input-Output Tables (Product Details), 2013-14, Australian Bureau of Statistics, Canberra, Australia, ABS Catalogue No. 5215.0.55.001, 2016b.
ABS: Australian National Accounts: National Income, Expenditure and Product, Sep 2016, Australian Bureau of Statistics, Canberra, Australia, ABS Catalogue No. 5206, 2016c.
ABS: Counts of Australian Businesses, including Entries and Exits, Jun 2011 to Jun 2015, Australian Bureau of Statistics, Canberra, Australia, ABS Catalogue No. 8165.0, 2016d.
ABS: Labour Force, Australia, Detailed - Electronic Delivery, Nov 2016, Australian Bureau of Statistics, Canberra, Australia, ABS Catalogue No. 6291.0.55.001, 2016e.
ABS: National Regional Profile, 2010-14 (data cube Population and People, Statistical Area Levels 2-4, 2014), Australian Bureau of Statistics, Canberra, Australia, ABS Catalogue No. 1379.0.55.001, 2016f.
ABS: Value of Agricultural Commodities Produced, Australia, 2014-15, Australian Bureau of Statistics, Canberra, Australia, ABS Catalogue No. 7503.0, 2016g.
ABS: Australian Industry, 2015-16, Australian Bureau of Statistics, Canberra, Australia, ABS Catalogue No. 8155.0, 2017a.
ABS: Australian National Accounts: Input-Output Tables, 2013-14, Australian Bureau of Statistics, Canberra, Australia, ABS Catalogue No. 5209.0, 2017b.
ABS: Household Expenditure Survey, Australia: Summary of Results, 2009-10, Australian Bureau of Statistics, Canberra, Australia, ABS Catalogue No. 6530.0, 2011.
Alsamawi, A., Murray, J., and Lenzen, M.: The Employment Footprints of Nations: Uncovering Master-Servant Relationships, J. Ind. Ecol., 18, 59–70, 2014.
Anderson, C. W., Santos, J. R., and Haimes, Y. Y.: A risk-based input-output methodology for measuring the effects of the August 2003 northeast blackout, Econ. Syst. Res., 19, 183–204, 2007.
Bachmann, C., Roorda, M. J., and Kennedy, C.: Developing a multi-scale multi-region input-output model, Econ. Syst. Res., 27, 172–193, 2015.
Brown, V.: http://www.news.com.au/lifestyle/food/eat/how-cyclone-debbies-destruction-will-impact-the-cost-of-australias-fresh-produce/news-story/72c2e056322930c3c0dc039ac51ed09c, last access: 7 June 2017.
Cannon, T.: A hazard need not a disaster make: vulnerability and the causes of “natural” disasters, Natural disasters: protecting vulnerable communities, Thomas Telford, London, 92–105, 1993.
Cole, S.: Lifelines and livelihood: a social accounting matrix approach to calamity preparedness, J. Conting. Crisis Man., 3, 228–246, 1995.
Donaghy, K. P., Balta-Ozkan, N., and Hewings, G. J.: Modeling unexpected events in temporally disaggregated econometric input-output models of regional economies, Econ. Syst. Res., 19, 125–145, 2007.
Geschke, A. and Hadjikakou, M.: Virtual laboratories and MRIO analysis – an introduction, Econ. Syst. Res., 29, 143–157, 2017.
Guimaraes, P., Hefner, F. L., and Woodward, D. P.: Wealth and income effects of natural disasters: An econometric analysis of Hurricane Hugo, The Review of Regional Studies, 23, 97–114, 1993.
Haimes, Y. Y., Horowitz, B. M., Lambert, J. H., Santos, J. R., Lian, C., and Crowther, K. G.: Inoperability input-output model for interdependent infrastructure sectors, I: Theory and methodology, J. Infr. Syst., 11, 670–679, 2005.
Hallegatte, S.: An adaptive regional input output model and its application to the assessment of the economic cost of Katrina, Risk Analys., 28, 779–799, 2008.
Hatch, P.: http://www.smh.com.au/business/retail/fears-for-tomato-and-capsicum-supply-after-cyclone-debbie-destruction-20170328-gv8nit.html, last access: 7 June 2017.
Hertwich, E. G. and Peters, G. P.: Carbon footprint of nations: A global, trade-linked analysis, Environ. Sci. Technol., 43, 6414–6420, 2009.
Horticulture Innovation Australia: Australian Horticulture Statistics Handbook 2014–2015, Horticulture Innovation Australia, Sydney, 2016.
IGEM: http://www.parliament.qld.gov.au/documents/tableOffice/TabledPapers/2017/5517T2058.pdf, last access: 10 August 2017.
Keir, K.: Personal Communication with Kathryn Keir, Department of Natural Resources and Mines, 2017.
Ker, P.: http://www.afr.com/business/mining/queensland-coal-miners-facing-disruption-after-debbie-aurizon-sees-earnings-hit-20170403-gvc5qw, last access: 10 June 2017.
Koks, E. E., Carrera, L., Jonkeren, O., Aerts, J. C. J. H., Husby, T. G., Thissen, M., Standardi, G., and Mysiak, J.: Regional disaster impact analysis: comparing input-output and computable general equilibrium models, Nat. Hazards Earth Syst. Sci., 16, 1911–1924, https://doi.org/10.5194/nhess-16-1911-2016, 2016.
Koks, E. E. and Thissen, M.: A Multiregional Impact Assessment Model for disaster analysis, Econ. Syst. Res., 28, 429–449, 2016.
Lenzen, M., Moran, D., Kanemoto, K., Foran, B., Lobefaro, L., and Geschke, A.: International trade drives biodiversity threats in developing nations, Nature, 486, 109–112, 2012.
Lenzen, M., Geschke, A., Malik, A., Fry, J., Lane, J., Wiedmann, T., Kenway, S., Hoang, K., and Cadogan-Cowper, A.: New multi-regional input-output databases for Australia – enabling timely and flexible regional analysis, Econ. Syst. Res., 29, 275–295, 2017a.
Lenzen, M., Geschke, A., Malik, A., Fry, J., Lane, J., Wiedmann, T., Kenway, S., Hoang, K., and Cadogan-Cowper, A.: New multi-regional input-output databases for Australia – enabling timely and flexible regional analysis, Eco. Syst. Res., 29, 275–295, 2017b.
Lenzen, M., Geschke, A., Wiedmann, T., Lane, J., Anderson, N., Baynes, T., Boland, J., Daniels, P., Dey, C., Fry, J., Hadjikakou, M., Kenway, S., Malik, A., Moran, D., Murray, J., Nettleton, S., Poruschi, L., Reynolds, C., Rowley, H., Ugon, J., Webb, D., and West, J.: Compiling and using input-output frameworks through collaborative virtual laboratories, Science Tot. Environ., 485, 241–251, 2014.
Leontief, W.: Input-output economics, Oxford University Press, USA, 1966.
Leontief, W.: Environmental repercussions and the economic structure: an input-output approach, The Review of Economics and Statistics, 1970. 262–271, 1970.
Leontief, W.: Interregional theory, in: Studies in the Structure of the American Economy, edited by: Leontief, W., Chenery, H. B., Clark, P. G., Duesenberry, J. S., Ferguson, A. R., Grosse, A. P., Grosse, R. N., Holzman, M., Isard, W., and Kistin, H., Oxford University Press, New York, NY, USA, 1953.
Lesk, C., Rowhani, P., and Ramankutty, N.: Influence of extreme weather disasters on global crop production, Nature, 529, 84–87, 2016.
Li, J., Crawford Brown, D., Syddall, M., and Guan, D.: Modeling imbalanced economic recovery following a natural disaster using input-output analysis, Risk Analysis, 33, 1908–1923, 2013.
Lian, C. and Haimes, Y. Y.: Managing the risk of terrorism to interdependent infrastructure systems through the dynamic inoperability input–output model, Syst. Eng., 9, 241–258, 2006.
Mendelsohn, R., Emanuel, K., Chinabayashi, S., and Bakkensen, L.: The impact of climate change on global tropical cyclone damage, Nat. Clim. Change, 2, 205–209, 2012.
OGS: Queensland Input-Output Tables, 1996-97, 107 Industries, Office of the Government Statistician, Queensland Government, Brisbane, Australia, 2002.
OGS: Queensland Regional Input-Output Tables, 1996-97, 34 Industries, Office of the Government Statistician, Queensland Government, Brisbane, Australia, 2004.
Oita, A., Malik, A., Kanemoto, K., Geschke, A., Nishijima, S., and Lenzen, M.: Substantial nitrogen pollution embedded in international trade Nature, Geoscience, 9, 111–115, 2016.
Okuyama, Y.: Modeling spatial economic impacts of an earthquake: Input-output approaches, Disaster Prevention and Management, An International Journal, 13, 297–306, 2004.
Okuyama, Y.: Economic Modeling for Disaster Impact Analysis: Past, Present, and Future, Econ. Syst. Res., 19, 115–124, 2007.
Okuyama, Y.: Disaster and economic structural change: Case study on the 1995 Kobe earthquake, Econ. Syst. Res., 26, 98–117, 2014.
Okuyama, Y. and Santos, J. R.: Disaster impact and input-output analysis, Econ. Syst. Res., 26, 1–12, 2014.
Oosterhaven, J.: On the limited usability of the inoperability IO model, Econ. Syst. Res., 29, 452–461, 2017.
Oosterhaven, J. and Bouwmeester, M. C.: A new approach to modeling the impact of disruptive events, J. Reg. Sci., 56, 583–595, 2016.
Parnell, S.: http://www.theaustralian.com.au/news/nation/cyclone-debbie-food-and-water-running-short-with-power-outages/news-story/d03cf40ae74e535f3e73cc55011c33bf, last access: 6 June 2017.
Prideaux, B.: The need to use disaster planning frameworks to respond to major tourism disasters: Analysis of Australia's response to tourism disasters in 2001, J. Travel Tour. Mark., 15, 281–298, 2004.
Queensland Government: The State Recovery Plan 2017-19. Operation Queensland Recovery. Working to recover, reconnect and rebuild more resilient Queensland communities following the effects of Severe Tropical Cyclone Debbie, Queensland Government, Brisbane, 2017.
Queensland Treasury and Trade: Experimental Estimates of Gross Regional Product 2000-01, 2006-07 and 2010-11, Queensland Treasury and Trade, Brisbane, 2013.
Regional Institute of Australia: Rethinking the Future of Northern Australia's Regions, Regional Research Report, Canberra, 2013.
Robins, B.: http://www.smh.com.au/business/cyclone-debbie-coal-disruption-set-to-ease-20170407-gvg1x2.html, last access: 10 June 2017.
Rose, A.: Economic principles, issues, and research priorities in hazard loss estimation, edited by: Okuyama, Y. and Chang, S. E., Modeling Spatial and Economic Impacts of Disasters, New York, Springer, 2004.
Rose, A. and Miernyk, W.: Input-output analysis: the first fifty years, Econ. Syst. Res., 1, 229–271, 1989.
Rose, A. and Guha, G.-S.: Computable general equilibrium modeling of electric utility lifeline losses from earthquakes, in: Modeling spatial and economic impacts of disasters, Springer, 2004.
Rose, A. and Liao, S. Y.: Modeling regional economic resilience to disasters: A computable general equilibrium analysis of water service disruptions, J. Reg. Sci., 45, 75–112, 2005.
Rose, A. Z.: A framework for analyzing the total economic impacts of terrorist attacks and natural disasters, J. Homeland Sec. Emerg. Manage., 6, 1547–7355, https://doi.org/10.2202/1547-7355.1399, 2009.
Santos, J. R. and Haimes, Y. Y.: Modeling the Demand Reduction Input Output (IO) Inoperability Due to Terrorism of Interconnected Infrastructures, Risk Analys., 24, 1437–1451, 2004.
Santos, J. R., May, L., and Haimar, A. E.: Rist Based Input Output Analysis of Influenza Epidemic Consequences on Interdependent Workforce Sectors, Risk Analys., 33, 1620–1635, 2013.
Santos, J. R., Orsi, M. J., and Bond, E. J.: Pandemic Recovery Analysis Using the Dynamic Inoperability Input Output Model, Risk Analys., 29, 1743–1758, 2009.
Schulte in den Bäumen, H., Moran, D., Lenzen, M., Cairns, I., and Steenge, A.: How severe space weather can disrupt global supply chains, Nat. Hazards Earth Syst. Sci., 14, 2749–2759, https://doi.org/10.5194/nhess-14-2749-2014, 2014.
Schulte in den Bäumen, H., Többen, J., and Lenzen, M.: Labour forced impacts and production losses due to the 2013 flood in Germany, J. Hydrol., 527, 142–150, 2015.
Serapio, M.: With Australia's supply disrupted by Cyclone Debbie, coal buyers race elsewhere, in: Sydney Morning Herald, 2017.
Simas, M. S., Golsteijn, L., Huijbregts, M. A., Wood, R., and Hertwich, E. G.: The “Bad Labor” Footprint: Quantifying the Social Impacts of Globalization, Sustainability, 6, 7514–7540, 2014.
Staff, A. G.: http://www.australiangeographic.com.au/topics/science-environment/2017/03/how-will-cyclone-debbie-compare-to-australias-worst-cyclones-in-history, last access: 5 June 2017.
Steenge, A. E. and Bočkarjova, M.: Thinking about imbalances in post-catastrophe economies: an input-output based proposition, Econ. Syst. Res., 19, 205–223, 2007.
Suh, S.: Handbook of Input-Output Economics in Industrial Ecology, Springer, 2009.
Suh, S. and Nakamura, S.: Five years in the area of input-output and Hybrid LCA, Int. J. Life Cycle Ass., 12, 351–352, 2007.
Temmerman, S., Meire, P., Bouma, T. J., Herman, P. M., Ysebaert, T., and De Vriend, H. J.: Ecosystem-based coastal defence in the face of global change, Nature, 504, 79–83, 2013.
The Barrel: Cyclone Debbie swings China into metallurgical coal supplier, http://blogs.platts.com/2017/04/27/cyclone-debbie-swings-china-metallurgical-coal-supplier/. in: The Barrel: The essential perspective on global communities 2017.
Timmer, M. P., Erumban, A. A., Los, B., Stehrer, R., and de Vries, G. J.: Slicing Up Global Value Chains, J. Econ. Pers., 28, 99–118, 2014.
Tsuchiya, S., Tatano, H., and Okada, N.: Economic loss assessment due to railroad and highway disruptions, Econ. Syst. Res., 19, 147–162, 2007.
Tukker, A. and Dietzenbacher, E.: Global multiregional input-output frameworks: An introduction and outlook, Econ. Syst. Res., 25, 1–19, 2013.
Underwriter, C.: Insured losses from Cyclone Debbie reach AUD 306 million: Insurance Council of Australia, Canadian Underwriter, 4 April 2017.
Wang, Y., Geschke, A., and Lenzen, M.: Constructing a time series of nested multiregion input-output tables, Int. Reg. Science Rev., 38, 1–24, 2015.
Waugh, F. V.: Inversion of the Leontief matrix by power series, Econometrica, 18, 142–154, 1950.
Wiedmann, T.: Carbon footprint and input-output analysis: an introduction, Econ. Syst. Res., 21, 175–186, 2009.
Wiedmann, T. O., Schandl, H., Lenzen, M., Moran, D., Suh, S., West, J., and Kanemoto, K.: The material footprint of nations, Proc. Natl. Acad. Sci., 20, 6271–6276, 2013.
Wilkinson, J.: E-brief 2014 The Richmond-Tweed Region: An Economic Profile, NSW Parliamentary Research Service, Sydney, 2014.
Yamano, N., Kajitani, Y., and Shumuta, Y.: Modeling the regional economic loss of natural disasters: the search for economic hotspots, Econ. Syst. Res., 19, 163–181, 2007.