the Creative Commons Attribution 4.0 License.
the Creative Commons Attribution 4.0 License.
 | 18 Jul 2019
Wildland fire potential outlooks for Portugal using meteorological indices of fire danger
Carlos C. DaCamara
Kamil F. Turkman
Teresa J. Calado
Ricardo M. Trigo
Maria A. A. Turkman
Portugal is recurrently affected by large wildfire events that have serious impacts at the socio-economic and environmental levels and dramatic consequences associated with the loss of lives and the destruction of the landscape. Accordingly, seasonal forecasts are required to assist fire managers, thus contributing to alter the historically based purely reactive response. In this context, we present and discuss a statistical model to estimate the probability that the total burned area during summer will exceed a given threshold. The statistical model uses meteorological information that rates the accumulation of thermal and vegetation stress. Outlooks for the 39-year study period (1980–2018) show that, when the statistical model is applied from 26 May to 30 June, out of the six severe years, only one year is not anticipated as potentially severe and, out of the six weak years, only one is not anticipated as potentially weak. The availability of outlooks of wildfire potential with an anticipation of up to 1 month before the starting of the fire season, such as the one proposed here, may serve to provide clear directions for the fire community when planning prevention and combating fire events.
- Article
(880 KB) - Full-text XML
- BibTeX
- EndNote


Portugal is regularly affected by very large and destructive wildfires that represent a serious threat to human lives and to the territory, and have very strong and adverse impacts at the social, economic, ecologic and environmental levels that include human casualties, the destruction of homes and other structures, damages to forests, agricultural fields, shrublands, and livestock, changes in the landscape and emission of greenhouse gases (Costa et al., 2011; Pereira et al., 2011). According to the European Commission technical report about forest fires in Europe (San-Miguel-Ayanz et al., 2018), from 1980 to 2017, Portugal accounted for 26 % of the total burned area in the five southern member states (Portugal, Spain, Italy, Greece and France). However, this figure increases to 42 % when restricting to the last decade. The extreme year of 2017 deserves a special emphasis with Portugal accounting for 59 % of the burned area in the five southern member states, despite representing 6 % of the total area of the countries.
As in Mediterranean Europe, fire activity in Portugal involves complex interactions among climate, vegetation and humans (Lavorel et al., 2006; Costa et al., 2010). Persistent warm and dry conditions followed by heat spells in summer provide the optimal meteorological background to the onset and spread of large fire events (Pereira et al., 2005; Trigo et al., 2006; DaCamara et al., 2014) that take place in a landscape of cumulated biomass and increased fuel connectivity as a result of agricultural abandonment and forest expansion (Pausas and Fernández-Muñoz, 2012; Fernandes et al., 2014; Viedma et al., 2015; Oliveira et al., 2017). In addition, Portugal has the highest density of ignitions in southern Europe, with human presence and activity being the key drivers of ignitions, most of them associated with land management practices and inadequate use of fire (Catry et al., 2009). Finally, the impacts of climate change cannot be disregarded since a future warmer climate will instigate a larger number of severe wildfire episodes (Flannigan et al., 2013; Sousa et al., 2015). In this context, the catastrophic fires of June 2017 in Portugal (with 65 fatalities) associated with the strongest heatwave ever observed over Iberia in June provide a stark reminder of the growing likelihood of these events under the current warming climate (Sánchez-Benítez et al., 2018).
The magnitude of the problems related to fire activity in Portugal has motivated the scientific and technical communities to cooperate with forest managers, firefighters and the fire community with the aim of improving the understanding of the fire regime in Portugal and develop better tools that will help prevent and mitigate the impacts of severe fire events (Collins et al., 2013; Oliveira et al., 2016).
Outlooks of wildfire potential for different regions of the globe are usually based on statistical approaches (e.g. Gudmundsson et al., 2014; Turco et al., 2017) or, alternatively, using fire weather predictions a few months in advance based on dynamical seasonal forecasts by atmospheric circulation models (Anderson et al., 2007; Turco et al., 2018). For instance, the European Forest Fire Information System (EFFIS), one of the components of the Emergency Management Services in the EU Copernicus programme, is currently disseminating maps (as experimental products) of long-term seasonal forecasts of temperature and rainfall anomalies based on the European Centre for Medium-Range Weather Forecasts (ECMWF) Seasonal Forecasting System (System 4). However, as pointed out by Bedia et al. (2018), although there is significant skill in predicting 1 month ahead for above-average summer fire weather in some parts of south-eastern Europe, skill is in general quite poor elsewhere.
As an alternative, the aim of this paper is to describe and discuss a model that allows outlooks of wildfire potential in Portugal during the fire season up to 1 month in advance based on a statistical approach that integrates information about meteorological fire danger before and during the fire season. The rationale is that soil moisture deficit and drought have an impact on the increased frequency and can amplify the magnitude of hot summer extreme events in the Mediterranean (Vautard et al., 2007; Hirschi et al., 2011). Thus, persistent warm and dry conditions along the pre-fire season induce thermal and water stress on vegetation, making the landscape more prone to the occurrence of very severe fire episodes. At the same time, these conditions increase the likelihood of heatwave spells that steer the onset and propagation of large fires (Gudmundsson et al., 2014; Turco et al., 2017). The procedure involves three steps. First we set up a null model of burned area (BA) during the fire season (where no meteorological information is incorporated); then we set up a diagnostic model of BA that incorporates meteorological information during the pre-fire and the fire seasons; finally we set up a prognostic model of BA that only incorporates meteorological information before the fire season. We then show that both the diagnostic and the prognostic models perform better than the null model and that the loss in performance of the prognostic model (when compared to the diagnostic one) is relatively small, namely in respect to its capacity to anticipate fire seasons characterized by high amounts of BA. Section 2 provides a description of data and methods, and results are presented in Sect. 3. Finally, discussion of results and conclusions are drawn in Sect. 4.
The area of interest is defined as the territory of Portugal and the study covers the 39-year period from 1980 to 2018. Data of BA consist of yearly amounts of cumulated BA in July and August, hereby referred to as the fire season. BA data are derived from the official Portuguese Rural Fire Database provided by the national authority for forests (ICNF). The database contains more than half a million records of fire events, with information of total burned area, date and time of ignition and extinction, and spatial location of the starting point. Details about the database are provided in Pereira et al. (2011). Cumulated BA in the fire season accounts for more than 70 % of the total burned area in Portugal (Pereira et al., 2013), and more than 80 % of extreme fire days (defined as the top 5 % in terms of radiative energy released by wildfires) occur in July and August (DaCamara and Trigo, 2018).
Information about meteorological fire danger consists of daily values of the Daily Severity Index (DSR) covering the months of April to August. DSR is an extension of the Canadian Forest Fire Weather Index System (CFFWIS) and rates the difficulty of controlling fires (van Wagner, 1987). This index has been successfully used to model BA variability in Portugal at daily and monthly scales (Calado et al., 2008; Pereira et al., 2013). DSR results from a direct transformation of the Fire Weather Index (FWI), the last of the six components of CFFWIS, according to the relation DSR=0.0272 (FWI)1.77. This transformation weights FWI sharply as it increases so that DSR becomes more suitable than FWI to be cumulated or averaged. For each day, the six components are computed based on consecutive daily observations of meteorological parameters of the previous days, namely temperature, relative humidity, wind speed and 24 h cumulated precipitation (Wang et al., 2015). In this study, meteorological parameters consist of gridded daily values at 12:00 UTC of 2 m temperature, relative humidity, wind speed and 24 h cumulated precipitation that were obtained from the ERA-Interim reanalysis dataset (Dee et al., 2011) issued by ECMWF. As described in Pinto et al. (2018), the original ERA-Interim data were re-projected onto the normalized geostationary projection (NGP) of Meteosat Second Generation (MSG) (EUMETSAT, 1999), with an average pixel size of about 4 km × 4 km over Portugal. Daily values of DSR for Portugal were then obtained by averaging over all grid points located within the study area.
As discussed in Pereira et al. (2005), the interannual variability of BA in Portugal is modulated by two kinds of meteorological factors, namely the temperature and precipitation regimes during the pre-fire season and the occurrence of hot and dry spells during the fire season. Following Nunes et al. (2014), the period from April to August is accordingly divided into two subperiods: (1) the pre-fire season that runs from 1 April (day 1) up to 30 June (day 91) and (2) the fire season that runs from 1 July (day 1) up to 31 August (day 62).
For each year of the period 1980–2018, meteorological fire danger at day d of the pre-fire season (pfs) of the considered year is rated by index Dpfs(d), defined as the cumulative value of daily DSR since 1 April:
where DSRi is the value of DSR at day i. As d runs along the pre-fire season of the year considered, progressively more information is integrated in Dpfs(d) about past daily meteorological fire danger.
In turn, meteorological fire danger of the fire season (fs) of each year of the period 1980–2018 is rated by index Dfs, defined as the square root of the mean squared anomalies performed over days characterized by a positive anomaly of DSR:
where H[x] is the Heaviside step function ( and
is the anomaly of DSR at day j of the considered year, which is defined as the departure of DSR from the climatological mean for day j (as obtained by averaging DSR for that day over the 39-year period 1980–2018).
The temperature and precipitation regimes during the pre-fire season are quantified by Dpfs(d), where, for a given day d of the pre-fire season, large values indicate persistent warm and/or dry conditions up to day d, inducing thermal and water stress on vegetation and a shortage of water in the soil. The impact of hot and dry spells during the fire season is in turn quantified by Dfs, which is very sensitive to the occurrence, during the considered fire season, of very large positive anomalies of DSR that are usually associated with heatwaves (Gudmundsson et al., 2014; Turco et al., 2017).
For each day d, the 39 values of Dpfs(d) for the period 1980–2018 were normalized by subtracting the respective sample mean and then dividing by the sample standard deviation. Values of Dfs were also normalized by subtracting the sample mean and dividing by the sample standard deviation. Obtained normalized indices of Dpfs(d) and Dfs will be hereby denoted as ψ(d) and χ, respectively.
The following types of models are considered in this study:
-
a null model , where X is the considered variable and μX and σX are the mean and the standard deviation to be estimated, respectively;
-
a nested model with two covariates , where the mean of the normal distribution linearly depends on covariates A and B, with a, b and c being parameters to be estimated;
-
the previous nested model then simplified to a nested model with just one covariate , where the mean of the normal distribution linearly depends on covariate A, and p and q are parameters to be estimated.
Using the maximum likelihood method (Wilks, 2011), estimates of parameters μX, σX, p, q, a, b and c are obtained as follows from sample where n is the size of the sample.
Here , var( ) and cov( ) respectively denote the mean, the variance and the covariance operators.
In the case of the null model, the Lilliefors test (Conover, 1980) is used to test the null hypothesis that the data come from a normal distribution. In the case of the nested models with covariates, the likelihood ratio test (Wilks, 1938) is used to decide on the null hypothesis that the null model is to be retained (against the alternate model under consideration).
3.1 Null model
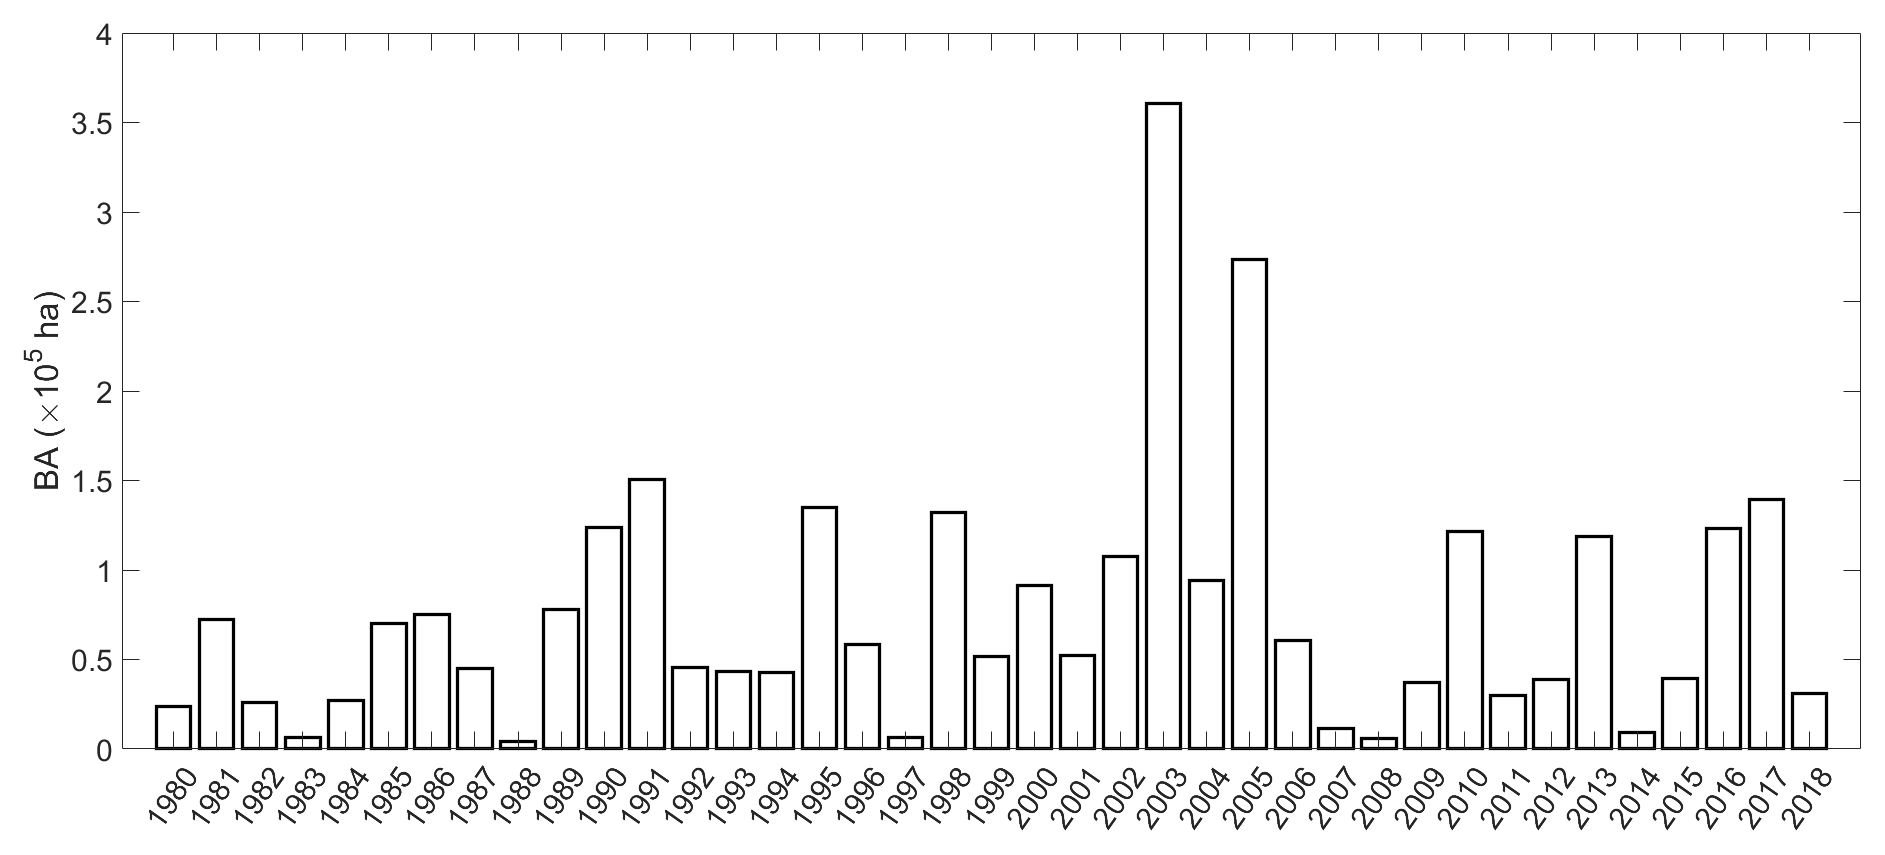
The time series of cumulated BA in the fire season for the period 1980–2018 (Fig. 1) presents very large interannual variability, the extremely high amounts of 2003 and 2005 contrasting with the extremely low values that were observed in 1983, 1988, 1997 and 2008. It is worth noting that 2017, the year with the largest record in total BA (circa 450 000 ha), only ranks fourth when restricting to July and August because the largest fire events took place outside of the fire season, in June and October (Sánchez-Benítez et al., 2018).
The decimal logarithm of cumulated BA in the fire season follows a normal distribution model (Fig. 2); the null hypothesis that the sample of log 10BA comes from a normal distribution is not rejected at the 5 % significance level by the Lilliefors test (p value of 0.21). We therefore have the following null model:
with μBA=4.69 and σBA=0.46 as using the maximum likelihood method.
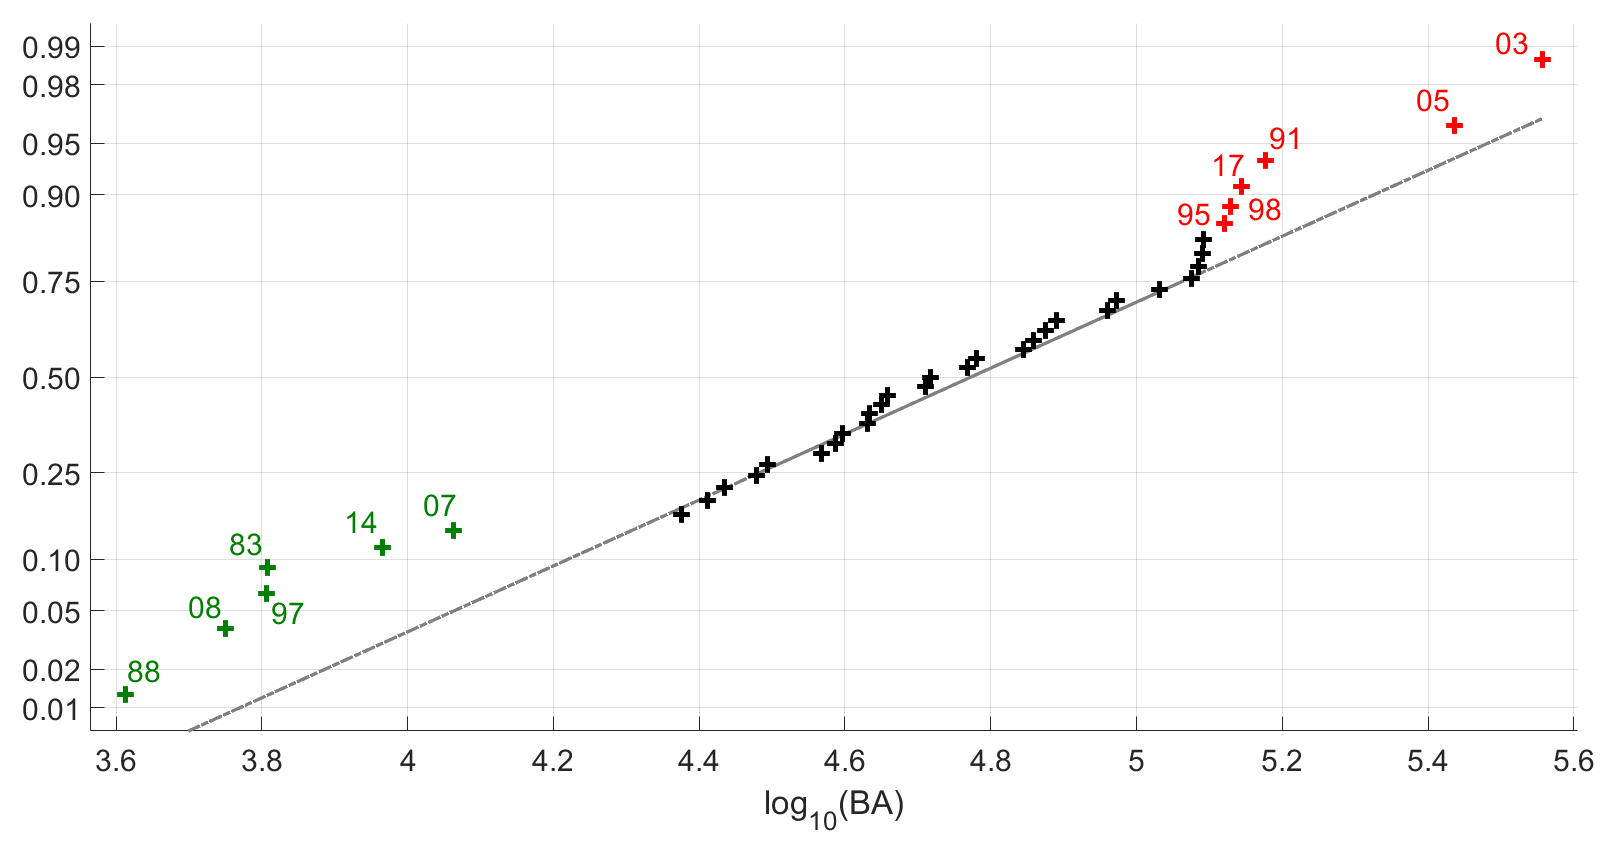
Figure 2Normal probability plot comparing the sample of log 10BA to the normal distribution. The groups of severe and weak years are marked in red and green respectively and the years are identified by the two digits next to the symbols.
Values of log 10BA above percentile 80 of the model (highlighted in red in Fig. 2) and below percentile 20 (highlighted in green) present larger departures from the fitted normal distribution than the remaining years; these two groups are classified respectively as severe years (1991, 1995, 1998, 2003, 2005 and 2017) and as weak years (1983, 1988, 1997, 2007, 2008 and 2014). The remaining years (marked in black in Fig. 2) are classified as moderate.
3.2 Model with two covariates
Departures of severe and weak years from the fitted normal distribution suggest that other factors, namely meteorological ones, are playing a role in the interannual variability of BA (Pereira et al., 2005). Following the approach proposed by Nunes et al. (2014), for a given fixed day d, where d is chosen between 26 May (d=56) and 30 June (d=91), we tested an alternate model that incorporates information about meteorological fire danger in the pre-fire and the fire seasons. The starting date of 26 May was set a posteriori, as the day when the alternate model becomes statistically significant and therefore the information provided is relevant for the users. Accordingly, using Eqs. (1)–(3), we fitted to the sample of log 10BA a normal distribution with the mean linearly depending on covariate ψ(d) for the considered fixed day d, and on covariate χ; i.e. we tested the following model:
It is worth noting that index d is fixed in Eq. (12) and is only used to identify the fixed day of the pre-fire season when covariate ψ(d) is computed. Maximum likelihood estimates of coefficients a(d) and b(d) for the considered fixed day d are then obtained according to Eqs. (6) and (7). However, parameter c in Eq. (12) does not depend on chosen day d since, according to Eq. (8), c=μBA for all days because ψ(d) and χ have zero mean (since they are normalized).
An alternate model with covariates ψ(d) and χ is accordingly fitted for each fixed day d, and the null hypothesis that the null model is to be retained (against the alternate nested model) is assessed using the likelihood ratio test. For all days between 26 May (d=56) and 30 June (d=91), the null hypothesis is rejected at the 5 % significance level, with the p values steeply decreasing from to . In turn, when d progresses along the pre-fire season, obtained values of a(d) increase whereas corresponding values of b(d) slightly decrease (Fig. 3).
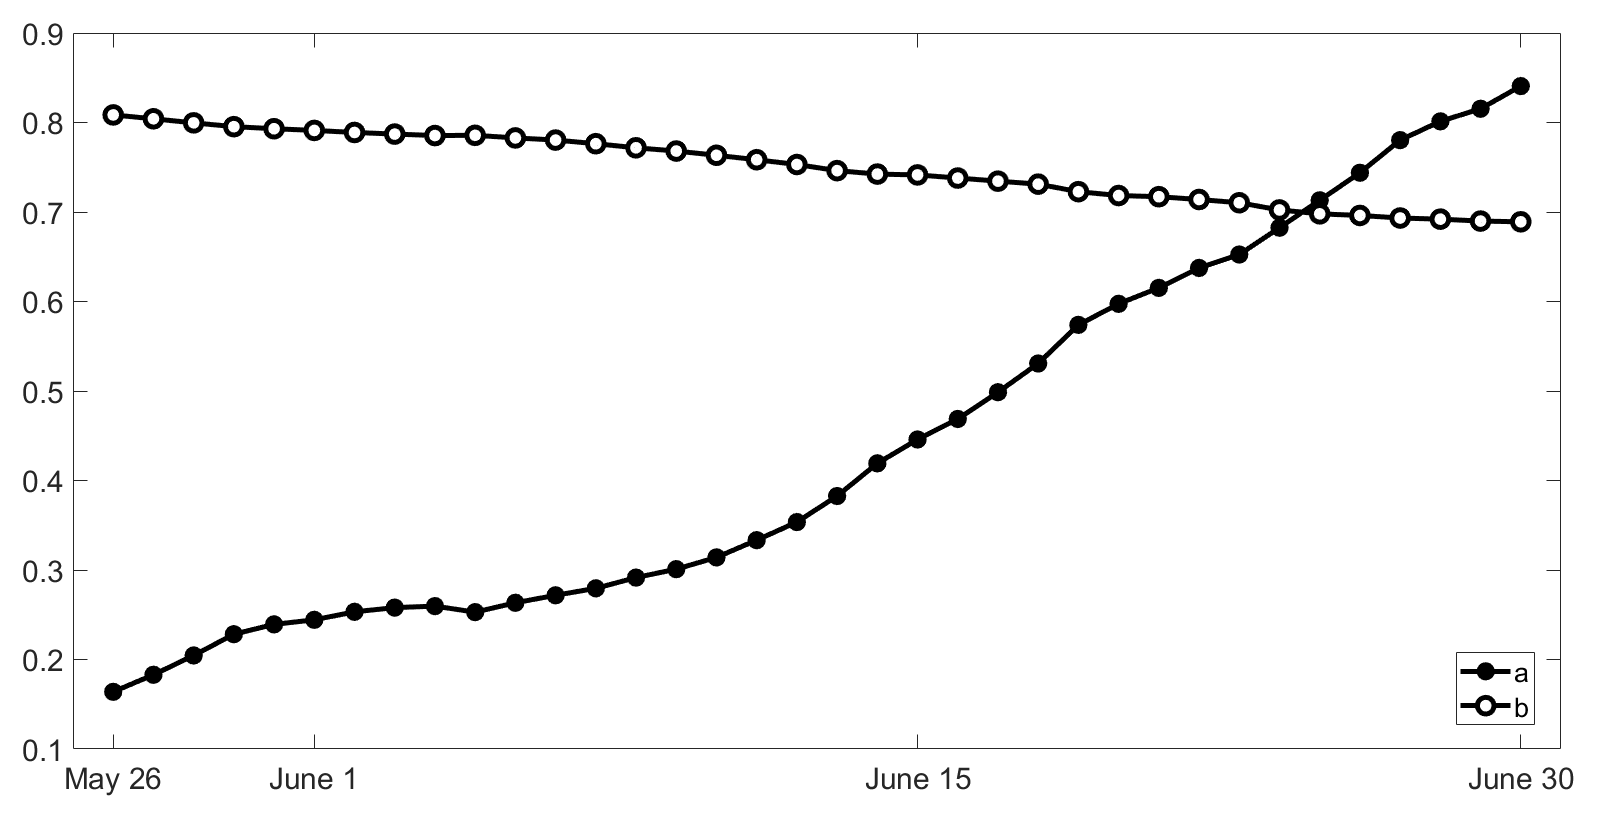
For each day d, performance of the fitted alternate model may be assessed by representing each year in space (ψχ) framed by covariates ψ(d) and χ over a background of probability of exceedance of a given fixed threshold, e.g. of the mean value μBA of the null model, i.e. . Results of models fitted on 26 May (d=56), 15 June (d=76) and 30 June (d=91) are shown in Fig. 4. Severe (weak) years tend to spread over the upper right (lower left) quadrants of the space indicating that they are associated with high (low) values of both ψ(d) and χ. Severe (weak) years are also associated with high (low) values of Pexc and, except for 26 May and 15 June 2007, the groups of severe and weak years are fully separated by contour Pexc=0.5 (which, in fact, corresponds to the probability of exceedance of μBA in the null model, where meteorological factors are not taken into account). Values of Pexc associated with severe years tend to gradually increase along the pre-fire season and, on 30 June, five out the six severe years present values above 0.7 (a threshold that is barely surpassed by just two of the 27 moderate years). Finally, it is worth noting that the contour lines of Pexc(ψ, χ) become steeper along the pre-fire season, a result in agreement with the steep increase in parameter a (Fig. 3).
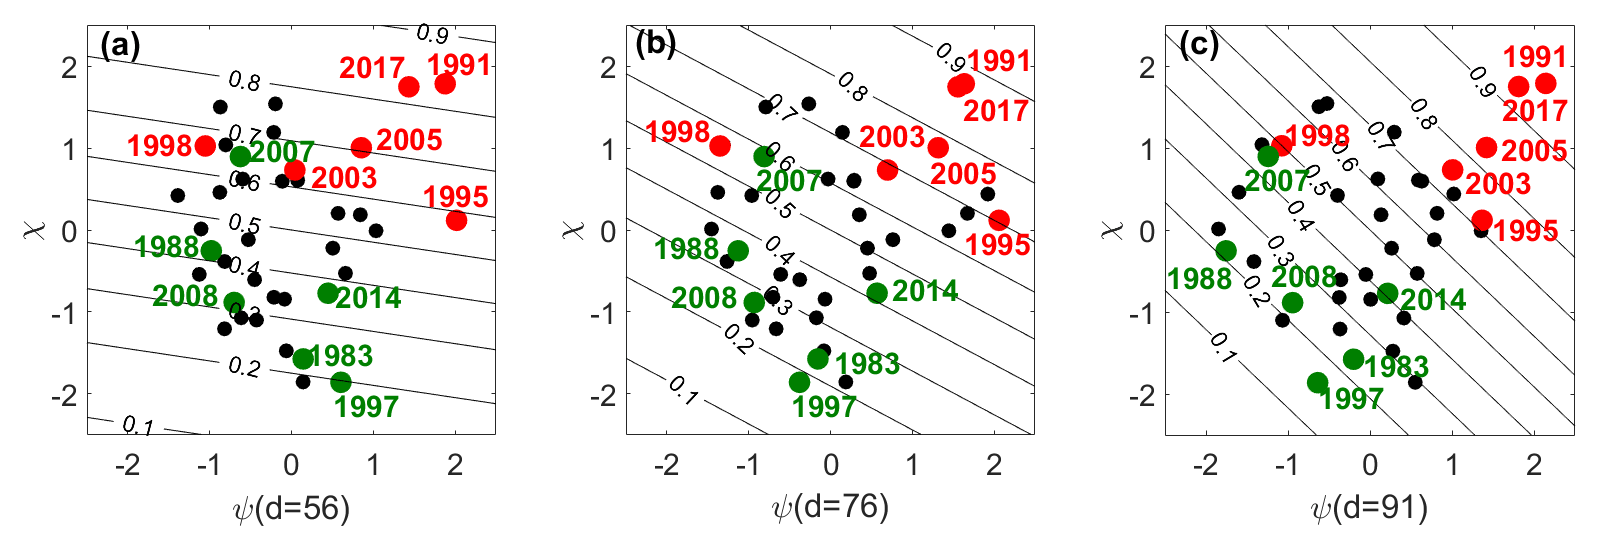
Figure 4Scatter plots of the 39-year sample in the space of covariates ψ(d) vs. χ for (a) 26 May (d=56), (b) 15 June (d=76) and (c) 30 June (d=91). Groups of severe (weak) years are identified by the red (green) circles. The straight lines are contours of Pexc(ψ, χ).
Results obtained suggest that the likelihood of a given year to belong to the severe or to the weak groups may be estimated based on the value of Pexc(d) of each year as estimated by the fitted model on chosen day d (Fig. 5). For a given year, values of Pexc(d) change very slowly from day to day. This is to be expected since (1) the models are all fitted to the same sample of log 10BA, (2) covariate χ is the same in all models and (3) covariate ψ(d) has high serial correlation since, according to Eq. (1), index Dpfs(d) accumulates values of DSR since 1 April up to the considered day. Therefore, any decision taken for a given year, based on the respective estimate of Pexc(d) from the model fitted on day d, is not expected to drastically change in the next few days unless there is an incoming sequence of very high (or very low) daily values of DSR that will considerably change ψ(d) and therefore Pexc(d).
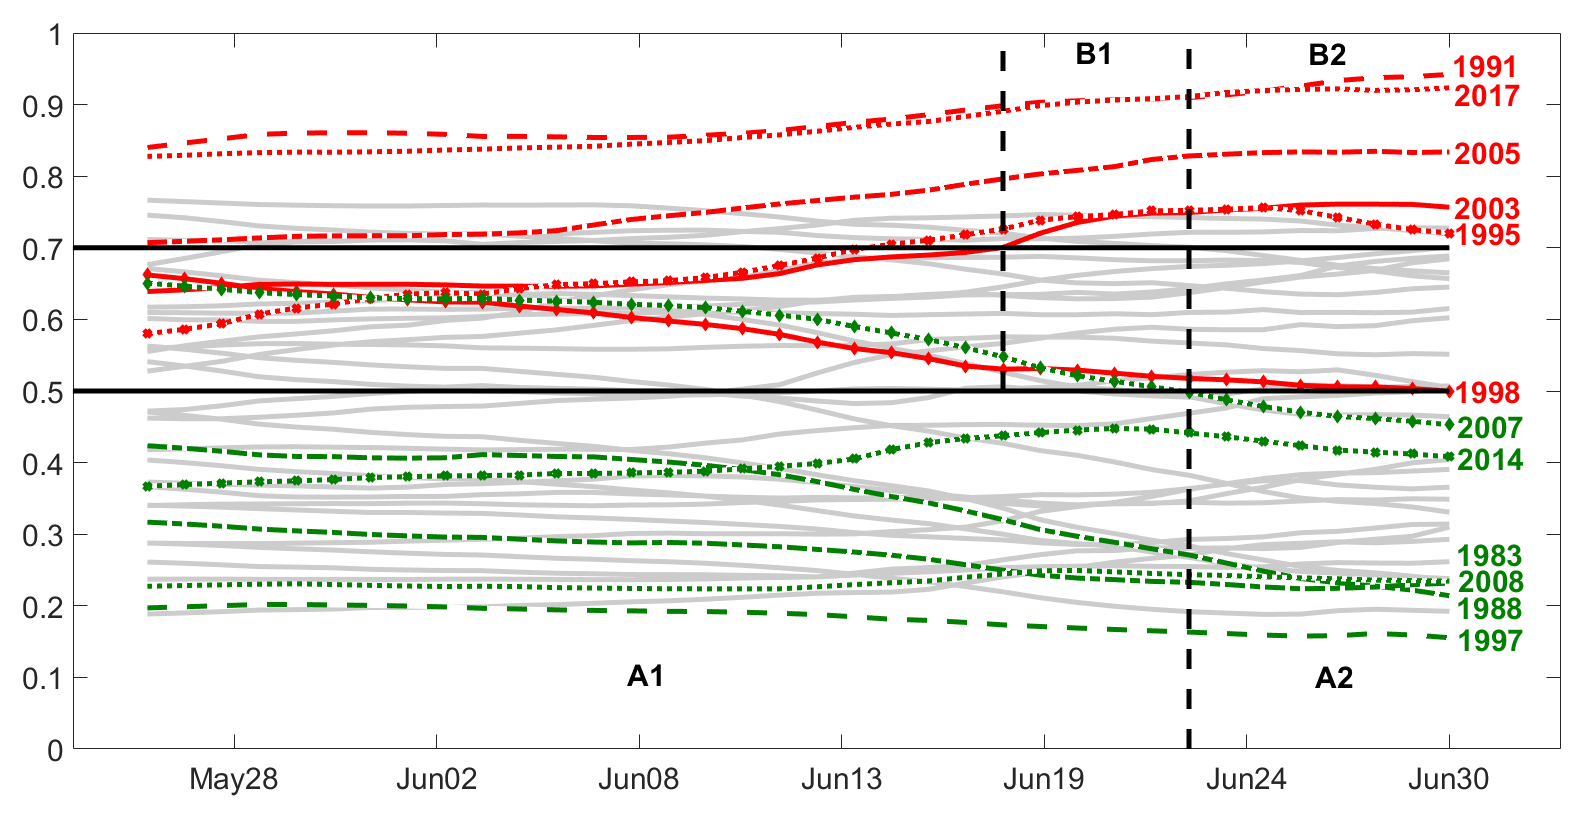
Figure 5Temporal evolution of Pexc(ψ, χ) during the pre-fire season (26 May to 30 June). Severe (weak) years are identified by the red (green) curves. The black horizontal lines represent thresholds used in Type A (Pexc=0.5) and Type B (Pexc=0.7) decisions. Vertical dashed lines delimit the phase where Type A and Type B decisions were checked.
The following two types of decisions are tested.
-
Type A. If Pexc>0.5 at day d then the year is not classified as weak (i.e. it is either moderate or severe); otherwise, if Pexc≤0.5 then the year is not classified as severe (i.e. it is either moderate or weak).
-
Type B. If Pexc>0.7 at day d then the year is classified as severe.
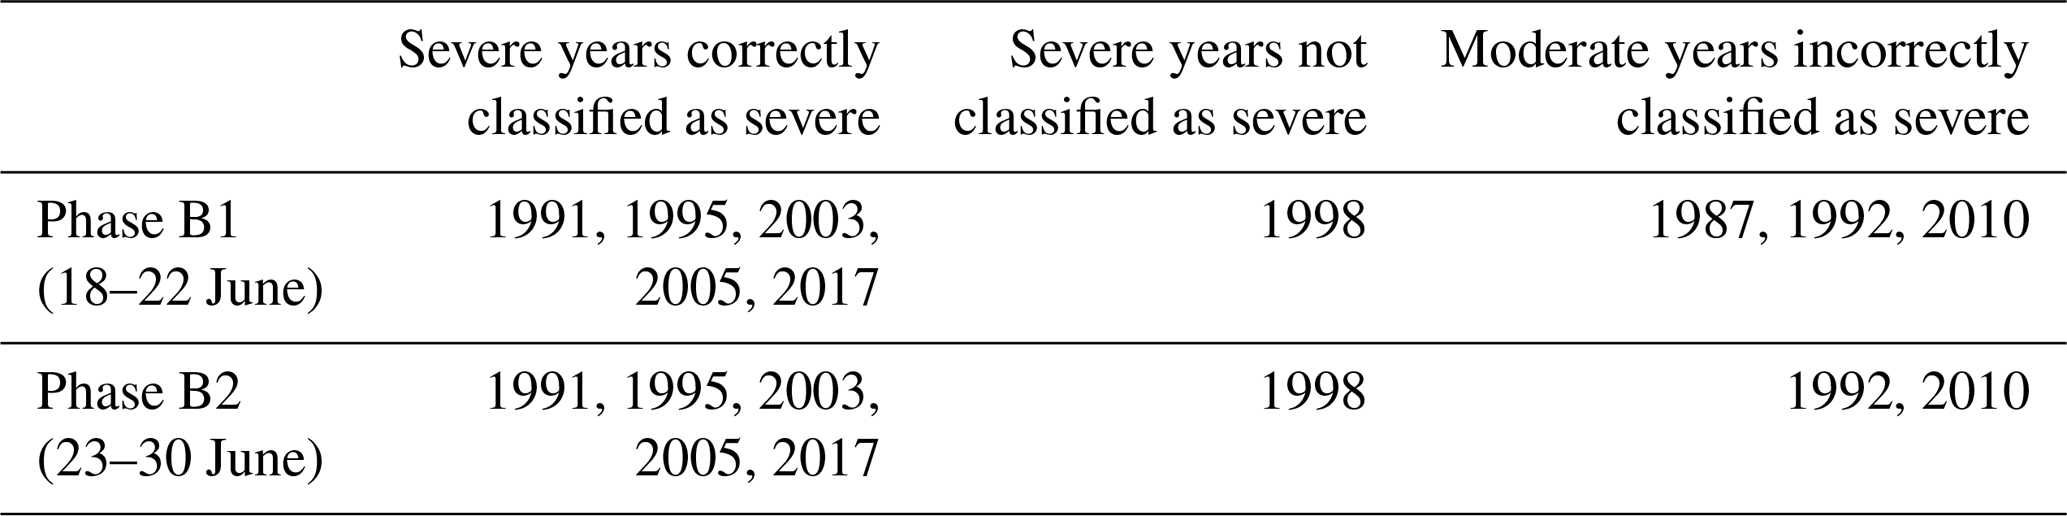
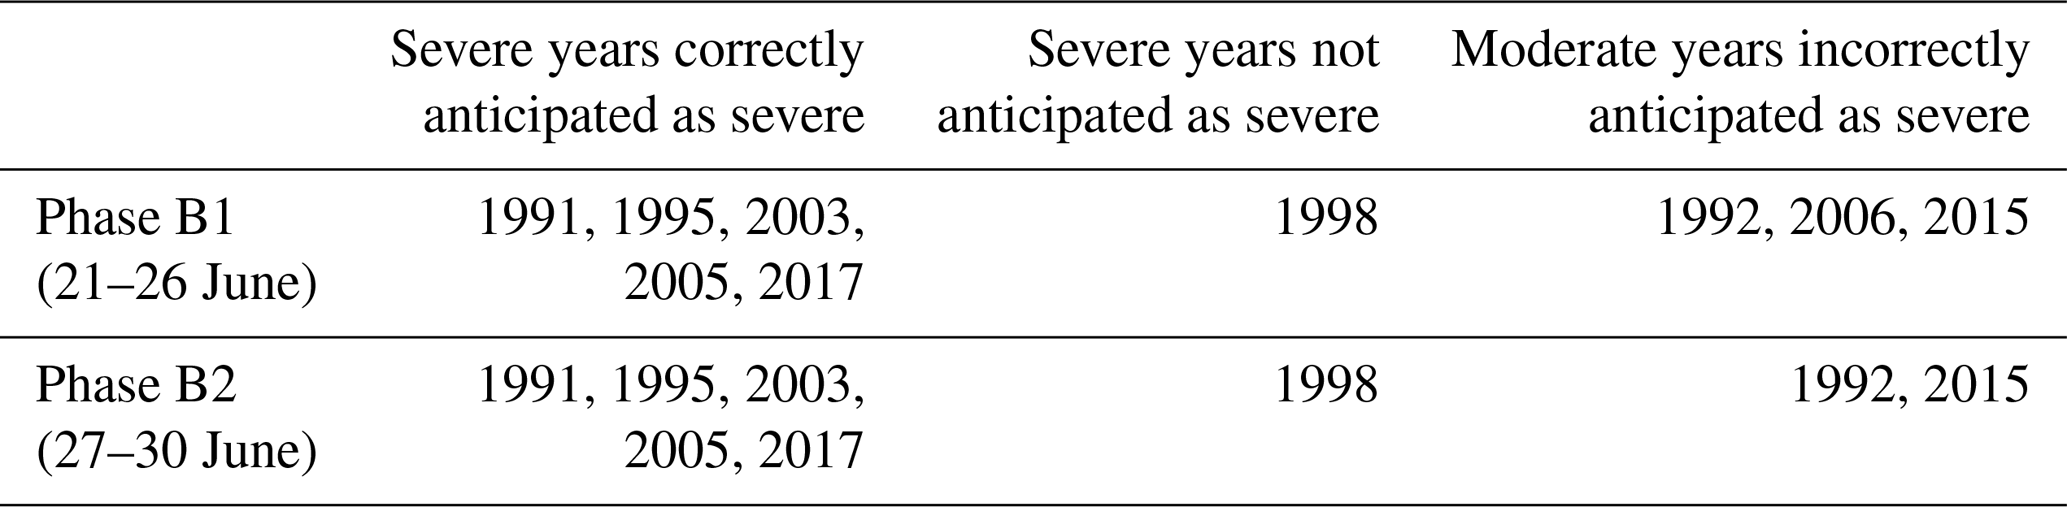
Results obtained indicate that decision types A and B should be applied to different periods of the pre-fire season from 26 May to 30 June (Table 1) and from 18 to 30 June (Table 2). Furthermore, for each type of decision, two phases are identified in the respective periods, the days of each phase being characterized by the same decisions taken for each year. In the case of Type A decisions, there is just one wrong decision (2007 is incorrectly classified as not being a weak year) during phase A1 (26 May to 22 June) and all decisions are correct during phase A2 (23 to 30 June). In the case of Type B decisions, and for the entire period (18 to 30 June), all severe years but one (1998) are correctly classified as severe; conversely, three moderate years are incorrectly classified as severe during phase B1 (18 to 22 June) and this decreases to two during phase B2 (23 to 30 June).
Table 1Performance assessment of Type A decisions during the pre-fire season (26 May to 30 June) based on the model with two covariates.
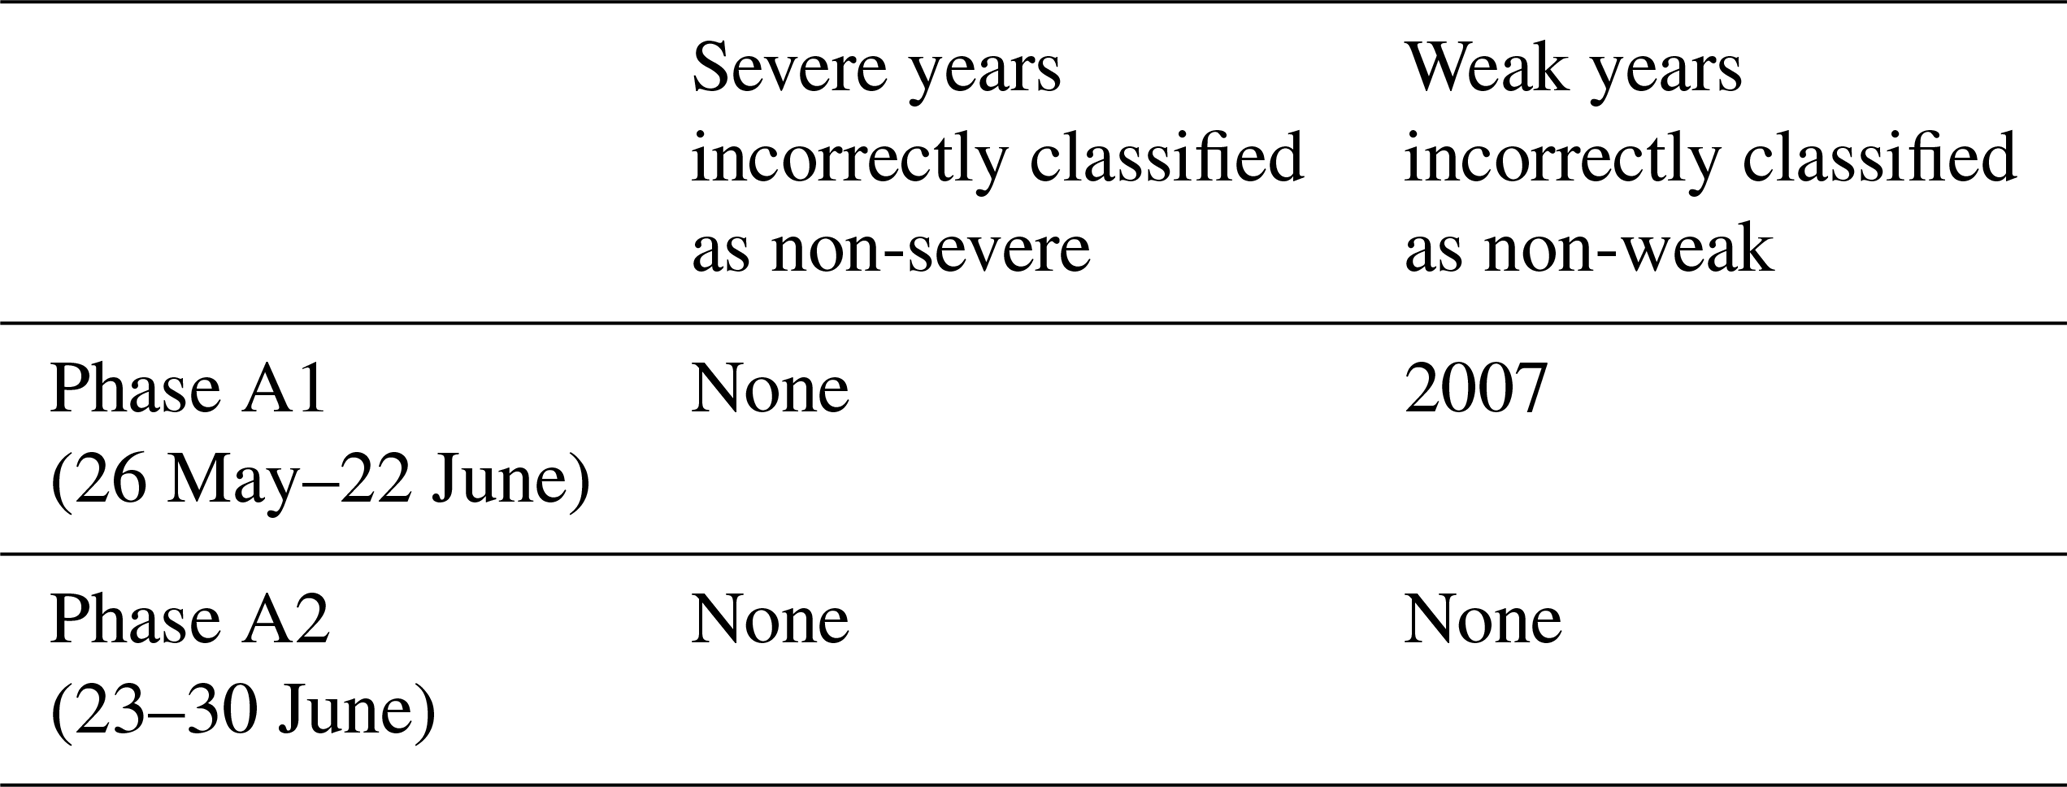
Table 2As in Table 1 but for performance assessment of Type B decisions for 18 to 30 June.
3.3 Model with one covariate
Despite its usefulness in characterizing the role played by meteorological factors during the pre-fire and the fire seasons, the model discussed in the last subsection cannot be used to anticipate the likelihood of a given fire season given that one of the two covariates (χ) is derived from daily information during that same fire season. However, results obtained in the previous subsection indicate that the role played by covariate ψ(d) in each fitted model becomes more and more relevant when day d progresses along the pre-fire season as suggested by the steady increase in coefficient a(d) that even becomes larger than b(d) after 25 June (Fig. 3), as well as by the increase in slope of contour lines of Pexc(d) (Fig. 4).
Therefore, for each considered day d, we fitted to the sample of log 10BA the following normal model, now with the mean linearly depending just on covariate ψ(d):
Maximum likelihood estimates of model parameters p(d) and q are obtained using Eqs. (9) and (10) and it may be noted that again parameter q is the same for all fitted models, with q=μBA because ψ(d) has a zero mean. As in the case of coefficient a in the model with two covariates, coefficient p(d) increases as the considered day d progresses along the pre-fire season (Fig. 6). For each day d the relative role played by covariates ψ(d) and χ may be assessed by comparing the log-likelihood ratio statistics and , where L0, L1 and L2 are the likelihood functions of the null model, the model with one covariate and the model with two covariates (Fig. 7). These two ratios represent the increases in likelihood of the sample of BA when replacing the null model (with no covariates) by the model with covariate ψ and then the latter model by the model with covariates ψ and χ.
Values of increase as the considered day d progresses along the pre-fire season, contrasting with the behaviour of where a decrease (albeit more moderate) is observed. The former ratio even becomes larger than the latter from 23 to 30 June; however, it may be noted that, for models fitted on days between 26 May and 13 June, values of are smaller than the critical value at the 5 % significance level, indicating that the null model is to be retained (against the alternate model with one covariate). Nevertheless, the model with one covariate is still tested along the entire pre-fire season (26 May to 30 June) because, as shown in Fig. 4a, b, the severe (weak) groups tend to present for the most part high (low) values of covariate ψ. Reinforcing the relevance of this covariate when estimating the likelihood of a given year to belong to the severe class, we find that, when, for each considered fixed day d, we restrict to years with ψ(d) larger than the respective daily median, there is a positive correlation between ψ(d) and χ that, except from 5 to 12 June, is significant at the 5 % level (Fig. 8).
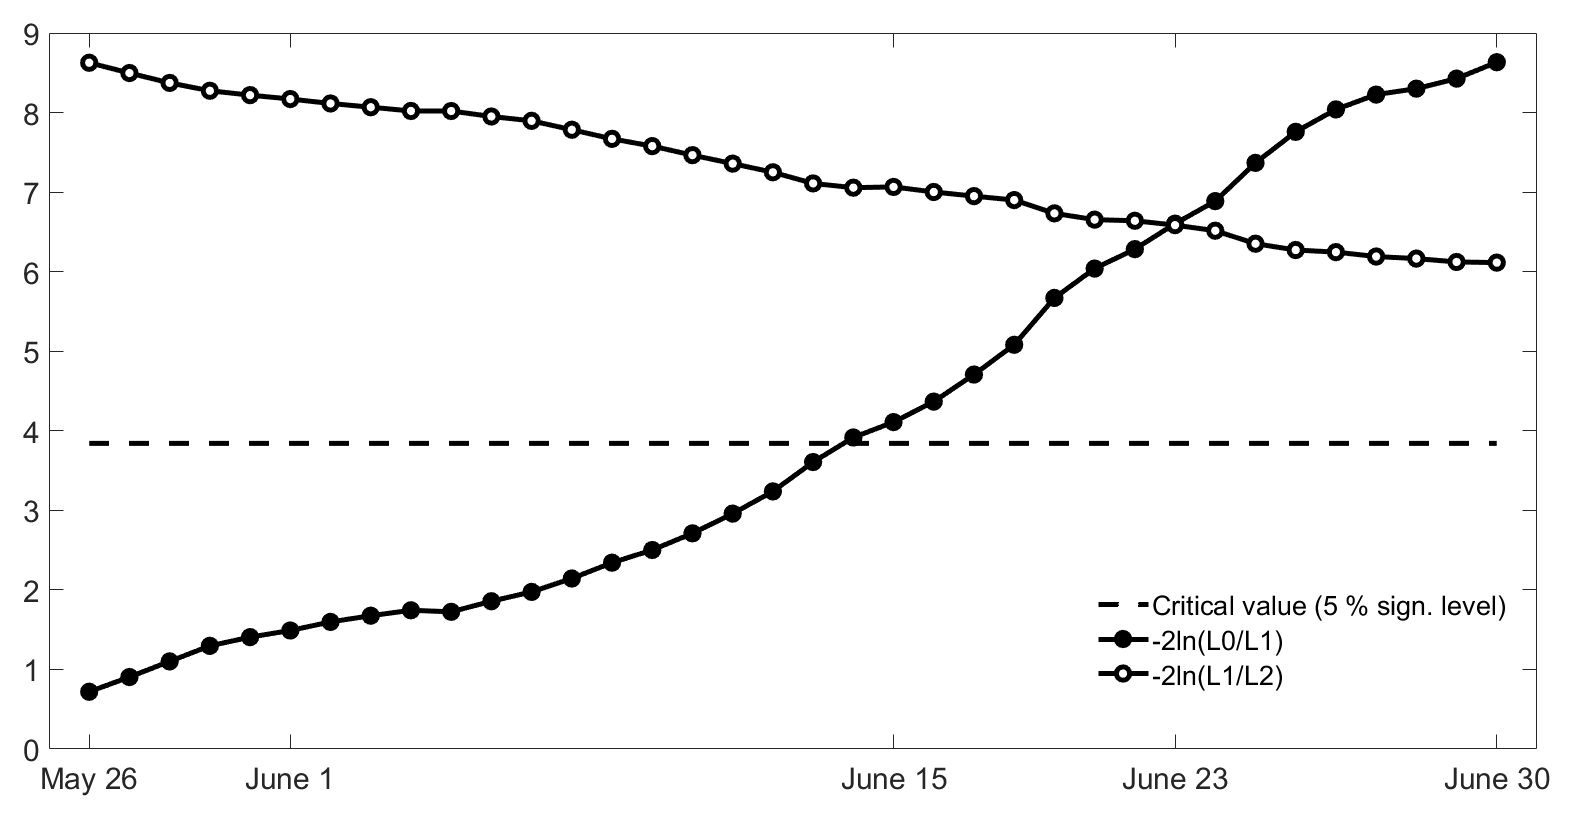
Figure 7Temporal evolution of the log-likelihood ratio statistics between the null model and the model with one covariate and between the model with one covariate and the model with two covariates. The horizontal dashed line represents the critical value for the statistic at the 5 % significance level.
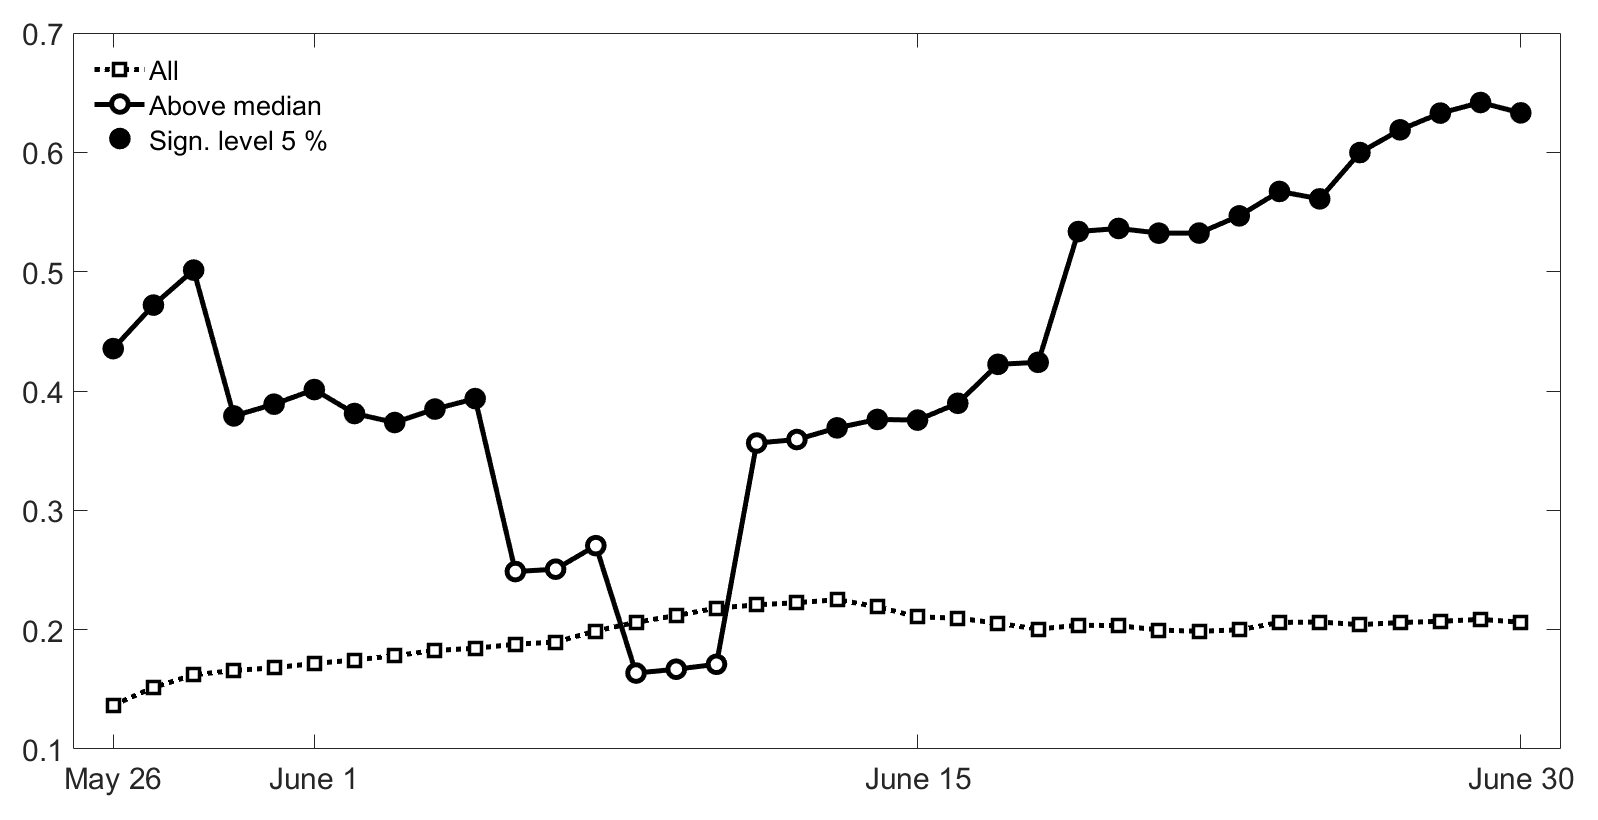
Figure 8Temporal evolution of the correlation between ψ(d) and χ from 26 May to 30 June for all years (dotted curve) and restricting to years ψ(d) larger than the respective median (solid curve). Black circles in the solid curve identify values of correlation that are significant at the 5 % level.
As with the model with two covariates, a given year is anticipated as belonging to the severe or the weak groups by making Type A and Type B decisions based on the value of Pexc(d) of each year as estimated by the fitted model (with one covariate) on that fixed day d. It is worth noting the use of the wording “is anticipated as” (instead of “is classified as” employed in the previous section), which is meant to enhance the prognostic character of the model with covariate ψ. Since the model with one covariate has lower variability than the model with two covariates, the threshold of 0.7 (previously used in Type B decisions) is now lowered to 0.66 (Fig. 9).
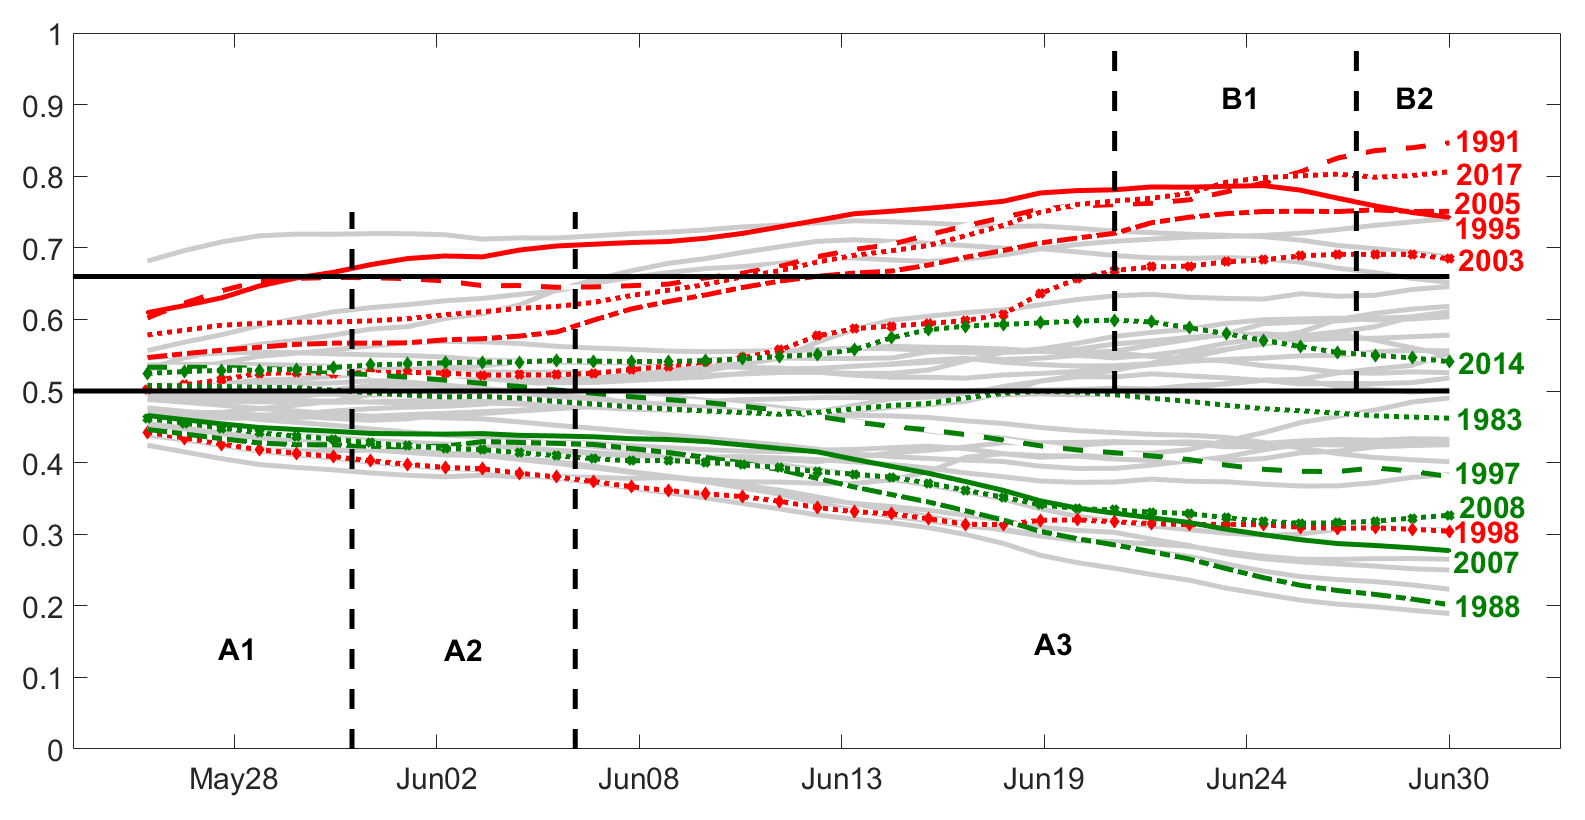
Figure 9Temporal evolution of Pexc(ψ) during the pre-fire season (26 May to 30 June). Severe (weak) years are identified by the red (green) curves. The black horizontal lines represent thresholds used in Type A (Pexc=0.5) and Type B (Pexc=0.66) decisions. Vertical dashed lines delimit the phase where Type A and Type B decisions were checked.
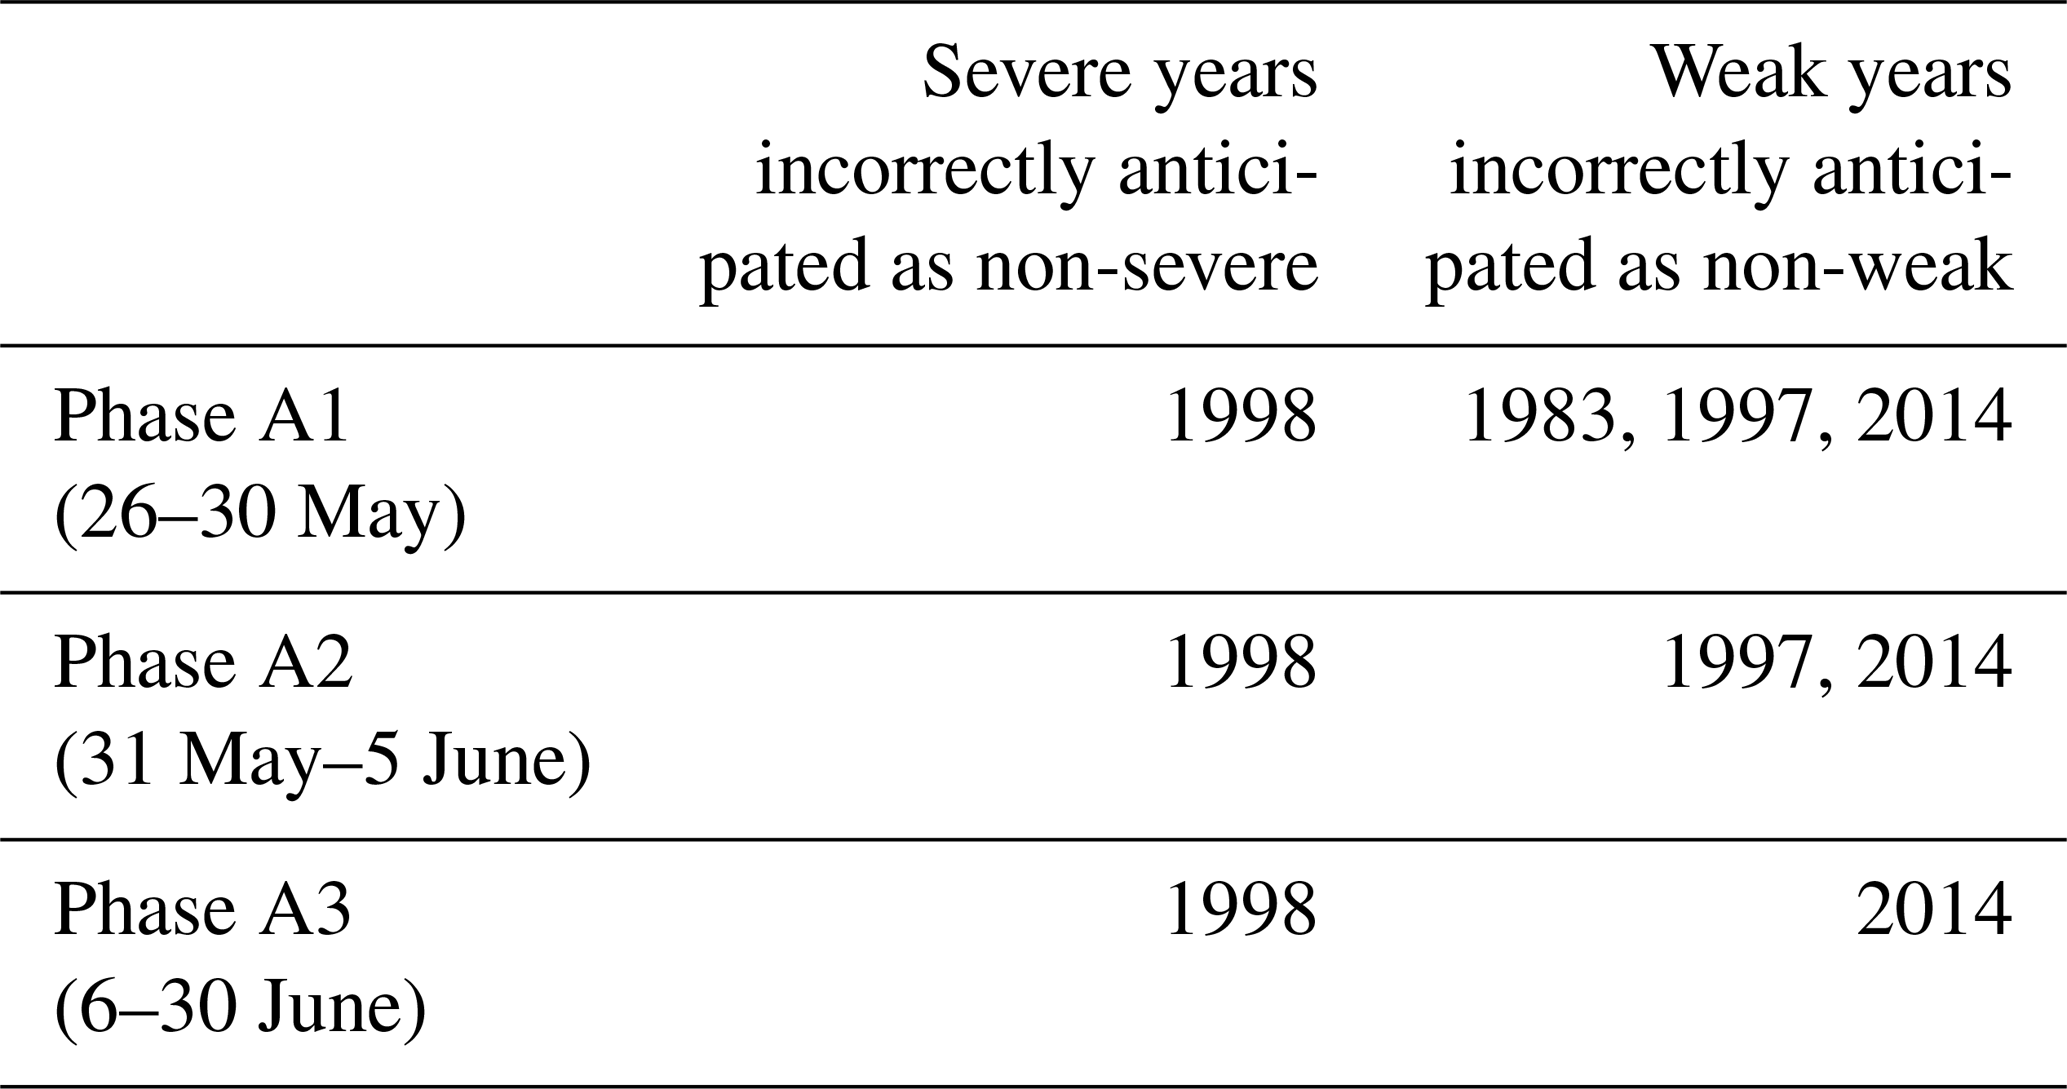
Three phases (A1, A2 and A3) are used to assess Type A decisions (Table 3). In all phases, only 1998 (out of the six severe years) is incorrectly anticipated as a non-severe year. In turn, the number of weak years incorrectly anticipated as non-weak decreases from three in phase A1 (26 to 30 May) to two in phase A2 (31 May to 5 June) and then to just one in phase A3 (6 to 30 June). Assessment of Type B decisions (Table 4) is performed in two phases (B1 and B2). Regarding the severe years correctly classified as severe, it is worth pointing out that, apart from phase B1 beginning 3 d later (on 21 June instead of 18 June), there is no decrease in performance from the model with two covariates, 1998 being again the only missed severe year in phases B1 and B2. Finally, no virtual decrease is found in performance in the number of moderate years incorrectly anticipated as severe, that, as with the model with two covariates, decrease from three in phase B1 (21 to 26 June) to two in phase B2 (27 to 30 June).
The increasing dimension of the impacts of extremely large wildfires that have been affecting Portugal in the last decades calls for the improvement of diagnostic and prognostic tools designed to assist forest and fire managers in making better decisions on both prevention and combat. For this purpose, we set up a model that allows outlooks, up to 1 month ahead, of wildfire potential in Portugal during the fire season (defined as July and August).
The model consists of a normal distribution of the decimal logarithm of the yearly cumulated values of BA during the fire season (log 10BA) where the mean of the distribution linearly depends on a covariate ψ(d), defined at a given fixed day d of the pre-fire season, which responds to the accumulation of thermal and water stress up to the chosen day d. This model with one covariate results from the simplification of a model with two covariates ψ(d) and χ, the latter covariate being sensitive to the occurrence of hot and dry spells associated with strong winds that are the key triggering mechanism for the onset and spread of very large fire events (Amraoui et al., 2013). The rationale behind setting up the model with covariate ψ(d) is twofold: (1) long periods of warm and dry weather during the pre-fire season induce high levels of vegetation stress that increase the probability of occurrence of large fire events as shown for Portugal (Trigo et al., 2006) and even the Mediterranean basin (Gudmundsson et al., 2014; Turco et al., 2017); (2) in fact, it is now well-known that soil moisture deficit and drought (associated with large values of ψ) have an impact on hot summer extremes in Mediterranean regions (Vautard et al., 2007; Hirschi et al., 2011), a feature that fostered the development of both statistical and dynamical seasonal fire forecasting approaches in the Mediterranean region (Gudmundsson et al., 2014; Turco et al., 2017, 2018).
Performance of the model was evaluated for the 39-year period 1980–2018 by testing two types of decisions based on the temporal evolution of Pexc: for Type A, the decision is on whether a given year is classified as not being severe or as not being weak, whereas for Type B it is on whether the year is classified as severe. Type A decisions are made during the entire pre-fire season (26 May to 30 June) and Type B decisions are restricted to the end of the pre-fire season (21 to 30 June) when the role played by the cumulation of vegetation stress becomes as relevant as the one by the occurrence of extreme weather events during the fire season. In the case of Type A decisions, only 1998 (out of the six severe years) was incorrectly anticipated as non-severe. For Type B decisions, all severe years but 1998 were correctly anticipated as severe, reflecting the prominent role of cumulated vegetation stress at the end of the pre-fire season in favouring the occurrence of severe years. However, a test similar to Type B, but applied to weak years, has poor performance and this may be viewed as an indication that low values of ψ along the pre-fire season have a moderate impact on the likelihood of a following fire season with a low value of χ and therefore on the likelihood of having a weak year.
Since both Type A and Type B decisions have shown to be incorrect for the fire season of 1998, the temporal evolution of daily values of DSR is worth being analysed along the pre-fire and the fire seasons (Fig. 10). Except for two peaks in the last 10 d of June, the pre-fire season of 1998 is dominated by moderate daily values of DSR which are very close to zero between 10 May and early June, a period characterized by significant amounts of rainfall. Therefore, by the end of May, vegetation was not subject to either thermal or water stress and this translates into low values of ψ(d) along the pre-fire season (Fig. 4). This unstressed condition of vegetation explains why the two large peaks of daily DSR in the second half of June did not trigger any large fire events as well as why the large peak of DSR at the end of the first half of July was followed by days of moderate burned area. However, the meteorological conditions drastically changed in August, with the first half of the month being dominated by values of daily DSR well above the median that culminated with a sequence of days with DSR much higher than percentile 90, and the second half presenting a peak of DSR very close to percentile 90. The impact of this high number of extreme days translates into a large value of χ for 1998, the seventh largest in the 39 years analysed and the third of the six severe years. Striking a vegetation stressed by the warm and dry conditions that prevailed since the beginning of August, the two peaks of DSR triggered two sequences of days affected by large fire events that made 1998 rank fifth in cumulated BA in 1980–2018.
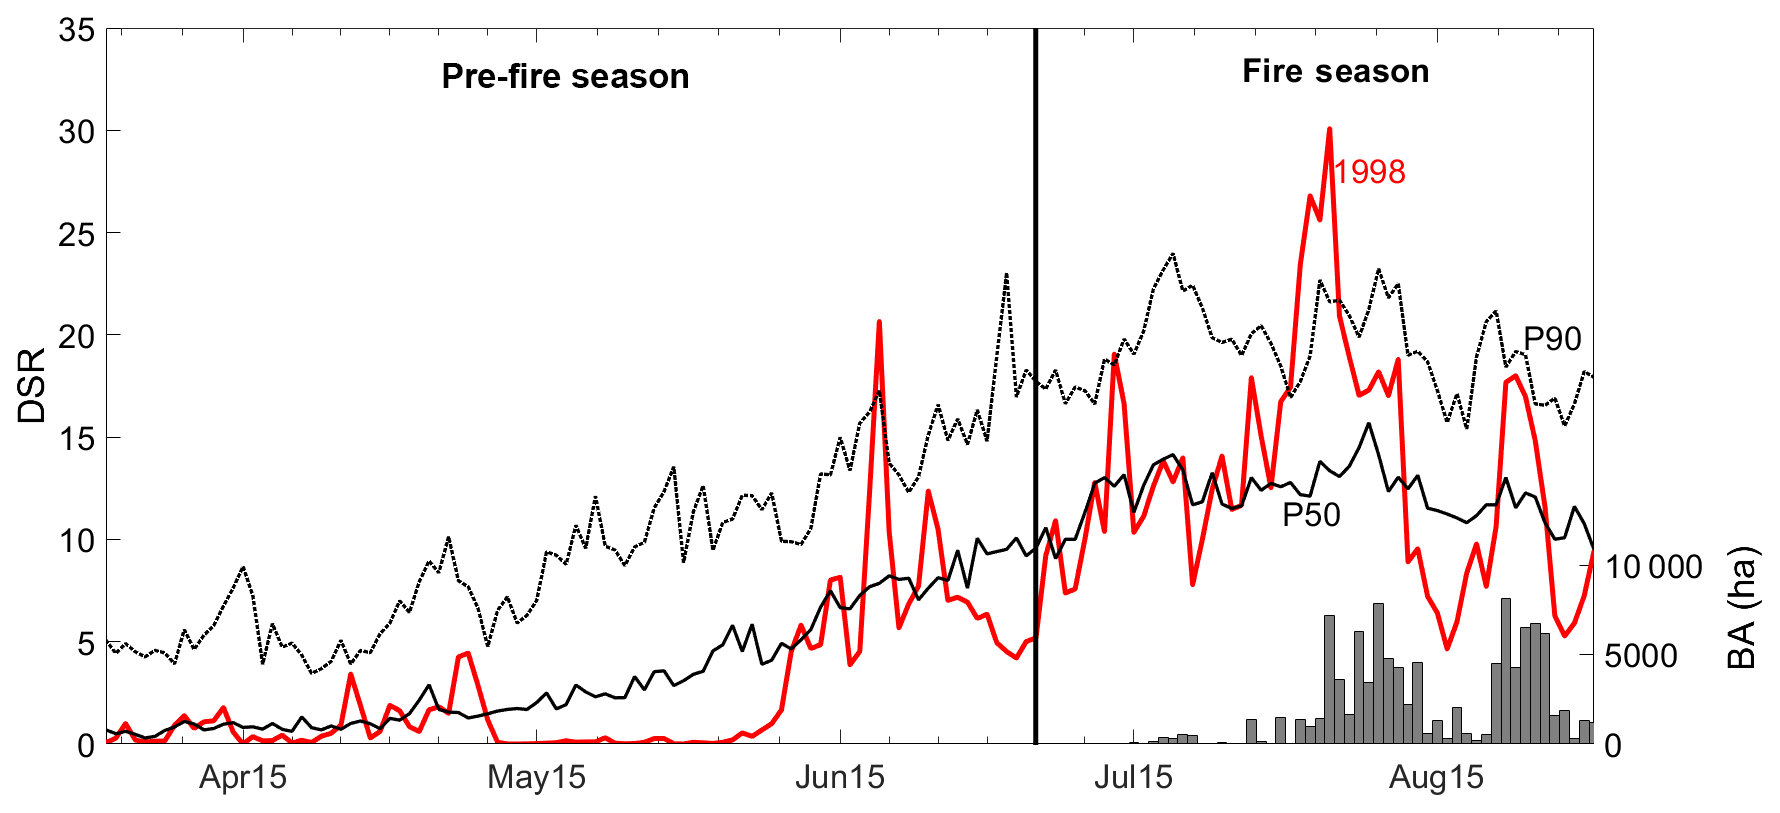
Figure 10Temporal evolution of daily values of DSR for 1998 (red curve) and of the daily values of the median (solid black curve) and of percentile 90 (dotted black curve) for the period 1980–2018. The dark grey bars indicate the cumulated daily values of BA (in hectares) for Portugal. The vertical black line subdivides the period into pre-fire and fire seasons.
As shown in Fig. 4, 1998 is the only severe year when a value of ψ at the last day of the pre-fire season (30 June) below the mean minus 1 standard deviation is followed by a value of χ above the mean plus 1 standard deviation. The exceptional character of 1998 is reinforced by the fact that, even when considering all 39 years, this condition is fulfilled in only 2 years, i.e. 1998 and 1985 (a moderate year). However, despite the extreme meteorological conditions observed in August, 1998 just ranks fifth among the six severe years, suggesting that the mild conditions during the pre-fire season still had a mitigating role. Conversely, the exceptionality of 1998 puts an emphasis on the importance of short-term extreme events as triggers of large-fire events, a feature that is not considered when restricting to the information provided by maps of long-term seasonal forecasts of temperature and rainfall anomalies, undermining the usefulness of current seasonal forecasting outputs for wildland fire potential outlooks.
Several improvements to the proposed prognostic model (with covariate ψ) are currently being considered. First, no advantage was taken of the fact that covariates ψ and χ are positively correlated (when ψ is larger than the median). This information may be added by setting up a model of the distribution of χ using information about meteorological conditions along the pre-fire season and then incorporating this information in the prognostic model. Second, the model was developed for the entire territory of Portugal, not taking into account regional characteristics of climate, land cover and fire regime. It is therefore worth setting up regional models over areas with distinct pyrogeographical characteristics. Finally, the outlooks with respect to the months of July and August and given the observed trend to have a longer fire season it would be very useful to extend them until October. For instance, as pointed out by Beighley and Hyde (2018), 36 % of the total area burned in 2009–2017 was outside the period from July to September, a fraction that is 3 times larger than the value of 12 % observed when considering the period 2001–2008.
A beta version of the proposed model has been experimentally running since May 2017 and the correctness of the outlooks (made in real time) about 2017 being a severe year (based on a Type B decision) and about 2018 not being severe (based on a Type A decision) give confidence about the potential of the model to be operationally used to anticipate the occurrence of severe years.
Daily outlooks are currently available at CeaseFire (http://idlcc.fc.ul.pt/CeaseFire/index.php, last access: 15 July 2019), a website designed to integrate and disseminate relevant meteorological information to the user fire community by means of a simple, fast and user-friendly interface (Evans, 2018). Developed by Instituto Dom Luiz (IDL) at the Faculty of Sciences of the University of Lisbon (Portugal), the platform relies on data provided in near-real time by LSA SAF, the EUMETSAT Satellite Application Facility for Land Surface Analysis (Trigo et al., 2011). Currently there are about 900 registered users in the CeaseFire platform, most of them from national authorities and services, as well as from municipalities and private companies, namely from the paper and pulp industry.
The meteorological data used in this study were obtained from products of the LSA-SAF Fire Risk Map (LSA-504), produced and disseminated by EUMETSAT Satellite Application Facility on Land Surface Analysis (LSA-SAF, 2019); in accordance with EUMETSAT data policy, the LSA-SAF data are granted to every interested user free of charge. The burned area data are publicly available from the national fire record database (ICNF, 2019).
SAN performed the study and wrote the paper; CDC, RMT and TJC contributed to the model development and revised the paper; KFT and MAAT contributed to the model validation and revised the paper.
The authors declare that they have no conflict of interest.
This article is part of the special issue “Spatial and temporal patterns of wildfires: models, theory, and reality”. It is a result of the conference EGU 2017, Vienna, Austria, 23–28 April 2017.
Research was developed within the framework of the EUMETSAT Satellite Application Facility for Land Surface Analysis (LSA SAF) and the FCT project “Forecasting fire probability and characteristics for a habitable pyroenvironment (FireCast)” under grant no. PCIF/GRF/0204/2017.
This research has been partially supported by The Navigator Company under contract CEASEFIRE.
This paper was edited by Marj Tonini and reviewed by two anonymous referees.
Amraoui, M., Liberato, M. L. R., Calado, T. J., DaCamara, C. C., Coelho, L. P., Trigo, R. M., and Gouveia, C. M.: Fire activity over Mediterranean Europe based on information from Meteosat-8, Forest Ecol. Manag., 294, 62–75, https://doi.org/10.1016/J.FORECO.2012.08.032, 2013.
Anderson, K. R., Englefield, P., and Carr, R. J.: Predicting fire weather severity using seasonal forecasts, in: Proceedings of the Seventh Symposium on Fire and Forest Meteorology, Bar Harbour, Maine, USA, 23–26 October 2007, 10.6.1–10.6.5, 2007.
Bedia, J., Golding, N., Casanueva, A., Iturbide, M., Buontempo, C., and Gutiérrez, J. M.: Seasonal predictions of Fire Weather Index: Paving the way for their operational applicability in Mediterranean Europe, Climate Services, 9, 101–110, https://doi.org/10.1016/j.cliser.2017.04.001, 2018.
Beighley, M. and Hyde, A. C.: Portugal Wildfire Management in a New Era: Assessing Fire Risks, Resources and Reforms, Technical Report, available at: https://www.isa.ulisboa.pt/files/cef/pub/articles/2018-04/2018_Portugal_Wildfire_Management_in_a_New_Era_Engish.pdf (last access: 12 July 2019), 2018.
Calado, T. J., DaCamara, C. C., and Gouveia, C.: Mapping the daily risk of fire in Continental Portugal, The EUMETSAT Meteorological Satellite Data User's Conference, Darmstadt, Germany, 8–12 September 2008, available at: https://www.researchgate.net/publication/228448684 (last access: 12 July 2019), 2008.
Catry, F. X., Rego, F. C., Bação, F., and Moreira, F.: Modeling and mapping wildfire ignition risk in Portugal, Int. J. Wildland Fire, 18, 921–931, https://doi.org/10.1071/WF07123, 2009.
Collins, R. D., de Neufville, R., Claro, J., Oliveira, T., and Pacheco, A. P.: Forest fire management to avoid unintended consequences: A case study of Portugal using system dynamics, J. Environ Manage., 130, 1–9, https://doi.org/10.1016/J.JENVMAN.2013.08.033, 2013.
Conover, W. J: Practical Nonparametric Statistics, John Wiley & Sons, Inc., Hoboken, NJ, 1980.
Costa, L., Thonicke, K., Poulter, B., and Badek, F. W.: Sensitivity of Portuguese forest fires to climatic, human, and landscape variables: subnational differences between fire drivers in extreme fire years and decadal averages, Reg. Environ. Change, 11, 543–551, https://doi.org/10.1007/s10113-010-0169-6, 2011.
DaCamara, C. C., Calado, T. J., Ermida, S. L., Trigo, I. F., Amraoui, M., and Turkman, K. F.: Calibration of the Fire Weather Index over Mediterranean Europe based on fire activity retrieved from MSG satellite imagery, Int. J. Wildland Fire, 23, 945–958, https://doi.org/10.1071/WF13157, 2014.
DaCamara, C. C. and Trigo, R. M.: Circulation weather types and their influence on the fire regime in Portugal, in: Advances in Forest Fire Research 2018, edited by: Viegas, D. X., Imprensa da Universidade de Coimbra, Coimbra, Portugal, ISBN 978-989-26-16-506, 372–380, https://doi.org/10.14195/978-989-26-16-506_40, 2018.
Dee, D. P., Uppala, S. M., Simmons, A. J., Berrisford, P., Poli, P., Kobayashi, S., Andrae, U., Balmaseda, M. A., Balsamo, G., Bauer, P., Bechtold, P., Beljaars, A. C. M., van de Berg, L., Bidlot, J., Bormann, N., Delson, C., Dragani, R., Fuentes, M., Geer, A. J., Haimberger, L., Healy, S. B., Hersbach, H., Hólm, E. V., Isaksen, L., Kallberg, P., Köhler, M., Matricardi, M., McNally, A. P., Monge-Sanz, B. M., Morcrette, J.-J., Park, B.-K., Peubey, C., de Rosnay, P., Tavolato, C., Thépaut, J.-N., and Vitart, F.: The ERA-Interim reanalysis: Configuration and performance of the data assimilation system, Q. J. Roy. Meteor. Soc., 137, 553–597, https://doi.org/10.1002/qj.828, 2011.
EUMETSAT: LRIT/HRIT Global Specification, EUMETSAT, Coordination group for meteorological satellites, CGMS03, Darmstadt, Germany, 1999.
Evans, R.: Forecasting fires – from Monchique to Mozambique and beyond, Eumetsat Science Blog, available at: https://scienceblog.eumetsat.int/2018/08/forecasting-fires-from-monchique-to-mozambique-and-beyond/ (last access: 15 March 2019), 2018.
Fernandes, P. M., Loureiro, C., Guiomar, N., Pezzatti, G. B., Manso, F. T., and Lopes, L.: The dynamics and drivers of fuel and fire in the Portuguese public forest, J. Environ. Manage., 146, 373–382, https://doi.org/10.1016/J.JENVMAN.2014.07.049, 2014.
Flannigan, M., Cantin, A. S., de Groot, W. J., Wotton, M., Newbery, A., and Gowman, L. M.: Global wildland fire season severity in the 21st century, Forest Ecol. Manag., 294, 54–61, https://doi.org/10.1016/j.foreco.2012.10.022, 2013.
Gudmundsson, L., Rego, F. C., Rocha, M., and Seneviratne, S. I.: Predicting above normal wildfire activity in southern Europe as a function of meteorological drought, Environ. Res. Lett., 9, 8, https://doi.org/10.1088/1748-9326/9/8/084008, 2014.
Hirschi, M., Seneviratne, S. I., Alexandrov, V., Boberg, F., Boroneant, C., Christensen, O., Formayer, H., Orlowsky, B., and Stepanek, P.: Observational evidence for soil-moisture impact on hot extremes in southeastern Europe, Nat. Geosci., 4, 17–21, https://doi.org/10.1038/ngeo1032, 2011.
ICNF: Área ardida por tipo de ocupações de solo, Lisbon, Portugal, 2019, available at: http://www2.icnf.pt/portal/florestas/dfci/inc/estat-sgif, last access: 15 May 2019.
Lavorel, S., Flannigan, M. D., Lambin, E. F., and Scholes, M. C.: Vulnerability of land systems to fire?: Interactions among humans, climate, the atmosphere and ecosystems, Mitig. Adapt. Strat. Gl., 12, 33–53, https://doi.org/10.1007/s11027-006-9046-5, 2006.
LSA-SAF: Fire Risk Map (FRM, LSA-204): Lisbon, Portugal, 2019, available at: https://landsaf.ipma.pt/en/products/fire-products/frm/, last access: 15 July 2019.
Nunes, S. A., DaCamara, C. C., Turkman, K. F., Ermida, S. L., and Calado, T. J.: Anticipating the severity of the fire season in Northern Portugal using statistical models based on meteorological indices of fire danger, in: Advances in Forest Fire Research 2018, edited by: Viegas, D. X., Imprensa da Universidade de Coimbra, Coimbra, Portugal, ISBN 978-989-26-0884-6, 1634–1645, https://doi.org/10.14195/978-989-26-0884-6_180, 2014.
Oliveira, T. M., Barros, A. M. G., Ager, A. A., and Fernandes, P. M.: Assessing the effect of a fuel break network to reduce burnt area and wildfire risk transmission, Int. J. Wildland Fire, 25, 619, https://doi.org/10.1071/WF15146, 2016.
Oliveira, T. M., Guiomar, N., Baptista, F. O., Pereira, J. M. C., and Claro, J.: Is Portugal's forest transition going up in smoke?, Land Use Policy, 66, 214–226, https://doi.org/10.1016/J.LANDUSEPOL.2017.04.046, 2017.
Pausas, J. G. and Fernández-Muñoz, S.: Fire regime changes in the Western Mediterranean Basin: from fuel-limited to drought-driven fire regime, Climate Change, 110, 215–226, https://doi.org/10.1007/s10584-011-0060-6, 2012.
Pereira, M., Calado, T., DaCamara, C., and Calheiros, T.: Effects of regional climate change on rural fires in Portugal, Clim. Res., 57, 187–200, https://doi.org/10.3354/cr01176, 2013.
Pereira, M. G., Trigo, R. M., DaCamara, C. C., Pereira, J. M. C., and Leite, S. M.: Synoptic patterns associated with large summer forest fires in Portugal, Agr. Forest Meteorol., 129, 11–25, https://doi.org/10.1016/J.AGRFORMET.2004.12.007, 2005.
Pereira, M. G., Malamud, B. D., Trigo, R. M., and Alves, P. I.: The history and characteristics of the 1980–2005 Portuguese rural fire database, Nat. Hazards Earth Syst. Sci., 11, 3343–3358, https://doi.org/10.5194/nhess-11-3343-2011, 2011.
Pinto, M. M., DaCamara, C. C., Trigo, I. F., Trigo, R. M., and Turkman, K. F.: Fire danger rating over Mediterranean Europe based on fire radiative power derived from Meteosat, Nat. Hazards Earth Syst. Sci., 18, 515–529, https://doi.org/10.5194/nhess-18-515-2018, 2018.
San-Miguel-Ayanz, J., Durrant, T., Boca, R., Libertà, G., Branco, A., Rigo, D., Ferrari, D., Maianti, P., Vivancos, T. A., Costa, H., Lana, F., Löffler, P., Nuijten, D., Ahlgren, A. C., and Leray, T.: Forest Fires in Europe, Middle East and North Africa 2017, EUR 29318, JRC Science Hub., Ispra, Italy, https://doi.org/10.2760/27815, 2018.
Sánchez-Benítez, A., García-Herrera, R., Barriopedro, D., Sousa, P. M., and Trigo, R. M.: June 2017: The Earliest European Summer Mega-heatwave of Reanalysis Period, Geophys. Res. Lett., 45, 1955–1962, https://doi.org/10.1002/2018GL077253, 2018.
Sousa, P. M., Trigo, R. M., Pereira, M. G., Bedia, J., and Gutiérrez, J. M.: Different approaches to model future burnt area in the Iberian Peninsula, Agr. Forest Meteorol., 202, 11–25, https://doi.org/10.1016/J.AGRFORMET.2014.11.018, 2015.
Trigo, I. F., DaCamara, C. C., Viterbo, P., Roujean, J.-L., Olesen, F., Barroso, C., Camacho-de Coca, F., Freitas, S. C., García-Haro, J., Geiger, B., Gellens-Meulenberghs, F., Meliá, J., Pessanha, L., and Siljamo, N.: The Satellite Application Facility for Land Surface Analysis, Int. J. Remote Sens., 32, 2725–2744., https://doi.org/10.1080/01431161003743199, 2011.
Trigo, R. M., Pereira, J. M. C., Pereira, M. G., Mota, B., Calado, T. J., Dacamara, C. C., and Santo, F. E.: Atmospheric conditions associated with the exceptional fire season of 2003 in Portugal, Int. J. Climatol., 26, 1741–1757, https://doi.org/10.1002/joc.1333, 2006.
Turco, M., von Hardenberg, J., AghaKouchak, A., Llasat, M. C., Provenzale, A., and Trigo, R. M.: On the key role of droughts in the dynamics of summer fires in Mediterranean Europe, Sci. Rep.-UK, 81, 7, https://doi.org/10.1038/s41598-017-00116-9, 2017.
Turco, M., Jerez, S., Doblas-Reyes, F. J., AghaKouchak, A., Llasat, M. C., and Provenzale, A.: Skilful forecasting of global fire activity using seasonal climate predictions, Nat. Commun., 9, 2718, https://doi.org/10.1038/s41467-018-05250-0, 2018
Van Wagner, C. E.: Development and structure of the Canadian Forest Fire Weather Index System, Can. Forestry Serv., Technical Report 35, Ottawa, Ontario, 48 pp., 1987.
Vautard, R.,Yiou, P., D'Andrea, F., de Noblet, N., Viovy, N., Cassou, C., Polcher, J., Ciais, P., Kageyama, M., and Fan, Y.: Summertime European heat and drought waves induced by wintertime Mediterranean rainfall deficit, Geophys. Res. Lett., 34, L07711, https://doi.org/10.1029/2006GL028001, 2007.
Viedma, O., Quesada, J., Torres, I., Santis, A. D., and Moreno, J. M.: Fire severity in a large fire in a Pinus pinaster forest is highly predictable from burning conditions, stand structure, and topography, Ecosystems, 18, 237–250, https://doi.org/10.1007/s10021-014-9824-y, 2015.
Wang, Y., Anderson, K. R., and Suddaby, R. M.: Updated source code for calculating fire danger indices in the Canadian Forest Fire Weather Index System, Information Report NOR-X-424, Canadian Forest Service, Northern Forestry Centre, Edmonton, Alberta, Canada, 36 pp., 2015.
Wilks, S. S.: The Large-Sample Distribution of the Likelihood Ratio for Testing Composite Hypotheses, Ann. Math. Stat., 9, 60–62, https://doi.org/10.1214/aoms/1177732360, 1938.
Wilks, D. S.: Parametric Probability Distributions, in: Statistical Methods in the Atmospheric Sciences, 3rd edition, Academic Press, Oxford, UK, 71–131, https://doi.org/10.1016/B978-0-12-385022-5.00004-X, 2011.