the Creative Commons Attribution 4.0 License.
the Creative Commons Attribution 4.0 License.
 | 01 Oct 2019
Stability charts based on the finite element method for underground cavities in soft carbonate rocks: validation through case-study applications
Michele Perrotti
Piernicola Lollino
Nunzio Luciano Fazio
Mario Parise
The stability of man-made underground cavities in soft rocks interacting with overlying structures and infrastructures represents a challenging problem to be faced. Based upon the results of a large number of parametric two-dimensional (2-D) finite-element analyses of ideal cases of underground cavities, accounting for the variability both cave geometrical features and rock mechanical properties, specific charts have been recently proposed in the literature to assess at a preliminary stage the stability of the cavities. The purpose of the present paper is to validate the efficacy of the stability charts through the application to several case studies of underground cavities, considering both quarries collapsed in the past and quarries still stable. The stability graphs proposed by Perrotti et al. (2018) can be useful to evaluate, in a preliminary way, a safety margin for cavities that have not reached failure and to detect indications of predisposition to local or general instability phenomena. Alternatively, for sinkholes that already occurred, the graphs may be useful in identifying the conditions that led to the collapse, highlighting the importance of some structural elements (as pillars and internal walls) on the overall stability of the quarry system.


The presence of underground cavities as a result of past mining operations of soft rocks, to be used as building material, nowadays induces high-risk conditions for those regions characterized by a large number of underground quarries and mines. In the Apulia region (southern Italy), soft and very soft carbonate rocks such as calcarenites of the Pliocene or Pleistocene age have been largely used (Parise, 2010, 2012), especially in the last century, in many types of construction, so a diffuse net of cavities, nowadays underlying urban areas and infrastructures, was excavated in the last century and abandoned afterwards. In recent years, several collapses affected some of these cavity systems, involving structures and roads located at the ground surface and, therefore, inducing high risk for human life and properties (Fiore and Parise, 2013). These effects are caused by degradation processes of these rock materials as a consequence of weathering- or human-induced actions over time (Ciantia et al., 2015); as a consequence, the stability of the quarries may evolve after decades from the time of excavation, giving rise to local or global cave instabilities and failures.
The problem of assessing the stability of underground cavities in soft rocks is generally faced with approaches characterized by different levels of accuracy and reliability. Phenomenological and analytical approaches are generally chosen in the preliminary stage of the analysis to deduce if the rock mass is close to instability or not (Gesualdo et al., 2001; Fraldi and Guarracino, 2009; Carter, 2014). Later on, more deterministic and accurate approaches could be adopted, such as those based on numerical modeling (Goodings and Abdulla, 2002; Ferrero et al., 2010; Parise and Lollino, 2011; Castellanza et al., 2018). The last mentioned approach can be very useful nowadays, because three-dimensional studies can be carried out due to the availability of powerful numerical codes, which are capable of treating a wide range of problems related to the structural features of the rock mass examined (for both continuous or discontinuous rock masses). However, although remaining the most efficient way of dealing with stability problems at the specific site scale, sophisticated numerical techniques cannot be applied effectively to a large dataset of stability assessments because they require a large amount of detailed input data, which are not frequently available, and consequently they cannot be practically used for a preliminary evaluation. On the contrary, wide regions throughout the world (e.g., southern part of Italy) are characterized by a huge number of cavities affecting the underground environment, so representative three-dimensional numerical analyses cannot be developed efficiently for all the case studies. For this reason, physically or mechanically based stability charts can be useful to provide a preliminary assessment on the stability of the underground system, as a function of the geometrical and mechanical parameters (Evangelista et al., 2003; Federico and Screpanti, 2003; Suchowerska et al., 2012). It is worthwhile remarking that the use of stability graphs should be considered only as a preliminary stage of the complete procedure to be followed for the stability assessment (Castellanza et al., 2018; Fiore et al., 2018). Therefore, when a medium to high level of hazard results from the application of the charts here proposed, more detailed and site-specific investigations must be applied. Based upon the results of a large number of parametric two-dimensional (2-D) finite-element analyses of ideal cases of underground cavities that considered variability of geometrical features and mechanical properties found for a large number of underground cavities excavated in soft carbonate rocks, Perrotti et al. (2018) have proposed specific charts to assess at a preliminary stage the cave stability and to evaluate a safety margin with respect to the occurrence of failure.
The purpose of this paper is to validate the efficacy of the aforementioned stability charts proposed by Perrotti and coauthors by means of the application to several case studies of underground cavities, either subjected to collapse in the past or still stable, based upon the geometrical features and the geomechanical parameters known for the case studies; stability charts were applied either to (i) cases of sinkholes or to (ii) cavities that have not reached the collapse; in the first case (i) they show the importance of specific structural elements as pillars and partitions on the stability of the entire system of quarries, while in the second case (ii) it is possible to assess the degree of susceptibility and predisposition to instability phenomena.
Perrotti et al. (2018) have proposed a two-dimensional finite-element parametric study that accounts for ideal schemes of rectangular cavities, as shown in Fig. 1, with variable geometrical parameters, such as the cavity width (L), the cavity height (h) and the overburden thickness (t). A large set of 2-D finite-element analyses were carried out using Plaxis 2D software in order to evaluate possible correlations between geometrical features of cavities and material strength parameters. The ranges of variation of these variables are consistent with the typical intervals of values observed for man-made Apulian underground quarries excavated in soft carbonate rocks, belonging to the Calcarenite di Gravina Formation (Coviello et al., 2005; Andriani and Walsh, 2010; Ciantia et al., 2015). In particular, the cavity width, L, is assumed to vary in a range from 1 to 30 m; the cavity height, h, in a range from 2 to 8 m; and the overburden thickness, t, in a range from 2 to 10 m. Additional 3D-FEM analyses were also performed to evaluate the effect of the rock confinement in the third direction, which, generally, results in increasing the stability of underground quarries with respect to the 2-D analyses.
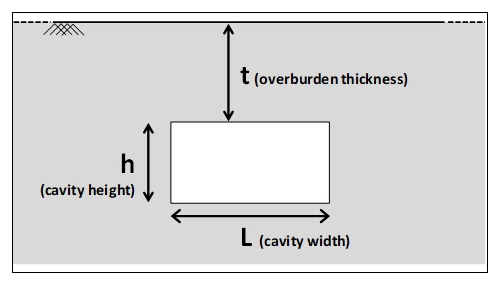
Figure 1Geometrical parameters of the cavity (h: cavity height; L: cavity width; t: overburden thickness).
The mechanical behavior of the soft and very soft carbonate rocks has been schematized according to an elastic perfectly plastic constitutive model characterized by a Hoek–Brown failure criterion (Hoek and Brown, 1997; Hoek and Martin, 2014), which is capable of simulating a nonlinear strength envelope in the Mohr plane, as generally observed for calcarenite rocks; the main mechanical variable chosen in the parametric analyses was the value of uniaxial compressive strength σc; the threshold value σc,min corresponds to the activation of a failure mechanism for the cavity calculated from 2-D FEM analyses assuming the Hoek–Brown parameters reported in Table 1.
Table 1Values of Hoek–Brown parameters assigned in 2-D analyses.
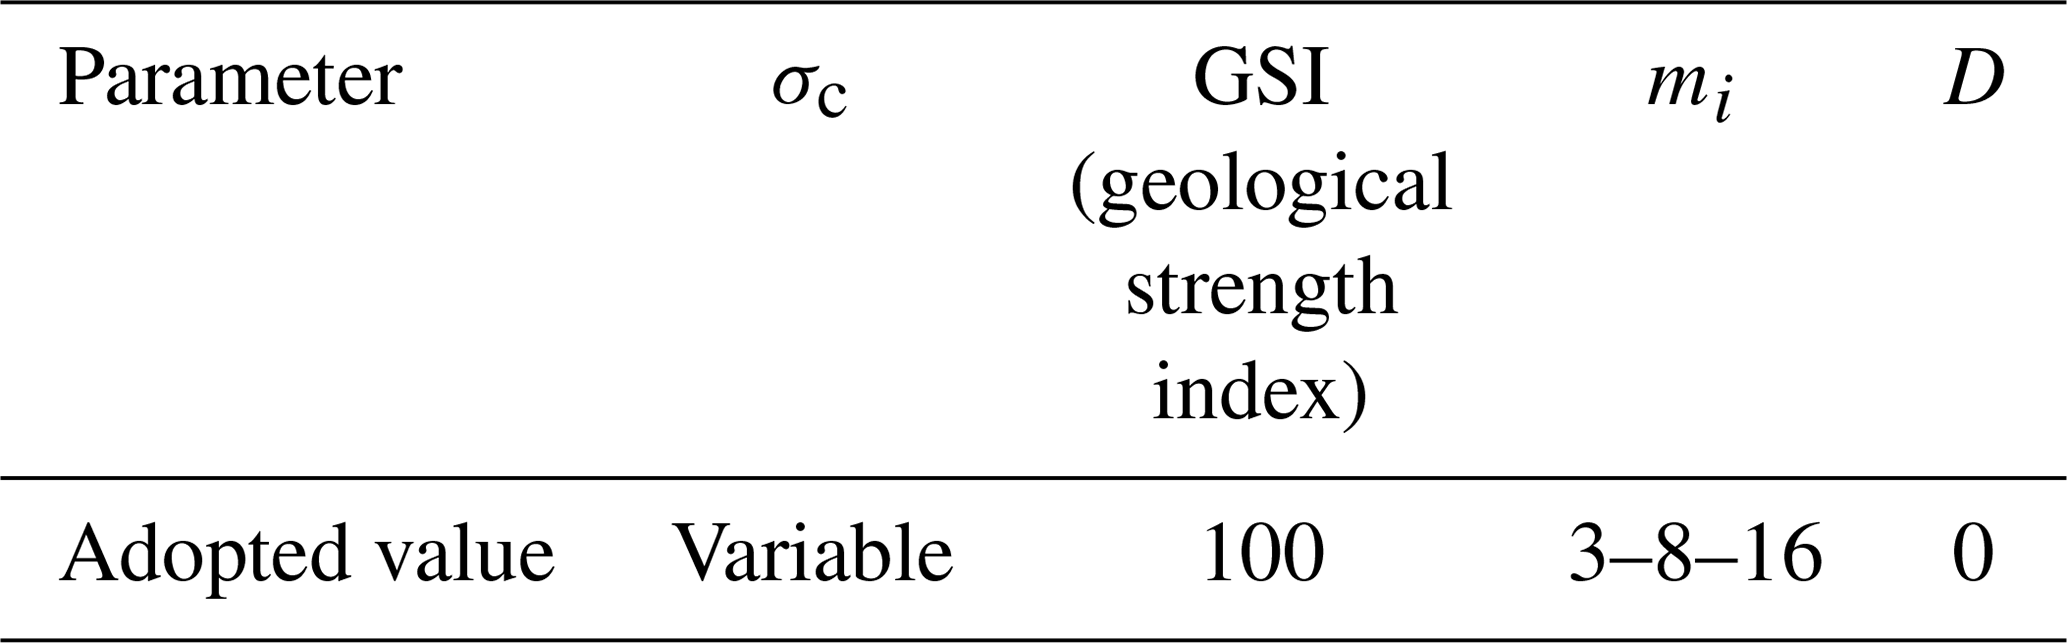
The values of the geological strength index (GSI), mi and D, have been chosen as follows.
Based upon field survey observations, which indicated that these rocks are rarely jointed, the rock mass was assumed to be intact and not affected by discontinuities, and consequently a geological strength index (Hoek, 1994) value equal to 100 was used in the analyses. It follows that the results obtained from the analyses cannot be considered valid for those cases where the rock mass is characterized by single joints or joint sets, so the rock mass behavior has a certain degree of anisotropy that cannot be disregarded.
The parameter mi was defined, in a first approximation, in accordance with the suggestions proposed by Cai (2010), to represent the ratio between the uniaxial compressive and tensile strength of the rock: three different values, equal to 3, 8 and 16, have been chosen in accordance with the values proposed by Hoek (2007) for the specific rock type, as well as with the results of uniaxial compressive and tensile strength tests performed on samples belonging to different varieties of the Calcarenite di Gravina Formation (Andriani and Walsh, 2010).
The parameter D, representative of the disturbance factor induced by the excavation technique, was set equal to zero to simulate a rock mass that has not been disturbed or affected by stress release processes due to the specific hand-excavation technique adopted throughout the whole region (generally, this was the hand-excavation technique with chisels and hammers, adopted in order to obtain large blocks of calcarenites to be used as building material).
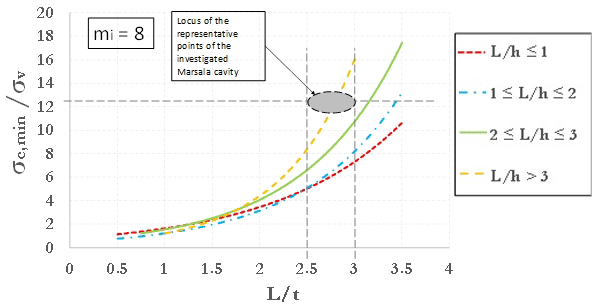
Using fixed values of GSI and D, a large set of 2-D FEM analyses was carried out for each of the three values assumed for mi. Parametric analyses allow one to obtain resulting plots showing the ratio (i.e., threshold value of uniaxial compressive strength mobilized at failure divided by vertical stress before excavation, acting at the depth of the cavity roof) as a function of the nondimensional ratio L∕t, keeping fixed the nondimensional cavity shape ratio L∕h. Stability graphs are shown in Figs. 2–4, as referred to values of mi equal, respectively, to 3, 8 and 16. The curves identify the stable area above the threshold curves. So, considering the value of mi closest to the real value estimated for a specific cavity, it is possible to enter one of three graphs with the ratios σc∕σv and L∕t (and following the curve of the nondimensional cavity shape ratio L∕h) estimated for a cavity to evaluate a safety margin with respect to failure. A point of a generic cavity that is on the line (or below this) is representative of a cavity with collapse that already occurred. It should be pointed out that value of mi greatly influences the results of the curves; in fact, the values on the y axis of three graphs (Figs. 2–4) are very different from each other.
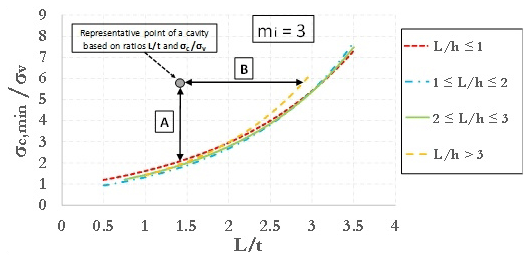
Figure 2Curves of against L∕t for different values of the ratio L∕h (mi=3) (modified after Perrotti et al., 2018).

Figure 3Curves of against L∕t for different values of the ratio L∕h (mi=8) (modified after Perrotti et al., 2018).
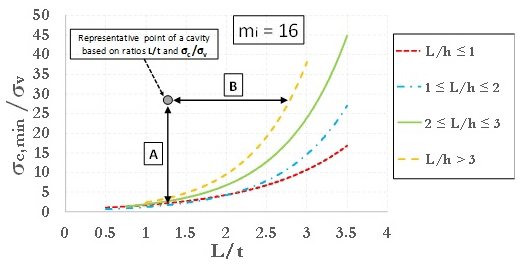
Figure 4Curves of against L∕t for different values of the ratio L∕h (mi=16) (modified after Perrotti et al., 2018).
These stability charts can be used to calculate the safety margin with respect to failure as the ratio between the actual in situ value of the rock uniaxial compressive strength (σc) and the threshold value for stability of the same parameter (σc,min) at the same L∕t value (segment A in Figs. 2–4). Alternatively, the same plots allow one to calculate the maximum value of the width-to-depth ratio (L∕t) allowed for stability (segment B), given the assigned value of the ratio between the in situ uniaxial compressive strength (σc) and the vertical stress (σv).
The following section describes some case studies of man-made underground cavities in soft calcarenites, either subjected to failure or stable, and the corresponding application of the FEM-based charts to evaluate the corresponding unstable or stable conditions as a function of the mechanical and geometrical parameters.
In order to validate the proposed stability charts, six real cases of underground artificial cavities, including three affected by sinkhole failures in the past and three in stable conditions at present, are presented later; it should be noted that the choice of underground quarries to test depends on the assumptions made in drawing up the graphs with regard to both geometric and mechanical characteristics of the cavity. As concerns the geometric features, the cavity must have a (more or less) horizontal roof, with a horizontal ground level surface, and, generally, a generic 2-D section of cavity must be able to be schematized in a rectangular shape, such as that in Fig. 1. The presence of isolated pillars or internal walls between two adjacent rooms of quarry may represent a critical element for a correct schematization, but it is always possible to incorporate such structural elements to evaluate stability conditions with reference to a longer section. From a mechanical point of view, it is necessary that the cavity is excavated in soft carbonate rocks without both particular systems of joints or discontinuities (assumption of value of GSI = 100) and specific excavation techniques (i.e., use of explosives) that can alter the stress state of the rock involved (assumption of value of D=0). The six presented cases fit with the model's assumptions well, and, moreover, a detailed knowledge of sites (availability of maps and surveys for a correct reconstruction of the quarries) allowed the application of the stability charts.
3.1 Barletta sinkhole
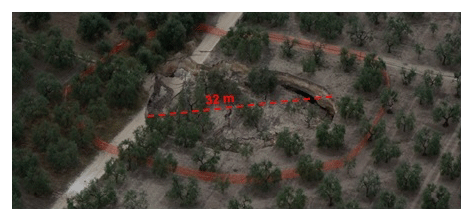
In the night between 2 and 3 May 2010, a large sinkhole occurred in the rural area of San Procopio (De Giovanni et al., 2011; Parise et al., 2013), near the town of Barletta (Apulia, southern Italy); the maximum diameter of the depression has been calculated to be approximately equal to 32 m at the ground surface (Fig. 5).
Later on, geological and speleological surveys have revealed the existence of a complex network of artificial tunnels excavated presumably between the 19th and 20th century in order to extract calcarenite rocks as a building material (De Giovanni et al., 2011; Parise et al., 2013). These studies have revealed that the underground cavity was formed of wide and long tunnels with a large number of isolated pillars showing an irregular spatial distribution, as reported in Fig. 6a. In the sinkhole area (N–W sector of the cavity), the spatial distribution of pillars was coarser as compared with the rest of the cavity system, and it was characterized by the presence of only eight pillars located at a distance of about 10–12 m from the others; as such, these pillars were deemed to be heavily overloaded and probably subjected to high stress conditions.
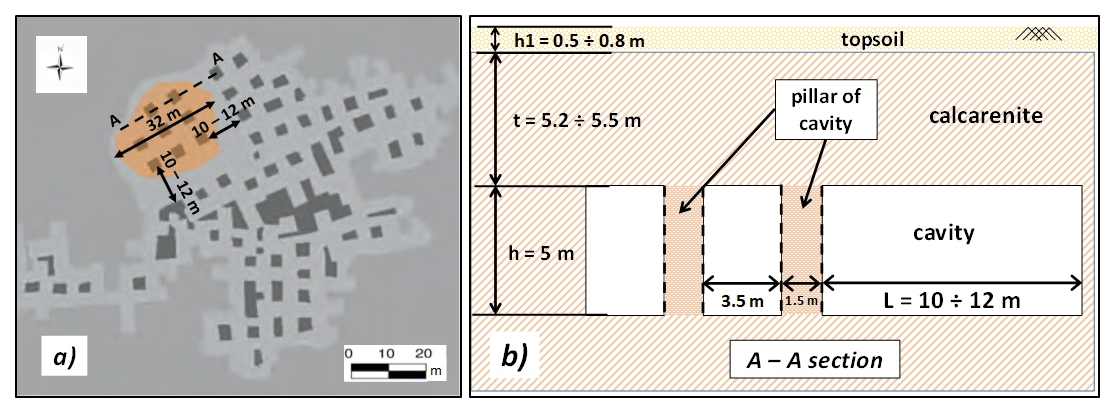
Figure 6(a) Schematic map of the Barletta underground calcarenite quarry (adapted from Luisi et al., 2015; the area involved in the collapse is shown in orange, pillars are in dark gray, and tunnels and excavated zones are in light gray); (b) original stratigraphy of the cavity (before collapse).
In order to detect the causes that led to the collapse of the underground quarry, it should be noted that instability evidence, such as signs of pillar crushing or fractures with detachments from the vault and the walls (Fig. 7), was found throughout the cavity, especially close to the sinkhole area (De Giovanni et al., 2011). Therefore, starting from the original geometrical configuration of the cavity shown in Fig. 6b, the loss of strength produced by the failure of the inner pillars, where high stress conditions are likely, may have generated an increase in the loading conditions for the whole roof, with the consequent generation of a sinkhole mechanism.
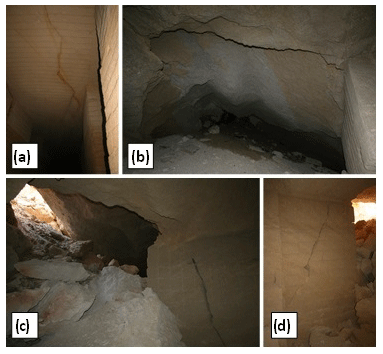
Figure 7Instability evidence at the Barletta underground quarry: (a) tensile fracturing of the vault; (b) block detachment from the vault; (c) open fractures on pillars, and vault collapses in the area closest to the sinkhole; (d) crushing of pillar with joints (adapted from De Giovanni et al., 2011).
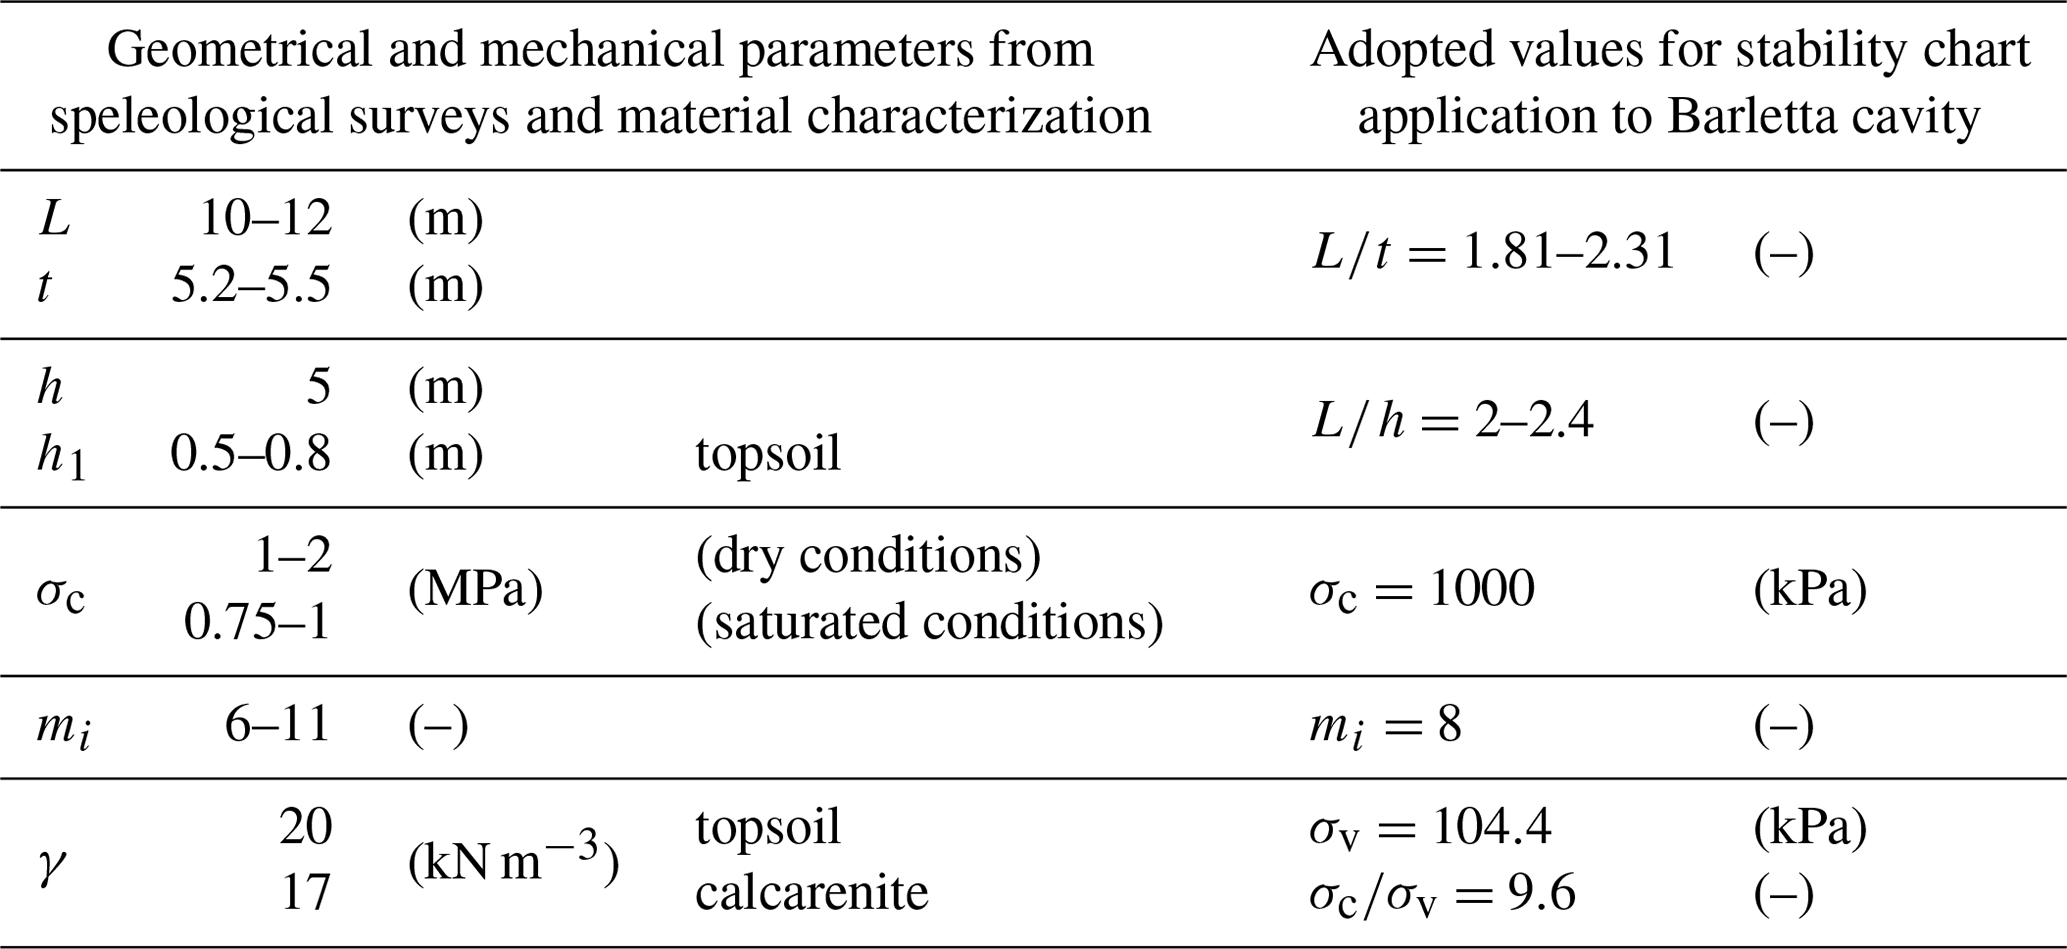
In order to verify the stability conditions using the charts proposed by Perrotti et al. (2018), an initial value of the cavity width of about 10–12 m, corresponding to the largest distance between two adjacent pillars (see Fig. 6), has been assumed, bearing in mind that the failure of the nearby pillars has presumably implied an increase in the effective L parameter. Speleological surveys have indicated an average thickness of the calcarenite deposits in the study area of about 6 m, with a minimum value of 4 m (De Giovanni et al., 2011) and with an upper layer of about 0.5–0.8 m composed of sandy–silty topsoil (unit weight γ=20 kN m−3) overlying a 5.2–5.5 m thick calcarenite layer (γ=17 kN m−3). In the sinkhole area, the height of the cavity rooms has been generally measured to be about 5 m.
Uniaxial compression tests performed in the laboratory on calcarenite samples taken in the sinkhole area have indicated values of uniaxial compressive strength of about 1–2 MPa under dry conditions and about 0.75–1 MPa under saturated conditions (Luisi et al., 2015); tensile strength values derived from indirect tension tests have instead resulted to be approximately equal to 0.1–0.2 MPa. Consequently, the parameter mi to be used in the Hoek–Brown failure criterion results in a range between 6 and 11.
Hence, based on these evaluations, the nondimensional ratios L∕t and L∕h can be estimated in the following ranges: and .
The vertical stress at a depth of h=6 m is estimated to be equal to
and, assuming σc=1 MPa, a ratio σc∕σv equal to about 9.6 is obtained.
In Table 2 the geometrical and the mechanical parameters, derived from speleological surveys and material characterization, are reported; moreover, the values adopted for the application of the stability charts to the Barletta underground quarry are shown.
Table 2Geometrical and mechanical parameters and adopted values for stability chart application to the Barletta underground quarry.
Therefore, considering the chart corresponding to a value mi=8 (Fig. 3), and specifically the curve corresponding to L∕h ratio between 2 and 3, in the initial conditions (pillars that have not failed), the cavity is found to be in the stability zone (Fig. 8); however, if a strength loss of the nearby pillars is accounted for, an increase in the L representative parameter leads to a gradual increase in the ratio L∕t (as well as of L∕h ratio), with the consequent decrease in the safety margin until reaching the threshold curve corresponding to the L∕h value (Fig. 8), thus indicating failure conditions.
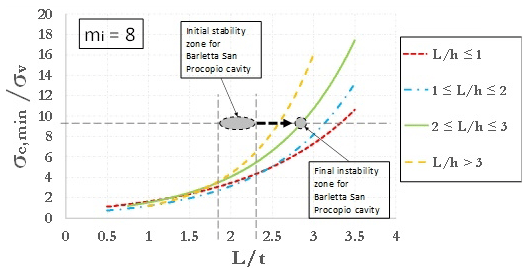
Figure 8 also shows that the cavity is close to failure conditions already for values of ratio L∕t larger than 2.75; therefore, even with the loss of the strength provided by a single pillar, a ratio L∕t corresponding to the achievement of the threshold stability conditions follows.
3.2 Marsala sinkhole
A sinkhole took place in the town of Marsala (Sicily, Italy) in June 2011 in the area where underground quarries were excavated according to the room-and-pillar technique at depths ranging from 3–4 m to about 15 m; after the quarry abandonment, since the 1960s, the cavity has been progressively subjected to instability phenomena, represented by deformations and block detachments from the vaults and the pillars.
A detailed map of the underground cavity luckily existed before the collapse, thanks to a speleological survey carried out in 2000 (Vattano et al., 2013). This allowed us to properly map the sinkhole boundary above the underground quarry; with a minimum diameter of about 25–30 m at the ground level, the sinkhole is shown in Fig. 9. The figure shows that the examined quarry consists of rooms with a quadrangular shape, in most cases connected and/or separated by thin rock walls or pillars. As specifically concerns the sinkhole area, the excavation was carried out according to an irregular scheme, leaving very small pillars and slight internal walls; larger sizes of the internal supporting elements, as well as lower room spans, are instead observed in the rest of the cavity system. The average room height has been estimated to be equal to 2.7 m, with the roof thickness varying from 8.2 to 11.8 m.
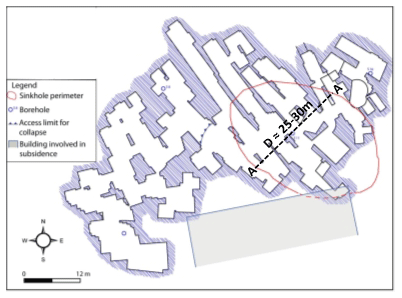
Figure 9Plan of the Marsala underground quarry, with indication of the sinkhole area (adapted from Vattano et al., 2013).
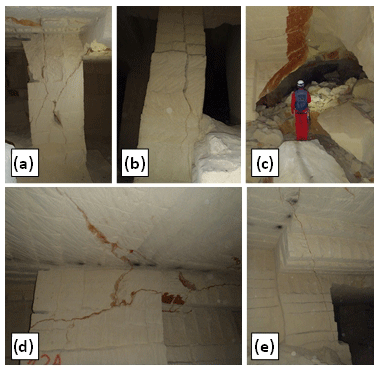
Figure 10Instability evidence at the Marsala underground quarry: (a) fracturing of a pillar; (b) bending and failure of a pillar; (c) material detachments from the vault; (d, e) diffuse fracturing within the walls and the vaults (Bonamini et al., 2013).
For this study, Fazio et al. (2017) have proposed a three-dimensional finite-element back analysis and have found that the weakness of these overstressed internal structural elements could have been the reason for initial local failure and then for global failure. In particular, the collapse of the pillars and the internal walls (very thin along the A-A section of Fig. 9) could have progressively entailed an increase in the width of the open galleries, leading to a total length, L, approximately equal to that of the sinkhole (D≈25–30 m, Fig. 9). Local failures of pillars and thin walls, as well as detachments and fracturing processes of the vault, are widely diffuse within the Marsala cavity, as documented in Fig. 10 (Bonamini et al., 2013).

The calcarenites outcropping in the study area can be schematized according to two lithotypes, with a top layer (thickness in a range between 8.2 and 11.8 m) characterized by poor mechanical properties and a stiffer deeper layer (Fazio et al., 2017); in Fig. 11 the stratigraphy traced along the A-A section of Fig. 9 is reported.
For the upper softer lithotype the dry unit weight is measured in the range between 12 and 15 kN m−3, whereas the same parameter under saturated conditions is between 13.5 and 17 kN m−3. Uniaxial compressive strength under saturated conditions has been measured to reach about σc=1.3–1.6 MPa, whereas with a saturation degree equal to zero σc=2–3 MPa. The value of the tensile strength can be assumed to be 1∕8–1∕10 of the compressive strength, in accordance with experimental works on similar calcarenite rocks (Andriani and Walsh, 2010; Ciantia et al., 2015), so the mi parameter to be used in the Hoek–Brown strength criterion is in a range between 8 and 10.
Table 3Geometrical and mechanical parameters and adopted values for stability chart application to the Marsala underground quarry.
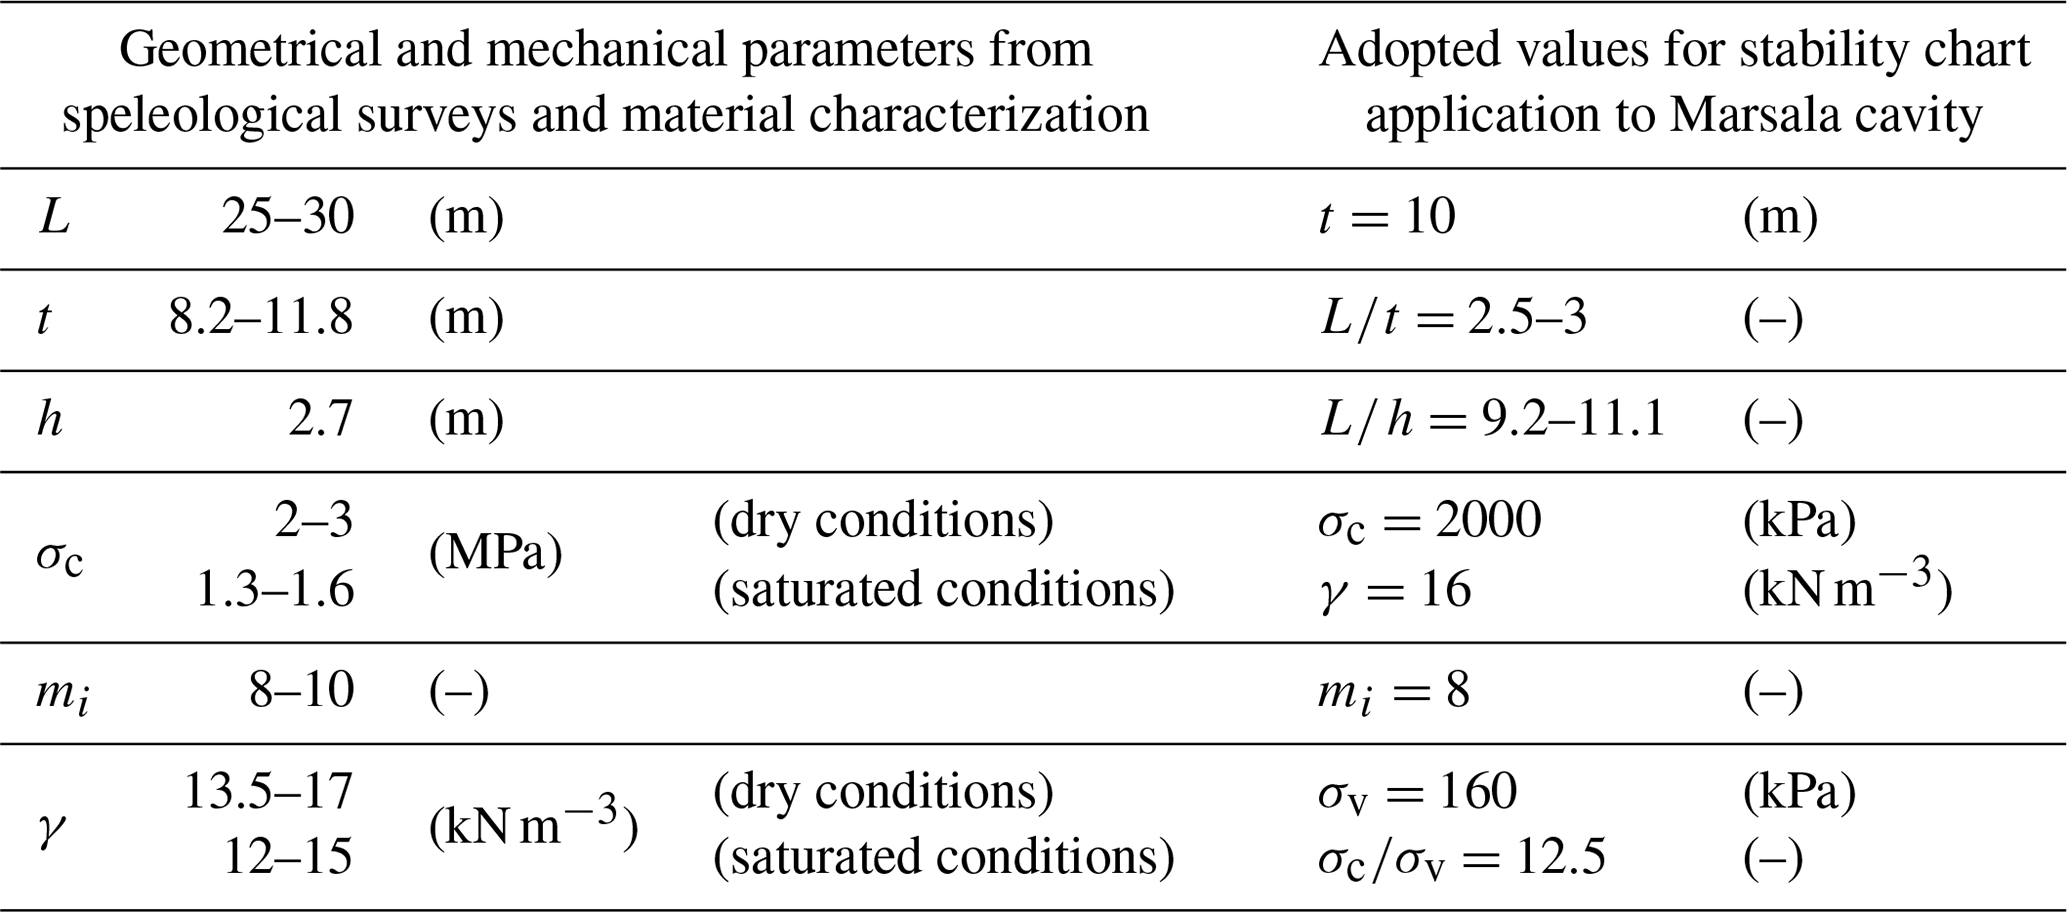
Based on the aforementioned parameters, considering a cavity width L≈25–30 m (corresponding to the collapse of internal pillars and walls in Fig. 9); an average height, h, of 2.7 m; and an average overburden thickness, t, of 10 m, the corresponding nondimensional ratios L∕t and L∕h are in the following ranges: and .
If a unit weight value γcalc of 16 kN m−3 is assumed, the vertical stress at a depth of t=10 m is equal to kPa. Finally, assuming σc=2 MPa (corresponding to an intermediate value between saturated and dry conditions), a ratio σc∕σv approximately equal to 12.5 is obtained.
In Table 3 the geometrical and the mechanical parameters, derived from speleological surveys and material characterization, are reported; moreover, the values adopted for the application of the stability charts to the Marsala underground quarry are shown.
Figure 12 shows the representative state of the Marsala cavity stability in the stability chart corresponding to mi=8. The figure indicates that the state is located on the curve characterized by , and this confirms the unstable condition of the underground quarry.
3.3 Gallipoli sinkhole
In the eastern urban area of the town of Gallipoli (southern Apulia) a large sinkhole occurred in 2007, between 29 March and 1 April, with the opening of a subelliptical 12 m × 18 m chasm (Fig. 13a), followed by a significant widening of the subsidence area at the ground level (Fig. 13b) which affected some buildings located nearby.
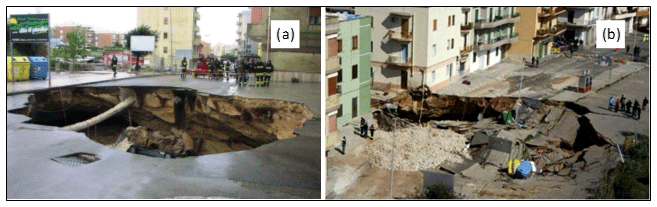
Figure 13Pictures of the 2007 Gallipoli sinkhole: (a) the first sinkhole as appeared in 29 March; (b) enlargement of the chasm on 1 April.
Geological surveys performed soon after the collapse detected the existence of a complex underground cavity net on a single level; although a room-and-pillar excavation technique was adopted, the resulting geometry of the cavity system is highly irregular, with rooms located at variable depth from the ground level: in particular, in the area where the sinkhole occurred, the depth of the cave bottom is about 8 m, with a roof thickness of less than 3–4 m. Moreover, diffuse signs of local instability, such as block detachments from the vault and the lateral walls, debris heaps on the floor and fractures of pillars due to crushing were found within the cavity rooms (Delle Rose, 2007; Parise, 2012). Some of these local instabilities are shown in Fig. 14.
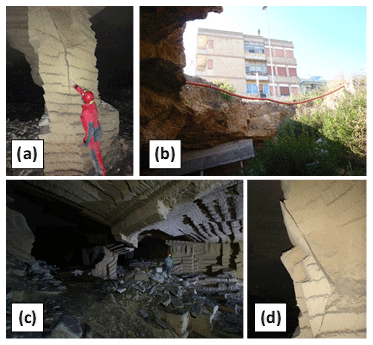
Figure 14Evidence of instability at the Gallipoli underground quarry: (a) extensive fracturing in a pillar; (b) view of sinkhole from the bottom; (c) inner view of one of the longest rooms in the cavity (block detachments from the vault and debris heaps on the floor); (d) incipient block detachment from a pillar.
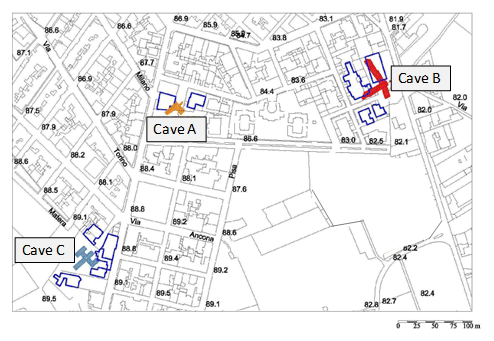
Based on the investigations performed, a reconstruction of the cavity geometry, before the collapse, was carried out. Figure 15 shows the position of the remaining pillars, the zones with the accumulation of debris or detachments of blocks, and the detailed perimeter of the sinkhole for both the first collapse and the subsequent enlargement. The buildings and the roads on the ground surface overlying the area are also shown in the map.

Figure 15Map of the underground quarry in Via Firenze, Gallipoli, and overlying built environment.
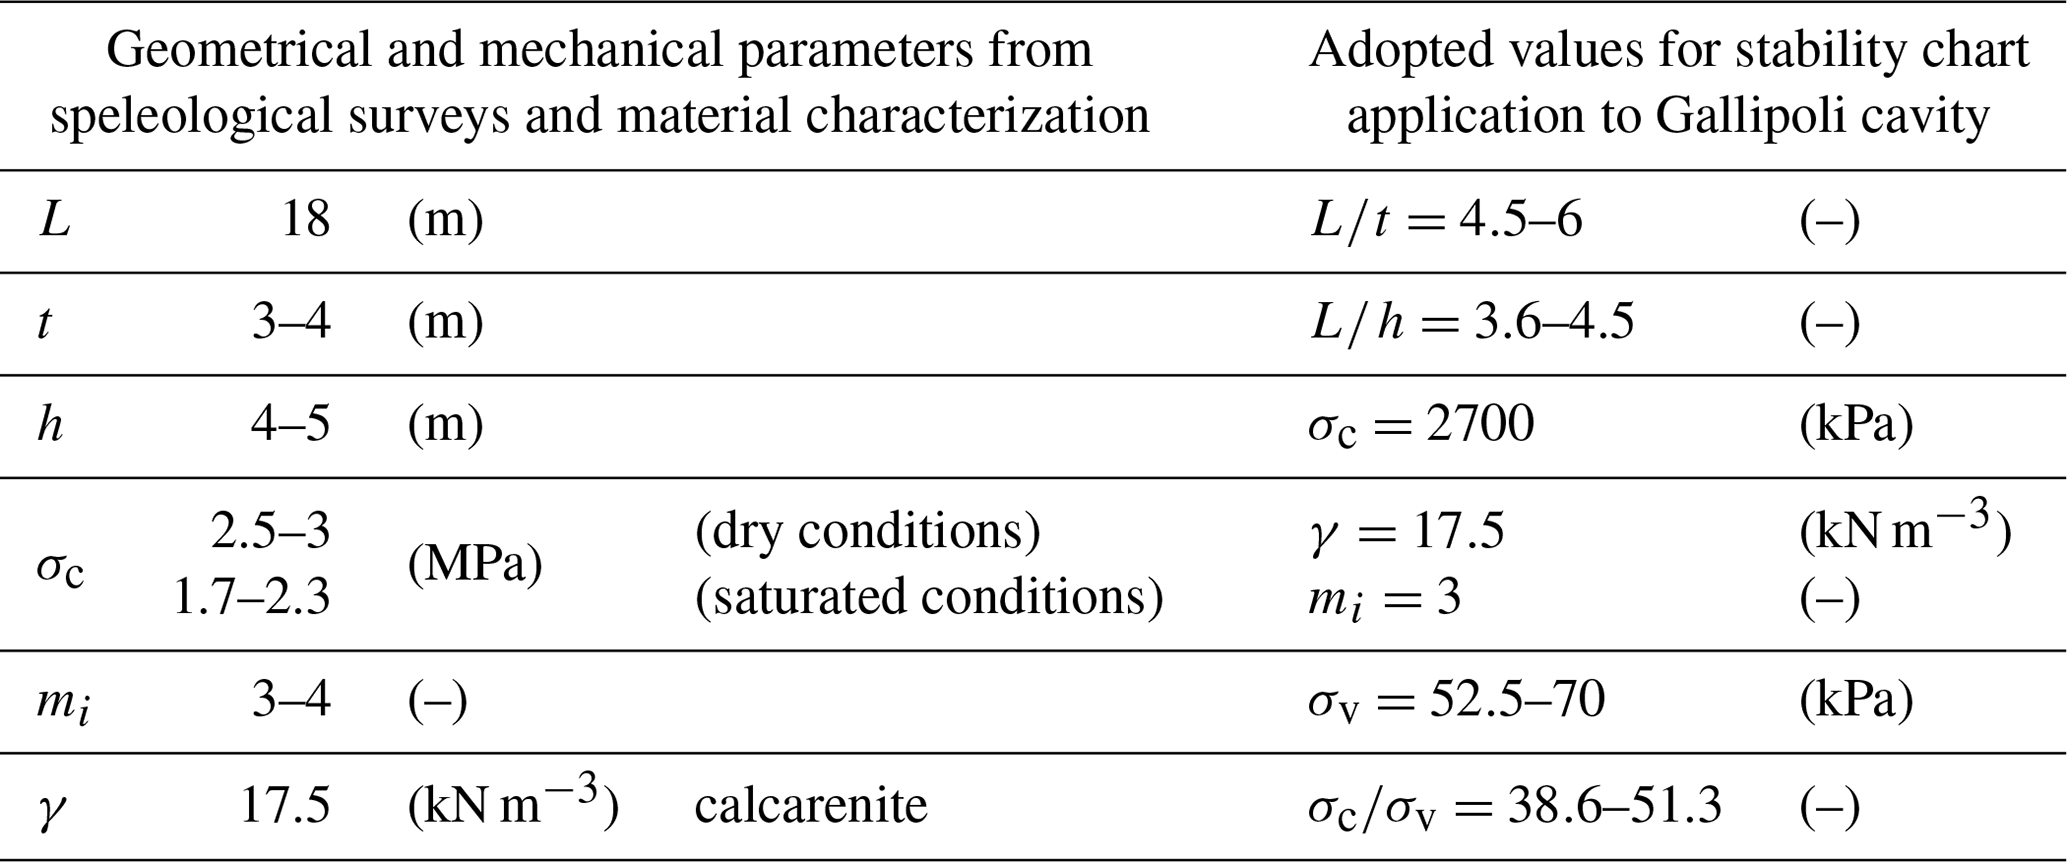
In the sinkhole area, deposits of the Salento calcarenites, consisting of alternations of calcarenite rocks and looser sediments, crop out; the rock volumes affected by the mining activity (i.e., the calcarenite) appear to be massive, whereas the upper layer, forming the cavity roof, is formed of laminated and stratified calcarenite deposits with very low mechanical properties (Delle Rose, 2007; Parise, 2012). Based on the saturation degree, uniaxial compressive strength σc results in a range between 2.5 and 3 MPa for dry samples and 1.7–2.3 MPa for saturated rock (Ciantia et al., 2015). Tensile strength is variable between 0.7 and 1 MPa both in dry and saturated conditions, so a parameter mi=3–4 of the Hoek–Brown failure criterion has been derived accordingly. A unit weight about equal to 17.5 kN m−3 has also been assumed.
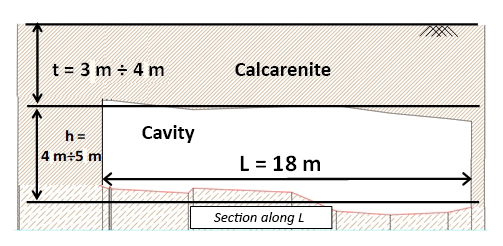
As concerns the application of the stability charts to the Gallipoli case study, a cave width L of about 18 m (Fig. 15) between two adjacent pillars is considered. The section trace along L is reported in Fig. 16; the overburden thickness is assumed to be t=3–4 m, and the height of the cavity is h=4–5 m, so the nondimensional ratios L∕t and L∕h are in the following ranges: and .
The cavity roof is composed almost entirely by the upper calcarenite layers with lower mechanical properties, so a value of σc=2.7 MPa can be assumed. The vertical stress at the depth of h=3–4 m is
and, consequently, the ratio σc∕σv is in the range 38.6–51.3.
In Table 4 the geometrical and the mechanical parameters, derived from speleological surveys and material characterization, are reported; moreover, the values adopted for the application of the stability charts to the Gallipoli underground quarry are shown.
Table 4Geometrical and mechanical parameters and adopted values for stability chart application to the Gallipoli underground quarry.
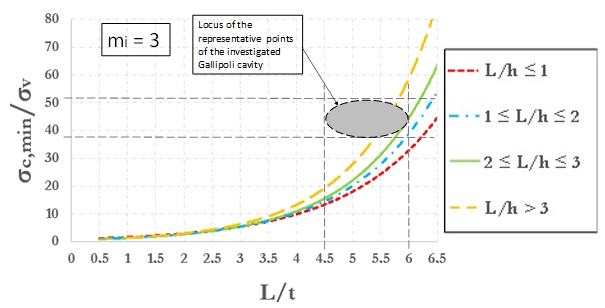
Taking into account the stability charts corresponding to mi=3 and, specifically, the threshold curve for , the representative area of the investigated cavity is very close to the threshold curve (Fig. 17); therefore, it results that the cavity was in a state of incipient failure, so some external factor, for example vibrations or concentrated seepages, could have triggered the instability.
3.4 Cutrofiano underground caves
In the last century several underground quarries were excavated at the outskirts of the town of Cutrofiano (southern Apulia) with the room-and-pillar technique. Later on, these quarries were abandoned, and the urban area expanded above the areas originally distinguished by the presence of cavities. Geological surveys have highlighted, in the southern part of the town, the existence of a diffuse net of underground cavities. The location of three quarries, respectively named Cave A, Cave B and Cave C, with respect to the overlying built-up environment, is reported in Fig. 18.
All the three quarries give evidence of signs of local instability, such as detachments of material from the walls and the vaults or pillar crushing that, frequently, represent prodromal signals of a possible general failure (Parise and Lollino, 2011). Figure 19 highlights some of the typical local failures detected in the Cutrofiano underground quarries.
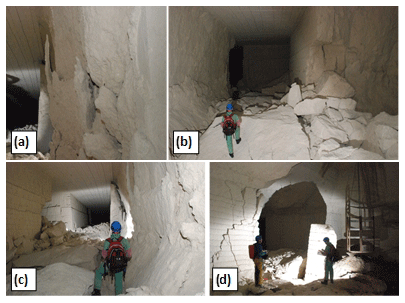
Figure 19Signs of local instability in the Cutrofiano underground quarries: (a) diffuse fracturing of a wall; (b) detachments of material from walls; (c) massive falls from the walls, with heavy production of debris heaps on the floor; (d) open fractures at the pillar rim, in relation to the main shaft of access to the cavity.
For each of the examined cavities, a detailed geometrical and geological survey has been performed. The geological setup of the area is formed of shallow layers of clays, silts and/or sands that overlie a stiffer layer of calcarenite, locally named “Mazzaro”, which generally represent the roof of the quarries. Therefore, in order to apply the stability charts the Mazzaro level has been considered.

Figure 20Plan and stratigraphy of the underground cavity A (adapted from Maglio and Ligori, 2014).
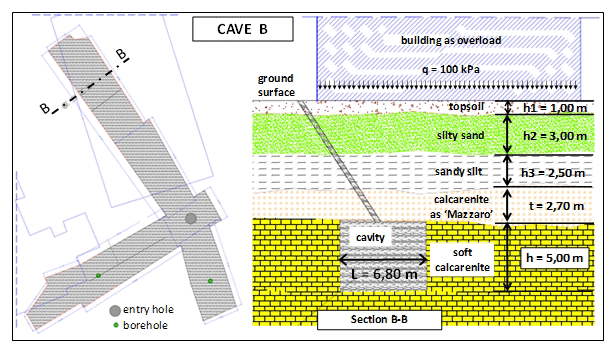
Figure 21Plan and stratigraphy of the underground cavity B (adapted from Maglio and Ligori, 2014)
From a geomechanical point of view, unit weight values in the range of 18.6–19.6 kN m−3 for silty/sandy layers and 19.8–20.5 kN m−3 for the calcarenite layer have been respectively accounted for. A uniaxial compressive strength of about 2.4 MPa has been measured for the Mazzaro material forming the cave roofs (Lollino and Parise, 2010), whereas the tensile strength is about 1∕8–1∕10 of the compressive one, so the parameter mi of the Hoek–Brown failure criterion is assumed to be equal to mi=8–10. In the following subsections, the representative conditions of each cavity are shown with respect to the corresponding chart.
3.4.1 Cave A
The stability analysis for cavity A has been carried out with reference to the cross section A-A in Fig. 20. The width and height of the cavity are, respectively, equal to L=7.50 m and h=5.0 m, while the thickness of the resistant portion of the cave roof, which in this case is coincident with the Mazzaro rocky layer, is t=4.30 m. Therefore, the nondimensional ratios are about and .
With reference to the stratigraphy in Fig. 20, the vertical stress at the depth of the cavity roof is equal to
so, if MPa, we obtain an operative value of .
In Table 5 the geometrical and the mechanical parameters, derived from speleological surveys and material characterization, are reported; moreover, the values adopted for the application of the stability charts to the Cutrofiano Cave A are shown.
Table 5Geometrical and mechanical parameters and adopted values for stability chart application to the underground Cutrofiano Cave A (Maglio and Ligori, 2014; Parise and Lollino, 2011).
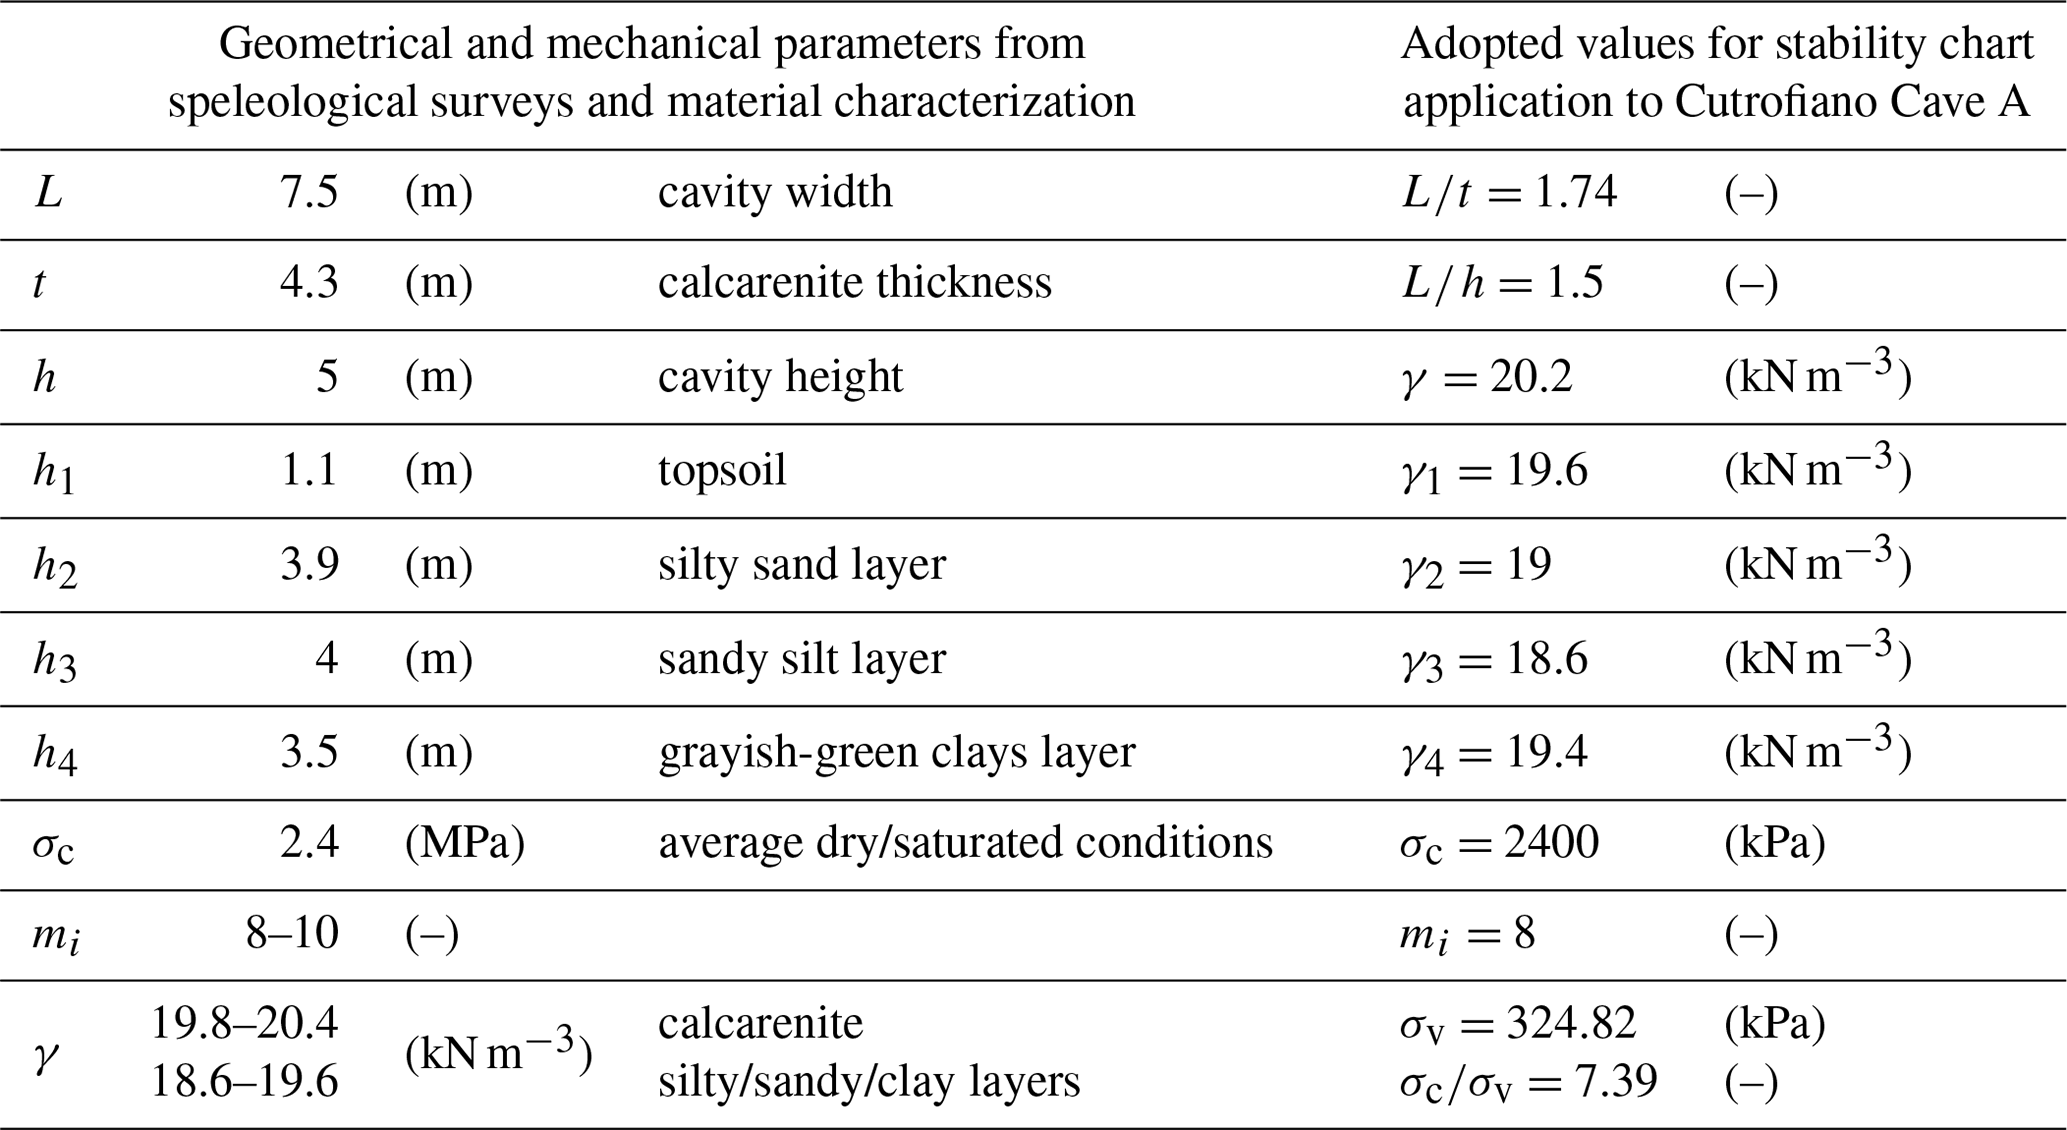
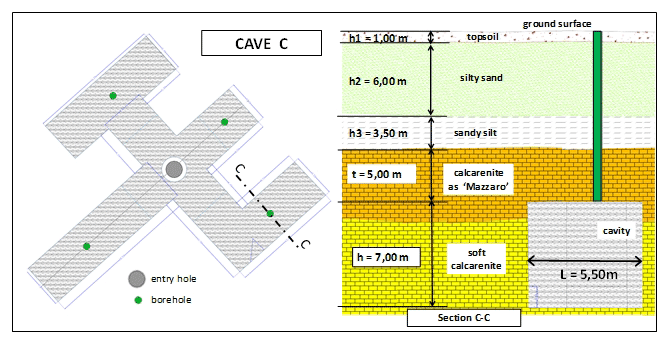
Figure 22Plan and stratigraphy of the underground cavity C (adapted from Maglio and Ligori, 2014).
3.4.2 Cave B
For cave B the calculation has been performed for section B-B in Fig. 21. It has to be noted that in this case a two-story civil building exists just above the cavity, thus representing a further overburden stress, which has been approximately evaluated equal to q=100 kPa.
The width and the height of the cavity are equal to L=6.80 m and h=5.00 m, respectively, while the thickness of the resistant beam-shaped portion of the roof, i.e., the Mazzaro layer, is t=2.70 m. Therefore, the nondimensional ratios are about and .
With reference to the stratigraphy in Fig. 21, the vertical stress at the depth of the cavity roof is equal to
so, if σc=2.4 MPa, the mobilized value of σc∕σv is equal to 8.64.
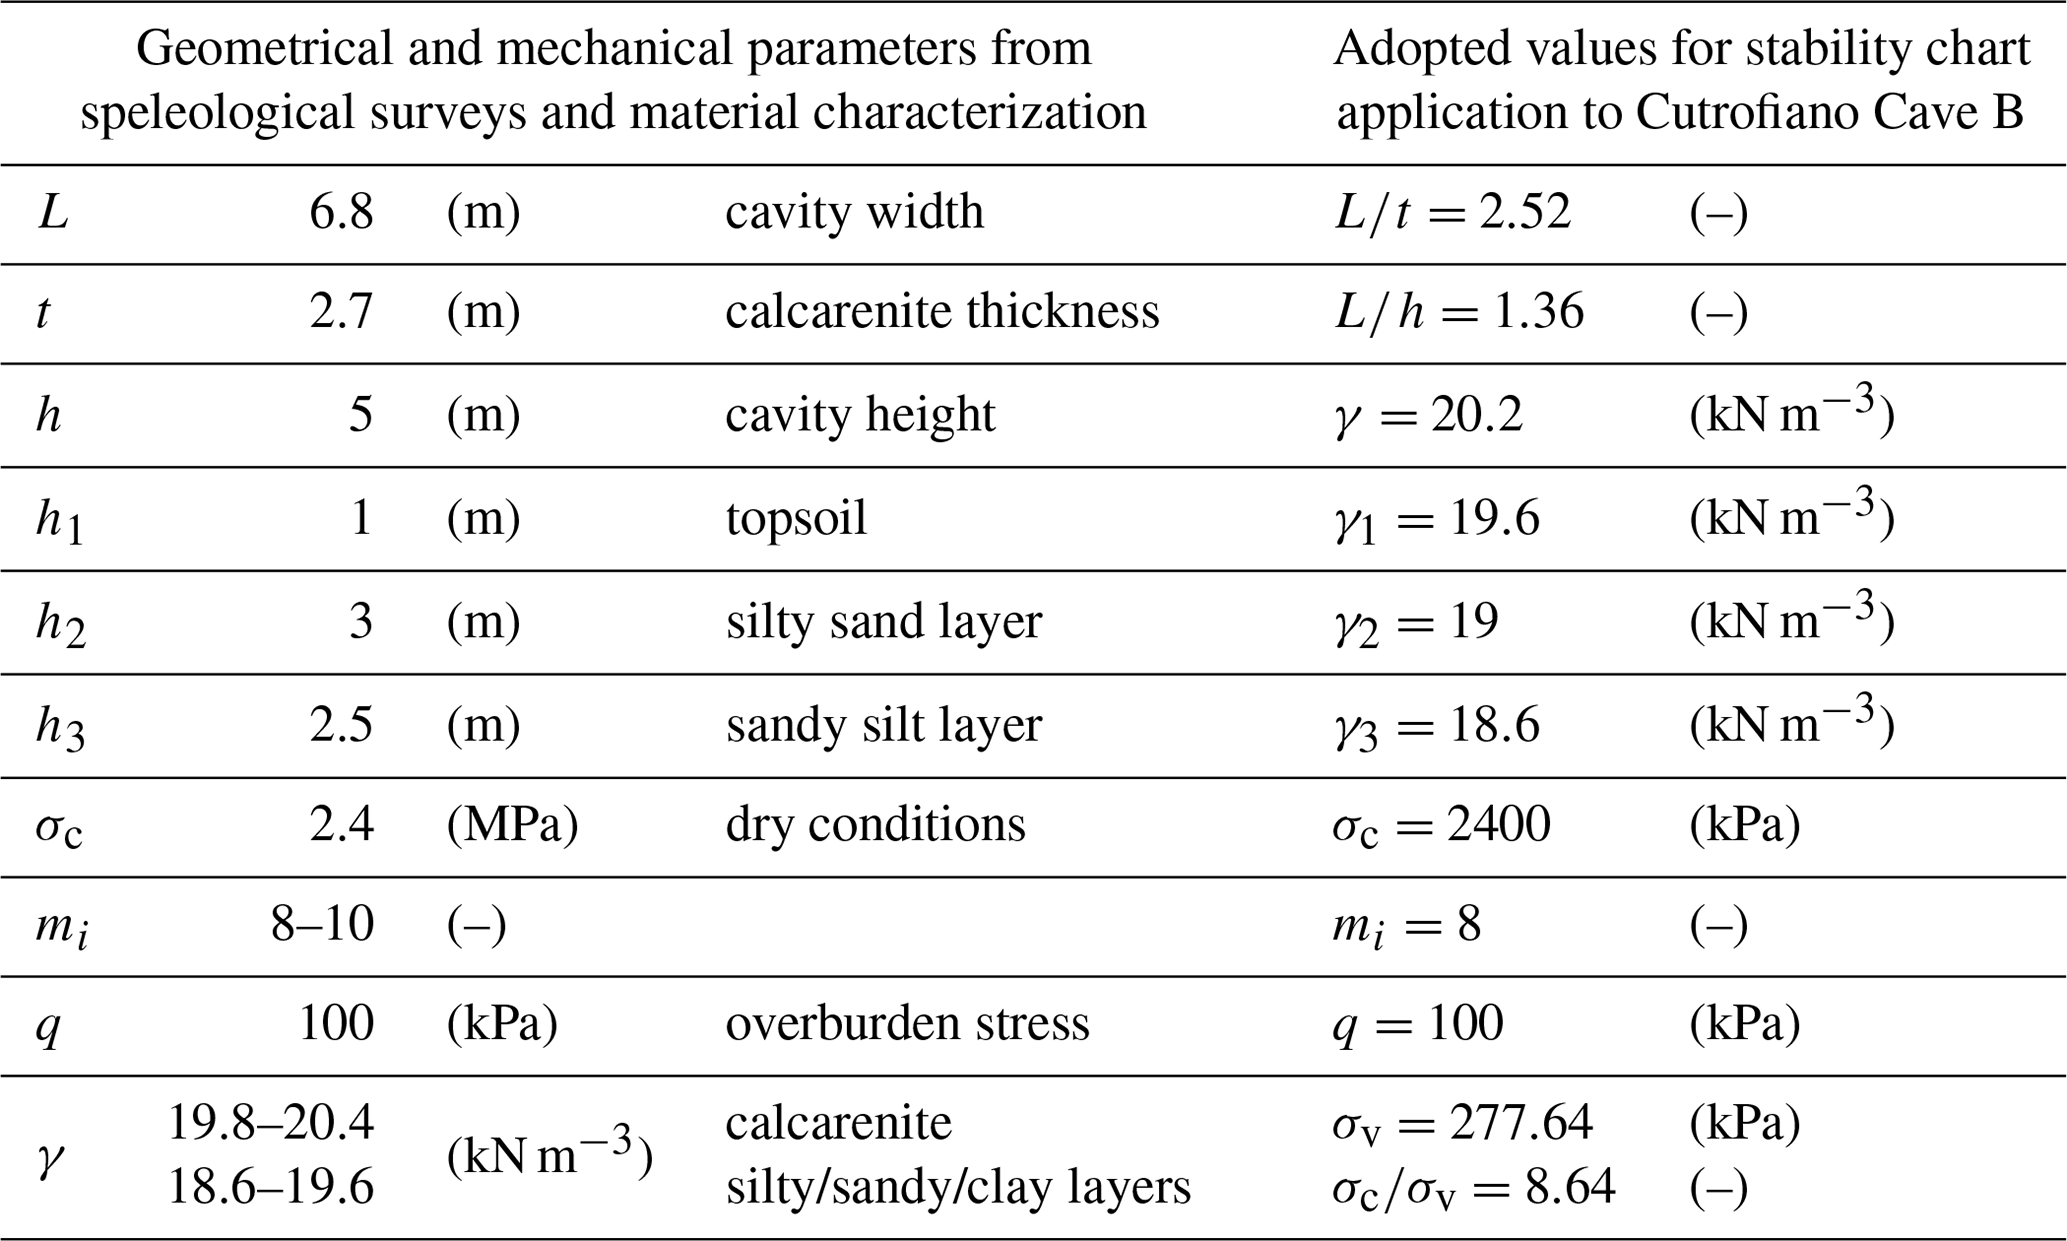
In Table 6 the geometrical and the mechanical parameters, derived from speleological surveys and material characterization, are reported; moreover, the values adopted for the application of the stability charts to the Cutrofiano Cave B are shown.
Table 6Geometrical and mechanical parameters and adopted values for stability chart application to the underground Cutrofiano Cave B (Maglio and Ligori, 2014; Parise and Lollino, 2011).
3.4.3 Cave C
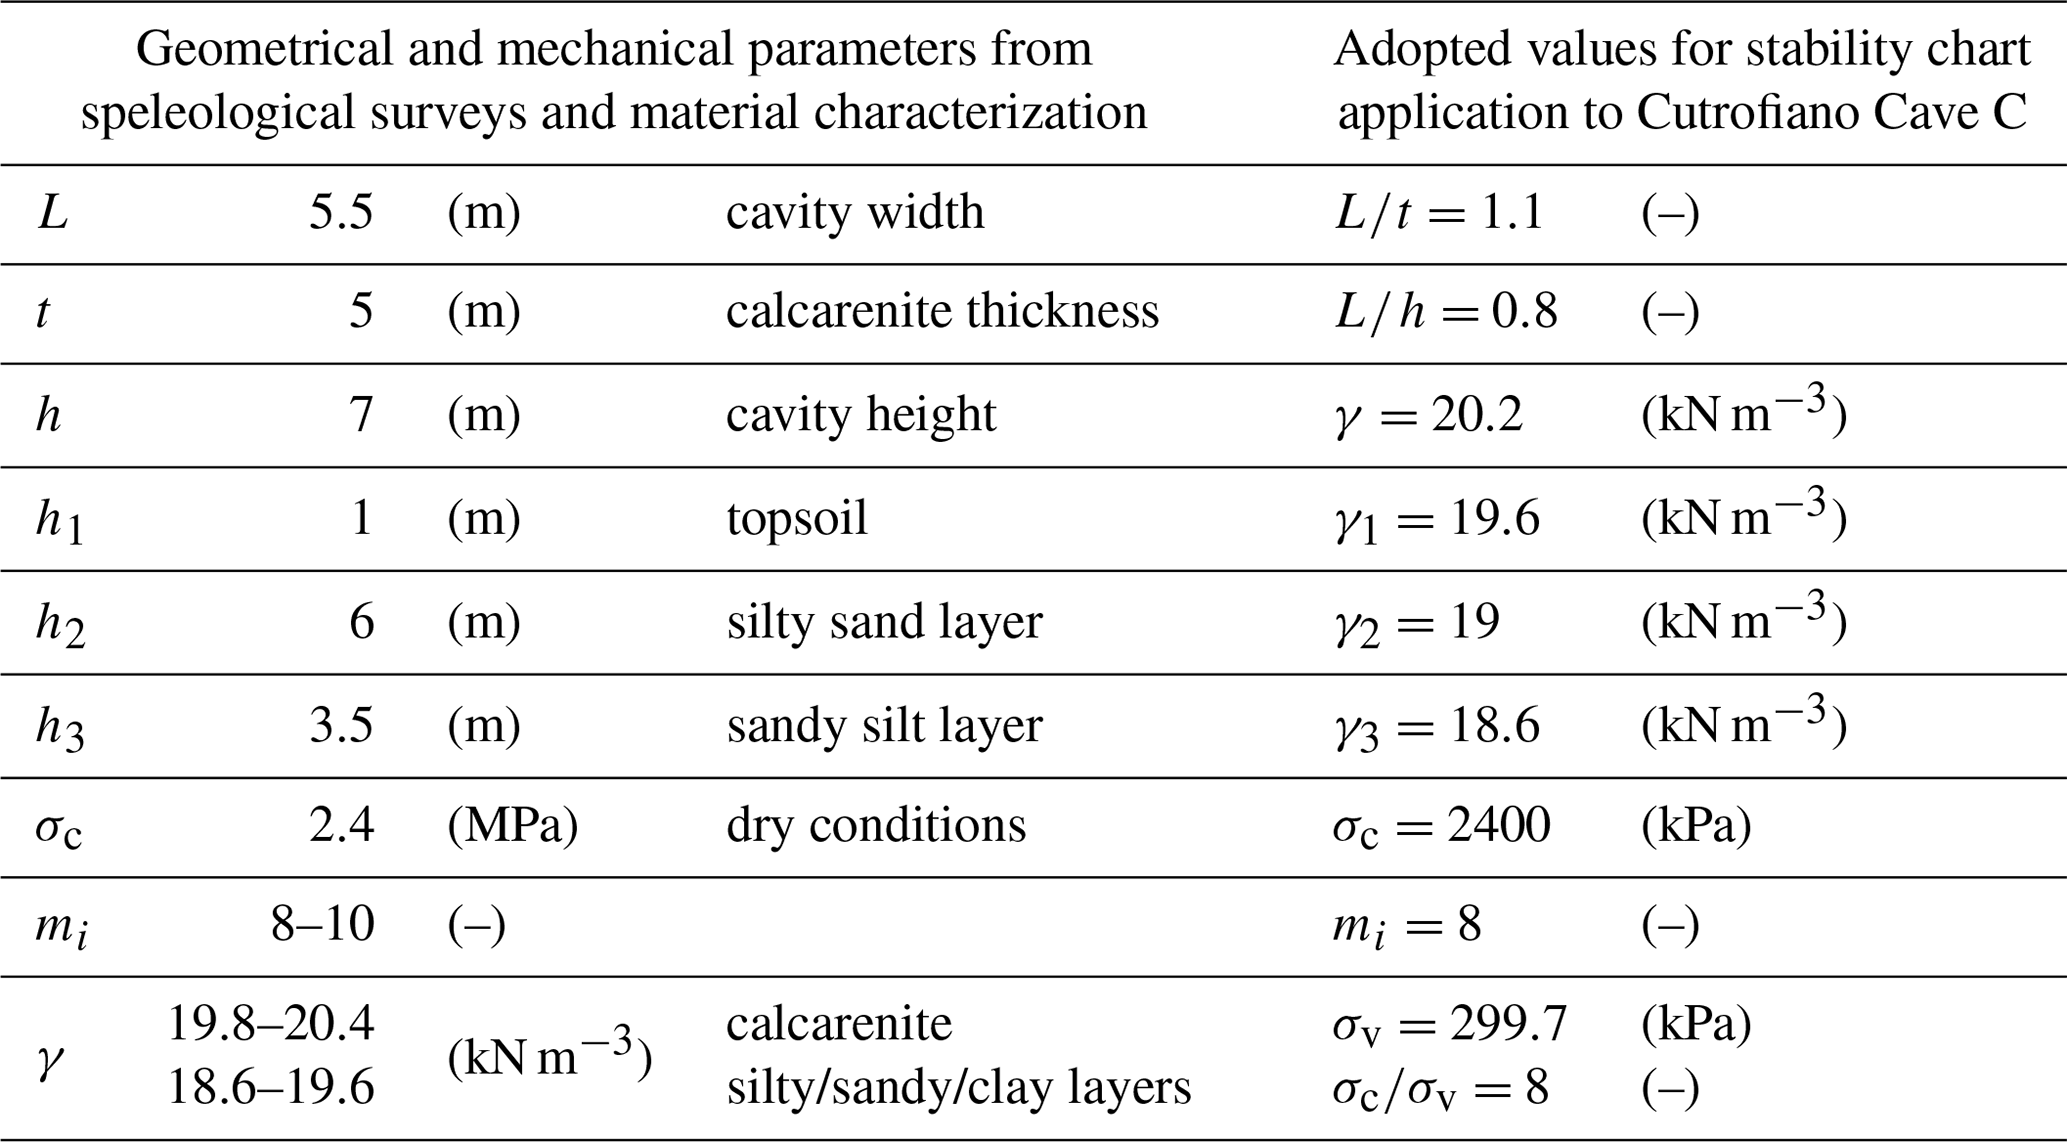
For cave C the calculation has been performed for section C-C in Fig. 22. The cave width and height are, respectively, equal to L=5.50 m and h=7.00 m, while the thickness of the resistant roof is t=5.00 m and the corresponding nondimensional ratios result about and .
In this case, the vertical stress at the depth of the cavity roof is
and, assuming σc=2.4 MPa, we obtain .
In Table 7 the geometrical and the mechanical parameters, derived from speleological surveys and material characterization, are reported; moreover, the values adopted for the application of the stability charts to the Cutrofiano Cave C are shown.
Table 7Geometrical and mechanical parameters and adopted values for stability chart application to the underground Cutrofiano Cave C (Maglio and Ligori, 2014; Parise and Lollino, 2011).
3.4.4 Application of stability chart (mi=8) to the three underground quarries at Cutrofiano
With calculated values of ratios L∕t and σc∕σv it is possible, for the three caves A–C of Cutrofiano, to apply a stability chart with a value of mi=8 as shown in Fig. 23. Based on the L∕h estimated ratios, Cave A and Cave B take into account the light blue curve (); for Cave C the corresponding curve in the graph is reported in red color ().
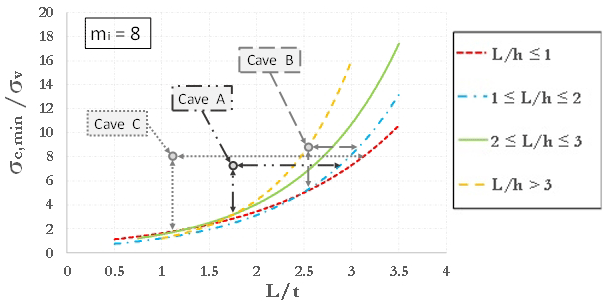
Figure 23Application of the stability chart (mi=8) to the three underground quarries at Cutrofiano.
It can be pointed out that all the three cavities are in the stable zone of the chart of Fig. 23, although with different safety margins; in fact, the margin of safety for Cave B is low, even for the presence of the overlying building. Cave A and cave C seem to be the most stable, also in relation to the geometry of the caves as well as to the thickness of the Mazzaro resistant layer.
In this paper, in order to validate the efficacy of the stability charts of Perrotti et al. (2018), six case studies of underground artificial cavities, including three affected by sinkhole failures in the past and three in stable conditions at present, have been presented. Practical application of graphs to real case studies is essential to assess the goodness of previous results; from this point of view, the proposed stability charts seem to be a valid method to evaluate the stability of underground cavities in soft carbonate rocks. The study of sinkholes is generally very complex, due to both the problem of reconstructing the geometric scheme before failure and the difficulties in identifying the corresponding triggering factors. Moreover, these types of failures occur for abandoned cavities for which a detailed geometry is typically not available (the Marsala case presented here was an exception to this rule). Nevertheless, postfailure in situ surveys can help in this task and bring out, especially, what the most likely causes leading to collapse are.
For the Barletta and Marsala sinkhole case studies, the failure of the underground cave highlighted the vulnerability of the internal supporting elements, such as singular pillars, on the entire system of quarry: as such, the loss of material strength with time, due to weathering effects, could lead to local instabilities, such as detachments of rocks from the pillars, and, consequently, a reduction of the resistant cross section that, in the long term, could result in a general pillar crushing. If the surrounding pillars are not able to sustain the stresses redistributed due to the previous instabilities, a progressive failure process of the internal pillars is likely to occur. This, in turn, leads to the increase in the distance between supporting elements, i.e., the cavity width, and therefore the possible general failure of the whole cave, with the development of a sinkhole (generally, of the collapse or cover collapse types; Gutierrez et al., 2014). Similarly, in addition to the pillars, even the partition walls can represent weakness elements of the system, especially when they are thin. Typically, soft and very soft rocks are exposed at a natural process of degradation (mainly due to the weathering effects with cyclical and seasonal fluctuations of water content) that may accelerate when overloads induced by underground works or vehicular traffic are applied. In an incipient state of collapse, such as that found in the stability chart of the Gallipoli underground quarry, low rates of vibrations could lead toward an acceleration of crack tensile opening with, consequently, propagation of fractures and formation of a sinkhole.
When underground quarries are suitably surveyed and mapped, a quantitative assessment of the stability conditions is possible; from this point of view, as shown for the three cases of underground quarries at Cutrofiano, stability charts allow one to preliminarily evaluate the risk of an incipient collapse. For all the Cutrofiano case studies, stability charts have been applied for the section where the ratio L∕t is the biggest within the cavity, in order to consider the most dangerous area in terms of safety: they resulted in stable conditions, although with different safety margins. Furthermore, using stability charts is possible, within the same cavity, to distinguish the areas more susceptible to instability phenomena. Based on these evaluations, the management of underground quarries may change according to the evolution of the corresponding stability conditions.
It is important to highlight once again that the use of stability charts is limited to the stage of preliminary analysis. This means that such charts, especially when built upon a very high number of cases, could be extremely useful to technicians and practitioners for a first evaluation of the stability conditions. However, if a susceptibility to collapse is ascertained through the stability chart, it is absolutely necessary to move to the next stage by carrying out site-specific tests and geotechnical laboratory tests on rock samples for the determination of the parameters needed for a full analysis of stability. The main limit of such an approach is therefore represented by an erroneous use of the charts, with the wrong belief that they could act as a substitute to in situ and laboratory tests. Notwithstanding such a drawback, the approach presented here can definitely be of help, especially when a high number of cavities need to be initially assessed, as concerns the stability standpoint.
No data sets were used in this article.
MiP conceived and performed the analyses and wrote the sections related to the case study validations. NLF contributed to the analysis development. PL supervised the analyses and wrote the introduction, the discussion and the concluding remarks. MaP provided the case study data and performed the geological analyses.
The authors declare that they have no conflict of interest.
This research has been supported by the CNR IRPI Bari.
This paper was edited by Heidi Kreibich and reviewed by Ognjen Bonacci and one anonymous referee.
Andriani, G. F. and Walsh, N.: Petrophysical and mechanical properties of soft and porous building rocks used in apulian monuments (South Italy), Spec. Publ. 333, Geol. Soc., London, 129–141, 2010.
Bonamini, M., Di Maggio, C., Lollino, P., Madonia, G., Parise, M., and Vattano, M.: Sprofondamenti di origine antropica nell'area di Marsala (Sicilia occidentale) analizzati mediante rilievi in sito e analisi numerica dei processi di instabilità nelle cave sotterranee, Mem. Descr. Carta Geol. d'It., 93, 105–120, 2013.
Cai, M.: Practical estimates of tensile strength and Hoek–Brown strength parameter mi of brittle rocks, Rock Mech. Rock Eng., 43, 167–184, 2010.
Carter, T. G.: Guidelines for use of the scaled span method for surface crown pillar stability assessment, Ontario Ministry of Northern Development and Mines, Ontario, 1–34, 2014.
Castellanza, R., Lollino, P., and Ciantia, M. O.: A methodological approach to assess the hazard of underground cavities subjected to environmental weathering, Tunnel. Undergr. Space Tech., 82, 278–292, https://doi.org/10.1016/j.tust.2018.08.041, 2018.
Ciantia, M .O., Castellanza, R., and Di Prisco, C.: Experimental study on the water-induced weakening of calcarenites, Rock Mech. Rock Eng., 48, 441–461, 2015.
Coviello, A., Lagioia, R., and Nova, R.: On the measurement of the tensile strength of soft rocks, Rock Mech. Rock Eng., 38, 251–273, 2005.
De Giovanni, A., Martimucci, V., Marzulli, M., Parise, M., Pentimone, N., and Sportelli, D.: Operazioni di rilievo e analisi preliminare dello sprofondamento in località San Procopio (Barletta) del 2–3 maggio 2010, Opera Ipogea, J. Speleol. Artif. Cav., 1–2, 151–158, 2011.
Delle Rose, M.: La voragine di Gallipoli e le attività di protezione civile dell'IRPI-CNR, no. 4-2006/1-2007, Geologi e Territorio, Bari, 3–12, 2007.
Evangelista, A., Pellegrino, A., and Viggiani, C.: Cavità e gallerie nel Tufo Giallo Napoletano, in: Atti IX Ciclo Conf. MIR, Le opera in sotterraneo e il rapporto con l'ambiente, Patron Editore, Falla Castelfranchi M. (1991) Pittura monumentale bizantina in Puglia, Milan, Italy, 2003.
Fazio, N. L., Perrotti, M., Lollino, P., Parise, M., Vattano, M., Madonia, G., and Di Maggio, C.: A three-dimensional back-analysis of the collapse of an underground cavity in soft rocks, Eng. Geol., 228, 301–311, 2017.
Federico, F. and Screpanti, S.: Effects of filling shallow room and pillar mines in weak pyroclastic rock, in: Proc., XIII European Conference on Soil Mechanics and Geotechnical Engineering, Geotechnical Problems with Man-made and Man Influenced, Grounds, Prague, Czech Republic, 2003.
Ferrero, A. M., Segalini, A., and Giani, G. P.: Stability analysis of historic underground quarries, Comput. Geotech., 37, 476–486, 2010.
Fiore, A. and Parise, M.: Cronologia degli eventi di sprofondamento in Puglia, con particolare riferimento alle interazioni con l'ambiente antropizzato, Memorie Descrittive della Carta Geologica d'Italia, 93, 239–252, 2013.
Fiore, A., Fazio, N. L., Lollino, P., Luisi, M., Miccoli, M. N., Pagliarulo, R., Perrotti, M., Pisano, L., Spalluto, L., Vennari, C., Vessia G., and Parise, M.: Evaluating the susceptibility to anthropogenic sinkholes in Apulian calcarenites, southern Italy, Special Publications 466, Geological Society, London, 381–396, https://doi.org/10.1144/SP466.20, 2018.
Fraldi, M. and Guarracino, F.: Limit analysis of collapse mechanisms in cavities and tunnels according to the Hoek–Brown failure criterion, Int. J. Rock Mech. Min. Sci., 46, 665–673, 2009.
Gesualdo, A., Minutolo, V., and Nunziante, L.: Failure in Mohr–Coulomb soil cavities, Can. Geotech. J., 38, 1314–1320, 2001.
Goodings, D. J. and Abdulla, W. A.: Stability charts for predicting sinkholes in weakly cemented sand over karst limestone, Eng. Geol., 65, 179–184, 2002.
Gutierrez, F., Parise, M., De Waele, L., and Jourde, H.: A review on natural and human-induced geohazards and impacts in karst, Earth Sci.-Rev., 138, 61–88, 2014.
Hoek, E.: Strength of rock and rock masses, News J. ISRM, 2, 4–16, 1994.
Hoek, E.: Practical rock engineering, available at: https://www.rocscience.com/documents/hoek/corner/Practical-Rock-Engineering-Full-Text.pdf (last access: 3 September 2019), 2007.
Hoek, E. and Brown, E. T.: Practical estimates of rock mass strength, Int. J. Rock Mech. Min. Sci., 34, 1165–1186, 1997.
Hoek, E. and Martin, C. D.: Fracture initiation and propagation in intact rock – A review, J. Rock Mech. Geotech. Eng., 6, 287–300, 2014.
Lollino, P. and Parise, M.: Analisi numerica di processi di instabilità di cavità sotterranee e degli effetti indotti in superficie, in: Proc. 2nd Int. Workshop “I sinkholes. Gli sprofondamenti catastrofici nell'ambiente naturale ed in quello antropizzato”, 3-4 December 2009, Rome, 803–816, 2010.
Luisi, M., Di Santo, A., Fiore, A., Lepore, D., Lollino, P., Miccoli, M. N., Parise, M., and Spalluto, L.: Modellazione numerica 3D agli elementi finiti (FEM) per la valutazione delle condizioni di stabilità di cavità antropiche del territorio pugliese: il caso studio della cava ipogea di San Procopio (Barletta, Murge settentrionali), Mem. Descr. Carta Geol. d'It., XCIX, 327–336, 2015.
Maglio, A. and Ligori, F.: Intervento di bonifica e messa in sicurezza di cavità antropiche presenti nell'area urbana e suburbana, Studio di prefattibilità ambientale Maggio 2014, Comune di Cutrofiano, Ministero dell'Ambiente della Tutela del Territorio e del Mare, Cutrofiano, 2014.
Parise, M.: The Impacts of Quarrying in the Apulian Karst (Italy), in: Advances in Research in Karst Media, Environmental Earth Sciences, edited by: Andreo, B., Carrasco, F., Durán, J., and LaMoreaux, J., Springer, Berlin, Heidelberg, 441–447, 2010.
Parise, M.: A present risk from past activities: sinkhole occurrence above underground quarries, Carbon. Evaporit., 27, 109–118, 2012.
Parise, M. and Lollino, P.: A preliminary analysis of failure mechanisms in karst and man-made underground caves in Southern Italy, Geomorphology, 134, 132–143, 2011.
Parise, M., De Giovanni, A., and Martimucci, V.: Sinkholes caused by underground quarries: the case of the 2–3 May 2010, event at Barletta (Southern Italy), in: Speleology and Spelestology, Proceedings IV International Scientific Conference, November 2013, Nabereznye Chelny, Russia, 158–162, 2013.
Perrotti, M., Lollino, P., Fazio, N. L., Pisano, L., Vessia, G., Parise, M., Fiore, A., and Luisi, M.: Finite element-based stability charts for underground cavities in soft calcarenites, Int. J. Geomech., https://doi.org/10.1061/(ASCE)GM.1943-5622.0001175, 2018.
Suchowerska, A. M., Merifield, R. S., Carter, J. P., and Clausen, J.: Prediction of underground cavity roof collapse using the Hoek–Brown failure criterion, Comput. Geotech., 44, 93–103, 2012.
Vattano, M., Di Maggio, C., Madonia, G., Parise, M., Lollino, P., and Bonamini, M.: Examples of anthropogenic sinkholes in Sicily and comparison with similar phenomena in southern Italy, in: NCKRI Symposium, vol. 2, Proc. 13th Multidisc. Conf., 6–10 May 2013, Carlsbad, New Mexico, 263–271, 2013.