the Creative Commons Attribution 4.0 License.
the Creative Commons Attribution 4.0 License.
 | 01 Oct 2019
Understanding the spatiotemporal development of human settlement in hurricane-prone areas on the US Atlantic and Gulf coasts using nighttime remote sensing
Cuizhen Wang
Junyu Lu
Hurricanes, as one of the most devastating natural hazards, have posed a great threat to people in coastal areas. A better understanding of the spatiotemporal dynamics of human settlement in hurricane-prone areas largely benefits sustainable development. This study uses the nighttime light (NTL) data from the Defense Meteorological Satellite Program's Operational Linescan System (DMSP/OLS) to examine human settlement development in areas with different levels of hurricane proneness from 1992 to 2013. The DMSP/OLS NTL data from six satellites were intercalibrated and desaturated with the Advanced Very High Resolution Radiometer (AVHRR) and Moderate Resolution Imaging Spectroradiometer (MODIS) optical imagery to derive the Vegetation Adjusted NTL Urban Index (VANUI), a popular index that quantifies human settlement intensity. The derived VANUI time series was examined with the Mann–Kendall test and Theil–Sen test to identify significant spatiotemporal trends. To link the VANUI product to hurricane impacts, four hurricane-prone zones were extracted to represent different levels of hurricane proneness. Aside from geographic division, a wind-speed-weighted track density function was developed and applied to historical storm tracks which originated in the North Atlantic Basin to better categorize the four levels of hurricane proneness. Spatiotemporal patterns of human settlement in the four zones were finally analyzed. The results clearly exhibit a north–south and inland–coastal discrepancy of human settlement dynamics. This study also reveals that both the zonal extent and zonal increase rate of human settlement positively correlate with hurricane proneness levels. The intensified human settlement in high hurricane-exposure zones deserves further attention for coastal resilience.


A hurricane, a specific type of tropical cyclone with a wind speed of 74 mi h−1 (119 km h−1) or higher, is one of the most devastating natural hazards in the world and is recurring more frequently than ever in coastal areas (Vecchi and Knutson, 2018). Based on the Saffir–Simpson hurricane scale, a hurricane is categorized in five levels by its wind speed: 74–95 mi h−1 (119–153 km h−1) as a Category 1, 96–110 mi h−1 (154–177 km h−1) as a Category 2, 111–129 mi h−1 (178–208 km h−1) as a Category 3, 130–156 mi h−1 (209–251 km h−1) as a Category 4, and above 157 mi h−1 (252 km h−1) as a Category 5. Hurricanes threatening the conterminous US mostly originate in the North Atlantic Basin that includes the North Atlantic Ocean, the Caribbean Sea and the Gulf of Mexico, and the Eastern Pacific Basin that covers the northeastern Pacific (east of 140∘ W and north of the Equator) (Goldenberg et al., 2001). Historically, more hurricanes from the North Atlantic Basin have landed on the US territories, dramatically affecting people living in the Gulf and Atlantic coasts. While storms that originate in the Eastern Pacific Basin occasionally visited the southwestern conterminous US, by the time they landed they usually degraded to tropical cyclones due to the long travel distance and cold water in coastal California (Chenoweth and Landsea, 2004).
Atlantic hurricane season usually runs from 1 June to 30 November, during which the North Atlantic Basin exhibits significantly intensified tropical cyclone activity and gives rise to many devastating hurricanes landing on the coasts. In 2016, Hurricane Matthew, a Category 5 (the highest category) hurricane, directly claimed a total of 34 lives in the US. In 2017, Hurricane Harvey on the Gulf Coast caused a total of USD 125 billion of damage, making it the second costliest hurricane in the US. In the same year, Hurricane Irma on the Atlantic Coast caused a total of USD 50 billion of damage, making it the fifth costliest hurricane in the US (NOAA Earth Observation Group, 2018a). In 2018, the third year in a consecutive series (2016–2018) of above-average damaging Atlantic hurricanes, there were 15 named tropical storms, 8 of which became hurricanes, including 2 major hurricanes. Hurricane Florence, for example, a major hurricane in 2018, caused severe economic damage to North Carolina (USD 22 billion), South Carolina (USD 5.5 billion), and Virginia (USD 1 billion) (Krupa, 2018). The widespread storm surge and extensive floods from extreme rainfall largely crippled public infrastructures and impacted all segments of society. A noticeable increase in the number of hurricanes from the North Atlantic Basin since the late 1980s has been observed (Vecchi and Knutson, 2018). Even though it is partly due to improved monitoring (Villarini et al., 2011), the increased intensity and duration of these hazards have posed great threats to people residing in the US Atlantic and Gulf coasts (Landsea et al., 2010).
Despite these threats, the US southeastern region has experienced significant population growth in recent decades. The population in Florida, North Carolina, and South Carolina, for instance, has increased by 61.2 %, 43.6 %, and 54.3 %, respectively, since 1990 (US Census Bureau, 2018). The densely populated coastal areas are receiving higher threats than ever (Crossett et al., 2004). In these hurricane-prone areas, a better understanding of the temporal and spatial dynamics of human settlement is needed for better damage assessment and sustainable urban planning.
Satellite-based observations have been widely applied in investigating urban dynamics as remote sensing provides spatially explicit information of the urbanization process. Extensive application has been made utilizing multispectral sensors that record the reflectance of ground features to categorize different land covers, thus allowing the delineation of urban extent (Xu, 2008; Zha et al., 2003). This type of remotely sensed imagery, however, relies on the reflective characteristics of all land objects on the ground, thus lacking the perspective on human activities. In comparison, satellite-derived nighttime light (NTL) data provide a unique and direct observation of human settlement via night lights (Ceola et al., 2014, 2015). Natural land covers are distinctively dark in NTL imagery. Nighttime remote sensing has been increasingly used for analyzing socioeconomic dynamics and urbanization processes at national and regional levels (Elvidge et al., 1997; Ghosh et al., 2010), thanks to their light-only sensitivity, large spatial coverage (Imhoff et al., 1997), easiness to acquire (Lu et al., 2008), and consistency over a long term (Elvidge et al., 1999).
Among all the satellite-derived NTL products, the NTL data obtained by the Operational Linescan System (OLS) via the US Air Force Defense Meteorological Satellite Program (DMSP), hereafter referred to as the DMSP/OLS NTL, are the most commonly used due to their long time span (more details in next section). Extensive attempts have been made to harvest the NTL observations from the DMSP/OLS in applications including urban expansion and decay (Lu et al., 2018), settlement dynamics (Elvidge et al., 1999; Yu et al., 2014), socioeconomic development (Doll et al., 2000), and energy consumption (Chand et al., 2009). Recent studies enhanced the NTL products by fusing DMSP/OLS NTL data with natural land cover characteristics such as the normalized difference vegetation index (NDVI) to reduce the light saturation problem. This fusion greatly increased the potential of the DMSP/OLS in discriminating against the human settlement structures (Lin et al., 2014; Liu et al., 2015). The improved DMSP/OLS NTL product serves as a valuable resource for monitoring large-coverage and long-term urbanization dynamics.
The goal of this paper is to illustrate the usage of DMSP/OLS NTL data to monitor the urbanization process and hurricane impacts on the US Atlantic and Gulf coasts using nighttime artificial lights as a proxy. Hurricane-prone areas were first derived by calculating the track density from historical storm tracks in the North Atlantic Basin. An intercalibrated DMSP/OLS NTL time series was built in a yearly interval. Assisted with the NDVI data, the Vegetation Adjusted NTL Urban Index (VANUI) was used to characterize human settlement intensity in the study area. After that, a trend analysis was conducted to identify areas with a significant increase in human settlement intensity in different zones, in which the potential hurricane impacts were statistically evaluated. The spatiotemporal changes of human settlement revealed from nighttime remote sensing in hurricane-prone zones provide valuable information to evaluate the damage and to support the decision-making of urban development.
Due to the absence of onboard calibration and intercalibration, the annual DMSP/OLS NTL composites derived from multiple satellites over a span of 22 years were not directly comparable (Li and Zhou, 2017; Liu et al., 2012). This lack of continuity and comparability has posed great challenges for trend analysis based on DMSP/OLS NTL data (Tan, 2016). Elvidge et al. (2009) designed a three-step framework to intercalibrate the DMSP/OLS NTL composites. Those three steps are (1) selecting a reference region; (2) selecting a reference satellite year; and (3) performing a 2nd-order polynomial regression against the NTL reference data. This simple framework has been proven efficient in reducing discrepancies in digital number (DN) values of the DMSP/OLS NTL time series (Pandey et al., 2013) and has been adopted in many studies (Liu and Leung, 2015; Huang et al., 2016).
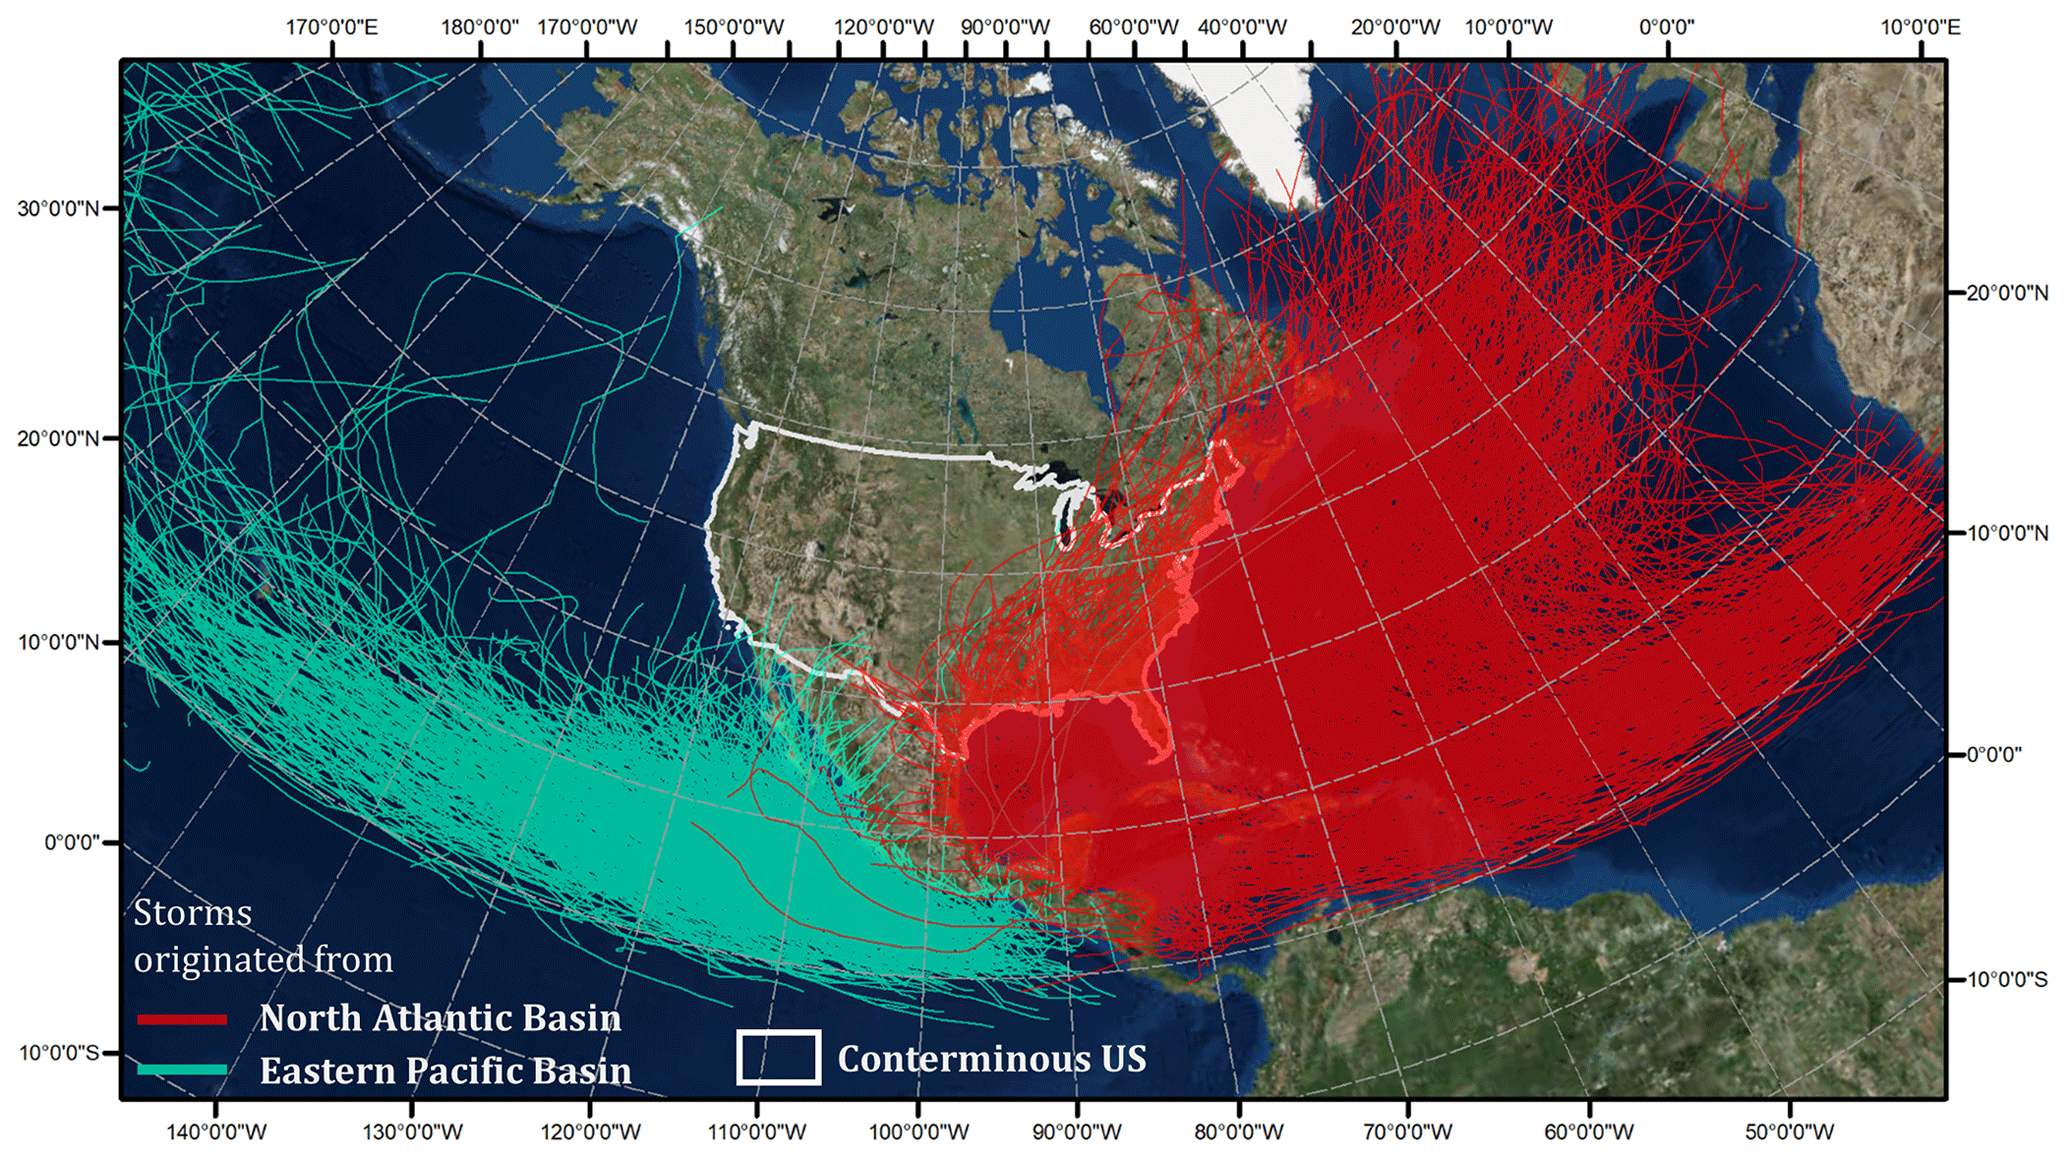
Figure 1Historical storm tracks from the North Atlantic Basin (in red) and from the Eastern Pacific Basin (in green). Basemap sources: Esri, DigitalGlobe, GeoEye, i-cubed, the US Department of Agriculture Farm Service Agency (USDA FSA), the USGS, Aerials Express (AEX), Getmapping, Aerogrid, Instituto Geográfico Nacional (IGN), Instituto Geográfico Português (IGP), swisstopo, and the GIS User Community.
Another notable limitation of DMSP/OLS NTL is the saturation of luminosity in the 6 bit (DN in a range of 0–63) imagery (Letu et al., 2010). To retrieve the heterogeneity in areas with high intensity of human settlement, numerous attempts have been made to mitigate the saturation effect. A commonly used vegetation index, NDVI, is a useful indicator to reduce the saturation effect in DMSP/OLS data. Its practicality has been confirmed by many studies (Zhou et al., 2014; Liu et al., 2015). Lu et al. (2008) proposed a human settlement index (HSI) by merging normalized DMSP/OLS NTL data with the maximum NDVI in growing-season-derived data from the Moderate Resolution Imaging Spectroradiometer (MODIS). The HSI has been proven rather efficient for settlement mapping in several testing sites in southeastern China. Zhang et al. (2013) developed VANUI, which captures the inverse correlation between vegetation and luminosity. This simple index efficiently reveals the heterogeneity in regions with saturated DN values, which has been recognized by Shao and Liu (2014). Following the original design of NDVI that characterizes the inverse relationship between the near-infrared band and red band in vegetation, Zhang et al. (2015) designed a normalized difference urban index (NDUI) that characterizes the inverse relationship between vegetation and luminosity in a similar way. The NDUI was evaluated in five testing sites in the US and proved to be effective in desaturating DN values in DMSP/OLS.
In this study, the intercalibration of DMSP/OLS data follows the method proposed by Elvidge et al. (2009), and the desaturation of DMSP/OLS data is achieved by using VANUI (Zhang et al., 2013).
3.1 Historical storm tracks
The historical storm tracks were retrieved from the International Best Track Archive for Climate Stewardship (IBTrACS), hosted by NOAA (https://www.ncdc.noaa.gov/ibtracs/, last access: 11 November 2018). The IBTrACS provides a globally best-track dataset by merging storm information from multiple centers into one product. As the majority of the storms on the conterminous US are formed in the North Atlantic Basin (Fig. 1), we only examined the storms from the North Atlantic Basin along the US Atlantic and Gulf coasts. A total of 655 storm tracks containing 18 929 line segments (with an attribute of wind speed) were used in this study.
3.2 DMSP/OLS NTL series and NDVI series
The DMSP/OLS satellites are operated by the US Air Force (USAF) and are composed of six satellites (F10, F12, F14, F15, F16, and F18) using data from the period of 1992 to 2013. With a 3000 km orbit swath, they acquired the OLS imagery from −65 to 65∘ in latitude at a nominal resolution of 30 arcsec (around 1 km at the Equator) (NOAA Earth Observation Group, 2018b). The temporal coverages of the six satellites are summarized in Table 1.
Table 1DMSP/OLS satellites and overlays in corresponding years.

Note that bold terms indicate the years with two satellites available in a given year.
The DMSP/OLS NTL products used in this study are the version 4 “stable lights” series in a 22-year span (1992–2013). The DMSP/OLS NTL data were obtained from the website of the National Centers for Environmental Information (https://ngdc.noaa.gov/eog/dmsp/downloadV4composites.html, last access: 12 November 2018). The version 4 DMSP/OLS stable lights product has already excluded sunlight, glare, moonlight, cloud coverage, and lighting. Ephemeral events such as wildfires also have been discarded. In this study, one composite each year in the conterminous US was produced from each satellite. When two satellites were available in certain years, a combined composite in this year was derived using the method described in Sect. 4.2. All DMSP/OLS NTL images were resampled to a 1 km pixel size.
In the same period of 1992–2013, the NDVI products in the conterminous US from two satellite sensors were used in this study: the Advanced Very High Resolution Radiometer (AVHRR) and Moderate Resolution Imaging Spectroradiometer (MODIS). NDVI series from AVHRR and MODIS span from 1992 to 2005 and 2003 to 2013, respectively. These two products were further calibrated in three overlaying years: 2003, 2004, and 2005 (described in Sect. 5.1) to increase data comparability. The AVHRR NDVI series is the annual maximum value composite (MVC) with a 1 km pixel size, provided by the United States Geological Survey Earth Resources Observation and Science (USGS/EROS) (https://phenology.cr.usgs.gov/get_data_1km.php, last access: 11 November 2018). A number of preprocessing steps have been performed in this product to remove noise, which includes the removal of spurious spikes, temporal smoothing, and interpolation. The MODIS NDVI series was derived from the Oak Ridge National Laboratory Distributed Active Archive Center (ORNL DAAC) (https://daac.ornl.gov/, last access: 11 November 2018). The data were generated from the Terra MOD13Q1 and Aqua MYD13Q1 products and have been smoothed and gap filled with a spatial resolution of 250 m (Spruce et al., 2016). To be comparable with the AVHRR NDVI, the annual MVC product was derived from the MODIS NDVI series by selecting the maximum NDVI value in each year. It was also resampled to a 1 km pixel size. Water bodies contained in both datasets were masked out using the MODIS MOD44W product.
4.1 Delineation of hurricane-prone zones
The delineation of hurricane-prone zones is based on the retrieved 655 storms from the North Atlantic Basin which landed on the conterminous US. An area with a higher number of historical storms is expected to be more hurricane-prone. We assume a generally positive relationship between the wind intensity of a storm and its impact. At a given location (i, j), a circular neighborhood (R) centered at this location was assigned. For all line segments of storm tracks falling in this neighborhood, the storm track density was calculated as the line density of all segments weighted by their wind speeds.
where ρi,j denotes the weighted line density at the location (i, j). and denote the length of a line segment r and corresponding wind speed, respectively. The radius of R is set as 100 km in this study.
The storm track density was then normalized to a range of [0, 1], with a higher value indicating higher hurricane proneness. To simplify the process for zonal analysis, we categorized the normalized storm track density into four zones from low to high hurricane proneness: Zone 4 (0–0.2), Zone 3 (0.2–0.5), Zone 2 (0.5–0.7), and Zone 1 (0.7–1.0).
4.2 Intercalibration (the DMSP/OLS NTL series and NDVI series) and VANUI calculation
We adopted the Elvidge et al. (2009) procedure to intercalibrate the DMSP/OLS NTL time series. Serving as the reference site (Fig. 3a), the geographic area of metropolitan Los Angeles and city of San Diego, California, maintains high conformity of NTL values throughout the 22-year period (Kyba et al., 2017; Hsu et al., 2015), which satisfies the “pseudo invariant” rule for calibration site selection (Elvidge et al., 2009). The year 2007 (satellite F16) has been commonly selected as the reference year in many studies (Yi et al., 2014; Ma et al., 2014). Therefore, we extracted the DMSP/OLS NTL data in this year at the same site as our reference. With all lit pixels (DN > 0) in the reference site, a 2nd-order regression model was performed to calibrate the NTL data in each year.
where DNn,cal is the calibrated DN value in year n, DNn is the original DN value in year n, and a, b, and c are the coefficients. The non-lit pixels (DN = 0) are not calibrated.
As shown in Table 1, two DMSP/OLS NTL data layers are available in overlapping years. For lit pixels (DN > 0 in both years), the calibrated DN values in this year are calculated as the average of two calibrated datasets. The value of a pixel remains 0 if its original DN value in any year is 0. Finally, the calibrated DMSP/OLS NTL images were normalized (DNnor) to [0, 1].
Similarly, the annual maximal NDVI (NDVIMVC) products from the AVHRR (NDVI from 1992 to 2005) and MODIS (NDVI from 2003 to 2013) were intercalibrated to maintain the continuity and comparability in the NDVIMVC annual series. Stratified sampling was applied to pixels with an NDVI value above 0.1 to ensure that land covers in different NDVI ranges were equally sampled. Thirty thousand samples were collected within four hurricane-prone zones in the years 2003–2005, respectively. It has been reported that MODIS maintains higher spectral sensitivity than the AVHRR (Tucker et al., 2005). Here, a linear regression was applied to correct AVHRR NDVIMVC to MODIS NDVIMVC.
where α and β are regression coefficients.
The calibrated NDVI series from 1992 to 2002 was merged with the NDVI from 2003 to 2013 to form a 22-year NDVI MVC series (NDVI). Negative NDVI values are usually associated with non-living environments such as water bodies, and NDVI values above 1 are not meaningful. Therefore, we limited all NDVI values in the NDVI series to a range of 0 to 1.
Finally, with the normalized DMSP/OLS NTL and the calibrated NDVI data series, the VANUI series was extracted (Zhang et al., 2013).
where DNnor denotes the normalized DMSP/OLS NTL value and NDVI denotes the calibrated NDVIMVC value. VANUI has a range of [0, 1]. In general, a higher proportion of human settlements in a pixel leads to higher NTL and a lower NDVI, both contributing to a higher value of VANUI. Therefore, VANUI serves as a proxy for the intensity of human settlement.
4.3 Trend analysis of human settlement
The VANUI series over a 22-year span sheds light on the spatiotemporal development of human settlement. We performed the trend analysis by applying the Mann–Kendall test (Mann, 1945) coupled with the Theil–Sen slope estimator (Sen, 1968). The Mann–Kendall test statistically assesses if there is a significant monotonic upward or downward trend in a time series. Given the 22-year VANUI series, the Mann–Kendall test first computes S statistics (Mann, 1945).
where n denotes the total number of observations in a series (22 in this study) and xj and xk are the data values at different points, i.e., the VANUI in different years in this study. sgn(xj−xk) denotes an indicator that takes on the values 1, 0, or −1, respectively, according to the signs of (xj−xk). The variance of S (VarS) is further computed as
where g denotes the number of tied groups and tp denotes the number of observations in the pth group. Finally, a Z value is calculated as
The Z value in Eq. (7) represents the monotonic tendency of a time series. A positive Z indicates an increasing trend, while a negative Z indicates a decreasing one. A stable trend exists when the value of Z equals 0. The absolute value of Z indicates the intensity of the trend. The significance of Z was examined through a two-tailed test with a significance level of α=0.05. If a significant trend exists, the Theil–Sen slope estimator was further applied to estimate its slope. As a non-parametric indicator, it has low sensitivity to outliers and high robustness in short-term series, and it has been widely applied in remote sensing fields (de Jong et al., 2011; Fernandes and Leblanc, 2005). Given a VANUI time series, the slope at any point i (Qi) can be calculated as
The Theil–Sen slope (Qmed) is the median of all Qi values in the time series. It indicates the steepness (change rate) of a certain trend. Therefore, pixels with high Qmed values represent a rapid increase in human settlement intensity during the investigated time period.
With the 22-year VANUI image series, clusters of geographic areas in the study region with a significant increase of human settlement were extracted. The summed slope per unit in a cluster represented the rapidness of human settlement growth in the 22 years. The spatiotemporal patterns of this growth in different hurricane-prone zones were further analyzed.
5.1 Hurricane-prone zones
The 655 storms from the North Atlantic Basin that landed on the conterminous US (mostly along the Atlantic and Gulf coasts) are presented in Fig. 2a. The derived wind-speed-weighted track density in the study area is presented in Fig. 2b. Based on the density levels, we divided the track density map into four hurricane-prone zones that represent different levels of hurricane proneness with the highest rate of impacts in Zone 1 and the lowest in Zone 4. The study area contains all the US states covered in the hurricane-prone zones (Fig. 2c): Maine; Massachusetts; New Jersey; New York; North Carolina; New Hampshire; Pennsylvania; Rhode Island; Tennessee; Texas; Maryland; Alabama; Arkansas; Connecticut; Delaware; Washington, DC; Florida; Georgia; Kentucky; Louisiana; Mississippi; South Carolina; Vermont; Virginia; and West Virginia. Some of these states, such as Florida, Texas, and North Carolina, have been well recognized as fast-growing regarding both their population and economy in recent years (Milesi et al., 2003; Klotzbach et al., 2018), leading to higher threats and recovery costs from hurricanes.
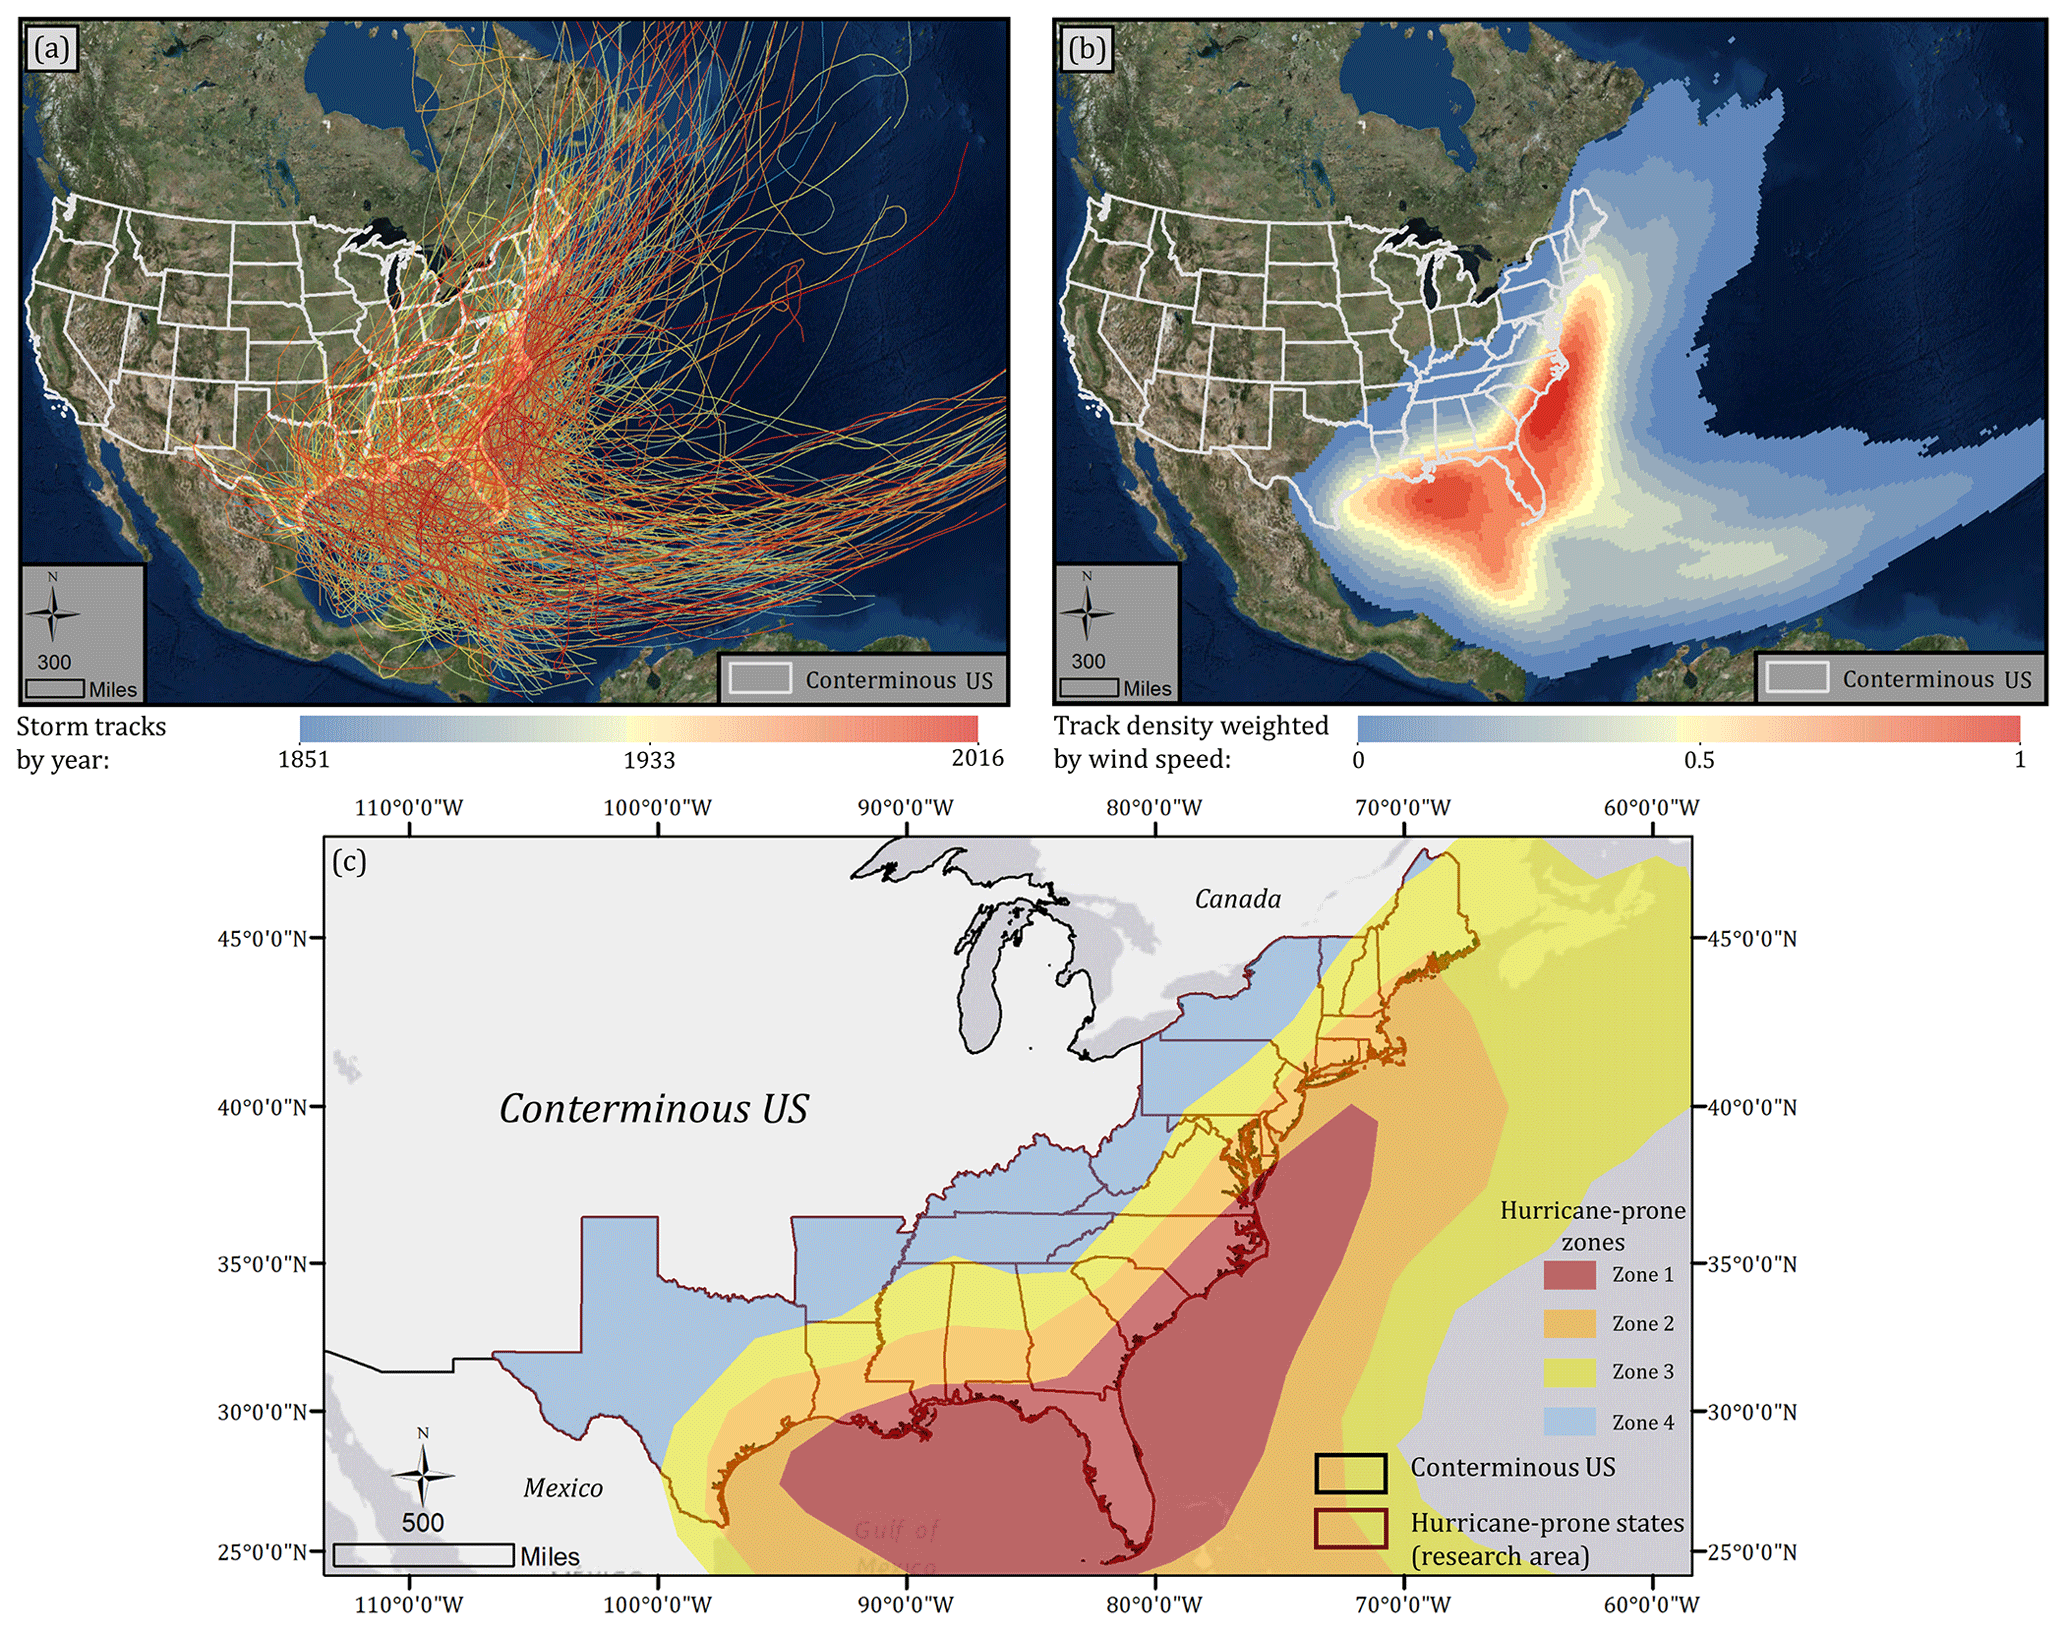
Figure 2(a) Historical storm tracks from the North Atlantic Basin; (b) normalized storm tracks density weighted by wind speed; (c) hurricane-prone zones: Zone 4 (with track density 0–0.2), Zone 3 (0.2–0.5), Zone 2 (0.5–0.7), and Zone 1 (0.7–1.0). Basemap sources: Esri, HERE, Garmin, OpenStreetMap contributors, DigitalGlobe, GeoEye, i-cubed, USDA FSA, USGS, AEX, Getmapping, Aerogrid, IGN, IGP, swisstopo, and the GIS User Community. © OpenStreetMap contributors 2019. Distributed under a Creative Commons BY-SA License.
5.2 Intercalibration results of the DMSP/OLS NTL series and NDVI series
The reference site for intercalibration is composed of an urban strip from Los Angeles to San Diego, California, in the southwest end of the United States (Fig. 3a). Agreeing with Elvidge et al. (2009), the histograms of all NTL images in this area exhibit a sharp, bimodal distribution (urban vs. non-urban) with limited temporal variation. This confirms that it is a valid reference site for the intercalibration of NTL images. Among the three example scatterplots between the NTL data for 3 years and the F162007 reference, the F162006 data show the highest agreement with the reference as they were acquired by the same satellite (Fig. 3b1). The F101992 data (Fig. 3b2) exhibit less agreement due to their different satellite origin and a long time interval from 2007. However, an R2 of 0.949 still warrants a decent agreement for calibration. Figure 3b3 demonstrates the necessity of a 2nd-order regression instead of a linear one. The regression equations and intercalibration coefficients for all years are listed in Table 2.

Figure 3(a) DMSP/OLS NTL intercalibration in the Los Angeles metropolitan area and the city of San Diego; (b1) correlation between F162006 and reference year F162007; (b2) correlation between F101992 and reference year F162007; (b3) correlation between F152003 and reference year F162007. Basemap sources: Esri, HERE, Garmin, OpenStreetMap contributors, and the GIS user community. © OpenStreetMap contributors 2019. Distributed under a Creative Commons BY-SA License.
Table 2DMSP/OLS NTL intercalibration coefficients.
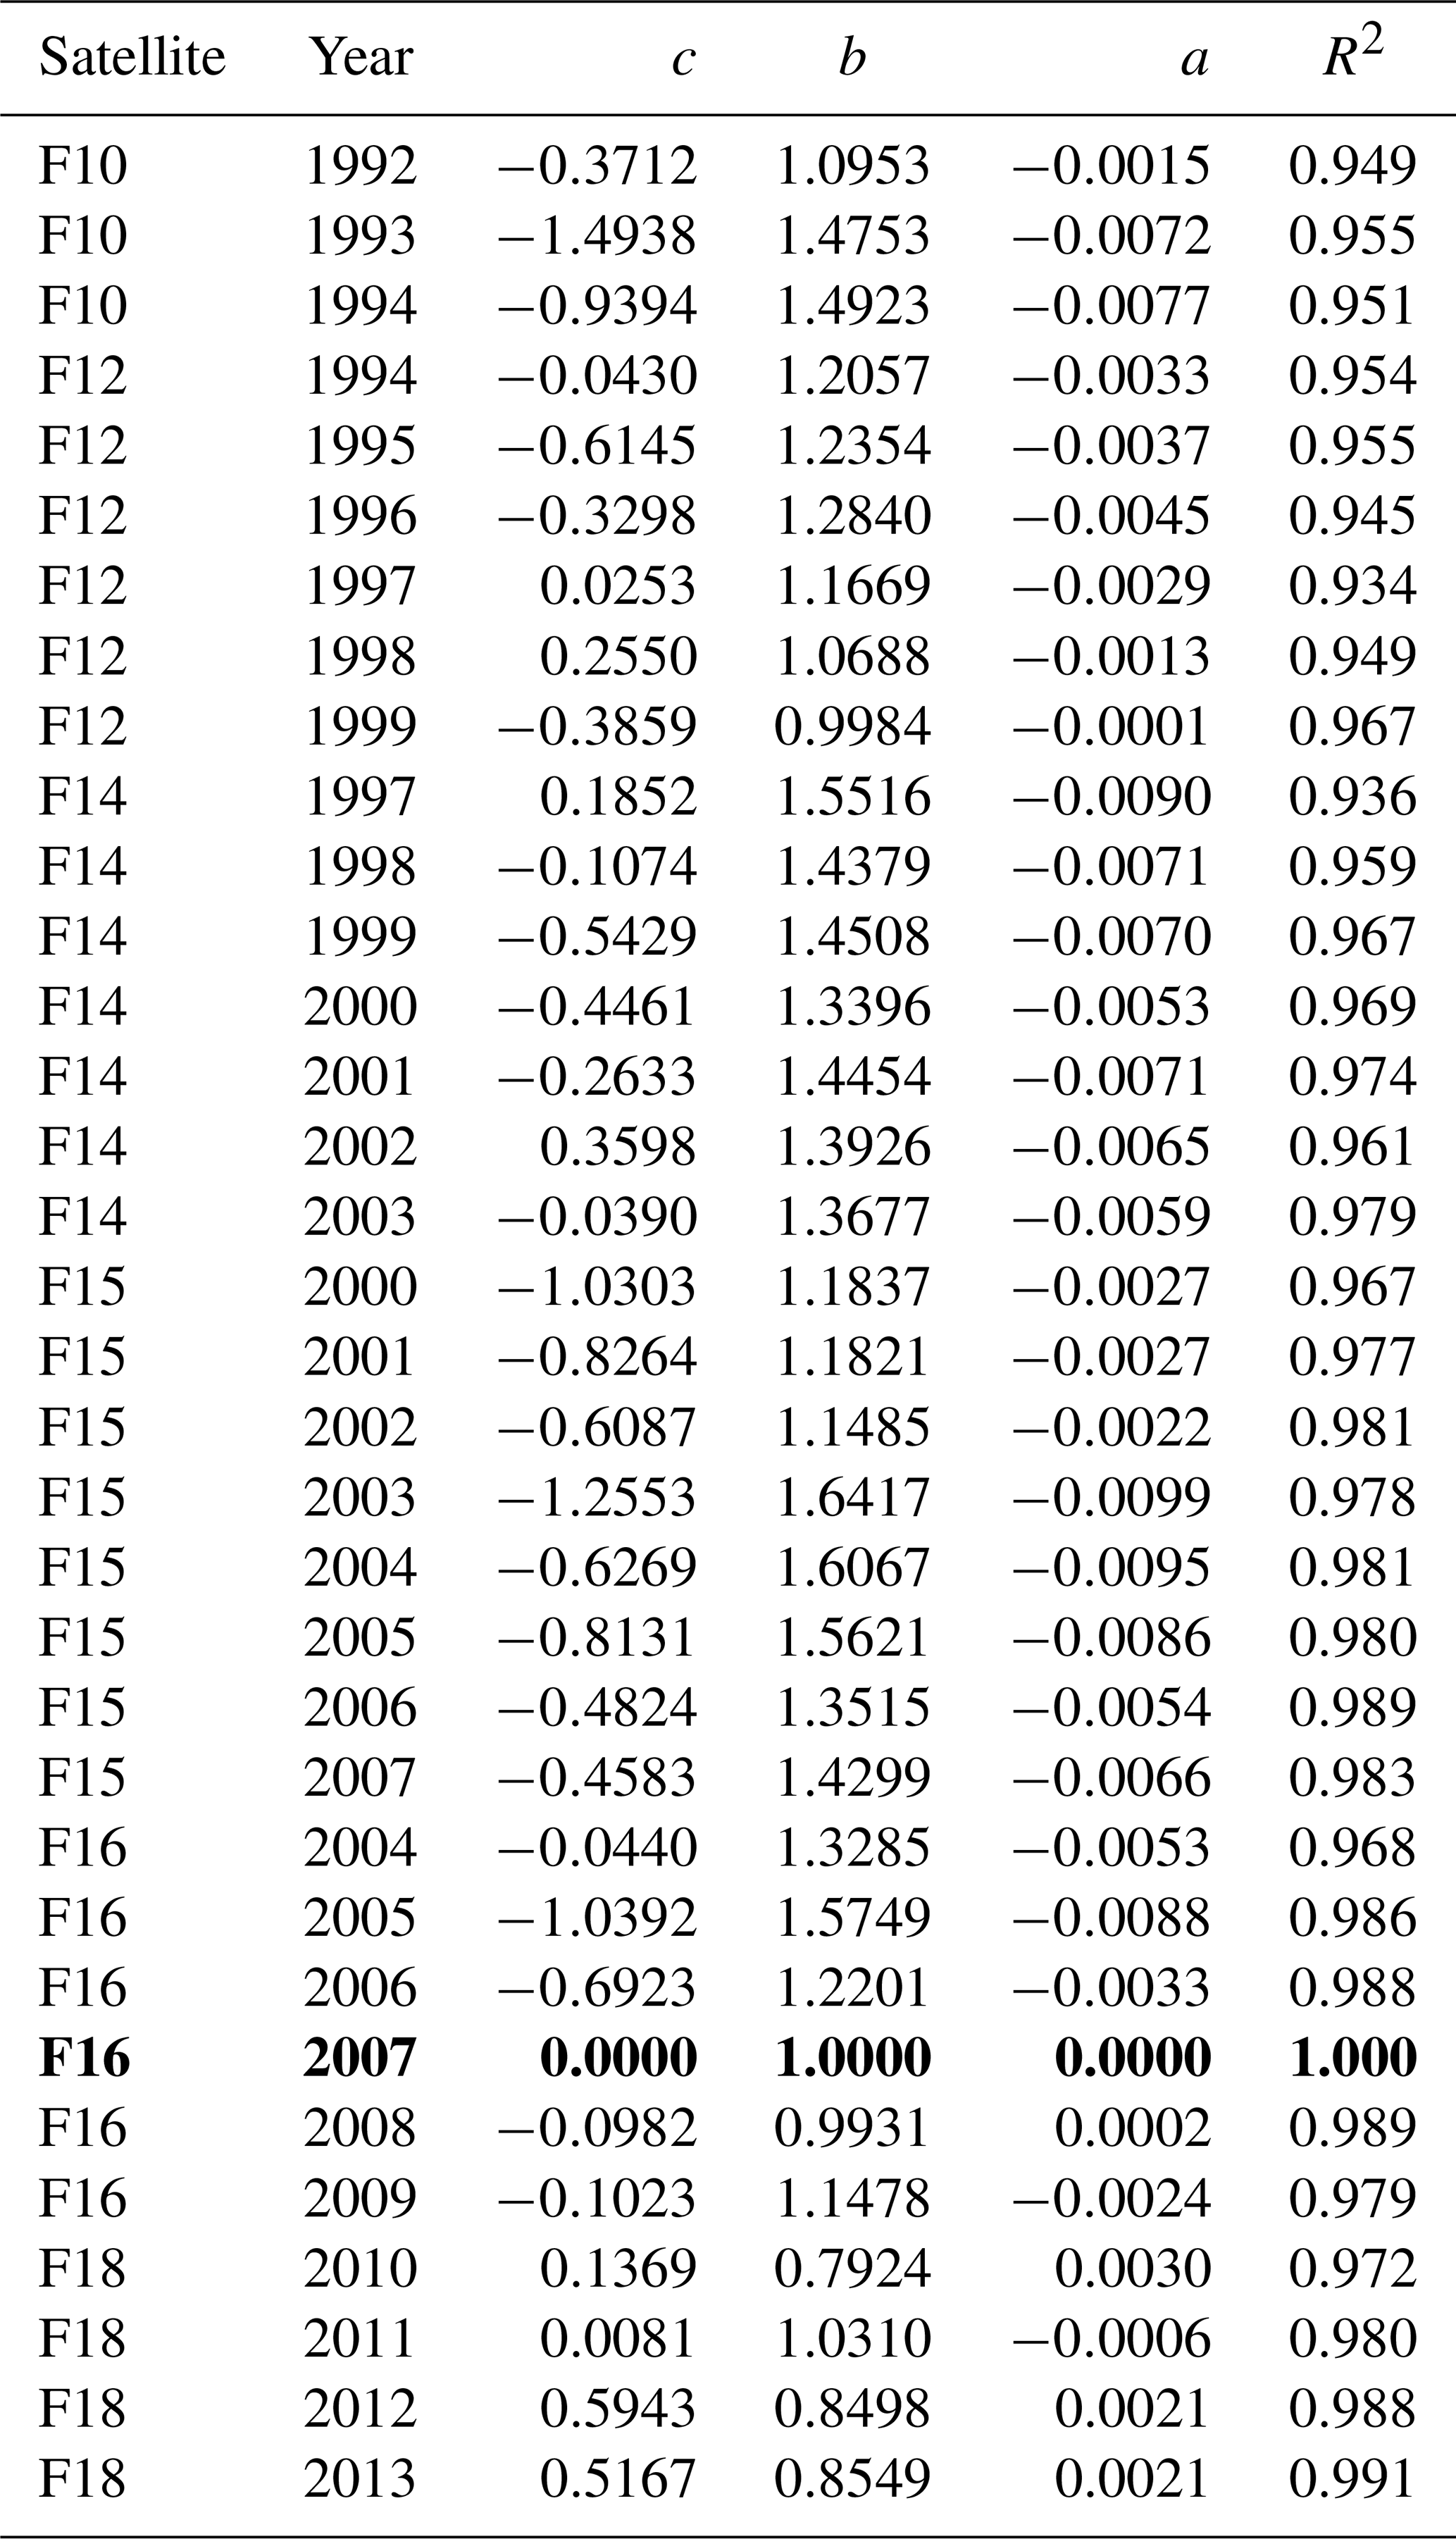
Note that bold indicates the reference satellite in 2007.
The intercalibration of NDVIMVC in the 3 overlaying years is shown in Fig. 4a (AVHRR) and Fig. 4b (MODIS). Via visual interpretation, the MODIS product has a higher peak NDVI than the AVHRR. The regression shows a linear relationship between the two NDVIMVC products (R2=0.934) with α=1.1835 and (Fig. 4c). The histograms (Fig. 4d) demonstrate that the calibration process has shifted the AVHRR histogram to the right, making it more comparable with MODIS.
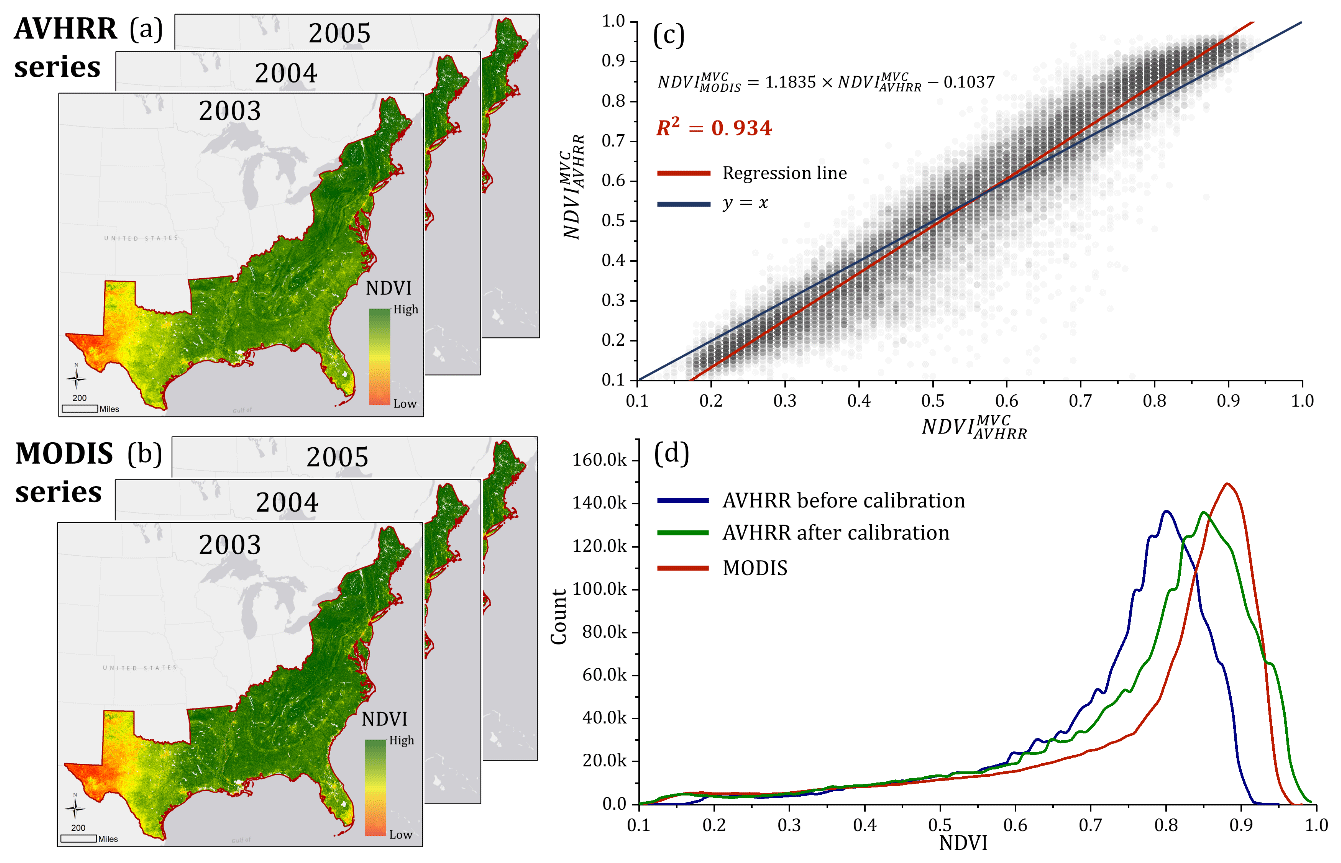
Figure 4(a) NDVIMVC series from AVHRR in the overlaying years; (b) NDVIMVC series from MODIS in the overlaying years; (c) linear regression between AVHRR and MODIS using stratified sampling; (d) comparison of histograms between MODIS and AVHRR (before and after calibration). Basemap sources: Esri, HERE, Garmin, OpenStreetMap contributors, and the GIS user community. © OpenStreetMap contributors 2019. Distributed under a Creative Commons BY-SA License.
5.3 The VANUI time series
An example VANUI map (1992) for the entire study area is shown in Fig. 5a, in which red represents a high VANUI value (high human settlement intensity), while blue represents the opposite. Several subsets of the VANUI maps in years 1992, 2002, and 2013 are displayed to demonstrate more details in densely populated urban clusters: Philadelphia (Fig. 5b), Charlotte (Fig. 5c), Atlanta (Fig. 5d), Houston (Fig. 5e), and Orlando (Fig. 5f). Interestingly, the city of Philadelphia (Fig. 5b) experienced slightly decreased human settlement intensity, especially in the 1992–2002 period. This observation agrees with the population dynamics of Philadelphia in the past decades: 1990–2000 (−4.3 %), 2000–2010 (+0.6 %). Similar trends of population decrease have been observed in other big northeastern cities such as Pittsburgh, in which its population dramatically changed by −9.5 % during 1990–2000 and −8.6 % during 2000–2010 (US Census Bureau, 2018). The population loss is also recorded in a large number of small cities in the northeastern region, including Johnstown and Rochester in New York, Weirton in West Virginia, and Harrisburg in Pennsylvania (US Census Bureau, 2018).
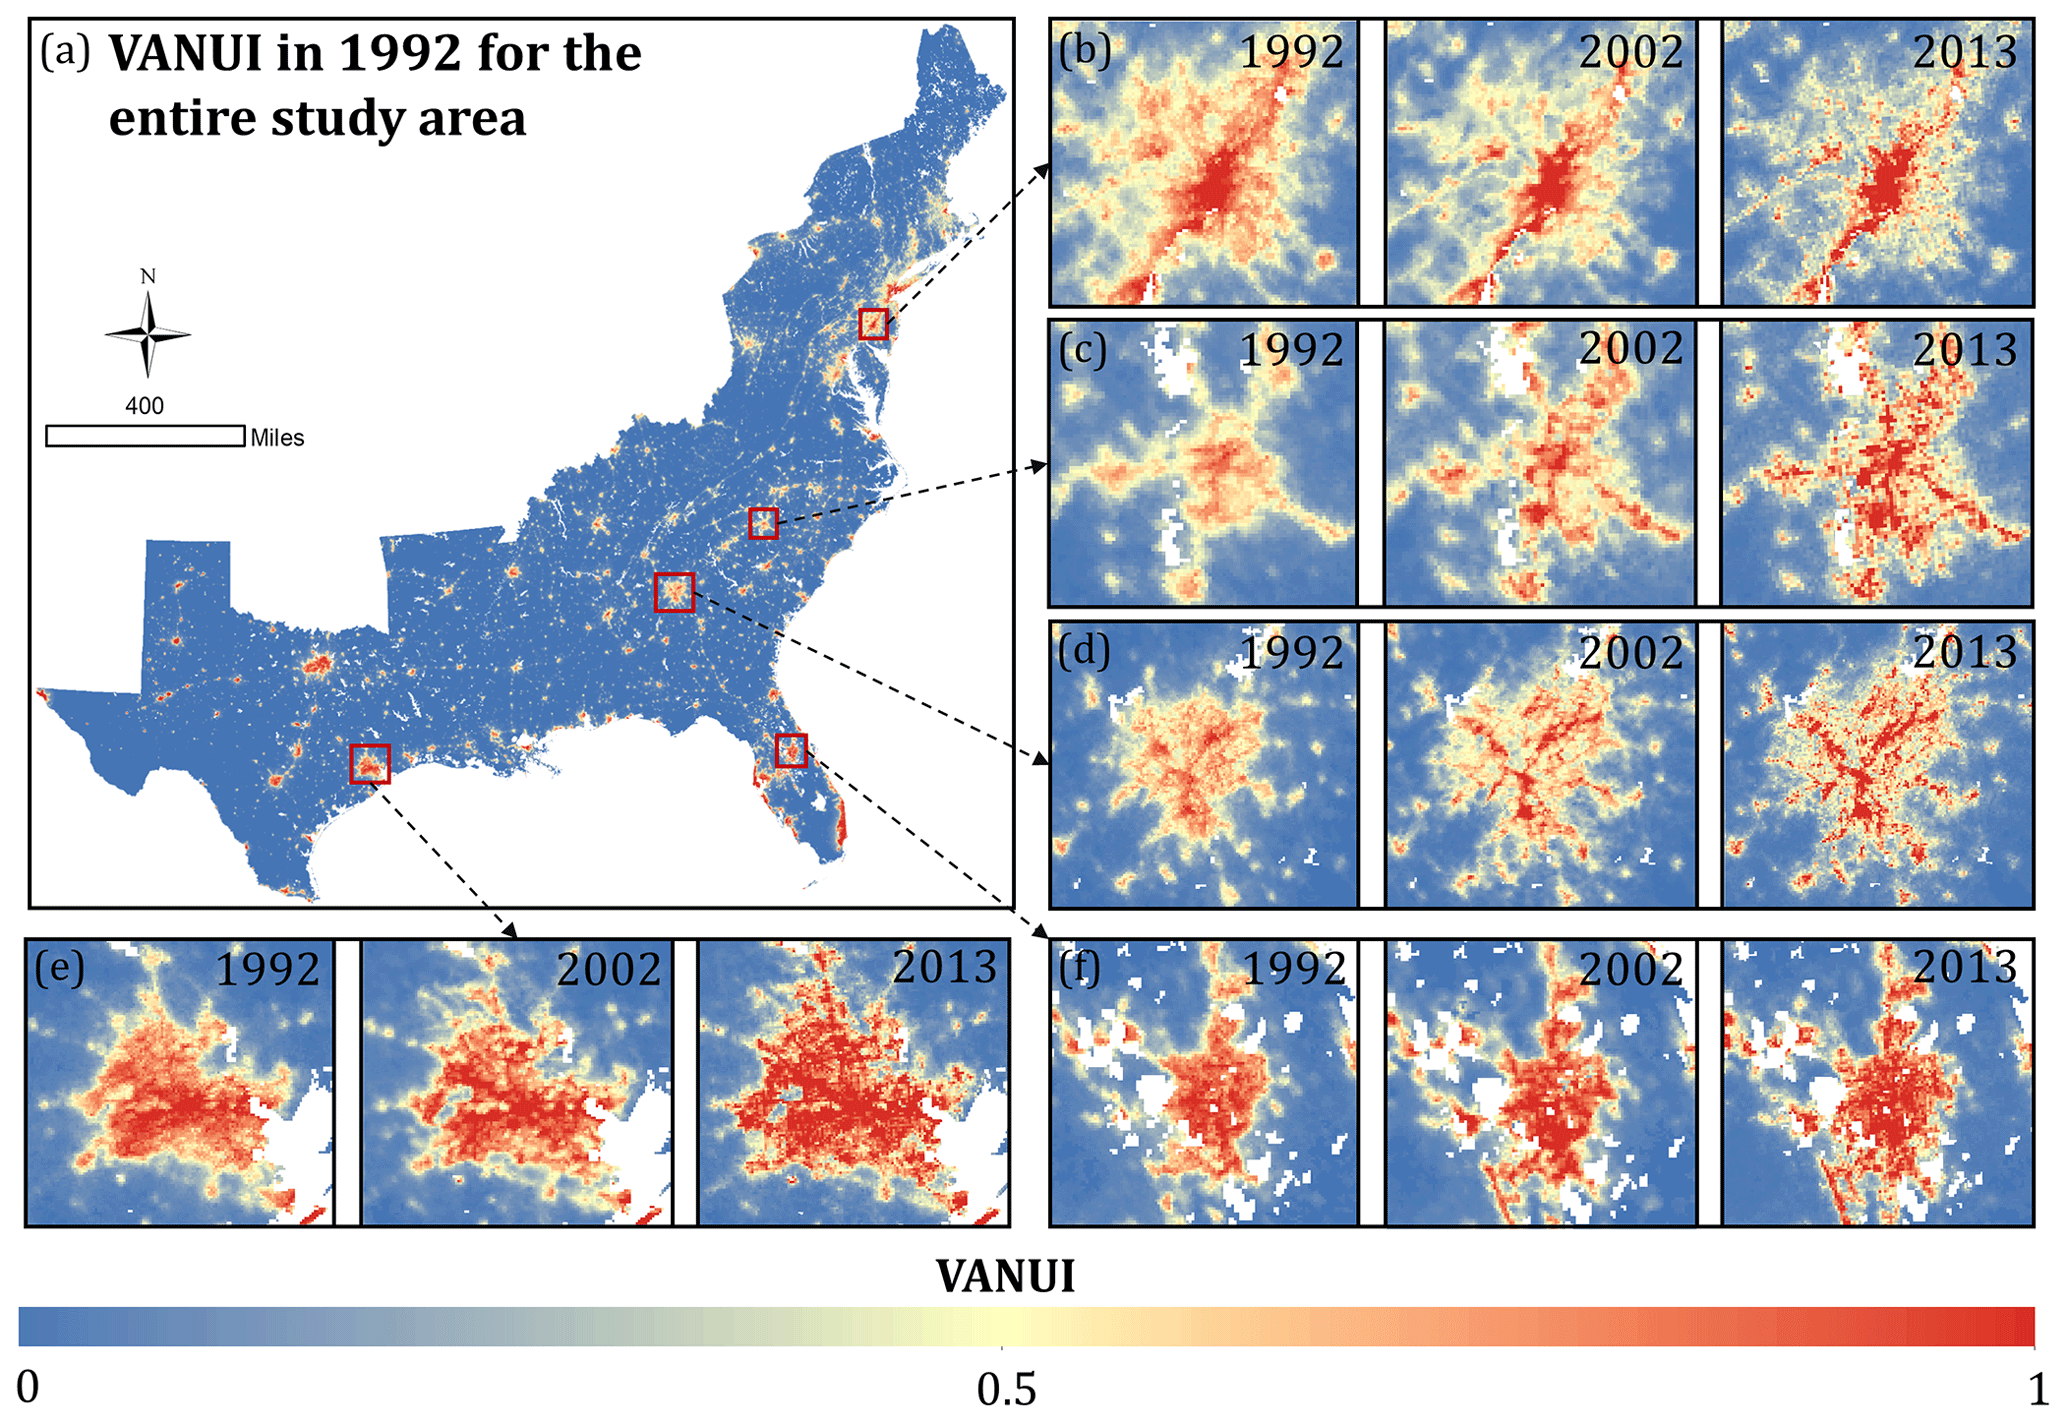
Figure 5(a) The VANUI distribution in the study area in 1992. The subfigures demonstrate the VANUI variations in 1992, 2002 and 2013 in five selected urban cities: (b) Philadelphia, (c) Charlotte, (d) Atlanta, (e) Houston and (f) Orlando. The white clusters are water bodies masked out of the analysis.
Oppositely, the southern and southeastern cites have experienced intensified human settlement characterized by expanded city perimeters and intensified urban cores. Houston (Fig. 5e), for instance, has dramatically increased its human settlement. Again, this observation is well supported by the population boost per the census records, with an increasing rate of 19.8 % in 1990–2000 and 7.5 % in 2000–2010. Other cities, including Charlotte (Fig. 5c), Atlanta (Fig. 5d), and Orlando (Fig. 5f), also have seen significantly intensified human settlement supported by their increasing population records. In general, the opposite trends of human settlement between the north and south of the study area match well with the “Snow Belt-to-Sun Belt” population shift trend documented in past studies in the last decades (Hogan, 1987; Iceland et al., 2013).
It could be noted that the VANUI maps in 2013 provide much finer details than those in 1992 and 2002. Given the unaltered spatial resolution of the DMSP/OLS sensors, it can be explained by the different resolutions of the raw NDVI products from the AVHRR (1 km) and MODIS (250 m). Although images have been resampled to the same pixel size (1 km) and carefully calibrated in their time series, the intrinsic sensitivity of those two sensors still affects the VANUI outputs.
5.4 Spatiotemporal patterns of human settlement and hurricane impacts
In each hurricane-prone zone, the yearly percentage of lit pixels (VANUI > 0) sheds light on annual land development, leading to a better understanding of the process of human settlement facing different degrees of hurricane impacts. The interannual fluctuation of total lit-pixel numbers exists in all zones, presumably due to the uncertainties introduced from the calibration of the DMSP/OLS NTL series and NDVI series. Bearing this noise, Fig. 6 presents the general trends of the lit-pixel percentage in each zone. The lit-pixel percentage varies in different zones, revealing a ranking of Zone 1 (48.5 %) followed by Zone 2 (45.4 %), Zone 3 (41.6 %), and Zone 4 (31.6 %). Urban development was favored and prioritized in coastal regions, which were also the zones facing higher hurricane impacts.
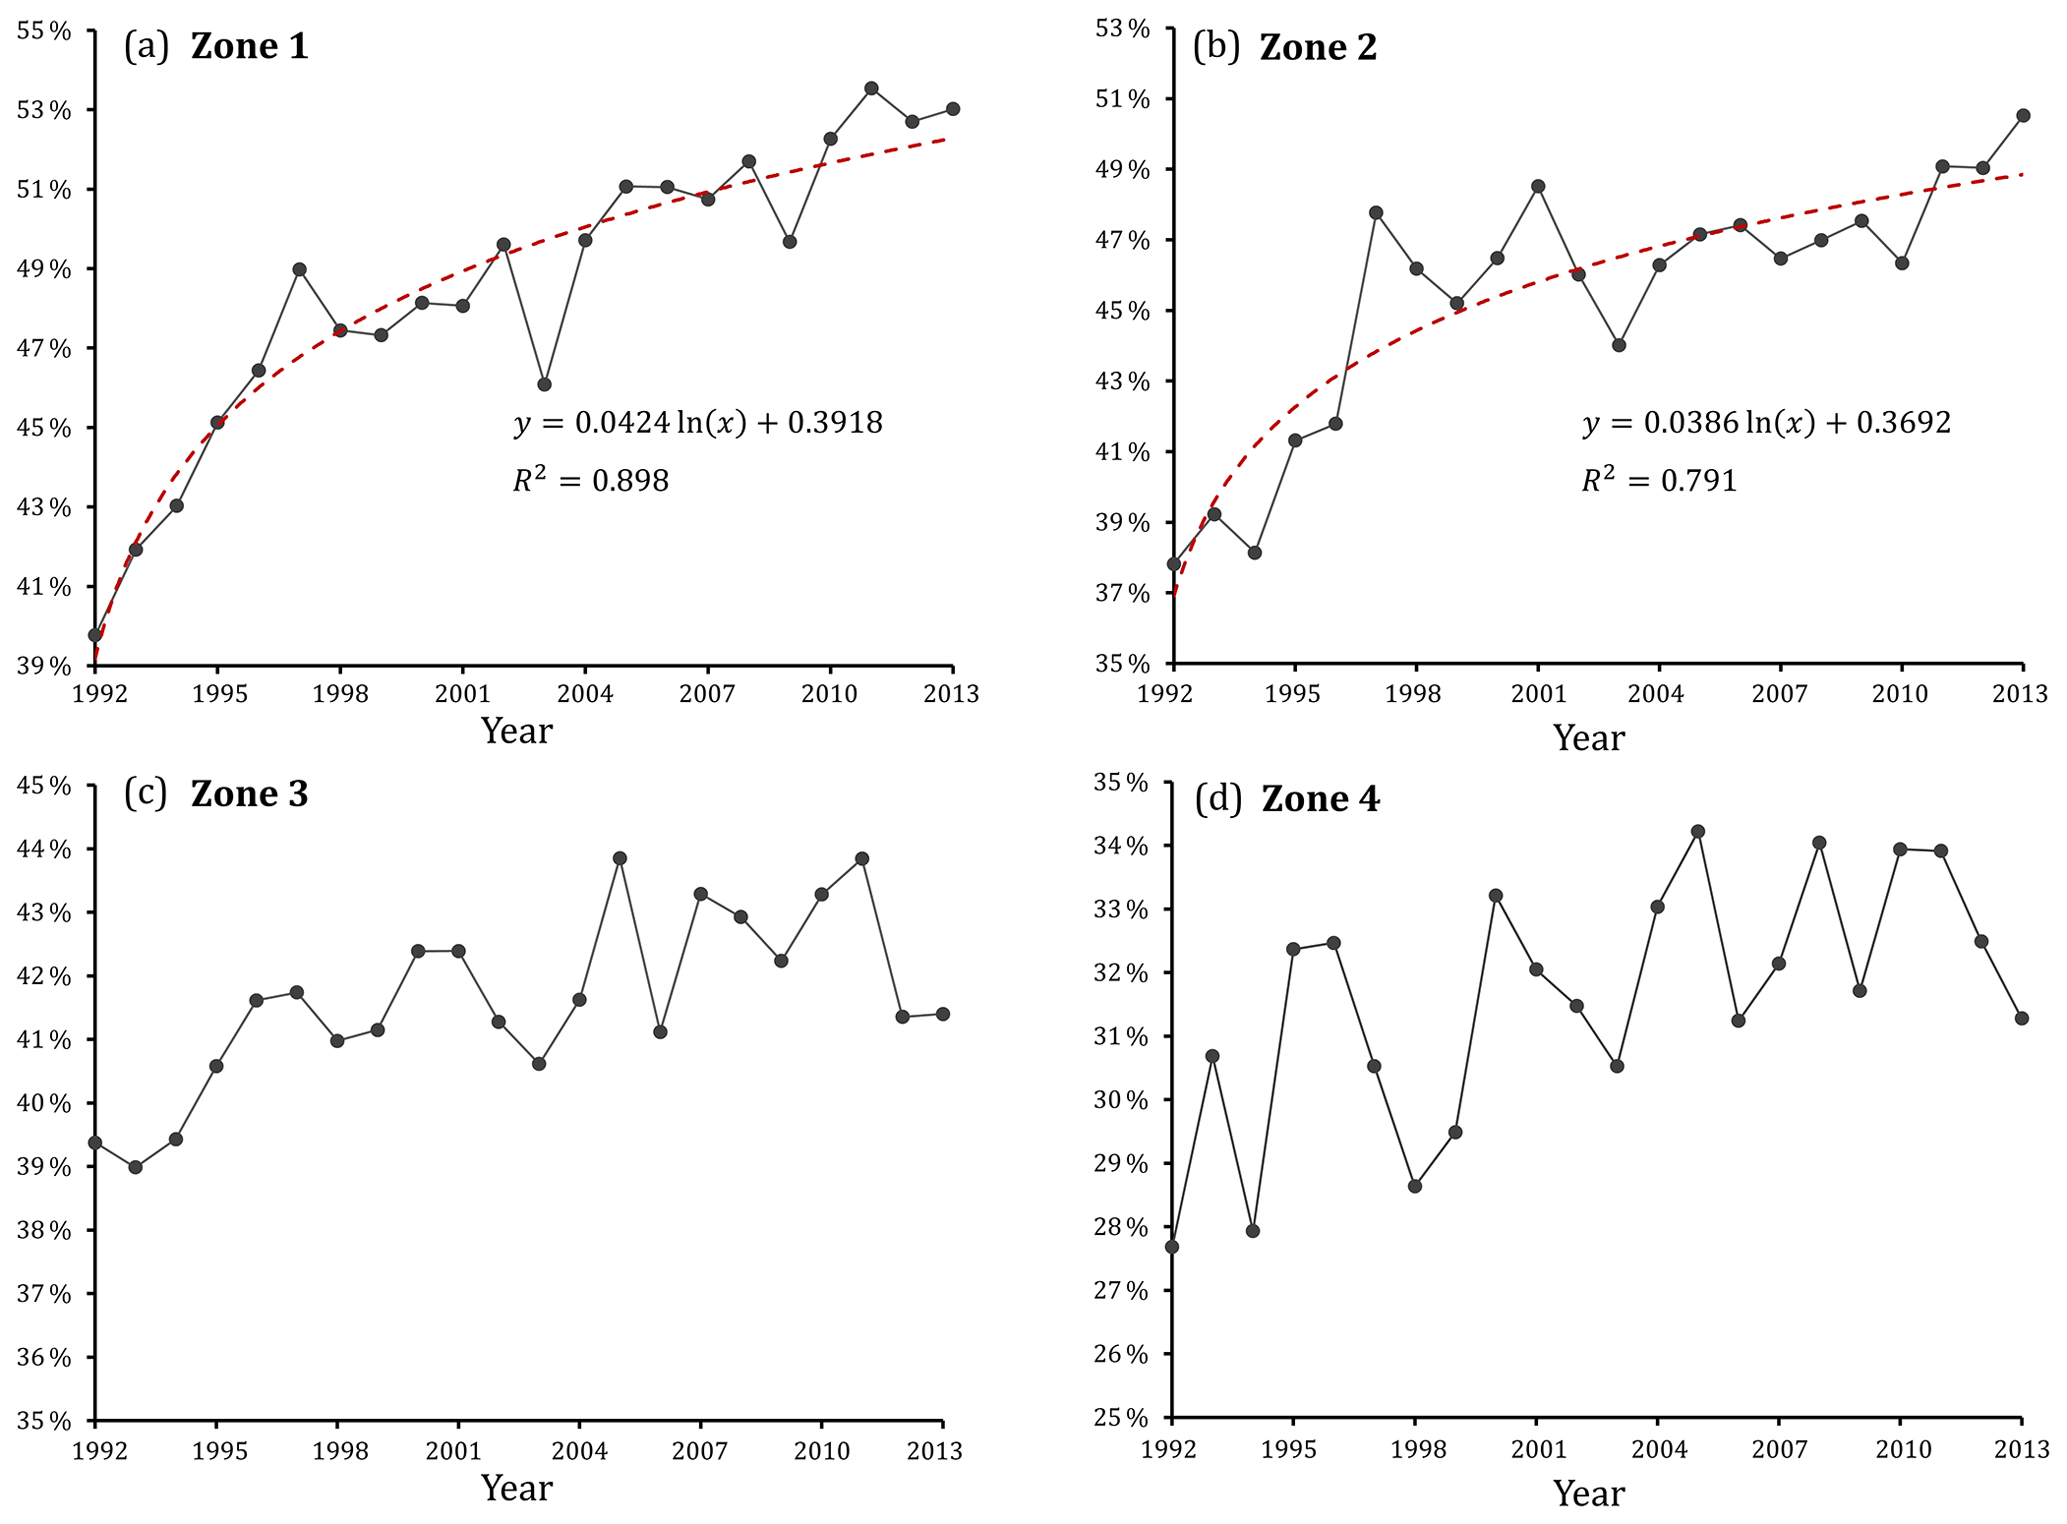
Figure 6Yearly statistics of percent area with VANUI values larger than 0 in (a) Zone 1, (b) Zone 2, (c) Zone 3 and (d) Zone 4. In (a) and (b), the independent variable x in the logarithmic regression model denotes the year sequence starting from 1992, meaning that x=1 denotes the year 1992, x=2 denotes 1993, and so on.
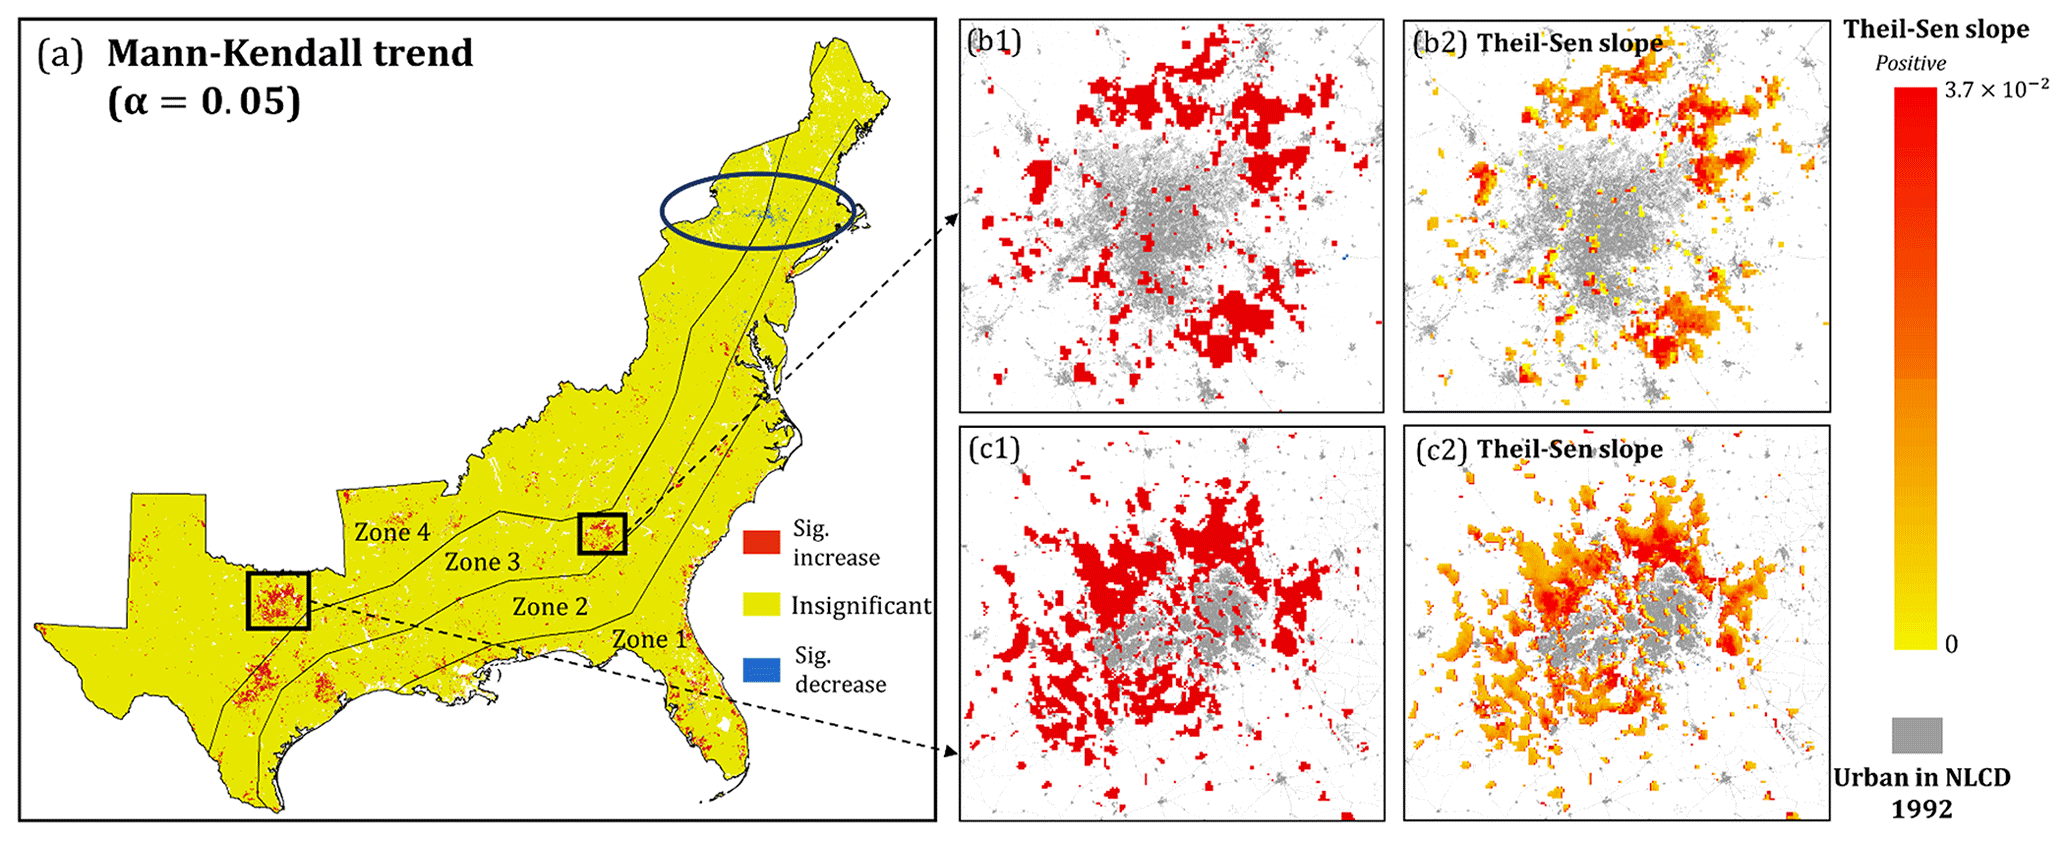
Figure 7Maps of the 22-year Mann–Kendall trend and Theil–Sen slope in the study area. Two subsets are selected: Dallas (trend map in b1 and slope map in b2) and Atlanta (trend map in c1 and slope map in c2).
As Fig. 6a (Zone 1) and Fig. 6b (Zone 2) suggest, the extent of human settlement in both zones increased significantly from 1992 to 2013, indicating consecutive land development in these highly hurricane-prone zones. The trends in both zones follow a logarithmic relationship that increased sharply in earlier years then slowed down. Located on the frontmost land–sea border, Zone 1 receives the most frequent and intense hurricanes, yet its degree of fitness (coefficient of determination R2=0.898) was higher than that of Zone 2 (R2=0.791) in logarithmic regressions. With increased land development, we can conclude that the hurricane impacts on human settlement in these two zones are becoming more severe due to their higher hurricane exposure. Zone 3 and Zone 4 are located further away from the coastal front. Although a slight increase in lit-pixel percentage could be visually observed for Zone 3 (Fig. 6c) and Zone 4 (Fig. 6d), their logarithmic trends are not statistically significant at confidence level α=0.05, and, therefore, the regression lines are not marked in these figures. Figure 6 reveals a more significant increase in human settlement in areas closer to the coast front than inland during the 22-year period. The finding coincides with current literature in which studies have reported the ever-growing population in coastal counties since the 1990s (Crossett et al., 2004; Stewart et al., 2003).
The Mann–Kendall trend test coupled with a Theil–Sen slope estimator extracted the areas with a significant change (increase or decrease) in human settlement in the 22-year period (Fig. 7). Zonal statistics were also summarized for the four hurricane-prone zones (Table 3). The net increase area is defined as the area difference between pixels with a significant increasing and decreasing trend. The net increase zonal percentage represents the percentage of a net increase area in each predefined hurricane-prone zone. As Table 3 suggests, 4.22 % of the area in Zone 1 experienced a significant increase in human settlement, followed by 2.34 % in Zone 2, 2.08 % in Zone 3, and 1.65 % in Zone 4. The statistics above suggest a noticeably positive relationship between the hurricane proneness of each zone and the percent area with a significant increase in settlement. The sum of the Theil–Sen slope, on the other hand, established the relationship between hurricane proneness and the increase rate of settlement in each zone. Zone 1 receives the most hurricanes, but it has the strongest increase of settlement intensity, followed by Zones 2–4.
Table 3Hurricane-prone zonal summary of the Mann–Kendall and Theil–Sen tests.
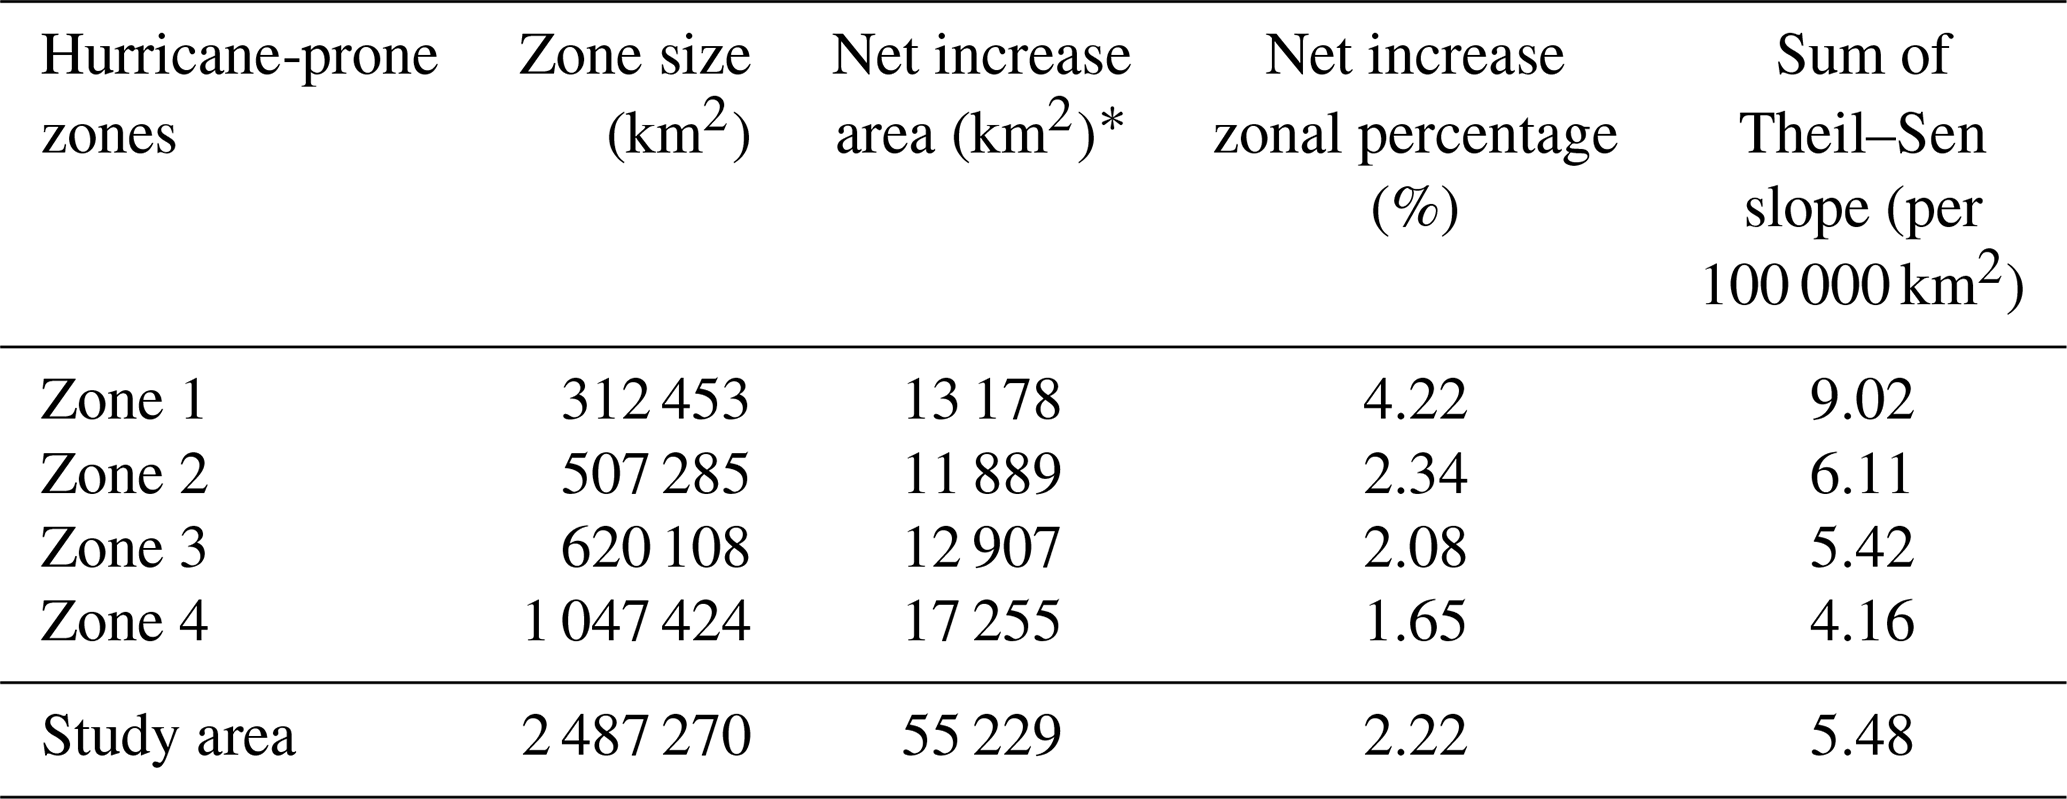
* Net increase area in each hurricane-prone zone denotes the area difference in this zone between pixels with a significant increasing trend and pixels with a significant decreasing trend in their VANUI series.
Figure 7a demonstrates the Mann–Kendall trend map in the study area, where red, blue, and yellow in the figure represent a pixel with a significant increasing trend, a significant decreasing trend, and an insignificant trend, respectively. Urban expansion in major cities in the south (the US southeastern region), for example, Atlanta, Houston, and Dallas, can be clearly observed as their city cores are surrounded by extensive areas with a significant increasing trend. A decrease in human settlement intensity was observed mostly in the north (the US northeastern region; blue ellipse in Fig. 7a), where several cities in the state of New York stand out, including Albany, Troy, and Johnstown.
Two city clusters were selected to demonstrate the spatial distributions of the Mann–Kendall trend and Theil–Sen slope: the metropolitan areas of Atlanta, Georgia (Fig. 7b1 and b2), and Dallas, Texas (Fig. 7c1 and c2). For both cities, urban areas in 1992 were extracted from the Enhanced National Land Cover Data 1992 (NLCDe 92) released by the US Geological Survey (USGS) (https://water.usgs.gov/GIS/metadata/usgswrd/XML/nlcde92.xml, last access: 7 January 2019), in which all classes (low-intensity residential, high-intensity residential, commercial/industrial/transportation, and forest residential) were counted as urban areas in 1992. From Fig. 7, significant urban expansion can be observed in both cities. The growth of human settlement was also observed in small towns surrounding urban clusters.
For areas with a significant Mann–Kendall trend, the Theil–Sen slope indicates the change rate of human settlement (either upwards or downwards). In Fig. 7b2 and c2, the development of the areas of metropolitan Atlanta and metropolitan Dallas followed obvious radial patterns: areas close to the urban core show a high increase rate of settlement (i.e., a high Theil–Sen slope), while areas away from the urban core show a low increase rate. Since the VANUI has been normalized to [0, 1] and the temporal period covers 22 years (1992–2013), a pixel would have a Theil–Sen slope of 0.045 (1∕22), under the assumption that its settlement intensity had steadily increased from 0 in 1992 to 1 in 2013. The maximum Theil–Sen slope reached 0.037 in both cities, indicating a significant boost of human settlement intensity during the investigated period.
Table 4Sum of VANUI value and change percentage in the top five most-populated MSAs in the north and south of the study area.
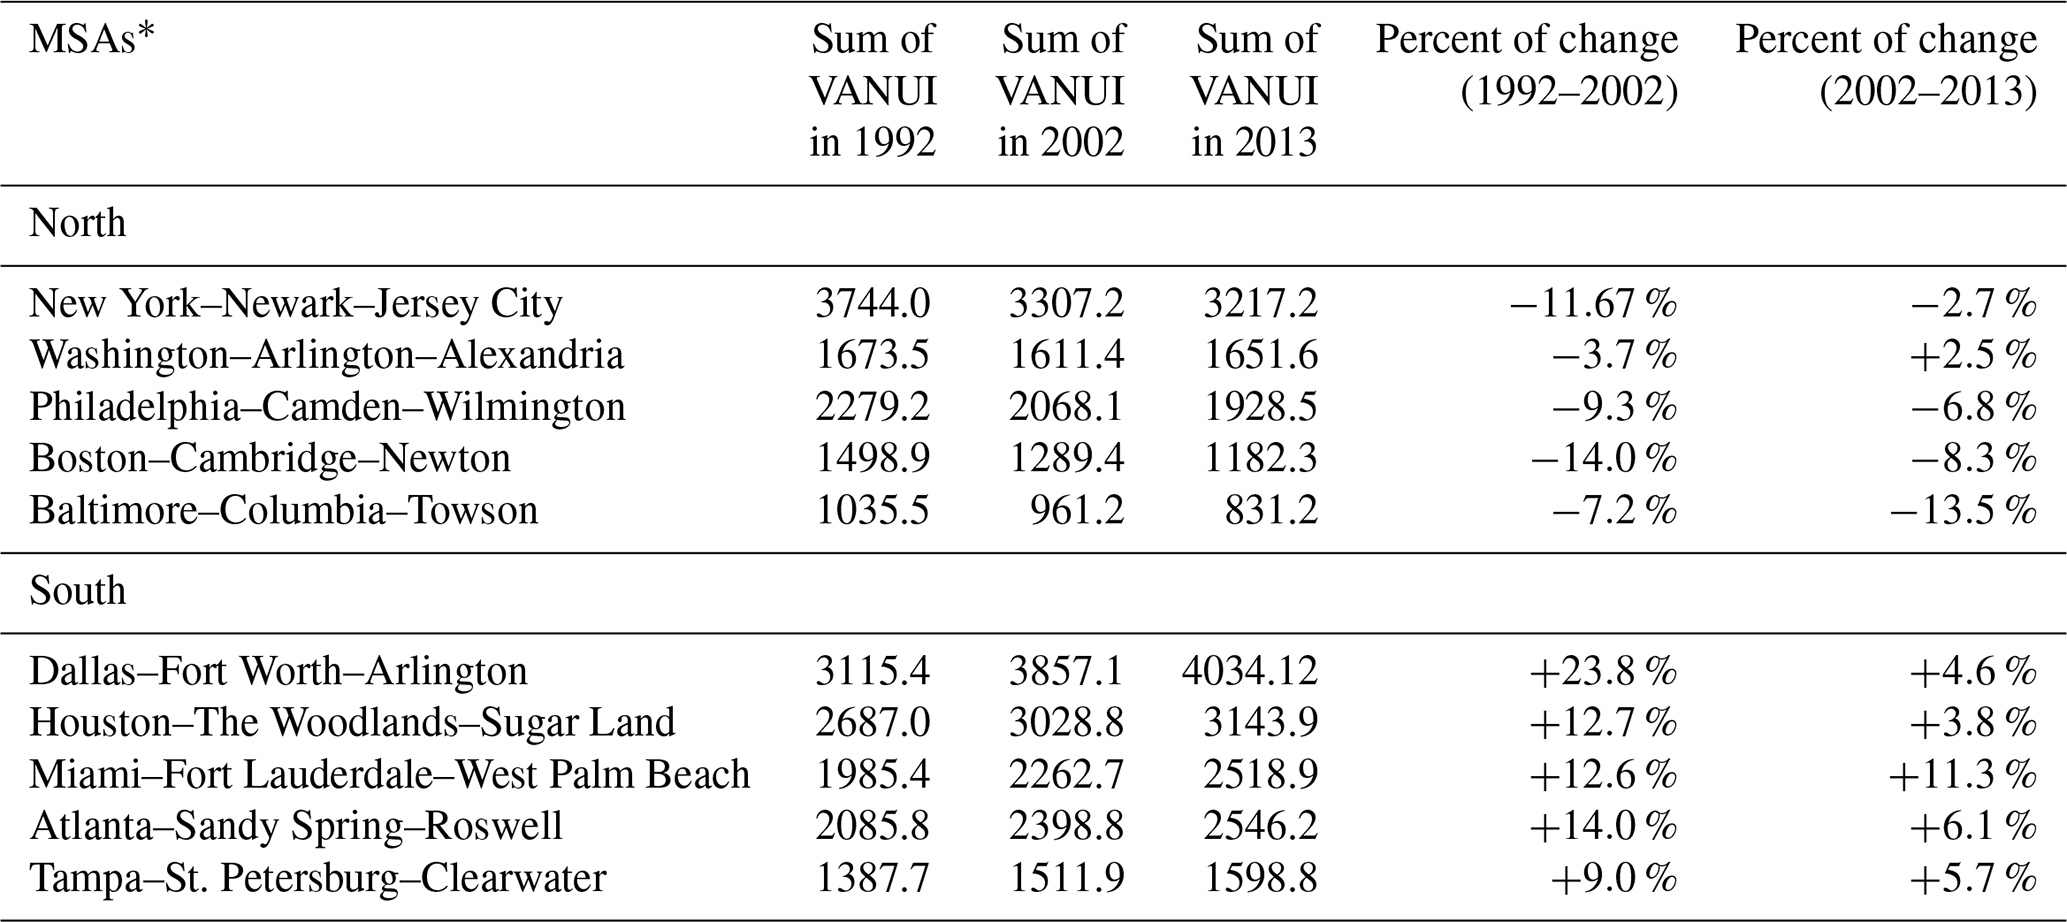
* All administrative boundaries of the selected MSAs were derived from US Census Bureau data available at https://www.census.gov/geo/maps data/data/cbf/cbf_msa.html (last access: 7 January 2019). MSAs in the south were selected from the southeastern and southern Gulf region of the US, and therefore, Washington–Arlington–Alexandria and Baltimore–Columbia–Towson were regarded as northern MSAs in this study.
Metropolitan statistical areas (MSAs) in the study area were selected for further analysis. Defined by the US Office of Management and Budget (OMB), an MSA represents a contiguous area of relatively high population density. From a total of 383 predefined MSAs in the study area, the top 5 most populated MSAs in each part were selected. The lit-pixel counts within the administrative boundary of each MSA in 1992, 2002, and 2013 were extracted. As Table 4 suggests, all selected MSAs in the north had decreased settlement intensities in two temporal periods (1992–2002 and 2002–2013). The only exception is the Washington–Arlington–Alexandria MSA in 2002–2013, during which its settlement intensity slightly increased by 2.5 %. On the contrary, all of the top five most populated MSAs in the south witnessed a significant increase in settlement intensity. The MSA of Dallas–Fort Worth–Arlington, for instance, experienced a 23.8 % increase of settlement intensity in 1992–2002, and the increase rate has slowed down to 4.6 % in the next period (2002–2013). The MSA of Miami–Fort Lauderdale–West Palm Beach, however, is believed to have a continuous boost of human settlement as its sum of VANUI increased 12.6 % in 1992–2002 and 11.3 % in 2002–2013. Although four out of the five biggest MSAs in the south saw reduced growth rate in 2002–2013 period (Table 4), Frey (2019) pointed out that southern metropolitan areas have picked up their population increase rate since 2015, and this could be a sign that southern metropolitan areas are heading back to the growth levels they experienced prior to the US recession in 2007 to 2009.
The ongoing intensification of human settlement in high hurricane-exposure areas, especially in the US southeastern region, potentially leads to an escalation in flood-induced losses. Despite the fact that the driving factors are complex and unclear, they reflect the micro to macro levels of socioeconomic development that has been prioritized in high hurricane-exposure areas in the last decades. Additionally, the intensification of human settlement always couples with anthropogenic environmental changes (deforestation, wetland destruction, etc.), potentially resulting in more severe impacts during hurricanes and floods (Viero et al., 2019). Although the investigated period of this study stops at the year 2013 due to the termination of DMSP/OLS satellites, the intensification of human settlement in areas with high hurricane exposure (like Zone 1) is expected to continue and might even accelerate. In alignment with economic recovery, studies have shown an escalated population shift towards the Atlantic and Gulf coasts after the stalling during the recession (Neumann et al., 2015).
Coastal resilience becomes more complicated when the increasing pressure of human settlement in coastal zones is coupled with the more frequent and costly hurricanes. The last 3 years (2016–2018) have seen consecutive Atlantic hurricane seasons producing above-average damage. The economic damage in the conterminous US in 2017 was among the costliest ever recorded on a nominal, inflation-adjusted, and normalized basis (Klotzbach et al., 2018). Even worse, 2018 was the most recent hurricane season to feature four simultaneously named storms (Florence, Isaac, Helene, and Joyce) after 2008. Although the future trend of hurricane seasons cannot be easily predicted, the implication of greater losses stands as the sizable growth of human settlement continues along the Atlantic and Gulf coasts.
With the launch of the Suomi National Polar-orbiting Partnership (NPP) satellite in October 2011, NTL data from the onboard Visible Infrared Imaging Radiometer Suite (VIIRS) have become available. Its onboard calibration capacity and saturation-free merit have made NPP–VIIRS a new generation system of nighttime light observations (Elvidge et al., 2013). This new NTL data source will provide improved monitoring of human settlement and land development in hurricane-prone regions for advanced disaster assessment.
This study examined the spatiotemporal dynamics of nighttime satellite-derived human settlement in 1992–2013 in four zones at different levels of hurricane proneness on the US Atlantic and Gulf coasts. The hurricane-prone zones were delineated based on historical storm tracks from the North Atlantic Basin during 1851–2016 via a wind-speed-weighted track density function. A three-step intercalibration framework was applied to intercalibrate the multi-satellite DMSP/OLS NTL series, and the NDVI-desaturated NTL products were extracted to derive VANUI, a popular index representing human settlement intensity. The Mann–Kendall trend and Theil–Sen slope were further applied to identify the existing trend in the 22-year period.
Zonal statistics indicate that in the frontmost zones along the coast, i.e., Zone 1 and Zone 2 (receiving the most hurricanes), human settlement intensity has dramatically increased, although the change rate has slowed down since the early 2000s. The increase was not significant in areas farther away from the coasts (Zone 3 and Zone 4). Via trend analysis, 4.22 % of the area in Zone 1 experienced a significant increase in settlement intensity, followed by 2.34 % in Zone 2, 2.08 % in Zone 3, and 1.65 % in Zone 4, revealing higher pressure of human settlement and thus impacts from hurricanes in the frontmost coastal areas. Different from the zonal partitions, opposite trends of human settlement were observed from the north (decreasing) to the south (increasing) of the study region, which are supported by decadal census records. These opposite trends agree with the Snow Belt-to-Sun Belt US population shift reported in other studies. Along the Atlantic and Gulf coasts, the ongoing intensification of anthropogenic environmental changes coupled with more frequent and severe hurricanes is likely to cast more severe pressure on coastal resilience.
All data used in this study are publicly available. The historical storm tracks were retrieved from the International Best Track Archive for Climate Stewardship (IBTrACS), hosted by NOAA (https://www.ncdc.noaa.gov/ibtracs/, last access: 11 November 2018). The DMSP/OLS NTL data were obtained from the National Centers for Environmental Information website (https://ngdc.noaa.gov/eog/dmsp/downloadV4composites.html, last access: 12 November 2018). The MODIS NDVI series was derived from the Oak Ridge National Laboratory Distributed Active Archive Center (ORNL DAAC) (https://daac.ornl.gov/, last access: 11 November 2018). The AVHRR NDVI series was provided by the United States Geological Survey Earth Resources Observation and Science (USGS/EROS) (https://phenology.cr.usgs.gov/get_data_1km.php, last access: 11 November 2018).
XH designed the analytical framework of this study, conducted the GIS and statistical analysis, and drafted the paper. CW and JL provided methodological advice. XH, CW, and JL made major revisions to the paper.
The authors declare that they have no conflict of interest.
The authors would like to thank Huan Ning, the anonymous reviewers, and the editor for their constructive comments and suggestions, which greatly improved the quality of the paper.
This study is partially supported by a 2018 ASPIRE grant and a 2018 SPARC Graduate Research Grant from the Office of the Vice President for Research, University of South Carolina.
This paper was edited by Paolo Tarolli and reviewed by three anonymous referees.
Ceola, S., Laio, F., and Montanari, A.: Satellite nighttime lights reveal increasing human exposure to floods worldwide, Geophys. Res. Lett., 41, 7184–7190, 2014.
Ceola, S., Laio, F., and Montanari, A.: Human-impacted waters: New perspectives from global high-resolution monitoring, Water Resour. Res., 51, 7064–7079, 2015.
Chand, T. K., Badarinath, K. V. S., Elvidge, C. D. ,and Tuttle, B. T.: Spatial characterization of electrical power consumption patterns over India using temporal DMSP-OLS night-time satellite data, Int. J. Remote Sens., 30, 647–661, 2009.
Chenoweth, M. and Landsea, C.: The San Diego Hurricane of 2 October 1858, B. Am. Meteorol. Soc., 85, 1689–1698, 2004.
Crossett, K. M., Culliton, T. J., Wiley, P. C., and Goodspeed, T. R.: Population trends along the coastal United States: 1980–2008, Coast. Trends Rep. Ser., NOAA, Natl. Ocean Serv. Manag. Budg. Off., Spec. Proj., Silver Spring, MD, 86 pp., 2004.
de Jong, R., de Bruin, S., de Wit, A., Schaepman, M. E., and Dent, D. L.: Analysis of monotonic greening and browning trends from global NDVI time-series, Remote Sens. Environ., 115, 692–702, 2011.
Doll, C. H., Muller, J. P., and Elvidge, C. D.: Night-time imagery as a tool for global mapping of socioeconomic parameters and greenhouse gas emissions, Ambio, 29, 157–162, 2000.
Elvidge, C. D., Baugh, K., Hobson, V., Kihn, E., Kroehl, H., Davis, E., and Cocero, D.: Satellite inventory of human settlements using nocturnal radiation emissions: A contribution for the global toolchest, Global Change Biol., 3, 387–395, 1997.
Elvidge, C. D., Baugh, K. E., Dietz, J. B., Bland, T., Sutton, P. C., and Kroehl, H. W.: Radiance calibration of DMSP-OLS low-light imaging data of human settlements, Remote Sens. Environ., 68, 77–88, 1999.
Elvidge, C. D., Ziskin, D., Baugh, K., Tuttle, B., Ghosh, T., Pack, D., Erwin, E., and Zhizhin, M.: A fifteen year record of global natural gas flaring derived from satellite data, Energies, 2, 595–622, 2009.
Elvidge, C. D., Baugh, K. E., Zhizhin, M., and Hsu, F. C.: Why VIIRS data are superior to DMSP for mapping nighttime lights, in: Proceedings of the Asia-Pacific Advanced Network, 12–16 January 2013, University of Hawaii, Hawaii, 62–69, 2013.
Fernandes, R. and Leblanc, S. G.: Parametric (modified least squares) and non-parametric (Theil–Sen) linear regressions for predicting biophysical parameters in the presence of measurement errors, Remote Sens. Environ., 95, 303–316, 2005.
Frey, W. H.: U.S. growth rate hits new low as migration to the Sun Belt continues, available at: https://www.brookings.edu/blog/the-avenue/2016/12/23/u-s-growth-rate-hits-new-low-as-migration-to-the-sun-belt, last access: 29 January 2019.
Ghosh, T., Powell, R., Elvidge, C., Baugh, K., Sutton, P., and Anderson, S.: Shedding light on the global distribution of economic activity, Open Geogr. J., 3, 148–161, 2010.
Goldenberg, S. B., Landsea, C. W., Mestas-Nuñez, A. M., and Gray, W. M.: The recent increase in Atlantic hurricane activity: Causes and implications, Science, 293, 474–479, 2001.
Hogan, T. D.: Determinants of the seasonal migration of the elderly to sunbelt states, Res. Aging, 9, 115–133, 1987.
Hsu, F. C., Baugh, K., Ghosh, T., Zhizhin, M., and Elvidge, C.: DMSP-OLS radiance calibrated nighttime lights time series with intercalibration, Remote Sens., 7, 1855–1876, 2015.
Huang, X., Schneider, A., and Friedl, M. A.: Mapping sub-pixel urban expansion in China using MODIS and DMSP/OLS nighttime lights, Remote Sens. Environ., 175, 92–108, 2016.
Iceland, J., Sharp, G., and Timberlake, J. M.: Sun Belt rising: Regional population change and the decline in black residential segregation, 1970–2009, Demography, 50, 97–123, 2013.
Imhoff, M. L., Lawrence, W. T., Stutzer, D. C., and Elvidge, C. D.: A technique for using composite DMSP/OLS “city lights” satellite data to map urban area, Remote Sens. Environ., 61, 361–370, 1997.
Klotzbach, P. J., Bowen, S. G., Pielke, R., and Bell, M.: Continental U.S. Hurricane Landfall Frequency and Associated Damage: Observations and Future Risks, B. Am. Meteorol. Soc., 99, 1359–1376, 2018.
Krupa, M.: Hurricane Florence's toll on US homes and businesses has now hit 11 figures, available at: https://www.cnn.com/2018/10/07/us/florence-storm-damage-estimates/index.html, last access: 7 October 2018.
Kyba, C. C., Kuester, T., de Miguel, A. S., Baugh, K., Jechow, A., Hölker, F., Bennie, J. , Elvidge, C. D., Gaston, K. J., and Guanter, L.: Artificially lit surface of Earth at night increasing in radiance and extent, Sci. Adv., 3, e1701528, https://doi.org/10.1126/sciadv.1701528, 2017.
Landsea, C. W., Vecchi, G. A., Bengtsson, L., and Knutson, T. R.: Impact of duration thresholds on Atlantic tropical cyclone counts, J. Climate, 23, 2508–2519, 2010.
Letu, H., Hara, M., Yagi, H., Naoki, K., Tana, G., Nishio, F., and Shuhei, O.: Estimating energy consumption from night-time DMPS/OLS imagery after correcting for saturation effects, Int. J. Remote Sens., 31, 4443–4458, 2010.
Li, X. and Zhou, Y.: Urban mapping using DMSP/OLS stable night-time light: a review, Int. J. Remote Sens., 38, 6030–6046, 2017.
Lin, J., Liu, X., Li, K., and Li, X.: A maximum entropy method to extract urban land by combining MODIS reflectance, MODIS NDVI, and DMSP-OLS data, Int. J. Remote Sens., 35, 6708–6727, 2014.
Liu, L. and Leung, Y.: A study of urban expansion of prefectural-level cities in South China using night-time light images, Int. J. Remote Sens., 36, 5557–5575, 2015.
Liu, X., Hu, G., Ai, B., Li, X., and Shi, Q.: A normalized urban areas composite index (NUACI) based on combination of DMSP-OLS and MODIS for mapping impervious surface area, Remote Sens., 7, 17168–17189, 2015.
Liu, Z., He, C., Zhang, Q., Huang, Q., and Yang, Y.: Extracting the dynamics of urban expansion in China using DMSP-OLS nighttime light data from 1992 to 2008, Landscape Urban Plan., 106, 62–72, 2012.
Lu, D., Tian, H., Zhou, G., and Ge, H.: Regional mapping of human settlements in southeastern China with multisensor remotely sensed data, Remote Sens. Environ., 112, 3668–3679, 2008.
Lu, H., Zhang, C., Liu, G., Ye, X., and Miao, C.: Mapping China's Ghost Cities through the Combination of Nighttime Satellite Data and Daytime Satellite Data, Remote Sens., 10, 1037, https://doi.org/10.3390/rs10071037, 2018.
Ma, Q., He, C., Wu, J., Liu, Z., Zhang, Q., and Sun, Z.: Quantifying spatiotemporal patterns of urban impervious surfaces in China: An improved assessment using nighttime light data, Landscape Urban Plan., 130, 36–49, 2014.
Mann, H. B.: Nonparametric tests against trend, Econometrica: J. Econ. Soc., 13, 245–259, 1945.
Milesi, C., Elvidge, C. D., Nemani, R. R., and Running, S. W.: Assessing the impact of urban land development on net primary productivity in the southeastern United States, Remote Sens. Environ., 86, 401–410, 2003.
Neumann, B., Vafeidis, A. T., Zimmermann, J., and Nicholls, R. J.: Future coastal population growth and exposure to sea-level rise and coastal flooding – a global assessment, PLoS One, 10, e0118571, https://doi.org/10.1371/journal.pone.0118571, 2015.
NOAA Earth Observation Group: Costliest US tropical cyclones tables updated, available at: https://www.nhc.noaa.gov/news/UpdatedCostliest.pdf (last access: 10 October 2018), 2018a.
NOAA Earth Observation Group: OLS – Operational Linescan System, available at: https://ngdc.noaa.gov/eog/sensors/ols.html (last access: 10 October 2018), 2018b.
Pandey, B., Joshi, P. K., and Seto, K. C.: Monitoring urbanization dynamics in India using DMSP/OLS night time lights and SPOT-VGT data, Int. J. Appl. Earth Obs. Geoinf., 23, 49–61, 2013.
Sen, P. K.: Estimates of the regression coefficient based on Kendall's tau, J. Am. Stat. Assoc., 63, 1379–1389, 1968.
Shao, Z. and Liu, C.: The integrated use of DMSP-OLS nighttime light and MODIS data for monitoring large-scale impervious surface dynamics: A case study in the Yangtze River Delta, Remote Sens., 6, 9359–9378, 2014.
Spruce, J. P., Gasser, G. E., and Hargrove, W. W.: MODIS NDVI data, smoothed and gap-filled, for the conterminous US: 2000–2015, USDA Forest Service and NASA Stennis, Oak Ridge, Tennessee, USA, https://doi.org/10.3334/ORNLDAAC/1299, 2016.
Stewart, M. G., Rosowsky, D. V., and Huang, Z.: Hurricane risks and economic viability of strengthened construction, Nat. Hazard. Rev., 4, 12–19, 2003.
Tan, M.: Use of an inside buffer method to extract the extent of urban areas from DMSP/OLS nighttime light data in North China, Gisci. Remote Sens., 53, 444–458, 2016.
Tucker, C. J., Pinzon, J. E., Brown, M. E., Slayback, D. A., Pak, E. W., Mahoney, R., Vermote, E. F., and El Saleous, N.: An extended AVHRR 8-km NDVI dataset compatible with MODIS and SPOT vegetation NDVI data, Int. J. Remote Sens., 26, 4485–4498, 2005.
US Census Bureau: Population, available at: https://www.census.gov/topics/population.html, last access: 18 November 2018.
Vecchi, G. A. and Knutson, T. R.: Historical Changes in Atlantic Hurricane and Tropical Storms, available at: https://www.gfdl.noaa.gov/historical-atlantic-hurricane-and-tropical-storm-records/ last access: 7 October 2018.
Viero, D. P., Roder, G., Matticchio, B., Defina, A., and Tarolli, P.: Floods, landscape modifications and population dynamics in anthropogenic coastal lowlands: The Polesine (northern Italy) case study, Sci. Total Environ., 651, 1435–1450, 2019.
Villarini, G., Vecchi, G. A., Knutson, T. R., and Smith, J. A.: Is the recorded increase in short-duration North Atlantic tropical storms spurious?, J. Geophys. Res.-Atmos., 116, 1–11, 2011.
Xu, H.: A new index for delineating built-up land features in satellite imagery, Int. J. Remote Sens., 29, 4269–4276, 2008.
Yi, K., Tani, H., Li, Q., Zhang, J., Guo, M., Bao, Y., Wang, X., and Li, J.: Mapping and evaluating the urbanization process in northeast China using DMSP/OLS nighttime light data, Sensors, 14, 3207–3226, 2014.
Yu, B., Shu, S., Liu, H., Song, W., Wu, J., Wang, L. and Chen, Z.: Object-based spatial cluster analysis of urban landscape pattern using nighttime light satellite images: A case study of China, Int. J. Geogr. Inf. Sci., 28, 2328–2355, 2014.
Zha, Y., Gao, J., and Ni, S.: Use of normalized difference built-up index in automatically mapping urban areas from TM imagery, Int. J. Remote Sens., 24, 583–594, 2003.
Zhang, Q., Schaaf, C., and Seto, K. C.: The vegetation adjusted NTL urban index: A new approach to reduce saturation and increase variation in nighttime luminosity, Remote Sens. Environ., 129, 32–41, 2013.
Zhang, Q., Li, B., Thau, D., and Moore, R.: Building a better urban picture: Combining day and night remote sensing imagery, Remote Sens., 7, 11887–11913, 2015.
Zhou, Y., Smith, S. J., Elvidge, C. D., Zhao, K., Thomson, A., and Imhoff, M.: A cluster-based method to map urban area from DMSP/OLS nightlights, Remote Sens. Environ., 147, 173–185, 2014.
Snow Belt-to-Sun BeltUS population shift trend. The results also suggest that hurricane-exposed human settlement has grown in extent and area, as more hurricane exposure has experienced a larger increase rate in settlement intensity.