the Creative Commons Attribution 4.0 License.
the Creative Commons Attribution 4.0 License.
 | 08 Oct 2019
Anomalies of dwellers' collective geotagged behaviors in response to rainstorms: a case study of eight cities in China using smartphone location data
Jiawei Yi
Yunyan Du
Fuyuan Liang
Tao Pei
Ting Ma
Chenghu Zhou
Understanding city residents' collective geotagged behaviors (CGTBs) in response to hazards and emergency events is important in disaster mitigation and emergency response. It is a challenge, if not impossible, to directly observe CGTBs during a real-time matter. This study used the number of location requests (NLR) data generated by smartphone users for a variety of purposes such as map navigation, car hailing, and food delivery to infer the dynamics of CGTBs in response to rainstorms in eight Chinese cities. We examined rainstorms, flooding, and NLR anomalies, as well as the associations among them, in eight selected cities across mainland China. The time series NLR clearly reflects cities' general diurnal rhythm, and the total NLR is moderately correlated with the total city population. Anomalies of the NLR were identified at both the city and grid scale using the Seasonal Hybrid Extreme Studentized Deviate (S-H-ESD) method. Analysis results demonstrated that the NLR anomalies at the city and grid levels are well associated with rainstorms, indicating that city residents request more location-based services (e.g., map navigation, car hailing, food delivery, etc.) when there is a rainstorm. However, the sensitivity of the city residents' collective geotagged behaviors in response to rainstorms varies in different cities as shown by different peak rainfall intensity thresholds. Significant high peak rainfall intensity tends to trigger city flooding, which leads to increased location-based requests as shown by positive anomalies in the time series NLR.


Global climate change is making rainfall events heavier and more frequent in many areas. Powerful rainstorms may flood a city once the rainfall exceeds the discharge capacity of a city's drainage system. Inundation of cities' critical infrastructure and populated communities tends to disrupt urban residents' social and economic activities and even cause dramatic loss of life and property (Papagiannaki et al., 2013; Spitalar et al., 2014; Liao et al., 2019). Floods nowadays are the most common type of natural disaster, which poses a serious threat to the safety of life and property in most countries (Alexander et al., 2006; Min et al., 2011; Hu et al., 2018). According to the released survey in the Bulletin of Flood and Drought Disasters in China, more than 104 cities were struck by floods in 2017, affecting a population of up to 2.18 million and causing over USD 2.46 billion in direct economic losses (China National Climate Center, 2017).
The impacts of a rainstorm are usually evaluated with respect to the interactions among rainfall intensity, population exposure, urban vulnerability, and the society coping capacity (Spitalar et al., 2014; Papagiannaki et al., 2017). The rainfall intensity that may trigger flood disasters has been extensively investigated, and many studies have examined the relationship between rainfall intensity and social responses (Ruin et al., 2014; Papagiannaki et al., 2015, 2017). Nowadays the peak rainfall intensity is widely used to determine the critical rainfall threshold for issuing flash flood warnings (Cannon et al., 2007; Diakakis, 2012; Miao et al., 2016).
The population exposure refers to the spatial domain of population and properties that would be affected by a rainfall hazard (Ruin et al., 2008). A gradual increase in the proportion of the population living in urban areas due to urbanization makes more people exposed and vulnerable to urban flash floods, posing a great challenge to flood risk reduction (Liao et al., 2019). Vulnerability reduction therefore becomes critical in urban disaster mitigation. Vulnerability is usually assessed by comprehensively considering related physical, social, and environmental factors (Kubal et al., 2009; Adelekan, 2011; Zhou et al., 2019) and their dynamic characteristics across space and time (Terti et al., 2015).
Coping capacity reflects the ability of a society to handle adverse disaster conditions, and it is one of the most important things to consider in disaster mitigation (UNISDR, 2015). The coping capacity is usually evaluated by examining the human behaviors in response to disasters, which are mainly collected by post-disaster field investigations and questionnaires (Taylor et al., 2015). Such conventional approaches only provide limited samples that may not be able to fully and timely reflect disaster-induced human behaviors. Recently, researchers have learned the advantages of using unconventional datasets such as insurance claims (Barberia et al., 2014), newspapers (Llasat et al., 2009), and emergency operations and calls (Papagiannaki et al., 2015, 2017) to quantify the coping capacity.
The growing use of smartphones and location-based services (LBSs) in recent years has generated massive geospatial data, which could be used to infer collective geotagged human activities. The geospatial data thus provide a new perspective to study normal urban rhythm in regular days (Ratti et al., 2006; Ma et al., 2019) and abnormal human behaviors in response to emergencies (Goodchild and Glennon, 2010; Wang and Taylor, 2014; Kryvasheyeu et al., 2016). Bagrow et al. (2011) found that the number of phone calls spiked during earthquakes, blackouts, and storm emergencies. Dobra et al. (2015) explored the spatiotemporal variations in the anomaly patterns caused by different emergencies. Gundogdu et al. (2016) reported that it is possible to identify the anomalies inflicted by emergencies or non-emergency events from mobile phone data using a stochastic method. In addition to the aforementioned applications, more studies are needed to explore the full potential of the mobile phone data in terms of revealing human collective behaviors, particularly in response to hazards and emergencies.
This study explored the urban anomalies and their variations in response to rainstorms using the number of location requests (NLR) from smartphone users. We selected eight representative cities in mainland China to examine how urban residents response to typical summer rainstorms in different regions. The anomalies of LBS requests caused by rainstorms were identified using a time series decomposition method and then described by multiple indices, which are used to study how rainstorms collectively affect geotagged human behavior. The rest of the paper is organized as follows. Section 2 introduces the selected cities and the smartphone NLR dataset. Section 3 presents the anomaly detection and description methods. Section 4 provides the analysis results including rainfall statistics, normal rhythms, and rainstorm-triggered anomalies in the selected cities. Section 5 concludes the study and discusses future work.
2.1 Study area
We selected eight representative cities across mainland China for this study (Fig. 1). Two cities were selected from each region except northwestern and southwestern China (Table 1). The eight cities vary significantly with respect to their total population, footprint areas, and urbanization rate. In this study, the footprint of a city is composed of the grids that have an hourly number of location requests no less than the median of the daily NLR time series of that grid over the whole month, i.e., the grids with at least one NLR every hour on average.
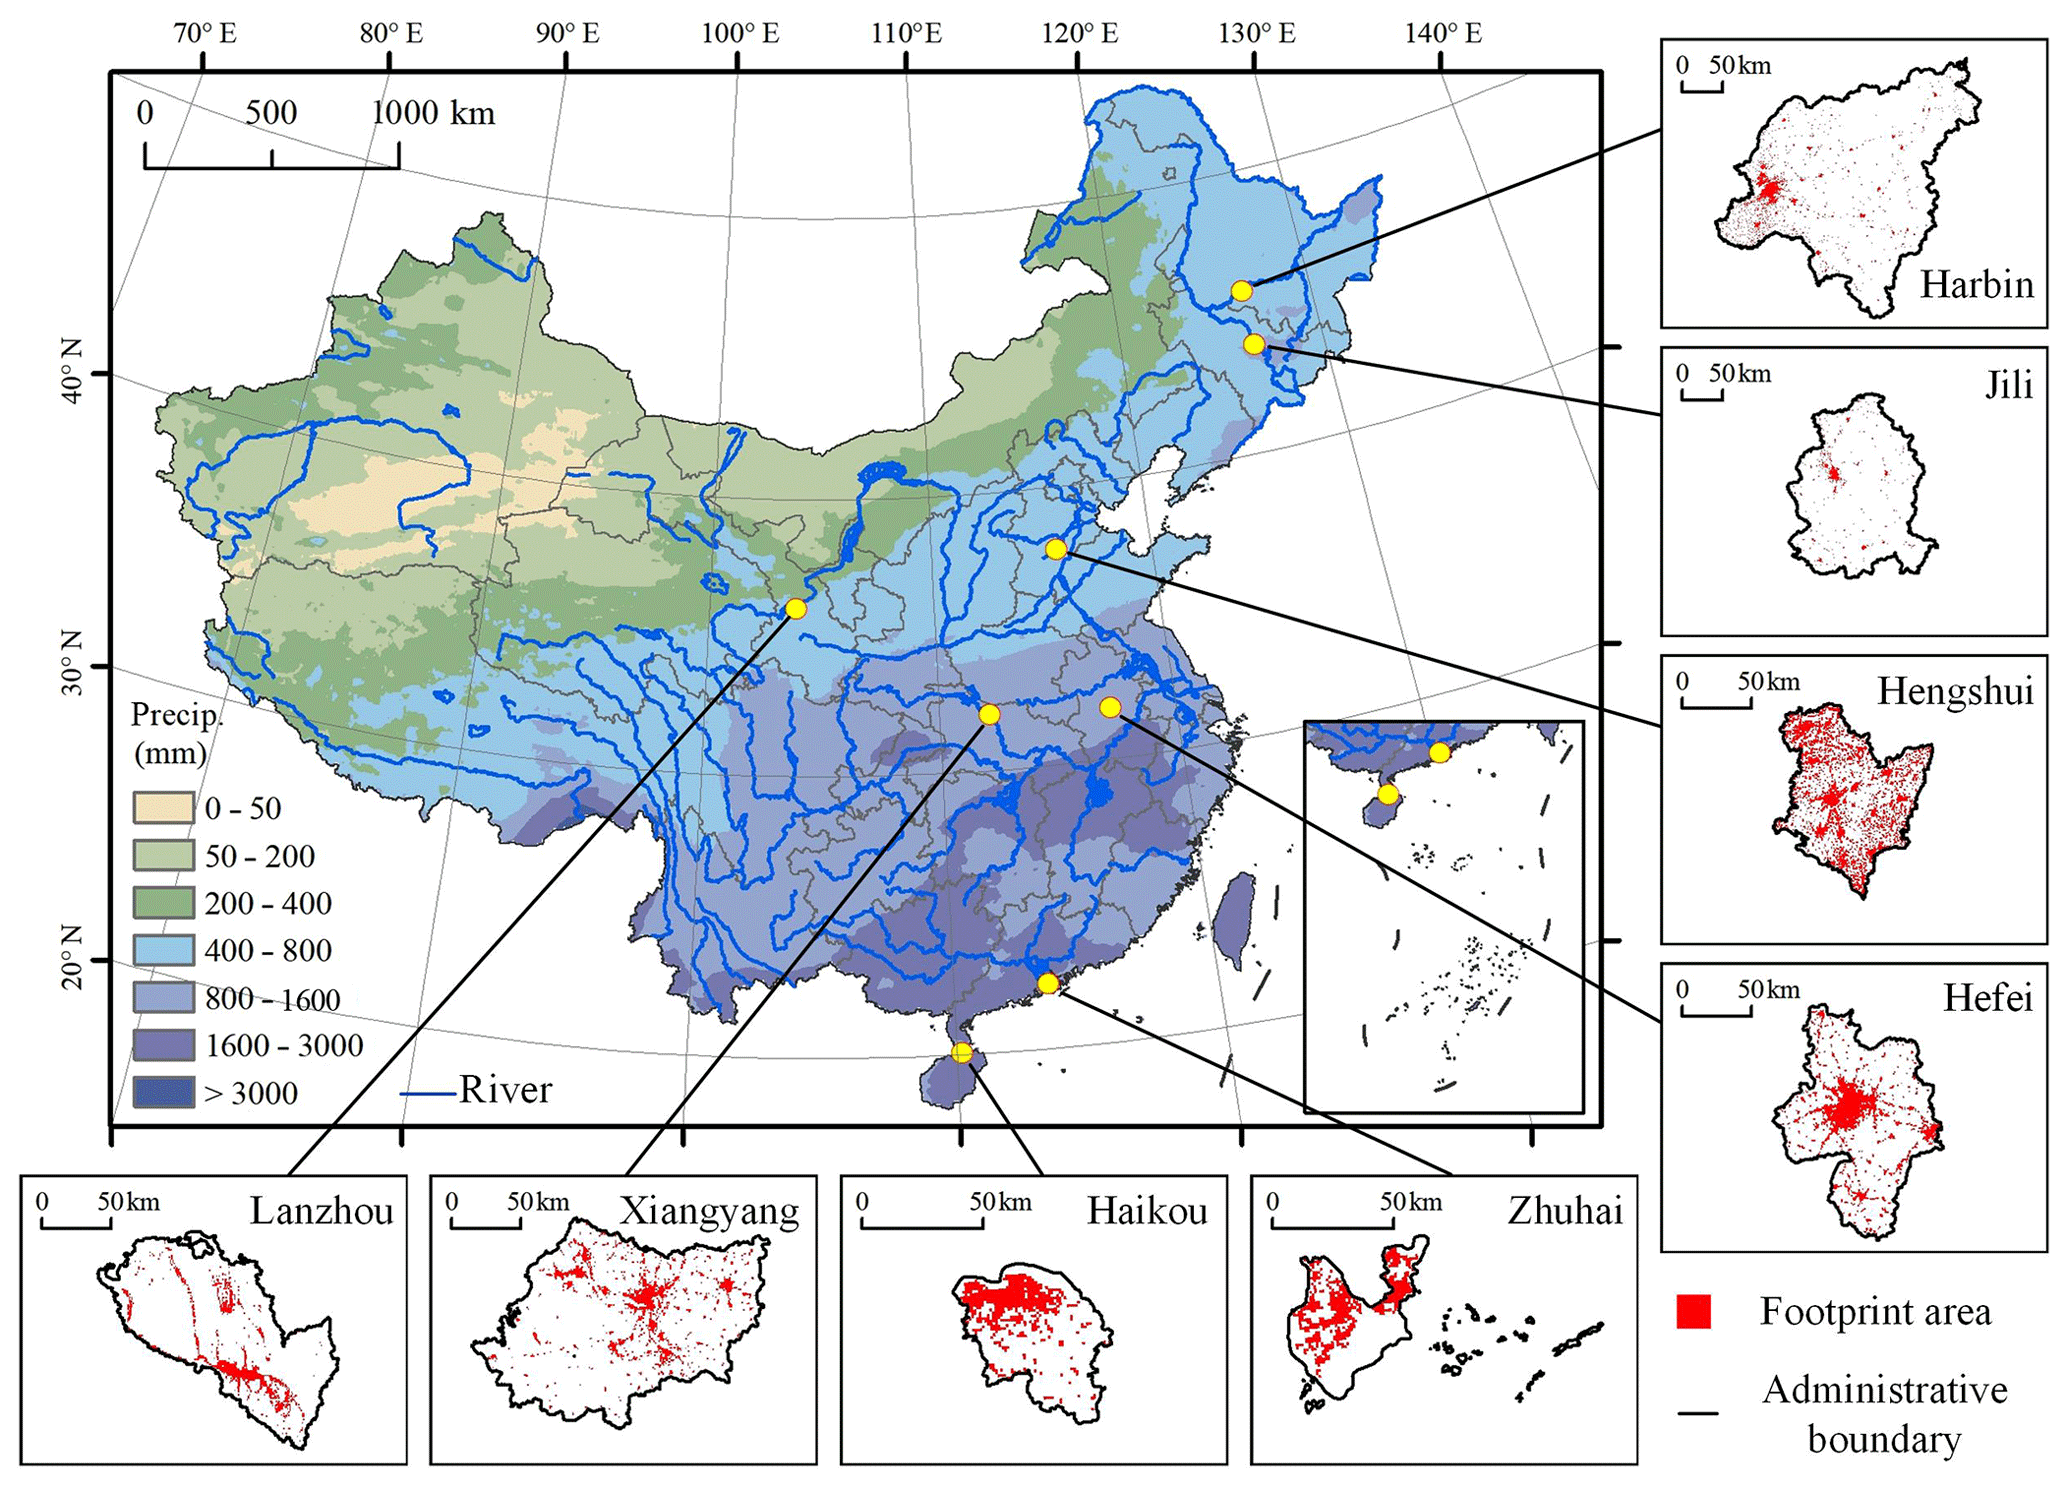
Figure 1A map showing the geographic locations, annual precipitation, and footprints of the eight cities in this study.
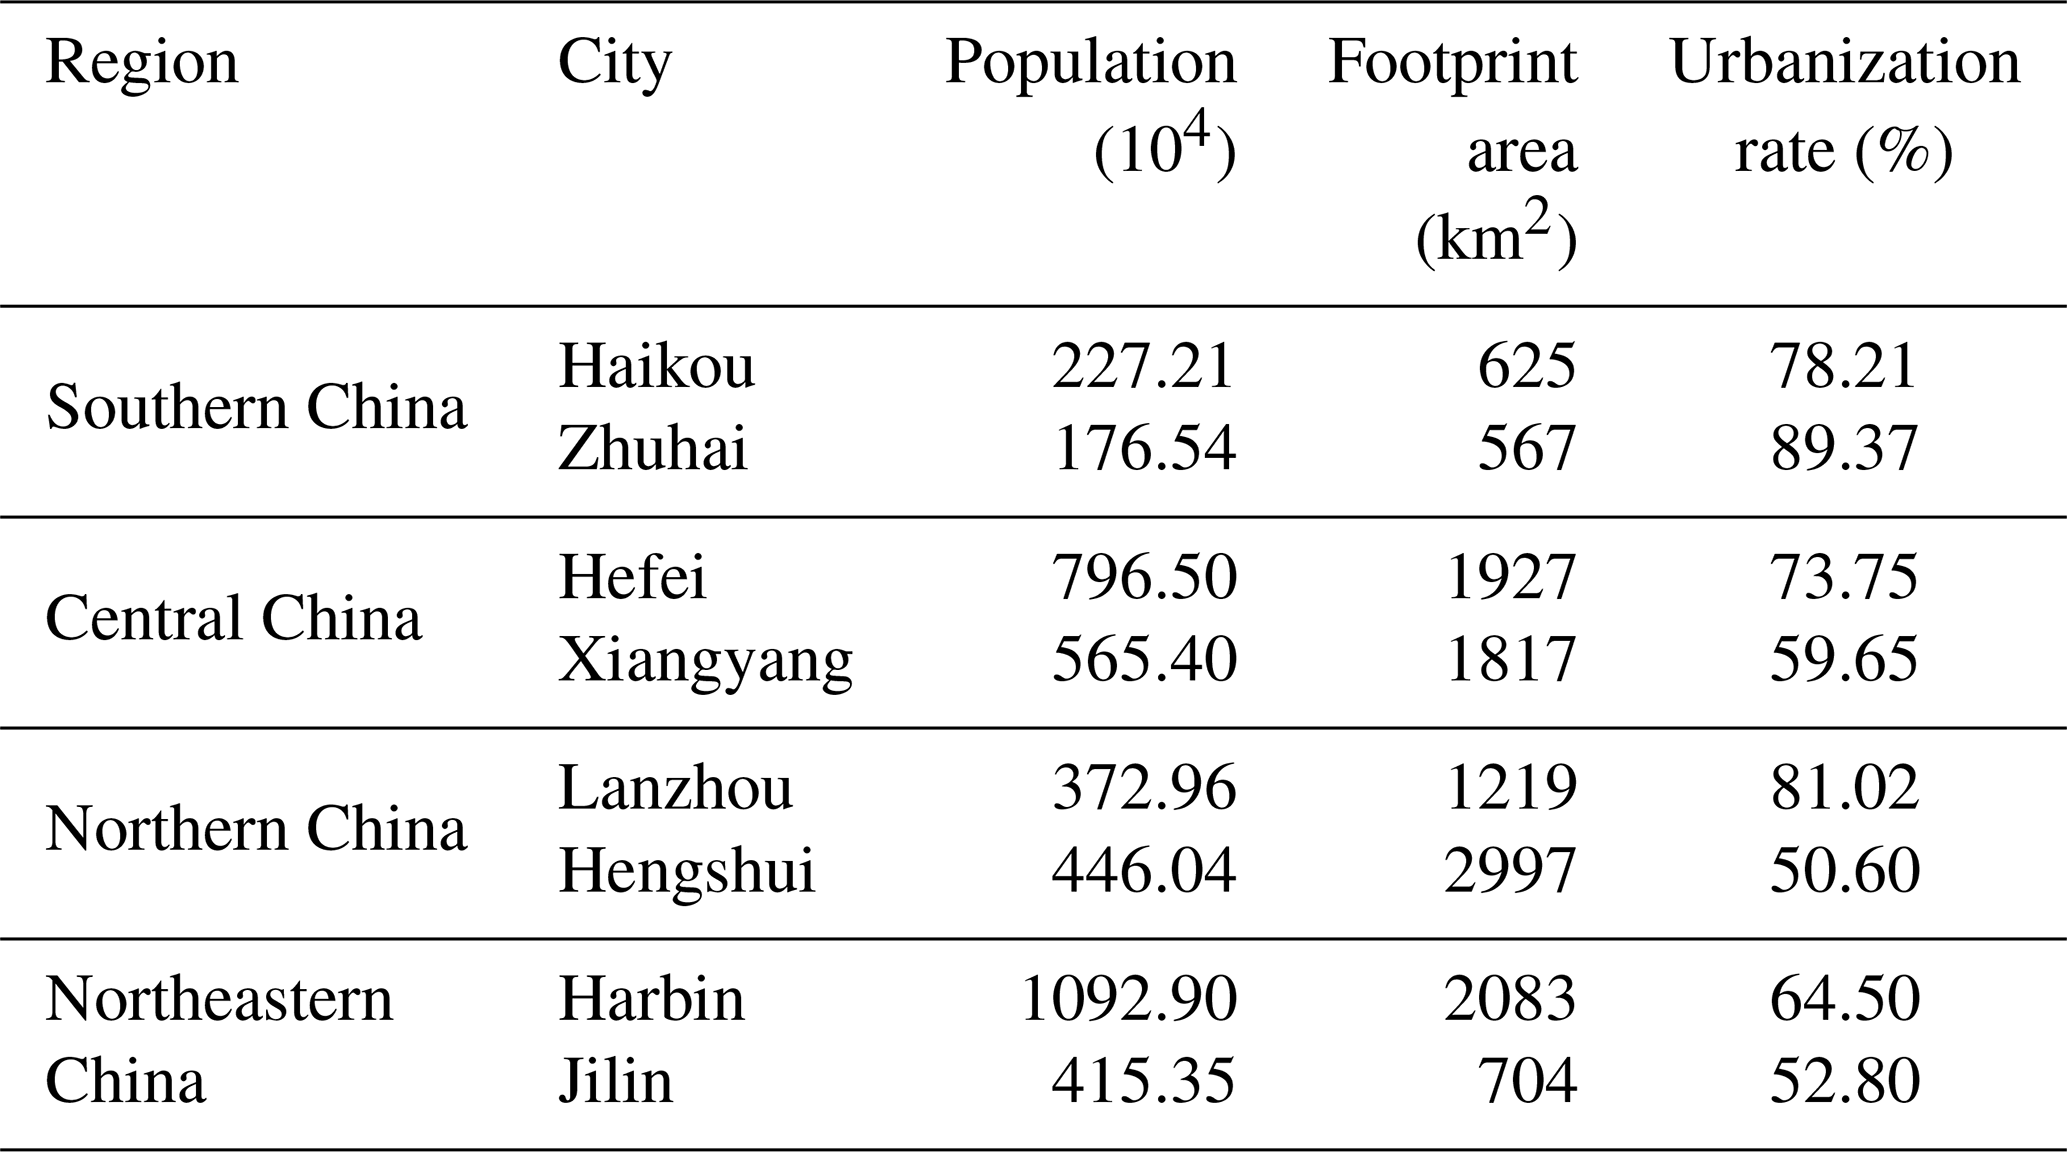
Haikou and Zhuhai are located in southern China, which has mean annual precipitation between 1600 and 3000 mm. Among the eight cities, Zhuhai is the least-populated city, but it has the highest urbanization rate. In central China, we selected Hefei and Xiangyang, which have mean annual precipitation between 800 and 1600 mm. Two cities, Lanzhou and Hengshui, were selected from a semi-humid region in northern China with a mean annual precipitation between 400 and 800 mm. Hengshui has the largest footprint area but the lowest urbanization rate among the cities. Harbin and Jilin are located in northeastern China. The mean annual precipitation of Harbin and Jilin ranges from 400 to 800 mm and between 800 and 1600 mm, respectively. Harbin is the most populated among the eight cities.
2.2 Data collection
The smartphone location data were obtained from the Tencent big data portal (https://heat.qq.com/, last access: 2 April 2019). The portal provides location request records of global smartphone users via the Tencent Maps application programming interface (API). A location request record is generated when a smartphone user requests any LBS, which includes but is not limited to navigation, car hailing, food and merchandise delivery, or social media check-ins. Table 2 lists the popular LBS applications that collect users' location requests. These apps are developed for various purposes, including social communication, entertainment video watching, mobile web browsing, e-commerce trading and shopping, mobile game playing, traveling and transportation, and so on. Every application has a large group of active users who request LBSs using a large number of monthly unique devices across China.
Table 2Common smartphone applications using location-based services.
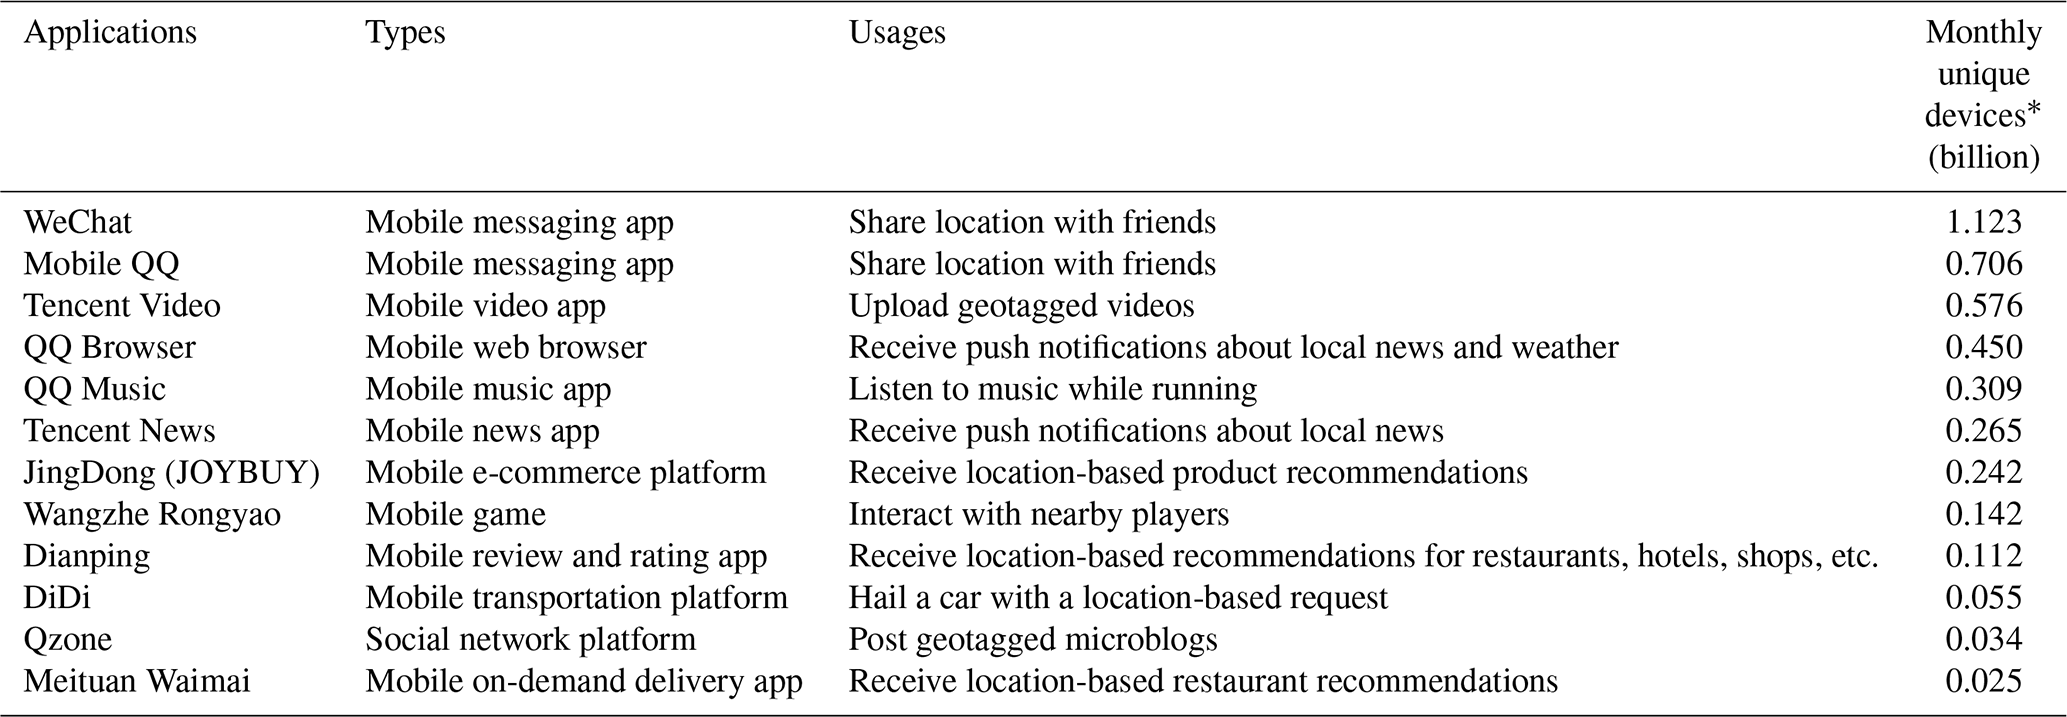
* The monthly unique devices denote the total number of unique devices that have used the application over a month. The data were collected by the iResearch company in July 2019 (available at https://index.iresearch.com.cn/app, last access: 26 August 2019).
The Tencent big data portal releases the number of location requests per a ∘ regular grid for every 4–5 min. Compared with other Chinese social media platforms, Tencent is the most popular one with the largest social community, which is reported to have nearly 1.1 billion monthly active users as of 2018 (https://www.tencent.com/en-us/company.html, last access: 26 August 2019). Ma (2019) compared the NLR dataset with visitor numbers in a few places and confirmed that the NLR data are a good proxy for investigating dynamic population changes. We collected the NLR data of the grids within the administrative boundaries of the eight cities from 1 to 31 August 2017.
This study used the Version 05B Global Precipitation Measurement (GPM) Integrated Multi-satellitE Retrievals for GPM (IMERG) 30 min precipitation dataset (Huffman et al., 2019), which has a spatial resolution of ∘. This dataset has been evaluated and widely used (Wang et al., 2017; Zhao et al., 2018; Su et al., 2018). The news reports about the flooding events in the eight cities were mainly collected from the Chinese mainstream online media, including Xinhuanet, Ecns.cn, Sohu, etc.
3.1 Time series anomaly detection
The smartphone location request record can be represented by a series of spatial points as follows: {(xi, yi, , i=1, 2, …, n. Each point contains its geographic coordinates (x, y) and a time (T) when the LBS is requested. The NLR was then aggregated to time series per grid or per city as illustrated below.
At the city level, a time series hourly NLR was established by adding up all location requests from the grids within the footprint area of that city. The magnitudes of the NLR in different cities vary significantly due to the different numbers of smartphone users. To make the NLR in different cities comparable, we normalized the NLR using the median-interquartile normalization method, which is more robust to anomalies than other common approaches using sample mean and standard deviation (Geller et al., 2003).
We employed the Seasonal Hybrid Extreme Studentized Deviate (S-H-ESD) method (Vallis et al., 2014) to detect anomalies from the time series NLR, which can be represented by the following additive model:
where T, S, and R denote the trend, seasonality, and residual components in the time series data, respectively. The S-H-ESD method assumes that the trend and the seasonality would not be significantly disrupted by rapidly evolving events that last for only a few hours. Two major steps are involved in the method. First, it uses the piecewise median method to fit and remove the long-term trend and then the seasonal and trend decomposition using locally estimated scatterplot smoothing (STL) to remove seasonality (Cleveland et al., 1990). Using the STL to remove the long-term trend would introduce artificial anomalies (Vallis et al., 2014). In this study, the underlying trend in the time series NLR is approached using a piecewise combination of the biweekly medians, which show little changes over the whole time series.
In the second step, the S-H-ESD method employs the Generalized Extreme Studentized Deviate (GESD) statistic (Rosner, 1975) to identify significant anomalies in the residuals. The GESD calculates the statistic (G) based on the mean () and the standard deviation (s) of the observations.
Given the upper bound of u suspected anomalies, the GESD performs u separate tests. In each test, the GESD re-computes the statistic G after removing the observation rj that maximizes and then compares G with the critical value λ as defined below.
where k denotes the number of the observations in the time series after eliminating a suspected anomaly in the last run, and tp,d represents the pth percentile of a t distribution with a d degree of freedom. In this study, we set the significance level a to 0.05 and the number of anomalies to no more than 25 % of the total observations. Each test identifies one anomaly in the residuals when G>λ. The identified anomaly is either a positive or negative, depending upon whether the residual is greater or smaller than 0, respectively.
3.2 Anomaly measures and scores
In this study, an individual anomaly is represented with a vector,
where x and y denote the coordinates of the grid centroid, t denotes the observation time, and “obs” and “res” denote the observation and the residual (R in Eq. 1) in the time series. This study uses an anomaly's absolute residual to describe its unusual deviation from its expectation.
A rainstorm disaster, once it significantly impacts the cities, usually can trigger an outbreak of NLR anomalies in multiple places across the city. To collectively characterize the abnormal human responses, this study defines three indices: the total number (Nt), the total residual (Rt), and the mean density (Dt) of the positive or negative anomalies. The mean density is defined as follows:
where Bi denotes the number of neighborhood anomalies within a Manhattan distance of a five grid (∼5 km) radius of the ith anomaly. The radius is large enough to cover most urban facilities nearby the anomaly.
An anomaly score is then defined based on the aforementioned indices to evaluate the city residents' responses to a rainstorm event. First, we surveyed the hourly changes of the indices and calculated the quartiles (Q1–Q3) and interquartile range (IQR) of each index for every hour every day. The score of an index is defined by
where Vt represents one of the three indices at time t. According to Tukey's fences (Tukey, 1977), the score is considered an outlier if its absolute value is greater than 1.5 or an extreme if it is greater than 3. The final anomaly score is the mean of the three index scores.
3.3 Characterization of a rainfall event
In this study, we examined city residents' responses to the rainfall events in August 2017. The national average precipitation of this month is 124.6 mm, which is the highest in 2017 and 21.3 % more than the average precipitation for August in previous years.
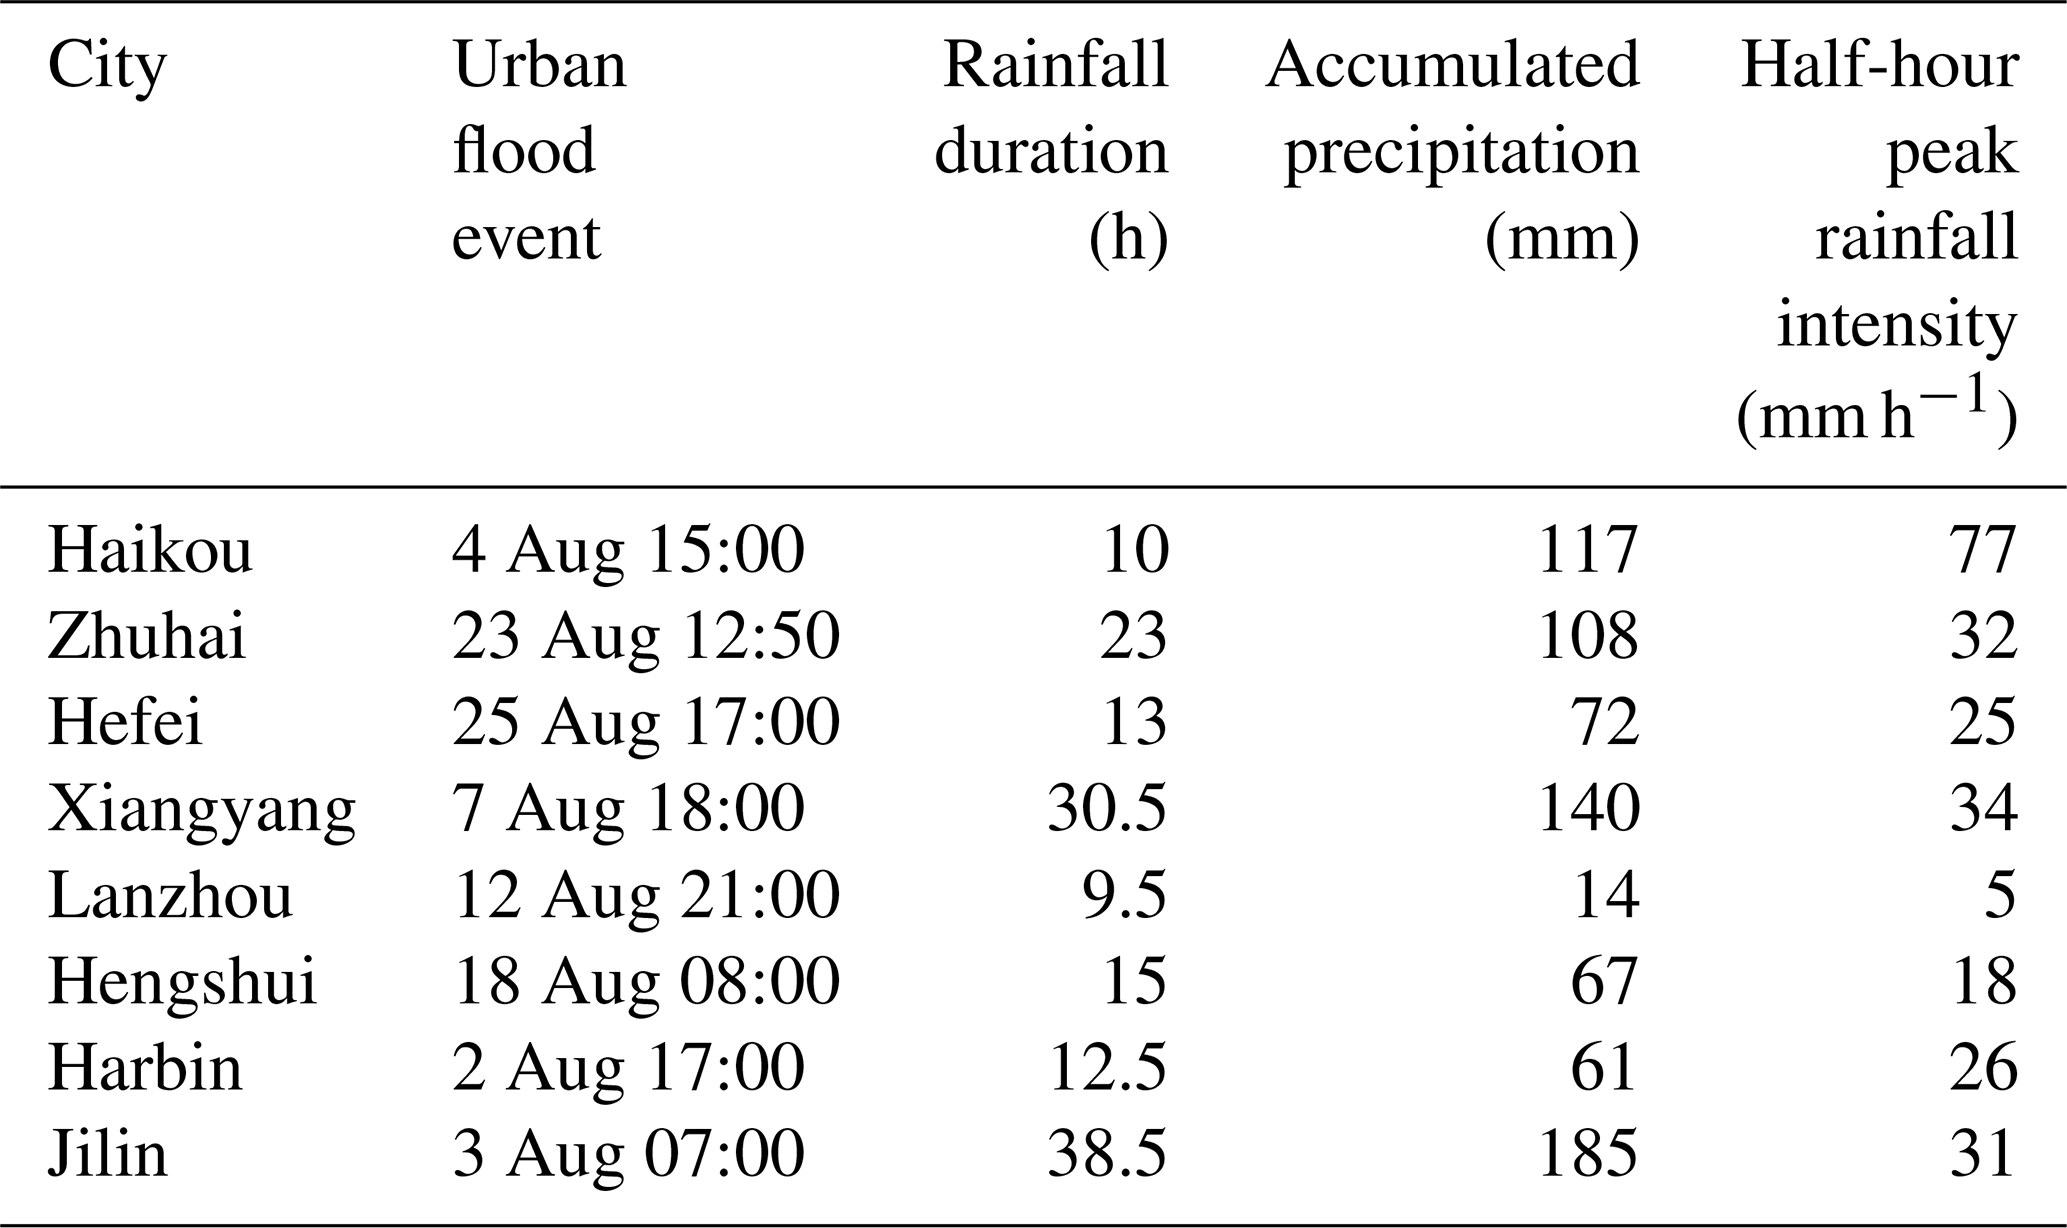
We defined a rainfall event as a precipitation process that lasts for at least 2 h and with no rain preceding it for at least 1 h. The severity of a rainfall event is described by its duration, accumulated precipitation, and peak rainfall intensity. The duration refers to how long a rainfall event lasts, and the accumulated precipitation is the total precipitation received during a rainfall event. The peak rainfall intensity (Id) is widely used to estimate the possible rainfall intensity threshold that triggers city flooding (Cannon et al., 2007; Diakakis, 2012) and is defined as below.
where Pi denotes the precipitation during the ith time interval, N denotes the total number of the time intervals in a rainfall time series, and d denotes the width of the moving time window that was used to search for the maximum accumulated precipitation in a rainfall event. Based on the peak rainfall intensity, the August rainfall events in the eight cities can be categorized as a moderate rainstorm (0.5 mm h mm h−1), a heavy rainstorm (4 mm h mm h−1), or a violent rainstorm (I1≥8 mm h−1).
For the purpose of calculation, we downscaled the precipitation data to the same spatial resolution as that of the NLR using the nearest-neighbor interpolation method. At the city level, the rainfall of a city is defined as the total of the half-hour Tropical Rainfall Measuring Mission (TRMM) precipitation within the human footprint. At the grid level, the rainfall of each grid refers to the total precipitation received by that grid within a certain time period.
4.1 Rainfall characteristics and peak rainfall intensity thresholds
The eight cities could be categorized into two groups in terms of the total precipitation amount in August 2017 (Fig. 2a). The first group includes Haikou, Zhuhai, and Hefei, with total precipitation more than 400 mm. The summer monsoon brings plenty of water to the two coastal cities (i.e., Haikou and Zhuhai). Typhoon Hato, when it made landfall on 23 August, dumped an additional 68 and 108 mm of water on Haikou and Zhuhai, respectively. By contrast, the inland city Hefei, received 47.6 % more precipitation in 2017 than the average mainly due to a few unusual rainstorms in August 2017 (Hydrology and Water Resource Bureau of Hefei, 2018).
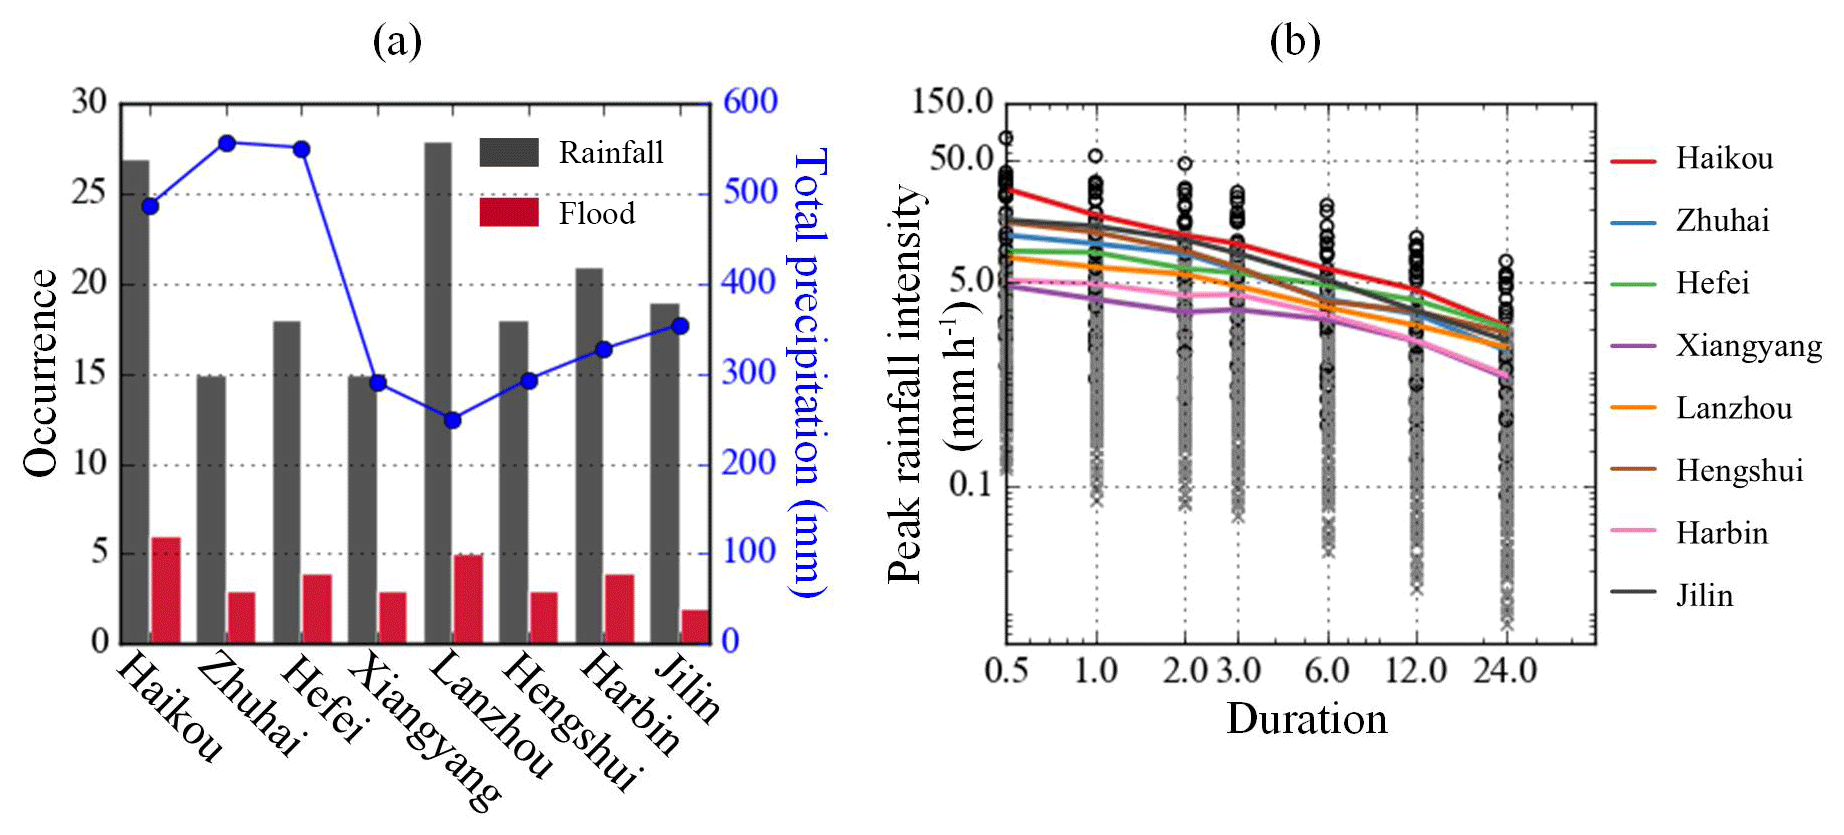
Figure 2Total precipitation and the frequency of rainfall and city flooding events in August (a). Variations in peak rainfall intensity (circles) and the flood-triggering precipitation threshold values (lines) are derived from time windows ranging from 0.5 to 24 h (b).
The second group includes all the other cities, which had less than 400 mm of precipitation in August 2017. The city Lanzhou is located in the northwestern China and had the least precipitation at 250 mm. The two inland cities, Xiangyang and Hengshui, both had slightly more precipitation at 300 mm. The precipitation of the two northeastern cities, Harbin and Jilin, ranged between 320 and 350 mm and was mainly brought in by the northwestern vortexes.
There were at least 15 rainstorms and 2 flooding events in each city. The cities of Haikou, Lanzhou, and Harbin witnessed more than 20 rainstorms and about a quarter of them caused serious flooding problems. The number of rainstorms in the other cities ranged from 15 to 20, and about 2 to 4 of them caused flooding problems in the cities.
We identified the peak rainfall intensity threshold value that likely triggers city flooding using the method developed by Cannon et al. (2007) and Diakakis (2012). The method plots peak the rainfall intensity of different time windows against the corresponding rainfall duration. The flood-triggering threshold is defined as the upper limit of the peak rainfall intensity that tends to lead to urban flooding but actually does not. As shown in Fig. 2b, for the rainfall thresholds calculated based on 0.5, 1, 2, and 3 h time windows, the city ranking shows no change with an order of Haikou, Jilin, Hengshui, Zhuhai, Hefei, Lanzhou, Harbin, and Xiangyang. The ranking shows some fluctuations when the flooding-triggering rainfall threshold values were calculated with a time window of more than 3 h. However, Haikou and Harbin are always the top two cities, whereas Xiangyang is the last one on the ranking list. It is worthy to note that a rainstorm with a peak rainfall intensity over the threshold of 5 mm h−1 would definitely trigger floods in Xiangyang. However, in Haikou, such a threshold value is 30 mm h−1. In other words, city flooding would occur in Haikou when it is hit by a rainstorm with a peak rainfall intensity over 30 mm h−1. In general, the difference between the threshold values among these cities reduces with a longer time window, indicating that the rainfall in a shorter time window is more critical to evaluate whether a city is prone to flooding.
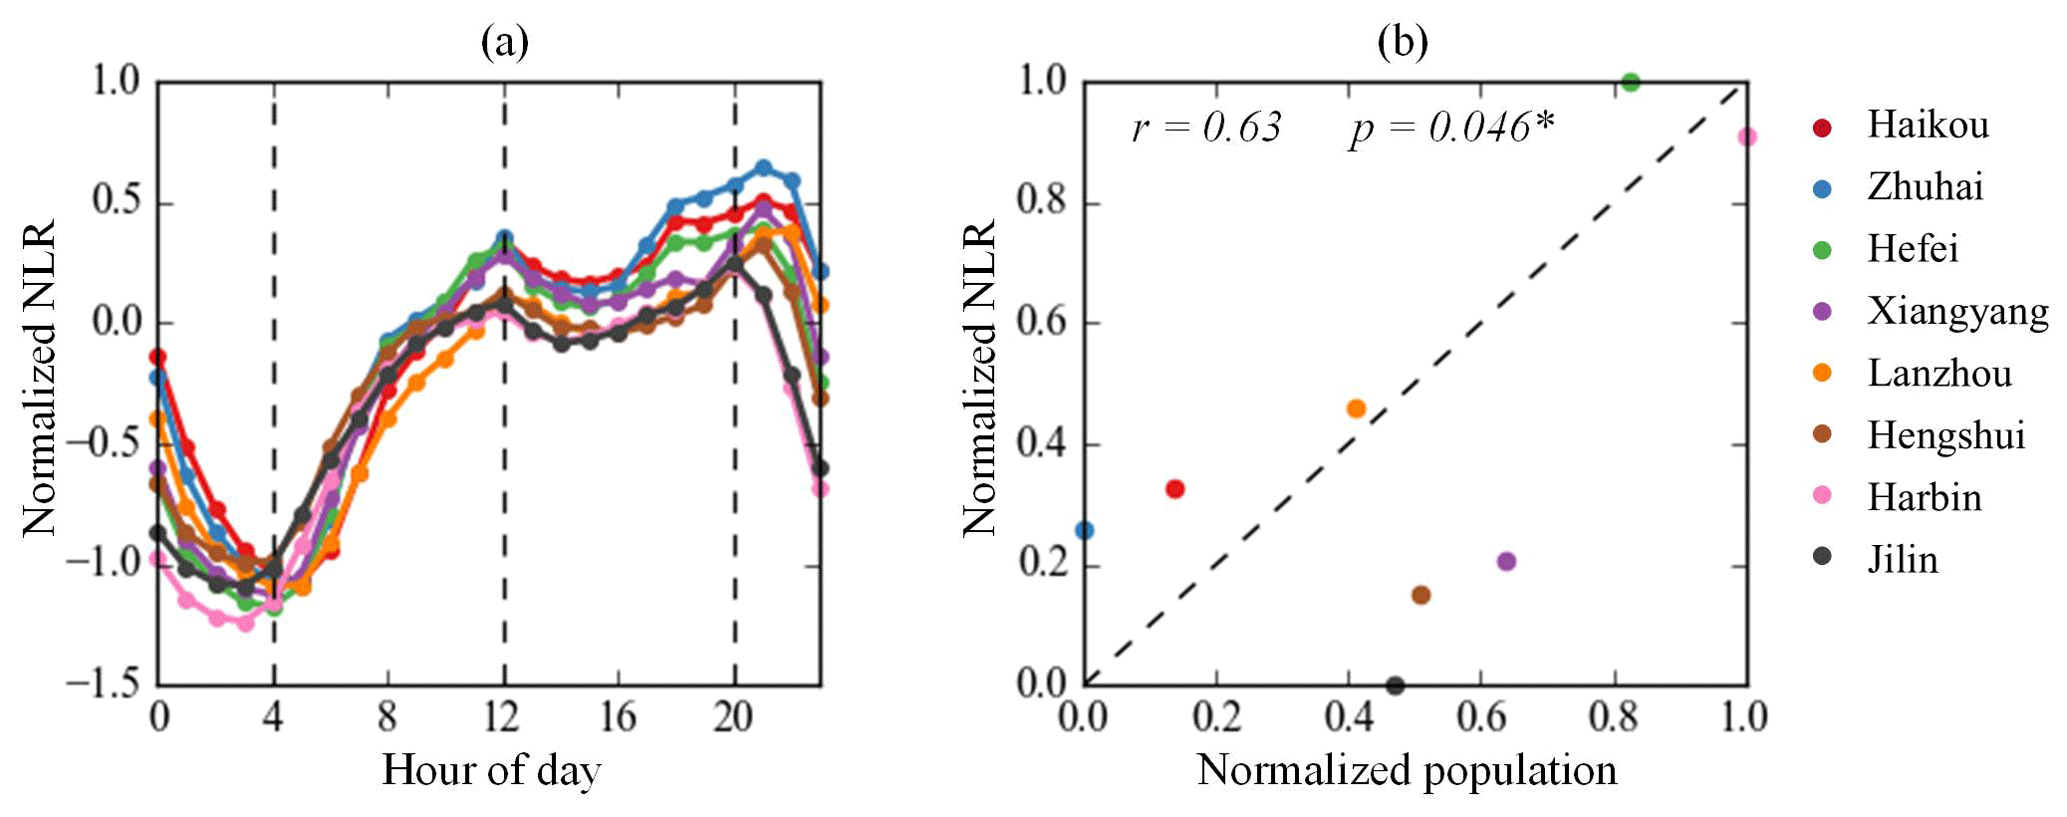
Figure 3The diurnal variation patterns of the NLR in the eight cities (a). A positive correlation between the NLR and the total number of residents (b).
4.2 Normal rhythm of the city
The NLR records can serve as a proxy of the city residents' normal daily routine. The normalized NLR shows that the eight cities have a similar diurnal rhythm (Fig. 3a). The normalized NLR median climbs from a minimum at around 04:00 LT to a peak right at 12:00 LT. It starts to drop slightly and then peaks again at around 20:00 LT. This general pattern reflects the smartphone usage patterns of the city residents. Phone usage starts to drop after midnight when most residents start to rest. It reaches its first peak during lunchtime as residents may request more LBS to find a place to eat. After lunchtime, phone usage remains at a high plateau, probably due to more LBS requests for business purposes. Phone usage reaches the highest peak of the whole day right after normal work hours, indicating a significantly increased need for LBSs such as hailing nearby taxis to socialize with friends or go back home or sending geotagged posts for socializing.
The general diurnal pattern was superposed with subtle short-term NLR variations. The NLR in the southern cities peaks later at night and hits the bottom before dawn, which is different than in northern cities. This is very likely due to the different lifestyles between the northern and southern residents in response to economic activities and day length. It is well-known that southern China is more active in economic and social activities, and the southerners enjoy night activities more (Ma et al., 2019). By contrast, the northerners tend to end their nightlife earlier and also become active earlier, as the day breaks earlier in the north.
The total NLR is moderately correlated with the population of these cities (Fig. 3b). The 0.63 Pearson correlation coefficient (with a p value of 0.046) indicates a statistically significant positive relationship between the normalized NLR and the population. As a result, we believe the NLR data could reflect the collective geotagged behaviors of the city residents as a whole, and consequently it could serve as a proxy for human responses to different environmental and social events.
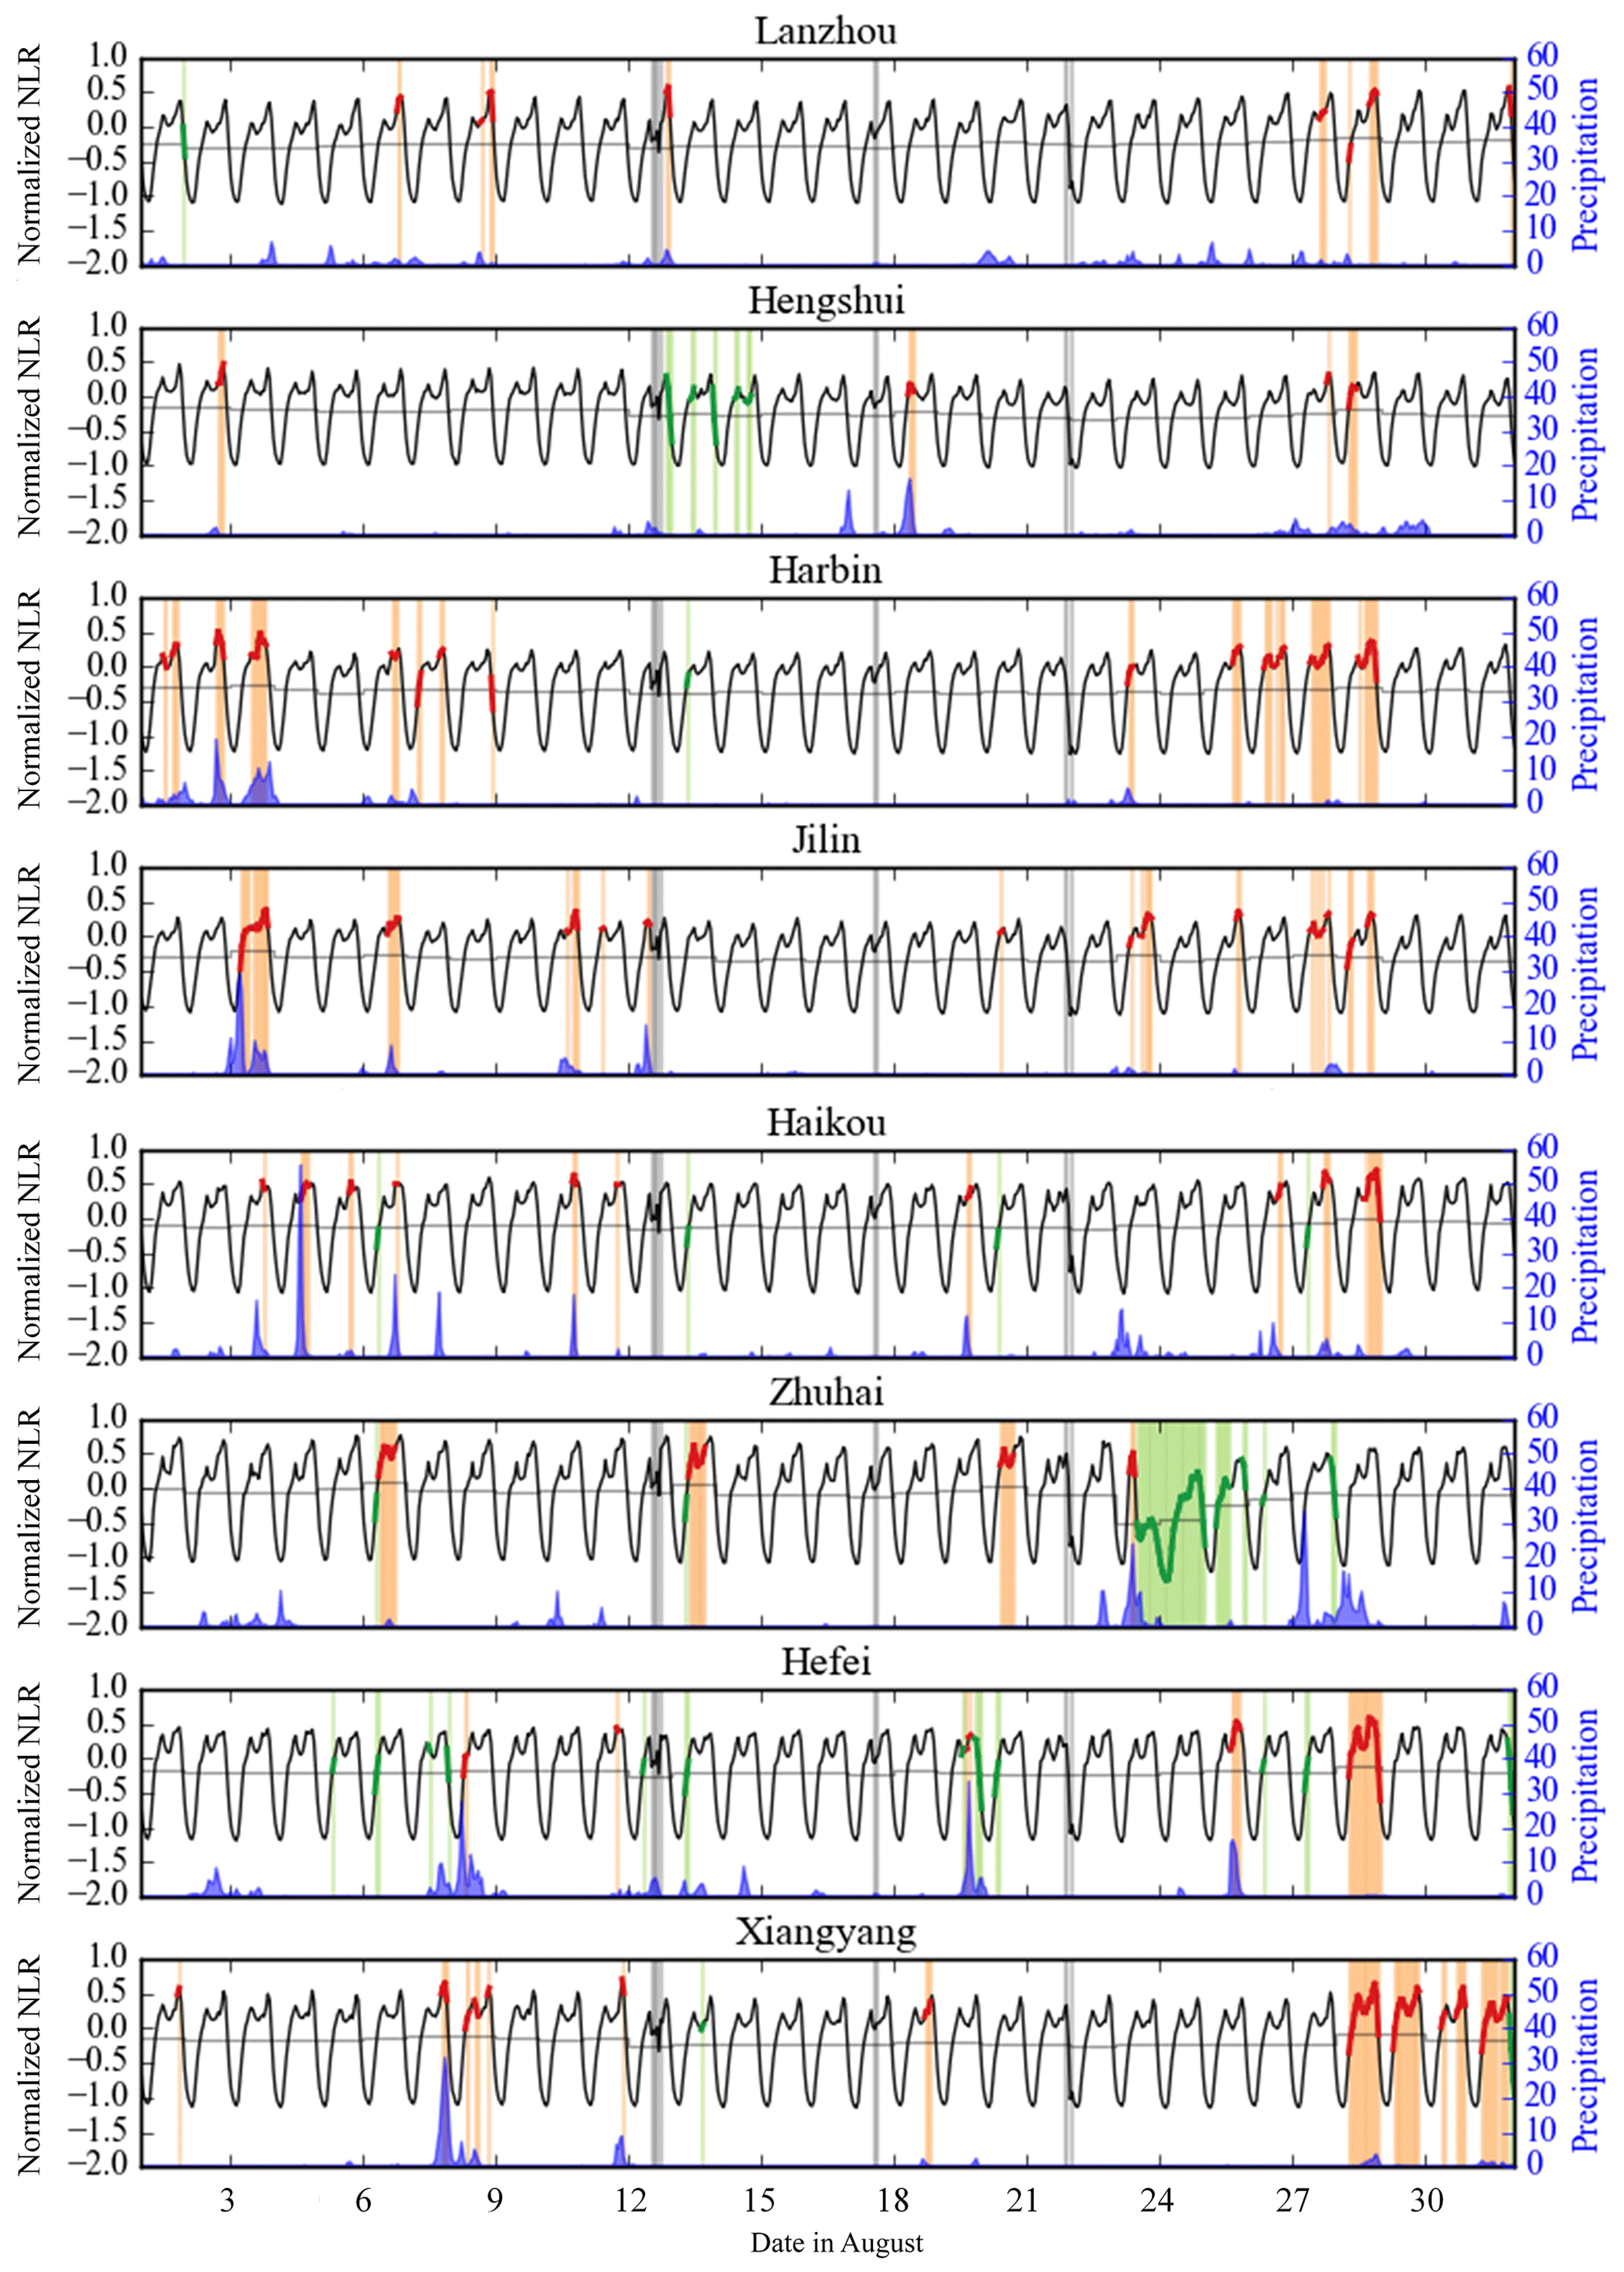
Figure 4The time series NLR and rain events during August 2017. Positive and negative anomalies are shown in orange and green, respectively. The light gray columns show the periods when NLR data are missing.
4.3 Urban anomalies during rainstorms
4.3.1 City-scale analysis
There are more positive than negative anomalies in the August time series hourly NLR, and most positive anomalies were found in a pair with precipitation spikes (Fig. 4). For example, two significant precipitation spikes in Harbin in the afternoon of 2 and 3 August were closely associated with positive NLR anomalies. Few NLR negative anomalies were identified in the eight cities except Zhuhai. This city was significantly affected by Typhoon Hato, which brought a huge amount of precipitation and led to a negative anomaly beginning the afternoon of 23 August in Zhuhai. Such a significant negative anomaly could be attributed to a serious communication interruption or damages caused by the typhoon.
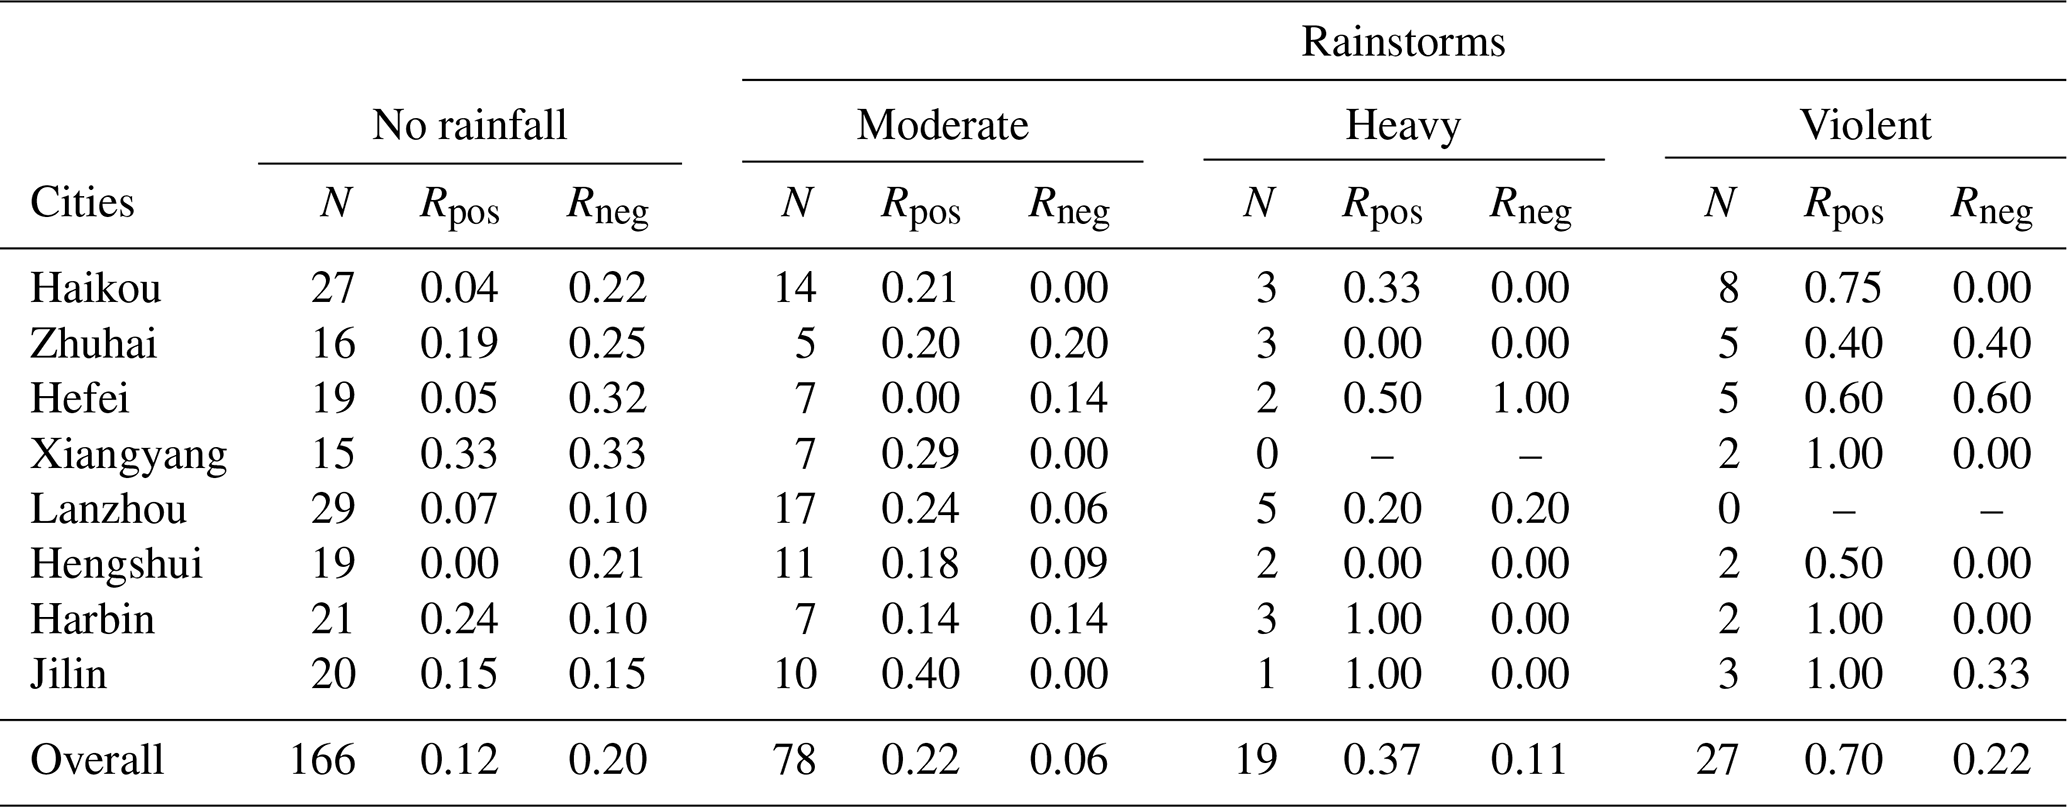
Table 3A number of different categories regarding rainstorms and their corresponding Rpos and Rneg values.
It is noteworthy that both positive and negative anomalies were also identified when there was no rain in the cities. For example, two positive anomalies were identified around 28 August in Harbin when there was no rain at all. The no-rain anomalies must have been triggered by other major events in the cities. However, at this moment it is not easy to trace what local events may trigger such anomalies.
It is very interesting to note that a couple of no-rain positive anomalies were identified in the last week of August for all of the eight selected cities except Zhuhai. These positive anomalies were obviously not associated with any special rainstorm events. Instead, they are more likely to be associated with some sort of nation-wide event, such as college students' back-to-school and move-in events, which are mainly scheduled in the last week of August every year in China. Such positive anomalies were not found in Zhuhai, where the 2017 back-to-school and move-in events were postponed to the first week of October due to the significant damage caused by Typhoon Hato. However, further studies, such as those of the NLR of other cities in China, are needed to consolidate this argument.
We further quantitatively examined the association between rainfall events and the NLR anomalies. Table 3 lists the Rpos and Rneg, which are the ratios of the positive and negative anomalies corresponding to the four scenarios (no rain, moderate, heavy, and violent rainstorm events) to the total number of anomalies identified over the whole time series, respectively. As shown in Table 3, in total we identified 27, 19, 78, and 166 violent, heavy, moderate, and no rainstorm events in the eight cities, respectively. Under different scenarios, the Rpos is always higher than Rneg except in the no-rain scenario, in which there is no significant difference between these two ratios. The rainstorm-related Rpos increases from 0.22 to 0.70 as the rainstorms level up from moderate to violent as compared to a no-rain Rpos of 0.12. The rain-related or no-rain Rneg is no more than 0.22. The Rpos is much higher than Rneg when the cities are affected by stronger rainfall events. For example, when the cities are affected by violent storms, the Rpos and Rneg are 0.70 and 0.22, respectively. By contrast, the Rpos and Rneg are 0.22 and 0.06, respectively, when the cities are affected by moderate rainstorms. It is very likely that, when there are severe rainstorms, people may send out more LBS requests in order to, for instance, search a route free of inundation spots and less-congested roads, order food for delivery, or post geotagged photos of the terrible moments.
A lower Rpos of the heavy and moderate rainstorms may also be partly attributed to the effect of data aggregation at the city scale. It is very common that a rainstorm may influence only a part of a city and only lead to certain local positive anomalies. In such a case, an increase of the NLR in a small number of grids may not result in significant changes to the NLR of the entire city and consequently no anomalies at the city level. Analysis at the grid level, as reported in the next section, would show how residents respond to local rainstorm events.
The difference between the Rpos and Rneg also varies for different cities. For example, the two violent rainstorms both triggered a positive anomaly in Xiangyang and Harbin. By contrast, the five violent rainstorms in Zhuhai led to the same percentage of positive and negative anomalies. Hefei is special. The same percentage of positive and negative anomalies was triggered by the five violent storms. However, when Hefei was affected by the moderate and heavy rainstorms or even no rainfalls, there were slightly more negative than positive anomalies.
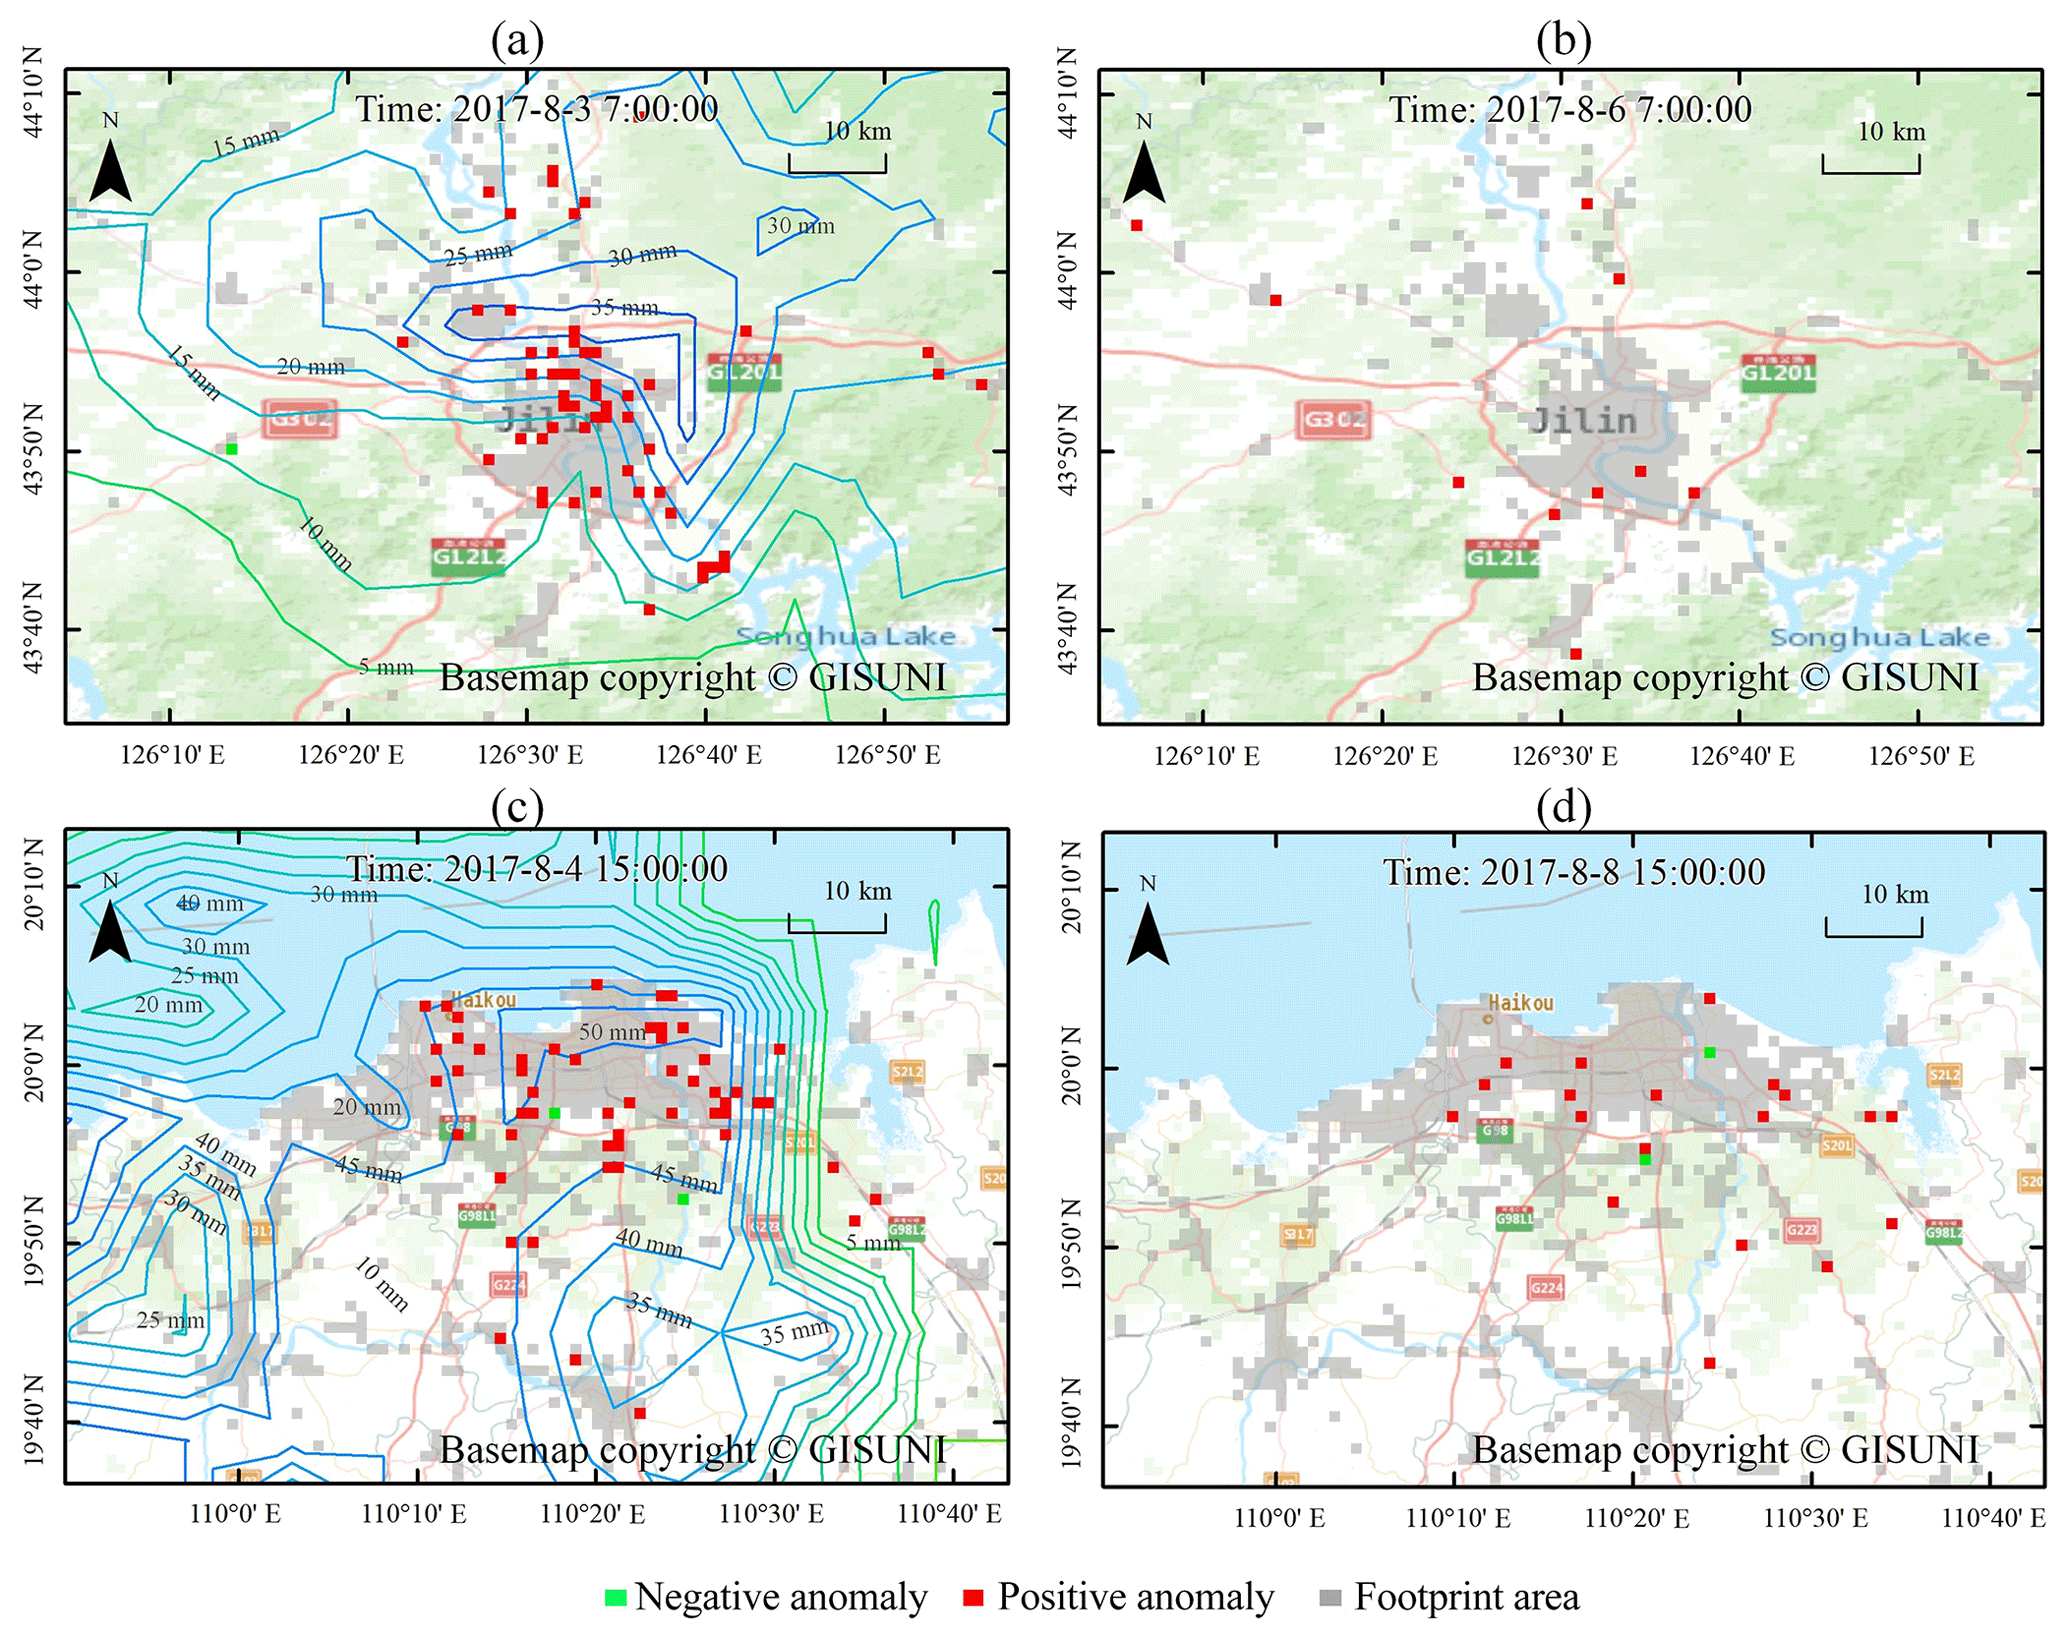
Figure 5Grid with negative and positive anomalies within the footprint areas of Haikou and Jilin. The contour lines show the precipitation.
4.3.2 Grid-scale analysis: anomaly indices
The S-H-ESD method was also used to detect the NLR anomalies at the grid level. There were always more grids showing anomalies when the city was affected by a rainstorm. Figure 5 provides an example to illustrate the grids with an anomaly detected during a rainstorm and the same time period in another day without rainfall in Jilin and Haikou, respectively. Anomalies were identified in 56 grids in Jilin when it was hit by a rainstorm at 07:00 LT on 3 August 2017. By contrast, anomalies were observed in only 10 grids during the same time period on 6 August 2017 when there was no rain at all. In Haikou, anomalies were found in 52 grids during a rainstorm and only 19 grids when there was no rain.
The total number, total residual, and mean density of these anomalies were then calculated (Fig. 6) for the cities if they were affected by flooding caused by a typical rainstorm event (Table 4). The three anomaly indices show diurnal variations similar to the NLR diurnal rhythm, and they all spiked to the level of an outlier or even to an extreme value when the city was significantly affected by flooding issues.

Figure 6Intra-day variations of the NLR, total residuals, mean density, and anomaly score within 24 h of a typical flooding event in each of the cities.
Table 4An exemplary flooding event in each of the cities. All times are given in the local time zone.
After the spikes, the anomaly indices usually bounce back to the same level as before for almost all the cities except Zhuhai, indicating most cities return to their normal rhythms after the rainstorm interruption. However, Zhuhai was hit by the category 3 Typhoon Hato at around 12:50 LT on 23 August. The typhoon brought intense rain and strong winds, and it caused significant flooding issues and damage to the city infrastructure, causing a sharp decline in the NLR data and persistent negative anomalies after the landfall of Hato. It took more than 72 h for the anomaly indices to bounce back to the same level before Hato (not shown in Fig. 6).
4.3.3 Grid-scale analysis: anomaly score and rainfall intensity
Given that the anomaly score is indicative of the unusual responses of residents to rainstorms, we further examined the relationship between the anomaly score and the rainfalls in these cities during August 2017.
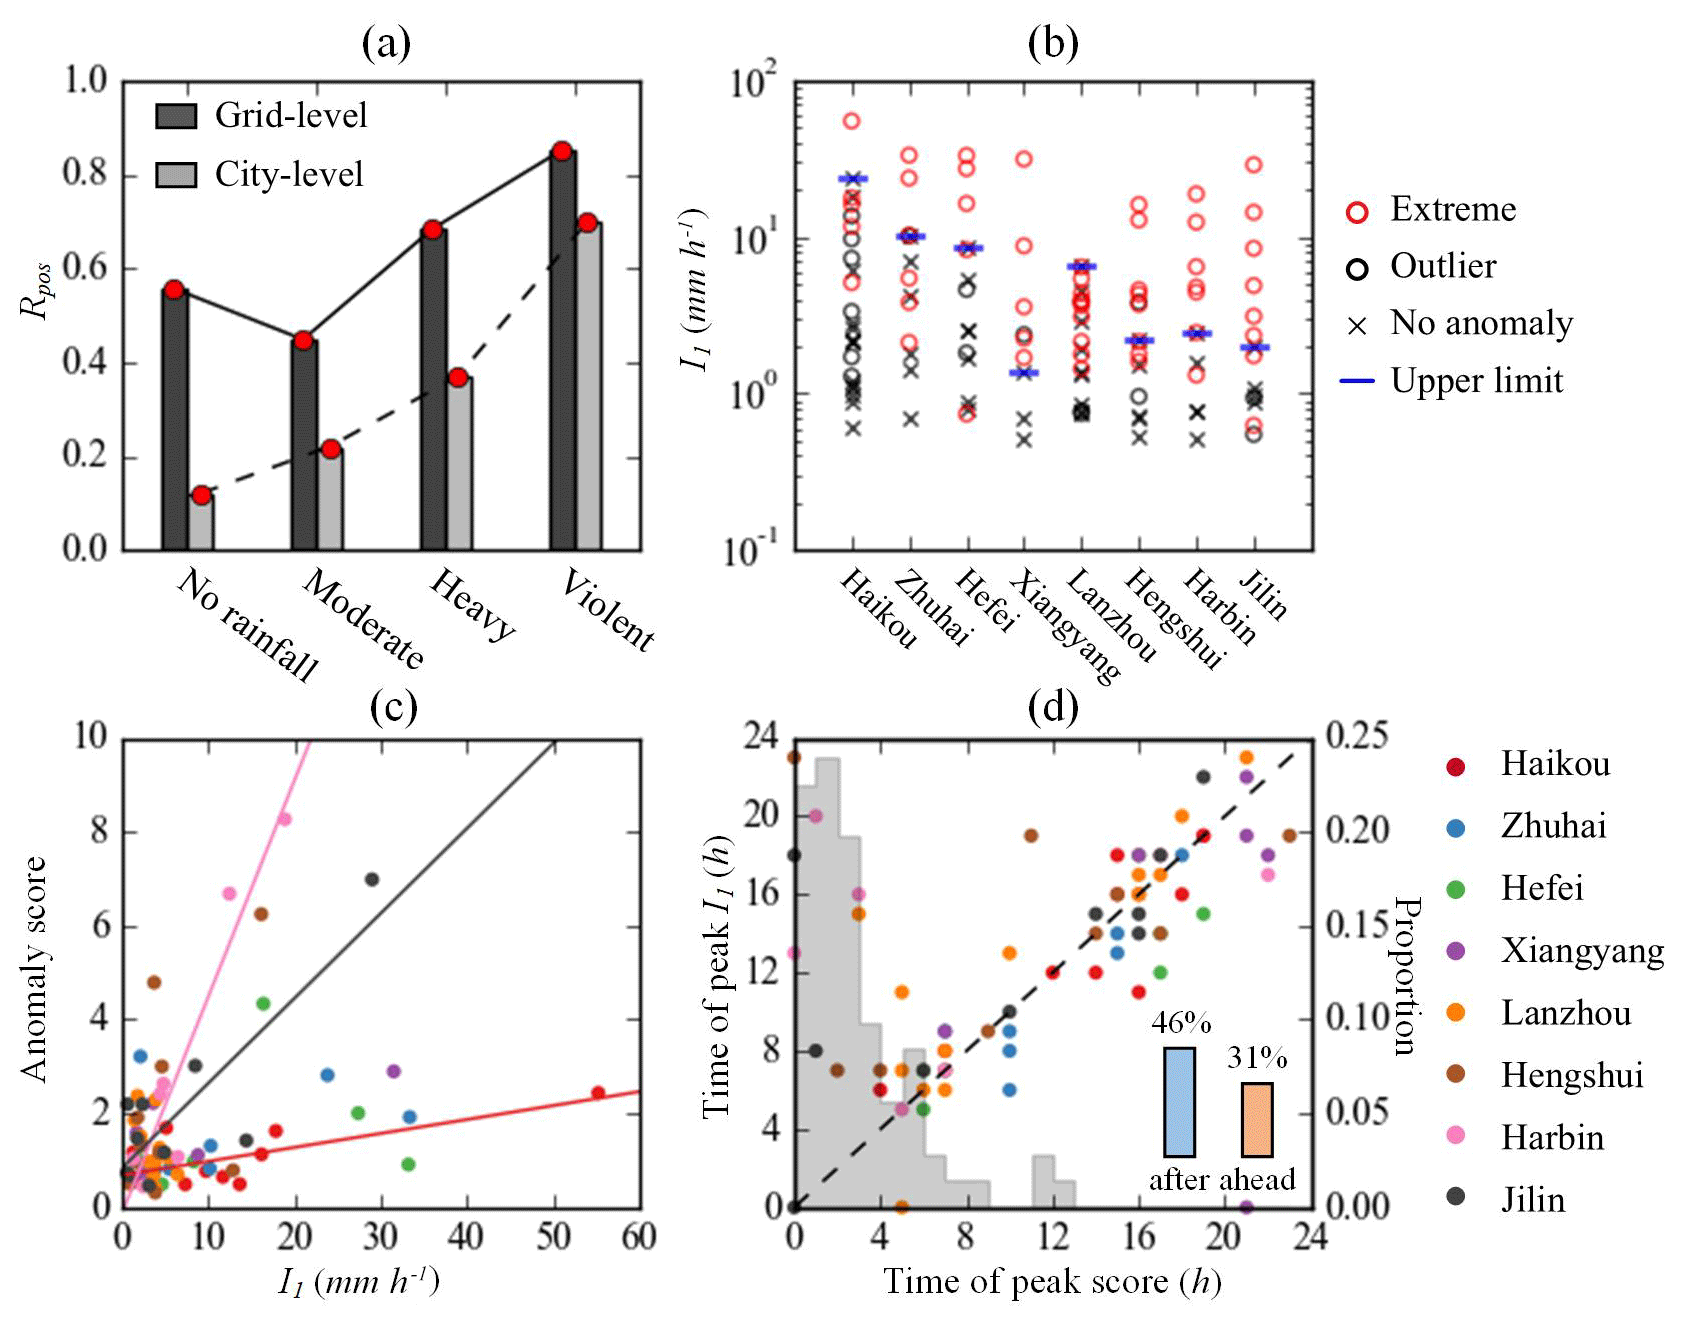
The grid-level Rpos is much higher than its city-level counterpart with respect to all types of events (Fig. 7a). Such a difference is mainly due to the different analysis levels. We can easily identify the local anomalies per grid, which are more likely to be imperceptible at the city level due to data aggregation. At the grid level, the Rpos and Rneg also vary in response to the different levels of rainstorm events. All cities show a higher Rpos when they are affected by violent rainstorms (85 %) compared to heavy rainstorms (68 %). The Rpos values are lower (56 %) when the cities are not affected by any rainfall events. However, the Rpos of moderate rainstorms (45 %) is less than the no-rain Rpos, likely suggesting that low-intensity rainfall events may not necessarily trigger NLR anomalies, and other factors may contribute to the NLR anomalies at the grid level.
How easily the rhythm of a city would be disrupted by a rainstorm is strongly related to the anomaly-triggering peak rainfall intensity threshold (Fig. 7b), which was calculated using the same the ideas in the methods developed by Cannon et al. (2007) and Diakakis (2012). We plotted the peak rainfall intensity with respect to whether there are anomalies or not for each city. The anomaly-triggering peak rainfall intensity is defined as the upper limit of the rainfall intensity that tends to lead to an NLR anomaly but actually does not.
Every rainstorm with its peak intensity higher than the threshold would definitely trigger an NLR anomaly. As a result, the cities with a lower threshold tend to be more easily disrupted by a moderate or heavy rainstorm. For example, Xiangyang has a very low threshold value of 1.4 mm h−1. In August 2017, there are six rainstorm events with peak rainfall intensity exceeding this threshold, and they all caused anomalies in this city.
However, even a rainstorm with its peak rainfall intensity below the threshold may also trigger an NLR anomaly. For example, quite a few NLR anomalies were found in Lanzhou, of which most rainstorms have their peak rainfall intensity below the threshold (6.6 mm h−1). This is because a heavy rainstorm at around 00:00 LT failed to trigger an NLR anomaly as most people were sheltered at home and hence were not affected. However, this rainstorm is included in the process to calculate the peak rainfall intensity and increase the threshold. As a result, rainstorms with their peak rainfall intensity below the threshold may also trigger anomalies, particularly in the cities with more heavy and violent rainstorms late at night and before dawn.
The anomaly score is correlated with rainfall intensity for some cities (Fig. 7c). Specifically, three cities, i.e., Harbin, Jilin, and Haikou, show a statistically significant (p<0.05) positive linear relationship between the anomaly score and rainfall intensity. As the rainfall intensity increases, the anomaly scores for the three cities increase linearly. Furthermore, the slope coefficients of the correlations indicate how sensitive the rainfall intensity may trigger anomalies. The city Harbin has the steepest slope; thus a slight increase in rainfall intensity would trigger anomalies more easily. By contrast, the gentlest slope indicates that Haikou is a city where the residents, in terms of their LBS requests, are not very sensitive to an increase in rainfall intensity. Such diverse sensitivity may be essentially due to the different climatic conditions, infrastructure levels, or other potential factors in these cities. The city Haikou is situated in a humid climate zone with an average precipitation of over 1600 mm yr−1, which is higher than the other two cities. However, Haikou has a higher drainpipe density (11.74 km−1) and thus a more efficient drainage system than the other two (5.73 km−1 for Jilin and 7.44 km−1 for Haikou).1 As a result, impacts of rainstorms on the local residents in Haikou are less than those in the other two cities.
Around 31 %, 23 %, and 46 % of the maximum anomaly scores were detected before, at the same time, and after the rainfall intensity reached its peak (Fig. 7d). Specifically, 23 %, 24 %, and 20 % of the anomaly scores peaked simultaneously, within 1 h, and within 2 h of the rainfall intensity peaks, respectively. About 46 % of the anomaly scores peaked after the rainfall intensity peaks, which is 50 % more than the number of the cases in which anomaly scores peaked ahead of the rainfall intensity peak. As a result, we usually see the maximum positive anomalies (i.e., a significant disturbance in the city rhythm) after the rainfall intensity reached a maximum value. It is also possible for the anomaly to reach its peak before the peak of the rainfall intensity if, for example, the cumulative rainfall is high enough to significantly impact the city.
This study shows the potential of the NLR data to reflect city residents' collective geotagged behaviors. First of all, the NLR was moderately correlated with the population of the cities. Secondly, the time series NLR data correspond well to the regular diurnal rhythm in all eight cities, which is characterized by limited activities from midnight to the early morning, and very active LBS requests are found from noon to the evening. Thirdly, the time series NLR also reflects the different lifestyles in northern and southern China, showing that southerners enjoy nightlife more, whereas the northerners start their days earlier in the morning.
The anomalies of the NLR data correlate well with rainstorms, especially the violent ones, in that they were very likely to trigger positive NLR anomalies at a city level. At the grid level, the anomalies in response to rainstorms show a significant increase in the anomaly indices in terms of the total number, total residual, and mean density. The time series composite score derived from these three anomaly indices clearly shows how city residents respond to rainstorms in terms of their LBS requests.
Rainstorms of the same magnitude may not trigger NLR anomalies in the same way in every city. Essentially, the peak rainfall intensity of the rainstorms seems to be the key, and such a threshold is significantly different among different cities. As a result, high peak rainfall intensity tends to trigger flooding and subsequent anomalies in the NLR data. Furthermore, the peak rainfall intensity is well associated with the peak anomaly score, further indicating it is the key factor that can trigger rainstorm-induced NLR anomalies.
It is noteworthy that other events may also contribute to NLR anomalies. There were a couple of positive anomalies in the last week of August for all of the cities except Zhuhai. The last week of August is the school registration time for college students in China. It is reasonable to expect such a nation-wide event may trigger NLR anomalies as shown in this study. However, some college cities may postpone the registration time, and Zhuhai was one of them due to the significant damage caused by Typhoon Hato right before the registration week.
We are also aware of the limitations of the Tencent location request dataset. The dataset is generated by more than one billion monthly active users rather than all the dwellers in a city. The collective geotagged human activities inferred from the Tencent dataset may underestimate the rainstorms' impacts upon infrequent users, particularly the elderly and children. Our future studies would strive to integrate multi-source geospatial datasets to address this limitation and further explore human responses to various weather events.
The IMERG data were from the NASA Goddard Space Flight Center's PMM and PPS, available at http://pmm.nasa.gov/data-access/downloads/gpm (last access: 14 April 2019). Other analyzed datasets and generated results in the study are available from the corresponding author upon request.
YD and CZ developed the framework of the study. TP and TM collected the data and designed the experiment. JY performed the data analysis. JY and FL prepared and revised the paper.
The authors declare that they have no conflict of interest.
The IMERG data were provided by the NASA Goddard 85 Space Flight Center's PMM and PPS through http://pmm.nasa.gov/ data-access/downloads/gpm (last access: 14 April 2019), and they are archived at the NASA GES DISC. We would like to thank the editor and the anonymous reviewers for their helpful comments.
This research has been supported by the National Key Research and Development Program of China (grant nos. 2017YFB0503605 and 2017YFC1503003), the National Natural Science Foundation of China (grant no. 41901395), and the Strategic Priority Research Program of the Chinese Academy of Sciences (grant no. XDA19040501).
This paper was edited by Gregor C. Leckebusch and reviewed by two anonymous referees.
Adelekan, I. O.: Vulnerability assessment of an urban flood in Nigeria: Abeokuta flood 2007, Nat. Hazards, 56, 215–231, https://doi.org/10.1007/s11069-010-9564-z, 2011.
Alexander, L. V., Zhang, X., Peterson, T. C., Caesar, J., Gleason, B., Klein Tank, A. M. G., Haylock, M., Collins, D., Trewin, B., Rahimzadeh, F., Tagipour, A., Rupa Kumar, K., Revadekar, J., Griffiths, G., Vincent, L., Stephenson, D. B., Burn, J., Aguilar, E., Brunet, M., Taylor, M., New, M., Zhai, P., Rusticucci, M., and Vazquez-Aguirre, J. L.: Global observed changes in daily climate extremes of temperature and precipitation, J. Geophys. Res.-Atmos., 111, 1–22, https://doi.org/10.1029/2005JD006290, 2006.
Bagrow, J. P., Wang, D., and Barabási, A.-L.: Collective Response of Human Populations to Large- Scale Emergencies, PLoS One, 6, 1–8, https://doi.org/10.1371/journal.pone.0017680, 2011.
Barberia, L., Amaro, J., Aran, M., and Llasat, M. C.: The role of different factors related to social impact of heavy rain events: considerations about the intensity thresholds in densely populated areas, Nat. Hazards Earth Syst. Sci., 14, 1843–1852, https://doi.org/10.5194/nhess-14-1843-2014, 2014.
Cannon, S. H., Gartner, J. E., Wilson, R. C., Bowers, J. C., and Laber, J. L.: Storm rainfall conditions for floods and debris flows from recently burned areas in southwestern Colorado and southern California, Geomorphology, 96, 250–269, https://doi.org/10.1016/j.geomorph.2007.03.019, 2007.
China National Climate Center: Bulletin of Flood and Drought Disaster in China, available at: http://www.cma.gov.cn/root7/auto13139/201801/P020180117583067900904.pdf (last access: 3 October 2019), 2017.
Cleveland, R. B., Cleveland, W. S., MaRae, J. E., and Terpenning, I.: STL: A Seasonal-Trend Decomposition Procedure Based on Loess, J. Off. Stat., 6, 3–73, 1990.
Diakakis, M.: Rainfall thresholds for flood triggering. The case of Marathonas in Greece, Nat. Hazards, 60, 789–800, https://doi.org/10.1007/s11069-011-9904-7, 2012.
Dobra, A., Williams, N. E., and Eagle, N.: Spatiotemporal detection of unusual human population behavior using mobile phone data, PLoS One, 10, e0120449, https://doi.org/10.1371/journal.pone.0120449, 2015.
Geller, S. C., Gregg, J. P., Hagerman, P., and Rocke, D. M.: Transformation and normalization of oligonucleotide microarray data, Bioinformatics, 14, 1817–1823, https://doi.org/10.1093/bioinformatics/btg245, 2003.
Goodchild, M. F. and Glennon, J. A.: Crowdsourcing geographic information for disaster response: a research frontier, Int. J. Digit. Earth, 3, 231–241, https://doi.org/10.1080/17538941003759255, 2010.
Gundogdu, D., Incel, O. D., Salah, A. A., and Lepri, B.: Countrywide arrhythmia: emergency event detection using mobile phone data, EPJ Data Sci., 5, 25, https://doi.org/10.1140/epjds/s13688-016-0086-0, 2016.
Hu, P., Zhang, Q., Shi, P., Chen, B., and Fang, J.: Flood-induced mortality across the globe: Spatiotemporal pattern and influencing factors, Sci. Total Environ., 643, 171–182, https://doi.org/10.1016/j.scitotenv.2018.06.197, 2018.
Huffman, G. J., Bolvin, D. T., Braithwaite, D., Hsu, K., Joyce, R., Kidd, C., Nelkin, E. J., Sorooshian, S., Tan, J., and Xie, P.: Algorithm theoretical basis document (ATBD) version 5.2 for the NASA Global Precipitation Measurement (GPM) Integrated Multi‐satellitE Retrievals for GPM (IMERG), available at: https://pmm.nasa.gov/sites/default/files/document_files/IMERG_ATBD_V5.2_0.pdf, last access: 3 October 2019.
Hydrology and Water Resource Bureau of Hefei: Bulletin of Flood and Drought Disaster in Hefei, available at: http://sq.hfswj.net:8000/UploadFile/Doc/20180118122020.pdf (last access: 3 October 2019), 2018.
Kryvasheyeu, Y., Chen, H., Obradovich, N., Moro, E., Van Hentenryck, P., Fowler, J., and Cebrian, M.: Rapid assessment of disaster damage using social media activity, Sci. Adv., 2, e1500779, https://doi.org/10.1126/sciadv.1500779, 2016.
Kubal, C., Haase, D., Meyer, V., and Scheuer, S.: Integrated urban flood risk assessment – adapting a multicriteria approach to a city, Nat. Hazards Earth Syst. Sci., 9, 1881–1895, https://doi.org/10.5194/nhess-9-1881-2009, 2009.
Liao, X., Xu, W., Zhang, J., Li, Y., and Tian, Y.: Global exposure to rainstorms and the contribution rates of climate change and population change, Sci. Total Environ., 663, 644–653, https://doi.org/10.1016/j.scitotenv.2019.01.290, 2019.
Llasat, M. C., Llasat-Botija, M., Barnolas, M., Ĺopez, L., and Altava-Ortiz, V.: An analysis of the evolution of hydrometeorological extremes in newspapers: The case of Catalonia, 1982–2006, Nat. Hazards Earth Syst. Sci., 9, 1201–1212, https://doi.org/10.5194/nhess-9-1201-2009, 2009.
Ma, T.: Quantitative responses of satellite-derived night-time light signals to urban depopulation during Chinese New Year, Remote Sens. Lett., 10, 139–148, https://doi.org/10.1080/2150704X.2018.1530484, 2019.
Ma, T., Pei, T., Song, C., Liu, Y., Du, Y., and Liao, X.: Understanding geographical patterns of a city's diurnal rhythm from aggregate data of location-aware services, Trans. GIS, 23, 104–117, https://doi.org/10.1111/tgis.12508, 2019.
Miao, Q., Yang, D., Yang, H., and Li, Z.: Establishing a rainfall threshold for flash flood warnings in China's mountainous areas based on a distributed hydrological model, J. Hydrol., 541, 371–386, https://doi.org/10.1016/j.jhydrol.2016.04.054, 2016.
Min, S. K., Zhang, X., Zwiers, F. W., and Hegerl, G. C.: Human contribution to more-intense precipitation extremes, Nature, 470, 378–381, https://doi.org/10.1038/nature09763, 2011.
Papagiannaki, K., Lagouvardos, K., and Kotroni, V.: A database of high-impact weather events in Greece: A descriptive impact analysis for the period 2001–2011, Nat. Hazards Earth Syst. Sci., 13, 727–736, https://doi.org/10.5194/nhess-13-727-2013, 2013.
Papagiannaki, K., Lagouvardos, K., Kotroni, V., and Bezes, A.: Flash flood occurrence and relation to the rainfall hazard in a highly urbanized area, Nat. Hazards Earth Syst. Sci., 15, 1859–1871, https://doi.org/10.5194/nhess-15-1859-2015, 2015.
Papagiannaki, K., Kotroni, V., Lagouvardos, K., Ruin, I., and Bezes, A.: Urban Area Response to Flash Flood–Triggering Rainfall, Featuring Human Behavioral Factors: The Case of 22 October 2015 in Attica, Greece, Weather Clim. Soc., 9, 621–638, https://doi.org/10.1175/wcas-d-16-0068.1, 2017.
Ratti, C., Frenchman, D., Pulselli, R. M., and Williams, S.: Mobile landscapes: Using location data from cell phones for urban analysis, Environ. Plan. B Plan. Des., 33, 727–748, https://doi.org/10.1068/b32047, 2006.
Rosner, B.: On the detection of many outliers, Technometrics, 17, 221–227, 1975.
Ruin, I., Creutin, J. D., Anquetin, S., and Lutoff, C.: Human exposure to flash floods – Relation between flood parameters and human vulnerability during a storm of September 2002 in Southern France, J. Hydrol., 361, 199–213, https://doi.org/10.1016/j.jhydrol.2008.07.044, 2008.
Ruin, I., Lutoff, C., Boudevillain, B., Creutin, J.-D., Anquetin, S., Rojo, M. B., Boissier, L., Bonnifait, L., Borga, M., Colbeau-Justin, L., Creton-Cazanave, L., Delrieu, G., Douvinet, J., Gaume, E., Gruntfest, E., Naulin, J.-P., Payrastre, O., and Vannier, O.: Social and Hydrological Responses to Extreme Precipitations: An Interdisciplinary Strategy for Postflood Investigation, Weather Clim. Soc., 6, 135–153, https://doi.org/10.1175/WCAS-D-13-00009.1, 2014.
Spitalar, M., Gourley, J. J., Lutoff, C., Kirstetter, P. E., Brilly, M., and Carr, N.: Analysis of flash flood parameters and human impacts in the US from 2006 to 2012, J. Hydrol., 519, 863–870, https://doi.org/10.1016/j.jhydrol.2014.07.004, 2014.
Su, X., Shum, C., and Luo, Z.: Evaluating IMERG V04 Final Run for Monitoring Three Heavy Rain Events Over Mainland China in 2016, IEEE Geosci. Remote Sens. Lett., 15, 444–448, https://doi.org/10.1109/LGRS.2018.2793897, 2018.
Taylor, H. L., Webber, D., Becker, J. S., Gruntfest, E., Wright, K. C., and Doody, B. J.: A Review of People's Behavior in and around Floodwater, Weather Clim. Soc., 7, 321–332, https://doi.org/10.1175/wcas-d-14-00030.1, 2015.
Terti, G., Ruin, I., Anquetin, S., and Gourley, J. J.: Dynamic vulnerability factors for impact-based flash flood prediction, Nat. Hazards, 79, 1481–1497, https://doi.org/10.1007/s11069-015-1910-8, 2015.
Tukey, J. W.: Exploratory Data Analysis, Addison-Wesley Publishing Company, MA, 1977.
UNISDR: Sendai Framework for Disaster Risk Reduction 2015–2030, available at: https://www.unisdr.org/we/inform/publications/43291 (last access: 3 October 2019), 2015.
Vallis, O., Hochenbaum, J., and Kejariwal, A.: A Novel Technique for Long-term Anomaly Detection in the Cloud, in: Proccedings 6th USENIX Workshop on Hot Topics in Cloud Computing (HotCloud 14), 17–18 June 2014, Philadelphia, PA, 1–6, https://doi.org/10.1016/j.pupt.2014.03.006, 2014.
Wang, Q. and Taylor, J. E.: Quantifying human mobility perturbation and resilience in hurricane sandy, PLoS One, 9, 1–5, https://doi.org/10.1371/journal.pone.0112608, 2014.
Wang, W., Lu, H., Zhao, T., Jiang, L., and Shi, J.: Evaluation and comparison of daily rainfall from latest GPM and TRMM products over the Mekong River Basin, IEEE J. Stars, 99, 1–10, https://doi.org/10.1109/JSTARS.2017.2672786, 2017.
Zhao, H., Yang, S., You, S., Huang, Y., Wang, Q., and Zhou, Q.: Comprehensive Evaluation of Two Successive V3 and V4 IMERG Final Run Precipitation Products over Mainland China, Remote Sens., 10, 34, https://doi.org/10.3390/rs10010034, 2018.
Zhou, Y., Shen, D., Huang, N., Guo, Y., Zhang, T., and Zhang, Y.: Urban flood risk assessment using storm characteristic parameters sensitive to catchment-specific drainage system, Sci. Total Environ., 659, 1362–1369, https://doi.org/10.1016/j.scitotenv.2019.01.004, 2019.
The data are from the 2017 year book of the cities available at: http://tongji.cnki.net/kns55/Navi/NaviDefault.aspx (last access: 3 October 2019).