the Creative Commons Attribution 4.0 License.
the Creative Commons Attribution 4.0 License.
 | 12 Nov 2019
A new approach to mapping landslide hazards: a probabilistic integration of empirical and physically based models in the North Cascades of Washington, USA
Ronda Strauch
Erkan Istanbulluoglu
Jon Riedel
We developed a new approach for mapping landslide hazards by combining probabilities of landslide impacts derived from a data-driven statistical approach and a physically based model of shallow landsliding. Our statistical approach integrates the influence of seven site attributes (SAs) on observed landslides using a frequency ratio (FR) method. Influential attributes and resulting susceptibility maps depend on the observations of landslides considered: all types of landslides, debris avalanches only, or source areas of debris avalanches. These observational datasets reflect the detection of different landslide processes or components, which relate to different landslide-inducing factors. For each landslide dataset, a stability index (SI) is calculated as a multiplicative result of the frequency ratios for all attributes and is mapped across our study domain in the North Cascades National Park Complex (NOCA), Washington, USA. A continuous function is developed to relate local SI values to landslide probability based on a ratio of landslide and non-landslide grid cells. The empirical model probability derived from the debris avalanche source area dataset is combined probabilistically with a previously developed physically based probabilistic model. A two-dimensional binning method employs empirical and physically based probabilities as indices and calculates a joint probability of landsliding at the intersections of probability bins. A ratio of the joint probability and the physically based model bin probability is used as a weight to adjust the original physically based probability at each grid cell given empirical evidence. The resulting integrated probability of landslide initiation hazard includes mechanisms not captured by the infinite-slope stability model alone. Improvements in distinguishing potentially unstable areas with the proposed integrated model are statistically quantified. We provide multiple landslide hazard maps that land managers can use for planning and decision-making, as well as for educating the public about hazards from landslides in this remote high-relief terrain.


Most mountain ranges are susceptible to landsliding due to their steep geomorphology, loose-soil development, geology, and high precipitation (e.g., Coe, 2016). Landslides disrupt aquatic habitats (May et al., 2009; Pollock, 1998), damage infrastructure such as roads, utilities, and dams (Ghirotti, 2012; Baum et al., 2008), and harm people (Wartman et al., 2016; Taylor and Brabb, 1986). Landslide hazards are expected to increase globally with growing climatic extremes (Coe, 2016; Haeberli et al., 2017; Crozier, 2010).
Maps of landslide hazards, quantified as a probability of landslide initiation or impact, can be obtained using empirical methods that statistically relate the location of existing landslides to other environmental variables and physically based models based on geotechnical slope stability equations driven by hydro-climatic inputs (Bordoni et al., 2015; Mancini et al., 2010; Sidle and Ochiai, 2006; El-Ramly et al., 2002). While detailed quantitative and categorical climatic, geologic, ecologic, and pedologic information can be used in statistical models, physically based models are limited to geotechnical stability analyses driven by soil pore water pressure, and they often neglect geological factors such as bedrock, faulting, and complexities of microclimatic conditions. To date, data-driven empirical research on landslide hazard mapping (Corominas et al., 2014; Lee et al., 2007; Chung and Fabbri, 2002) has been typically conducted independently from hydroclimate-driven modeling of landslides that largely focus on hydrologic controls on landsliding (Wooten et al., 2016; Cevasco et al., 2014). There is a need for unifying these two lines of research to provide regional-scale landslide prediction for resource management and hazard mitigation strategies. In this paper we develop a statistical approach to combine the probability of landslide initiation obtained from an observation-based statistical mapping method and a physically based model. The proposed approach is illustrated in the North Cascades region of the state of Washington, USA.
Data-driven statistical landslide susceptibility approaches assess the inherent or quasi-static stability of hillslopes derived from statistical associations (e.g., correlations) between site attributes (SAs) (e.g., soil, geology, and topography) and an inventory of past landslides that includes landslide type and locations (e.g., Dai and Lee, 2002; Gupta and Joshi, 1990; Pachauri and Pant, 1992; Kirschbaum et al., 2012). These models focus on prevailing conditions that predispose hillslopes to failure (Hungr et al., 2014), typically providing general indices of relative landslide susceptibility or spatial probabilities applicable to the study location and cannot represent causal factors or triggering conditions that change in time (Van Westen et al., 2006; Sidle and Ochiai, 2006). The outcome of such analyses depends on the completeness of observations, hindering the use of such techniques over large areas where complete inventories are typically lacking. Since empirical models are based on observations of past landslides, the preconditioning relationships are assumed to prevail into the future until an updated study is completed (Lepore et al., 2012).
Physically based models require considerable data on the spatial-temporal characteristics of the landscape and triggering hydro-meteorologic events. These models are also usually restricted to a specific type of landslide and can be limited in representing local geologic, soil, and hydrologic conditions that may be difficult to observe and map in the field and parameterize in model theory. Data-driven statistical methods could be used to condition physically based model results to incorporate the influence of environmental and geologic factors that are not represented in process theory. Linking these empirically based and physically based models may improve the spatial-temporal patterns of landslide hazard at medium-to-large scales where landslide inventories exist to provide support tools for authorities addressing risk management. Additional descriptions of the advantages and disadvantages of data-driven and physically based models and landslide hazards assessments can be found in reviews by Ercanoglu and Sonmez (2019), Reichenbach et al. (2018), Hungr (2018), and Aleotti and Chowdhury (1999).
This paper describes research designed to address the following questions: (1) How can we quantify the relative contributions of local topography, geology, and ecology on landslide frequency and derive spatial probabilities of landsliding using a statistical model? (2) How would probabilities of landslide initiation derived from empirical observations compare with those derived from a physically based model? (3) How can we combine empirical and physically based models for landslide susceptibility to improve the prediction of landslide hazards?
The empirical approach for landslide susceptibility we used is based on a modification of the frequency ratio (FR) statistical concept which has been found to perform as well as more rigorous statistical approaches such as logistic regression (Hong et al., 2017; Wu et al., 2017; Bellugi et al., 2015; Lepore et al., 2012; Kirschbaum et al., 2012; Lee and Pradhan, 2007; Lee et al., 2007). As for the mechanistic model, we used the results of Strauch et al. (2018), who developed a Monte Carlo solution to the infinite-slope stability equation coupled with a steady-state topographic flow-routing approach to map the annual probability of shallow landsliding. The uncertainty of soil depth in Strauch et al. (2018) was constrained by a soil development model, and subsurface flow recharge was obtained from a regional macro-scale hydrologic model that produced historical hydrologic simulations (Hamlet et al., 2013).
Building on the advantages from the empirical and process models, we combined the two models to develop a map of landslide hazards. The integrated map can be developed to identify landslide hazards that may originate from the initiation of landslides, and it can be used to inform models of transport and deposition (i.e., runout) about landslide material (Fig. 1). The focus of the study was to determine if an empirical-based model of landslide hazards could be used to improve an existing physically based model for shallow landslide probability. The organization of this paper is as follows. Our methodology is discussed in Sect. 2, including the empirical method, model application, data compilation, and model integration approach. Section 3 details our results of the empirical application and integrated hazard model as well as various hazard maps developed. We end with some overall concluding thoughts in Sect. 4.
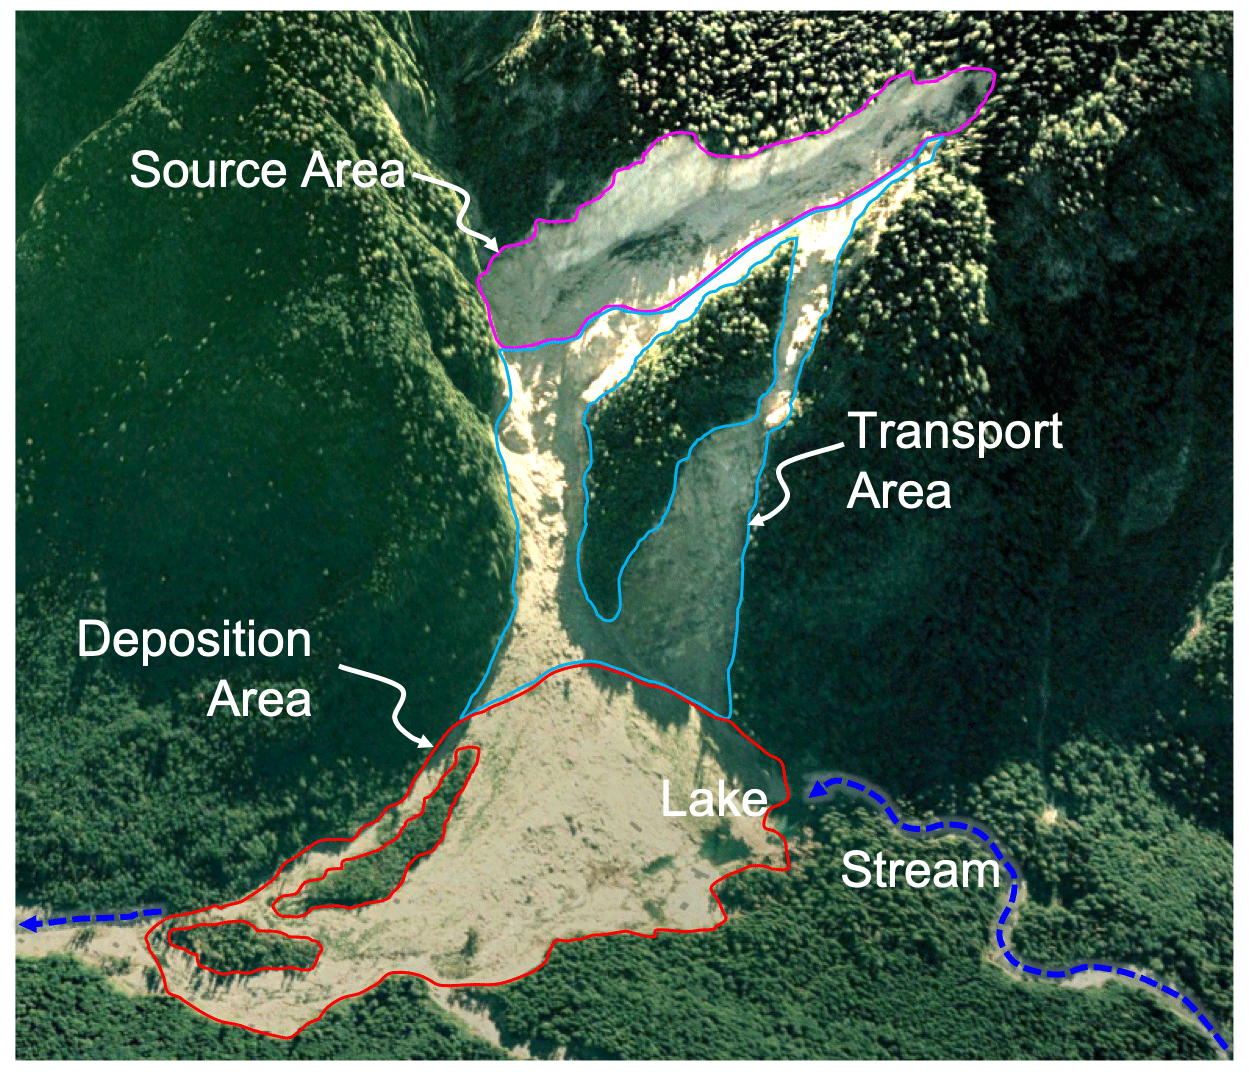
Figure 1Primary landslide features of the Goodell Creek landslide (October 2003) showing source, transport, and deposition areas illustrated over an aerial image. Base of the landslide is about 1 km across. Location in the North Cascades National Park Complex is about 4 km north of Newhalem, Washington. Source: © Google Earth, 48∘41′55.72′′ N, 121∘17′01.31′′ W, imagery data from 23 June 2006, viewed towards the southwest.
2.1 Frequency ratio
We characterized the susceptibility of hillslopes to landslides using an empirically based frequency ratio approach (Lee et al., 2007; Kirschbaum et al., 2012). We used the term landslides broadly, covering all types of mapped landslides in our landslide inventory, with their source, transport and depositional zones (Fig. 1). The FR approach is related the density ratio of historical landslides within selected surface attributes, SAs. We considered seven SAs in our analysis: slope, elevation, aspect, curvature, land use–land cover (land cover), lithology, and rating on a topographic wetness index.
Slope, curvature, and lithology directly affect the forces and geotechnical properties in surface sediments. Land cover provides a surrogate for root cohesion, and a topographic wetness index has been used as a surrogate for soil pore water pressure (Borga et al., 2002). Elevation can represent the effects of climate, weathering, vegetation, ground motion, and glacial processes, if any, as well as coincide with variability in slope, soil depth, and land use (Sidle and Ochiai, 2006). Aspect provides an indication of solar insolation, vegetation type and cover density, snow and ice loading, and soil moisture levels via evapotranspiration (Beaty, 1956; Gokceoglu et al., 2005).
Each SA is indexed by attribute type, m (e.g., m for slope, lithology, and land cover), and its subcategory is indexed by n. Subcategories of each SA can be a categorical variable such as the type of lithology, soil, and land cover or a quantitative variable defined with certain ranges such as slope and aspect over the study domain, SD. For a given SA, identified by m and its subcategory, n, FRSAm,n is calculated (Eq. 1) as the ratio of the observed landslide area, LA, in each SA m and subcategory n (LA) with respect to the area of the SAm,n () to the regional landslide density, Po (Eq. 2) (Miller and Burnett, 2007).
where
The term in the numerator of Eq. (1) gives an empirical probability of a landsliding impact within SAm,n. Po can also be referred to as a regional background probability, such that in the absence of any other information, Po represents the probability of landsliding at any point in the domain. The interpretation of FR is as follows (Lepore et al., 2012):
-
FR < 1 indicates proportionally less landslide area with subcategory n of SA m, SAm,n; hence, there are lower odds of a landslide than in the entire SD.
-
FR = 1 means there is the same proportion of landslide area with SAm,n as in the SD, and thus, the odds of a landslide are the same for the SAm,n subcategory as the SD.
-
FR > 1 reveals a higher percentage of landslide area with SAm,n than in the entire SD, so there is a propensity for failures to occur with this SA.
FR in Eq. (1) is developed for a population of spatially distributed locations that has the same attribute of a given SAm,n. A given point on the landscape would have as many FR values as the number of SAs used. To develop an index that incorporates all the FR values for a given point on the landscape, we used an empirical susceptibility index, SI, defined at the grid cell scale, SIc, as the product of the FR values for all SAs of that grid cell and their associated subcategory.
A multiplicative FR is used because in certain subcategories, there may be no landslide observations (e.g., low slope angle), and in such cases the hillslope would be stable regardless of other soil and vegetation properties. SIc is a measure that relates local static (or slowly changing) site characteristics to the relative frequency of landslides. Since SIc is a data-driven index, the probability of landsliding would increase as SI grows.
In order to develop a continuous relationship between SIc and the probability of landslide at a grid cell, P(LSc|SIc), we binned the population of SIc values across the landscape into SIr bins, where r is the number of SI bins. We then estimated the probability of landsliding for an SI bin, SIr, P(LSr|SIr), as the ratio of the number of grid cells with landslides in each SI bin, N(LS)r, to the total number of grid cells within each SI bin, Nr (Eq. 4).
To calculate the spatially continuous empirical probability of landsliding at each grid cell of a digital elevation model (DEM), P(LSc|SIc), we fit empirical functions that relate P(LSr|SIr) to SIr. These functions are then used for mapping the empirical probability of landsliding at the cell scale, P(LSc|SIc), based on its empirically derived SIc value in Eq. (3).
We included all SAs to develop empirical models relating SI to landslide probability, similar to Kirschbaum et al. (2012) and Lepore et al. (2012). We repeated the analysis described above three times: first, considering all landslide types and including their source, transport, and depositional zones, as is commonly done in multi-factor analyses (Sidle and Ochiai, 2006; Ayalew et al., 2004; Carrara et al., 1995); second, focusing on debris avalanches, with all three of their zones (Fig. 1); and third, considering only the source (initiation) areas of debris avalanches. These source areas were identified as the upper 20 % by elevation within mapped debris avalanche polygons, which appeared to align with inspections of aerial imagery of selected debris avalanches. This tiered approach can be used to quantify the relative contributions of different landslide features to overall landslide hazards in a region as well as inform the variability in hazard identification given a landslide dataset.
2.2 Model integration
Here we develop a method to combine the empirical probability for landslide initiation based on SI, P(LSc|SIc), with the probability of landslide initiation based on a previously developed physically based model using Landlab (Strauch et al., 2018; Hobley et al., 2017). The physically based model employs a Monte Carlo solution of the infinite-slope stability model that evaluates the localized (model grid cell) factor of safety (FS) and calculates the annual probability of failure at a cell, P(FSc≤1), as the number of Monte Carlo iterations, where the probability of failure is less than or equal to 1 divided by the total number of iterations. Precipitation is considered in the physically based model through its use as input into a macro-scale hydrology model, such as the Variable Infiltration Capacity model (Liang et al., 1994), which produces a spatially distributed recharge field used to drive the steady-state subsurface flow model in the component. Other hydro-geophysical stochastic inputs into the stability model are selected from distributions, while slope and specific contributing area are deterministic variables.
In combining probabilities, we focus on the landslide initiation areas, as the physically based model we used would only be applicable for landslide initiation. Empirical P(LSc|SIc) and modeled P(FSc≤1) probabilities of landslide impacts at each cell defined across the landscape are treated as indices representing the likelihood of landslides. The method we propose for an integrated probability uses the cell count of observed landslide initiation points within bins of the empirical, P(LSc|SIc)b, and modeled probabilities, P(FScł1)b of landsliding.
If we treat the empirical probability as an index, the probability of landslide initiation within a bin j of a empirically derived probability of landslide initiation, Ej=P(LSc|SIc)b,j, is calculated as
where N(LS)j is the number grid cells with observed landslides and Nj is the number of grid cells, both within bin j of Ej. Similarly, the probability of landslide initiation within a bin i of a physically based modeled probability of landslide initiation, Mi=P(FS, is calculated as
where N(LS)i is the number of grid cells with observed landslides and Ni is the number of grid cells, both within bin i of Mi. If the observed landslide data are representative of the actual landslide frequency over the duration when the probability of landsliding is modeled, an ideal model that correctly represents all environmental variables associated with landslide initiation would give P(LS. Assuming unbiased landslide mapping in the field, a greater difference between these two relative-frequency probabilities would suggest a weaker model representation of the process, especially when the physically based model is run to represent landslide hazard for a given climatology.
Modeled probabilities may be improved when information contained in empirical probabilities is introduced. The probability of landslide initiation in areas shared by any two select bins (e.g., co-bins) of empirically derived, Ej, and physically based modeled, Mj, probabilities is calculated as the joint probability
where N(LS)j,i is the number of grid cells with observed landslides and Nj,i is the number of grid cells in the joint bin j empirical probability data and bin i modeled probability data. An illustration of this estimation is given in Fig. 2. The conceptual example shows how relatively low landslide probability predictions by a process model in the Mi=0–0.2 bin range can be modified due to differences in the empirical preconditioning of the landscape (e.g., rock type) to landslides represented in Ej. The intersection of Mi=0–0.2 with Ej=0.3–0.4 yields a higher empirical probability of landsliding. The influence of vegetation change and extreme weather events (e.g., eco-hydrometeorologic controls) that were not part of the initial empirical dataset used for estimating Ej bins can be captured by the physically based model. In this case the model predicts a high probability Mj=0.8–1, while Ei remained in the low probability range in Ei=0.0–0.1. The intersection of the Mj and Ei land surface characterization captures the landscape where landslides were observed.
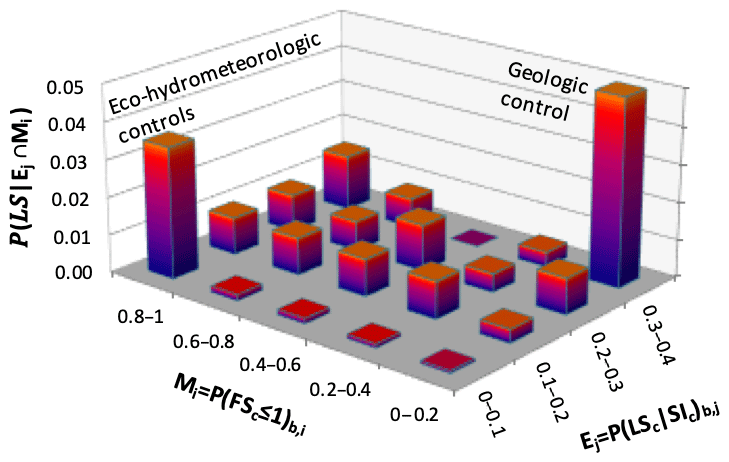
Figure 2Illustration of the proposed landslide probability conditioned on estimated spatially distributed SI-based empirical and modeled probabilities as binned indices EJ and Mi, which form a joint space. P(LS) is defined as the ratio of the number of landsliding cells to the number of cells that jointly fall into the given Ej and Mi bins.
We propose that the ratio of P(LS) and P(LS|Mi) can be used as a correction to P(FSc≤1). As model predictions improve, this ratio should get closer to 1, especially when the model is used to map landslide probability for a given climatology in a region. When the physically based model is run for studying a specific rainfall event, this ratio quantifies the relative roles other factors could play in landslide initiation. Thus, we propose that the probability of landsliding at each grid cell, c, given the corresponding Mj and Ei bins that a cell belongs to, can be estimated as
If we let ω represent the bin-based ratio on the right-hand side of Eq. (8) as a weighting factor based on observations of landslides, then we can simplify this notation to
This gives the probability of landslide initiation, represented as an adjusted modeled probability of landslide initiation at a grid cell given that empirical observations correlated with site characteristics. In the reminder of the paper we use P(FSc≤1) to refer to the physically based shallow landslide probability from Strauch et al. (2018) and P(LS) to refer to the adjusted model probability using the proposed empirical-adjustment methodology.
A hypothetical example shown in Table 1 demonstrates calculating the relative frequencies, the resulting calculated weight, and the adjusted P(LS) (Eq. 9). The calculation of relative frequency is based on binning modeled and empirical probabilities, counting landslide and non-landslide cells within each bin, and calculating a weighting term, ω, which is then used to adjust the original modeled probability given empirical evidence. Weights can be greater than 1, and the final probability will be increased when the weight is greater than or equal to 1 and decreased when the weight is less than 1. The final adjusted probabilities are limited to unity in the integrated model. For example, a weight of 2 and a modeled probability of 0.2 would result in a doubling of the final probability to 0.4 given empirical information.
Table 1Hypothetical example of calculating relative frequency, weight, and P(LS) during model integration using the above data is shown in bold.
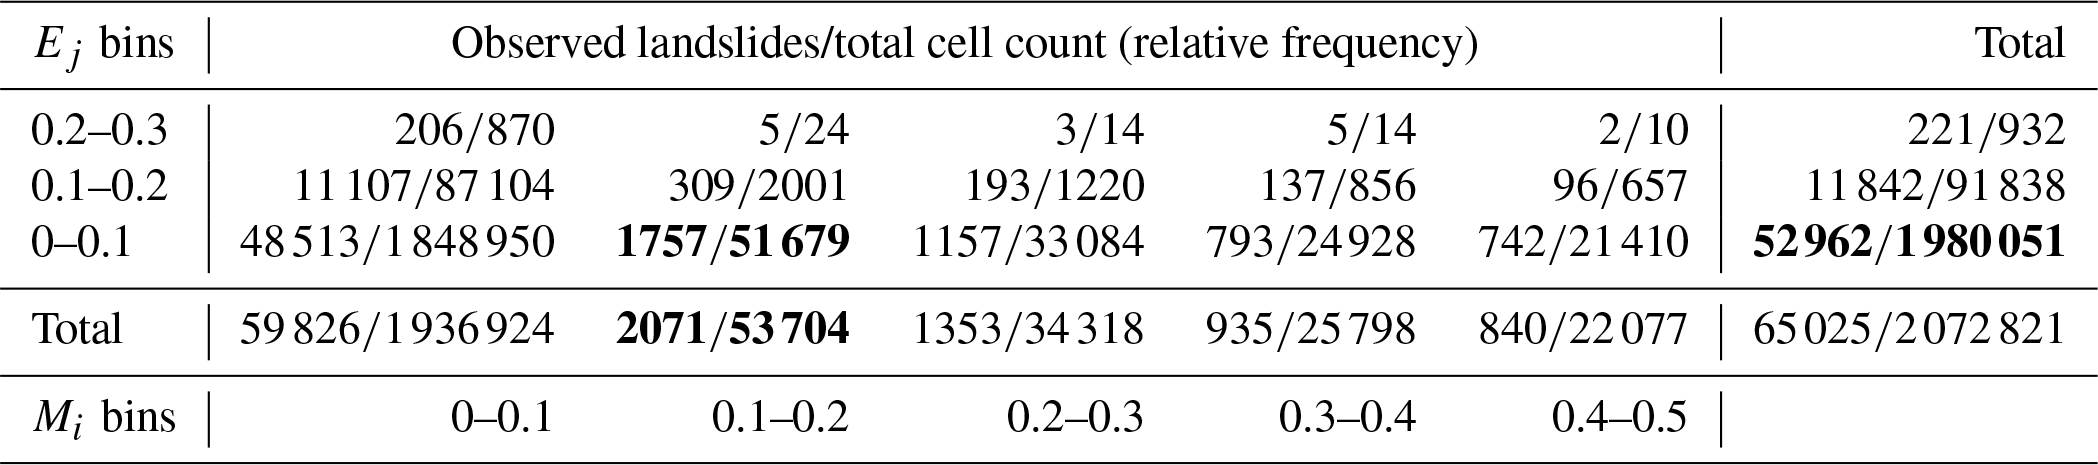
An example calculation of P(LS) using the above data: a cell having a modeled probability of P(FS and an empirical probability of P(LSc|SIc)=0.08 equates to P(LS|Ej) (Eq. 5), P(LS (Eq. 6), P(LS (Eq. 7), , and P(LS) (Eq. 9).
2.3 Model application
2.3.1 Study area
Our study area is within the geographical limits of the North Cascades National Park Complex (NOCA) managed by the U.S. National Park Service (Fig. 3). NOCA has experienced damaging and disruptive landslides that have impacted infrastructure and disrupted public use of the park. NOCA is approximately 2757 km2, with 93 % wilderness (e.g., no motorized or mechanized devices) (DOI-NPS, 2012), which is ideal for studying landslides primarily triggered by natural causes. The north–south-oriented Cascade Mountains have an elevation range of 100 to 2800 m at the study site, with jagged bedrock peaks and over 300 alpine glaciers. The landscape has been shaped by Ice Age continental and alpine glaciers and mass wasting, fluvial and tectonic uplift processes that continue today (LaHusen et al., 2016; Mustoe and Leopold, 2014; Collins and Montgomery, 2001; Riedel et al., 2007; Pelto and Riedel, 2001). The bedrock geology in the park is dominated by gneiss and granite, with lower-grade metamorphic rocks schist and phyllite on the western edge of the park and Mesozoic sedimentary rocks on the eastern flank (Tabor and Haugerud, 1999). The placement of granite at depth along faults led to hydrothermal alteration of some overlying rocks and the clustering of large landslides. Soils in the park are generally coarse-grained and relatively young due to active slope processes, but soil age, thickness, and distribution are highly variable. Soils formed in glacial deposits from the last glaciation are also widespread, and many soils are classified based on the amount of volcanic ash they contain.
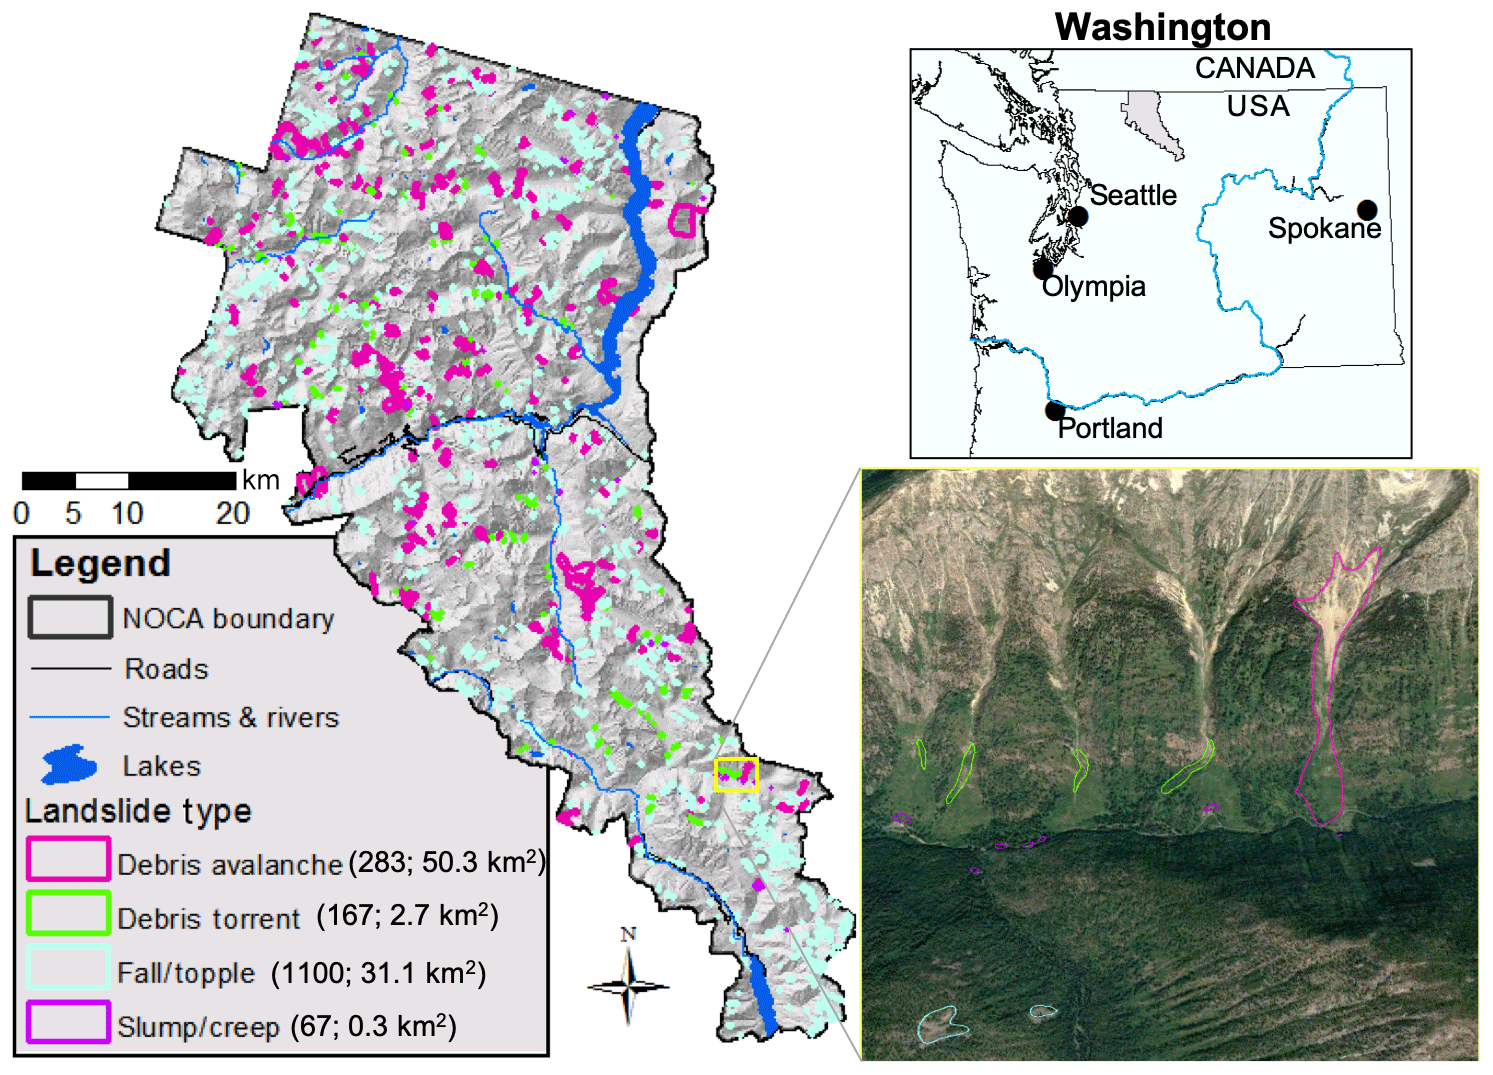
Figure 3Four landslide types mapped within the North Cascades National Park Complex (NOCA) in Washington, USA. The number and their total area of each type is given in parentheses. Insert provides an example of mapping over an aerial image (© Google Earth) taken at 48∘27′20.21′′ N, 120∘44′47.09′′ W with imagery data from 27 August 2006.
The orographic uplift of Pacific Ocean air masses generates a spatial precipitation gradient with an average of 4575 mm of precipitation falling annually on the highest elevations west of the crest, while lowlands east of the crest receive a mean annual precipitation of 708 mm (Mustoe and Leopold, 2014; Roe, 2005). Air temperatures vary highly depending on the season and elevation with the warmest month typically being August and the coldest month being January; corresponding average daily temperatures are about 25 and 4 ∘C, respectively, for these months in Newhalem, Washington.
NOCA is dominated by forest vegetation, particularly coniferous tree species, up to about 2000 m (Strauch et al., 2018; Agee and Kertis, 1987). A patchwork of shrubs, herbaceous vegetation, and barren land is found above this elevation, which is common in alpine environments and in the paths of frequent snow avalanches. Above 2400 m there is mostly bare rock, snow, and ice. The underlying geology is composed of a primarily old Mesozoic crystalline and metamorphic rock originating far to the south (Haugerud and Tabor, 2009).
Landslide (LS) inventory data are the most requisite information needed for an empirical statistical analysis (Lepore et al., 2012). Landslides were mapped in the 2768 km2 park as discreet landforms during a comprehensive park-wide landslide inventory (Fig. 3; Riedel and Probala, 2005). Landslides were identified using stereo pair air photos, which have been taken since the 1960s at 1:24 000 and 1:12 000 scales, 7.5 min topographic maps, bedrock geology maps, and field investigations (e.g., Riedel et al., 2012). The minimum mapping unit was approximately 1000 m2 except for some smaller slump units. Landslide linework was transferred to a digital format, peer-reviewed, and the polygons were edited into their final form in geographical-information-system (GIS) software using National Agriculture Imagery Program (NAIP) imagery and a 10 m DEM and, in some cases, lidar. Where areas were mapped by traditional methods, and lidar later became available, the original approach captured most (∼75 %) of the landslides. Dense vegetation cover and a lack of access limited identification of some existing landslides. Larger, more recent debris avalanches that left large deposits on the valley floor were more easily recognized and mapped. Ancient landslides that occurred before the last glacial period 16 000 years ago were generally not mapped because their deposits were buried or reworked by subsequent continental glaciation.
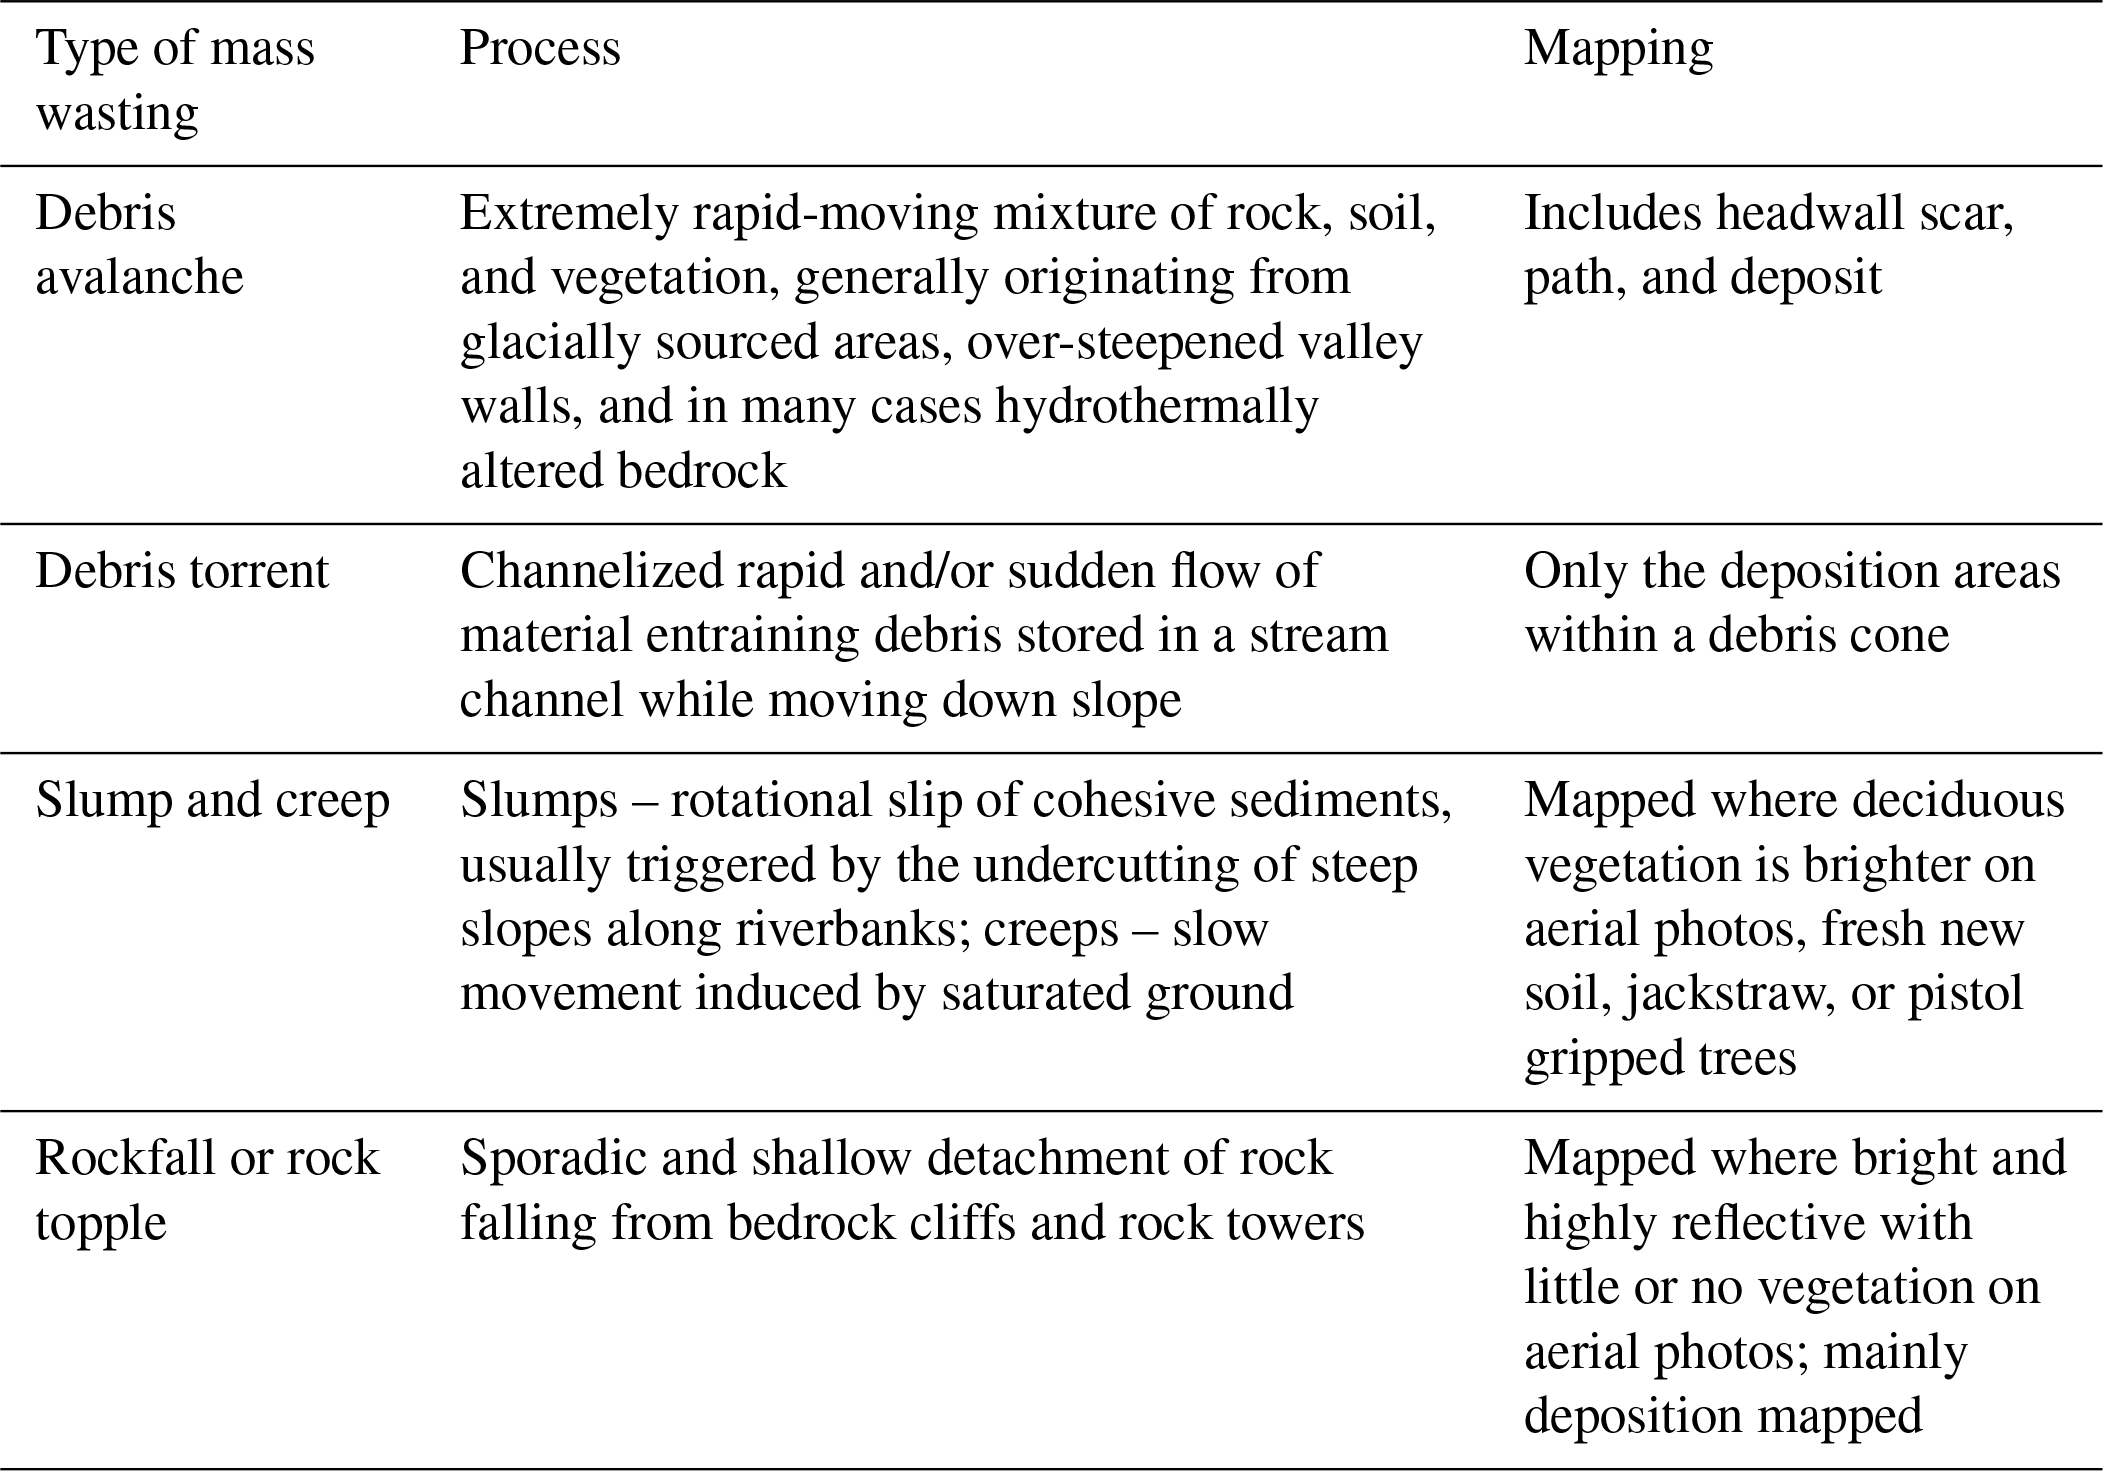
The landform mapping study identified six different types of mass wasting: rock fall/topple, debris avalanche, debris torrent, slump/creep, sackung, and snow avalanche-impacted landforms (SAILs) of which four are described in Table 2 (Riedel et al., 2012). The single sackung mapped in NOCA represents a gravitational spreading or slope deformation, sometimes found near ridge tops. All landslide types were included in the analysis except for the rare sackung and SAILs, which are created by a snow avalanche impacting unconsolidated sediments rather than slope instability. The idea is to capture more spatial variability and geologic controls on observed landslides by using all the data we obtained that was available from the inventory for the four common landslide types. There are 1618 landslides mapped in NOCA: falls/topples (68 %), debris avalanches (17 %), debris torrents (10 %), slumps/creeps (4 %), and one sackung (<1 %) (Fig. 3; sackung not shown).
Table 2Landslides mapped as part of a comprehensive landform mapping study used in hazard analysis (Riedel et al., 2012).
2.3.2 Study domain and parameters
We constrained our analysis to soil-mantled landscapes by excluding high-elevation areas covered by glaciers, permanent snowfields, and exposed bedrock, as well as wetlands and other water surfaces, based on landform mapping and maps of lithology and land cover. We also exclude slopes less than 17∘ because this slope threshold was found to generally separate colluvial mass wasting and debris transport processes from fluvial processes in this region (Strauch et al., 2018). The area included in the analysis covers about 79 % of NOCA's land area.
The seven site attributes investigated using the frequency ratio approach as they relate to mapped landslide activity vary across the NOCA study area. Slope, total curvature (Laplacian of elevation), and aspect attributes were derived using ArcGIS from a 30 m DEM acquired from the National Elevation Dataset (NED) (USGS, 2014a). A resolution of 30 m was chosen for comparability with other studies and landslide size (e.g., Strauch et al., 2018; Lepore et al., 2012). Elevation ranges from 107 to 2794 m with 85 % of the park between 500 and 2000 m. Subcategories for elevation were based on 200 m increments with lumping at the ends (e.g., <400 and >2200 m). Slope subcategories were set at 5∘ increments with ending subcategories for slopes at 17–25 and >50∘. The curvature was divided into three subcategories: convex/diverging, flat, or concave/converging. The aspect (i.e., facing direction of slope) was classified into eight compass orientations (i.e., N, NE, E, SE, S, SW, W, NW). The park's complex topography results in a roughly equal distribution among the cardinal and intercardinal directions of aspect; however, the southwest quadrant is slightly more common.
The DEM also provides the information needed to derive a distributed wetness index (Beven and Kirkby, 1979; O'Loughlin, 1986), calculated as the natural log of the ratio of the specific catchment area [L] to the sine of the local slope. This index has been used for quantifying the contribution of pore water pressure to destabilizing forces in landslide modeling (e.g., Borga et al., 2002; Gokceoglu et al., 2005). The wetness index was divided into five subcategories based on 20 % quantiles: low, low-medium, medium, medium-high, and high wetness. The land cover was acquired from the 2014 National Land Cover Database (NLCD), which is based on 2011 Landsat satellite imagery (Jin et al., 2013; USGS, 2014b). We categorized this into forest, shrubland, herbaceous, water, wetland, snow/ice, barren, and developed (e.g., roads, campgrounds). Based on this classification, forest, shrubs, and herbaceous vegetation represent 54 %, 15 %, and 10 % of the park, respectively. Barren land and snow or ice together cover 17 %, typically at the high elevations. Water and wetlands cover about 2.5 %, while the developed area is less than 0.5 %.
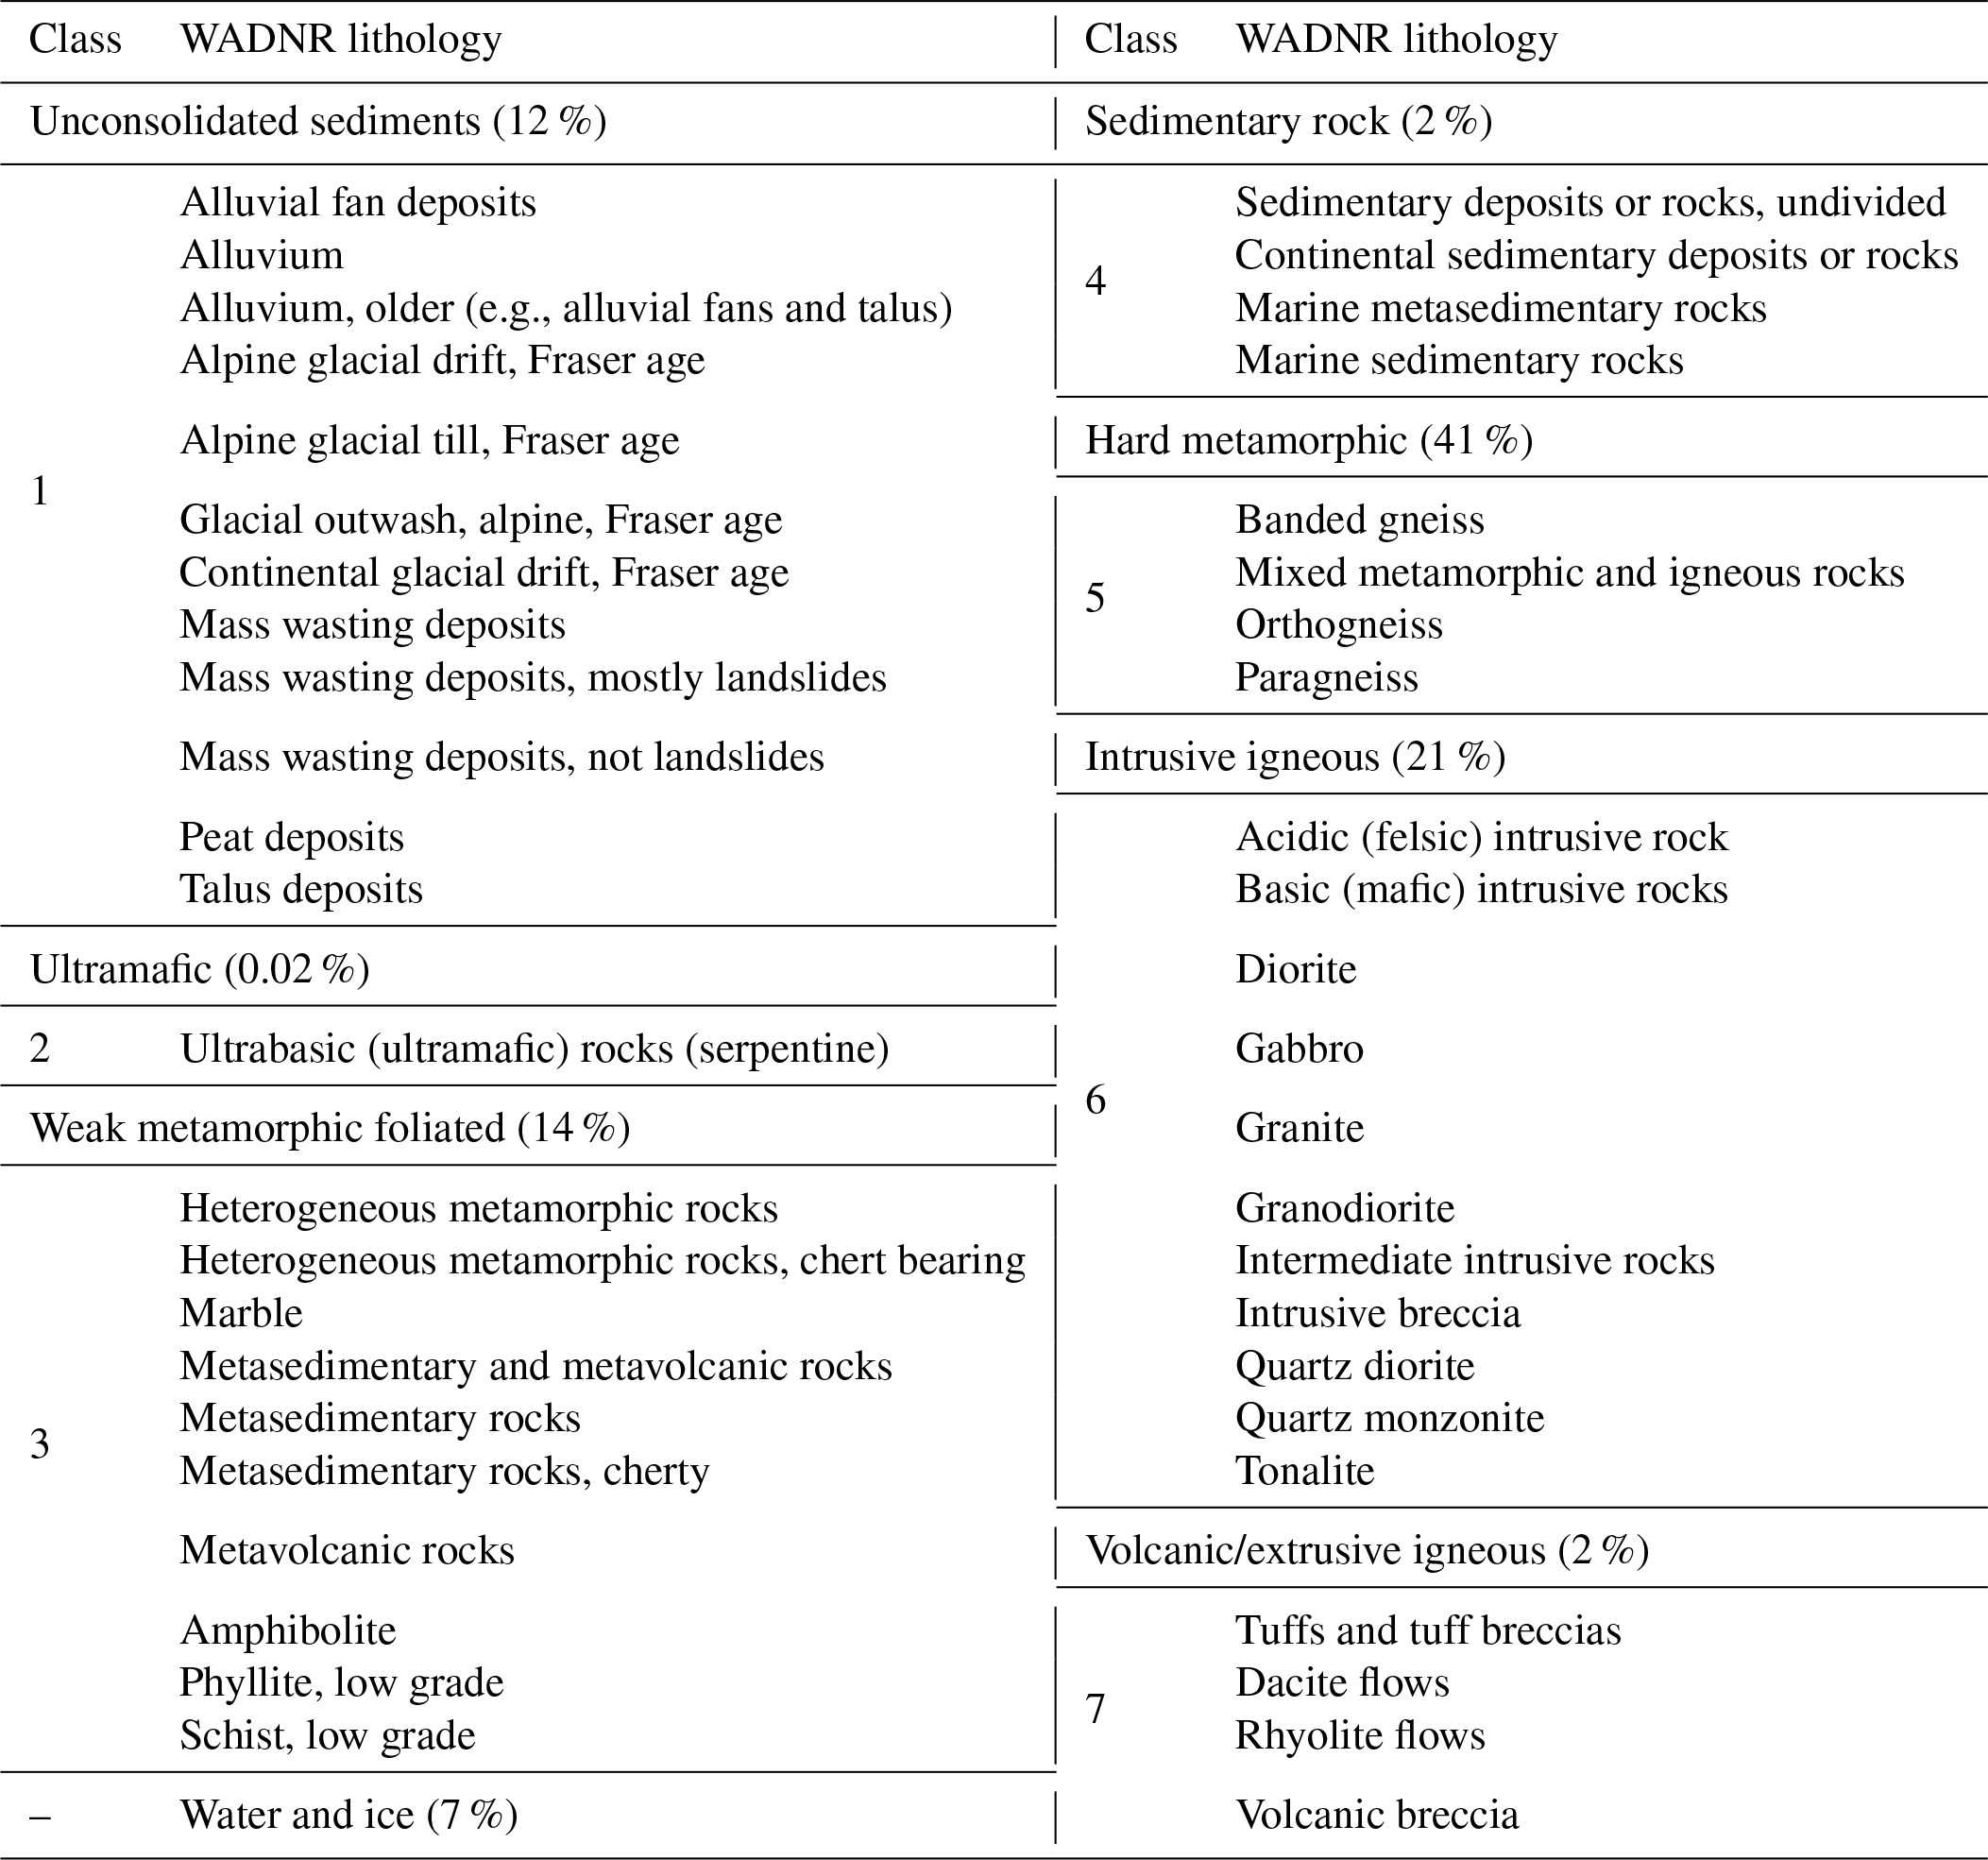
Lithology provides a description of the rock and deposits that indicates composition, strength, and age, which can influence the hillslope strength and water redistribution. Washington State Department of Natural Resources (WADNR) provides lithology in its surface geology maps that display rocks and deposits as geologic map units (WADNR, 2014). This source of information was chosen because it is available for all of Washington, facilitating future applications. There are 48 lithology map unit types within NOCA. These were aggregated into seven subcategories, based on similarities in origin and generally increasing strength, called (1) unconsolidated sediment, (2) ultramafic, (3) weak metamorphic foliated, (4) sedimentary rock, (5) hard metamorphic, (6) intrusive igneous, and (7) volcanic/extrusive igneous (Table 3). Water and ice were not classified. Both land cover and lithology were rasterized to the same DEM grid resolution using ArcGIS based on the dominant type of attribute in each grid cell. Among the seven types of lithology, hard metamorphic is most common (41 % of NOCA), while ultramafic, sedimentary rock, and volcanic/extrusive igneous combined make up less than 5 %.
Table 3Classification from the Washington Department of Natural Resources of surface geology from generally weaker (1) to stronger (6) material along with aerial percentages within NOCA in parentheses.
3.1 Frequency ratio analysis
The results of the FR analyses for each site attribute are presented in Fig. 4. We discuss the role of SA starting with debris avalanche source areas as they are hypothesized to represent the initiation processes of shallow landslides that transform into debris avalanches. The SAs that impact shallow landslide initiation could arguably play common controls on the initiation of other types of slope failures. The frequency analysis shows a clear and growing control of local slopes greater than 35∘ on landslide initiation, which can be considered as the internal friction angle of cohesionless sand (Fig. 4c).
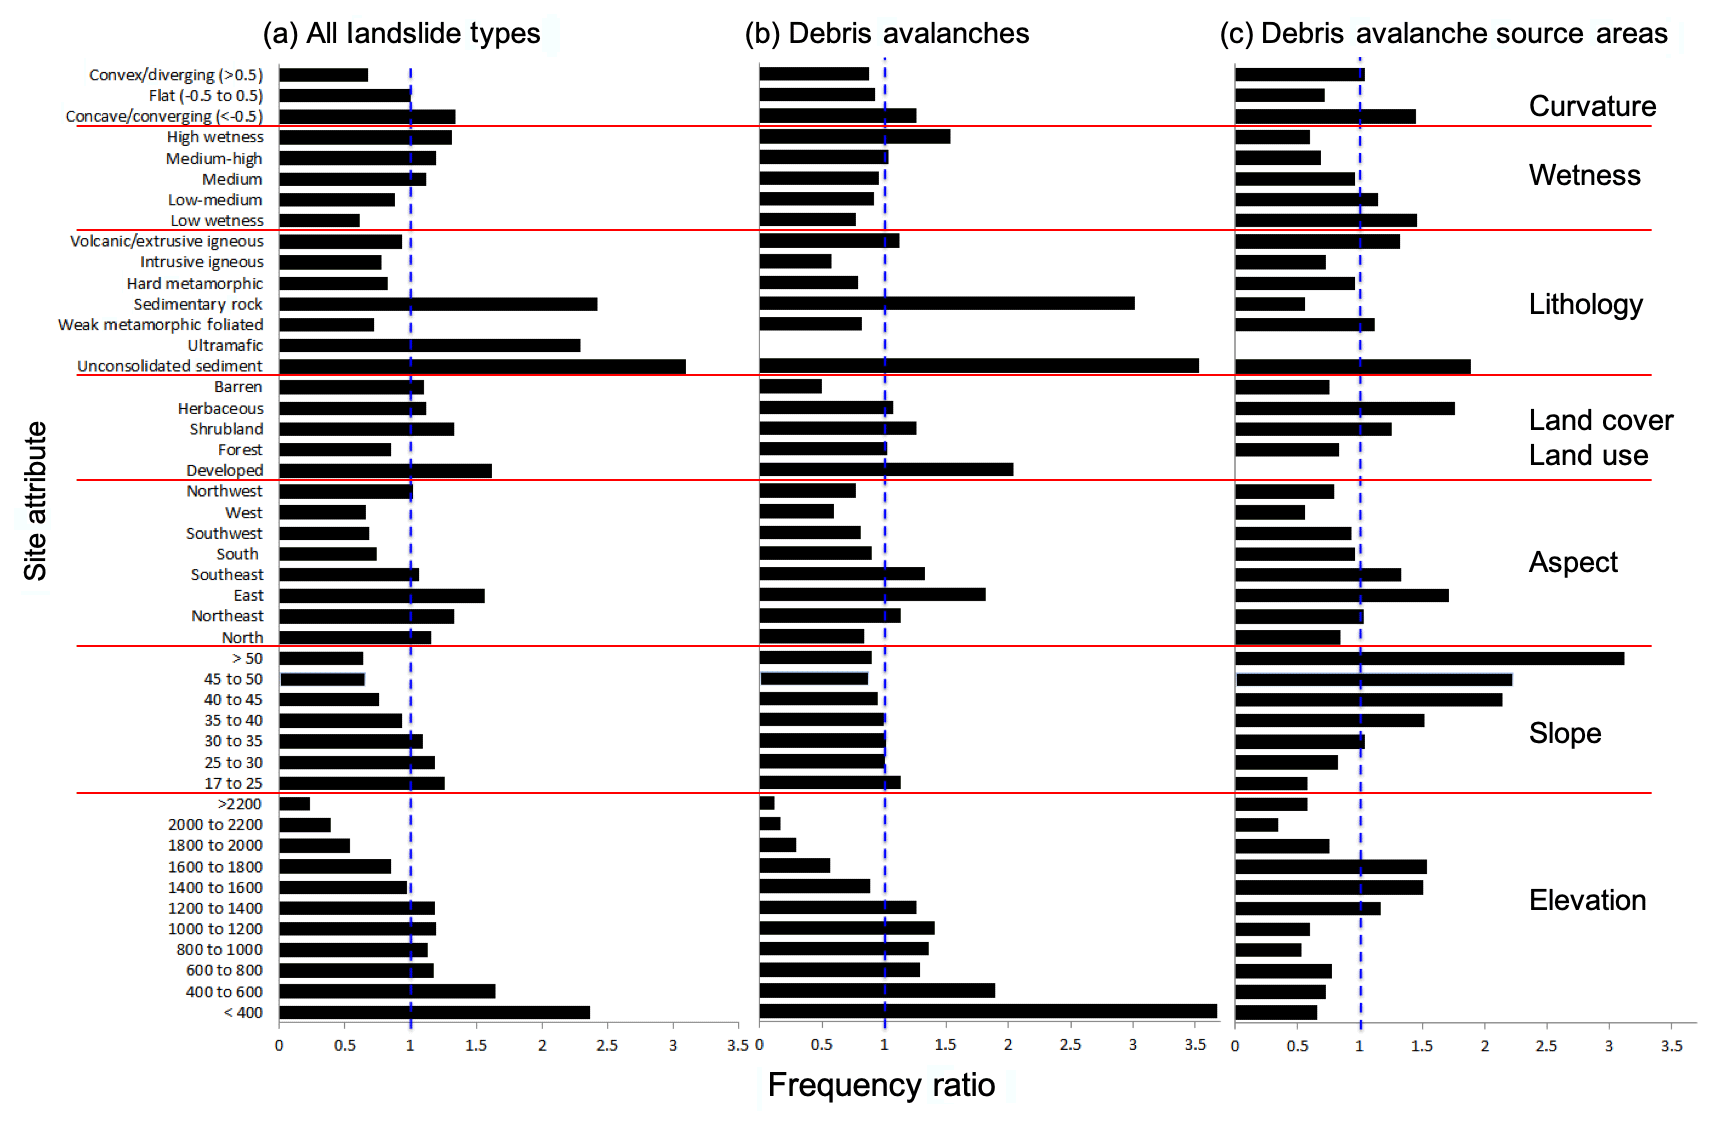
Figure 4Frequency ratio (FR) values for different bins of seven site attributes (SA) separated by red lines, based on (a) all landslide types mapped within the NOCA study domain, (b) debris avalanche landslide types only, and (c) source areas of debris avalanches represented by the highest 20 % of the mapped debris avalanche. The vertical blue line refers to the FR value of 1.0, denoting when no association is found with mapped landslides. FR values below this line are attributes less likely associated with landslides, and FR values above this line indicate a greater association with landslides.
The source area of debris avalanches is only about 17 % of the mapped debris avalanche area and 10 % of the whole landslide inventory, which predominantly maps transport and depositional areas. A small debris avalanche source area in steep terrain can lead to large landslide impacts in lower elevations, as the eroded material travels downhill and deposits in gentler gradients (Fig. 1). Thus, the runout zones of debris avalanches and other mapped landslide types cover more area at gentler slopes typical of lower elevations. This process is captured in Fig. 4a and b where the FR analyses exhibit higher landslide hazards at gentler slopes (<30∘), more likely associated with transport and depositional processes as well as the failure of side slopes along glacially incised U-shaped valleys undercut by fluvial activity. Others have reported the clustering of landslide impacts in lower elevations within valleys where hillslopes are steep enough to fail (Megahan et al., 1978; Kelsey, 1988; Densmore et al., 1997; Chalkias et al., 2014).
In the study area, local slopes generally increase on average with elevation, particularly above 1400 m (Strauch et al., 2018). The control of steeper slopes on debris avalanche initiation is supported by the results for elevation, where source areas are associated with mid-to-high elevation (1400 to 1800 m) and entire debris avalanches and all landslides types, including deposition zones, have growing frequency in lower elevations (<1200 m) with the highest frequency falling in elevations < 400 m (Fig. 4a and b). A further increase in slopes typically leads to bedrock exposure and barren lands with thin soil (Strauch et al., 2018; Gabet, 2003). In addition to steepening slopes, the observed higher frequency of debris avalanche source areas in the mid-to-high elevation range corroborates recent findings of an ecosystem transition control on landslide initiation (Strauch et al., 2018). With the cooling of air temperatures beyond forest ecosystem thresholds, the transition of forest vegetation (predominant alpine conifers) to mixed shrub and herbaceous vegetation types with lower root cohesion leads to higher landslide frequency at debris avalanche source areas (Fig. 4c). The slope and elevation results, however, are likely influenced by the mapping approach, which was biased in mapping landslide activity on the lower portions of hillslopes that were typically more accessible, and continuous creep and rapid slides in subalpine and alpine areas were infrequently mapped.
Developed areas that include impervious surfaces, constructed materials, and lawns have the highest land cover association with all mapped landslide areas, as well as with debris avalanches, yet they have no association with debris avalanche source areas, which are typically higher on mountains and rarely developed. Although dirt roads have been found to disrupt drainage and increase erosion (Croke and Hairsine, 2006; Montgomery, 1994; Swanson and Dyrness, 1975), the lack of association with landslide initiation suggests that developed areas may be positioned on the landscape in areas likely to be impacted by landslide runout or deposition. In general, forest and barren land cover show the least landslide activity compared to other land cover (Fig. 4). The forest association likely indicates the positive contribution of root cohesion to hillslope stability, whereas the barren land cover type results may indicate the effect of mapping completeness or hillslope processes. The results of the barren areas appear counter to the findings of the physically based landslide model applied at the same location, which found a high probability of landslide initiation in barren areas often below retreating glaciers (Strauch et al., 2018). Barren areas include bedrock, glacial debris, and other accumulations of earthen material with vegetation generally accounting for less than 15 % of total cover; thus, there may be a variety of stability conditions within this single-cover class.
The sources of debris avalanches are linked to eastern and southeastern aspects (Fig. 4c); 20 % and 15 % of source cells by area occur on these aspects, respectively. Except for western aspects that show the weakest association debris avalanches, other aspects show landsliding frequency close to the average frequency in the whole study domain. Vegetation type and cover that relate to root strength and moisture regime can be related to aspect. Eastern and southern exposures have lower forest cover fractions compared to other aspects at mid-to-lower elevations (<1400 m), and forests are largely replaced by barren lands and shrub and herbaceous vegetation as elevation increases (Fig. 5). Most source areas of debris avalanches and debris avalanches as a whole are associated with shrub and herbaceous vegetation types (Fig. 4b and c). Other aspects, especially west-facing slopes, have a higher fraction of forest cover (Fig. 5), likely linked to a longer growing season (Evans and Fonda, 1990). A lower landslide frequency in western aspects can be a result of higher root cohesion of forest vegetation compared to shrubs and herbs. Additionally, perhaps west-facing aspects experience more arid moisture regimes or bedrock bedding, jointing, or fracturing conducive to stability compared to other exposures (Carson and Kirby, 1972; Fischer et al., 2006).
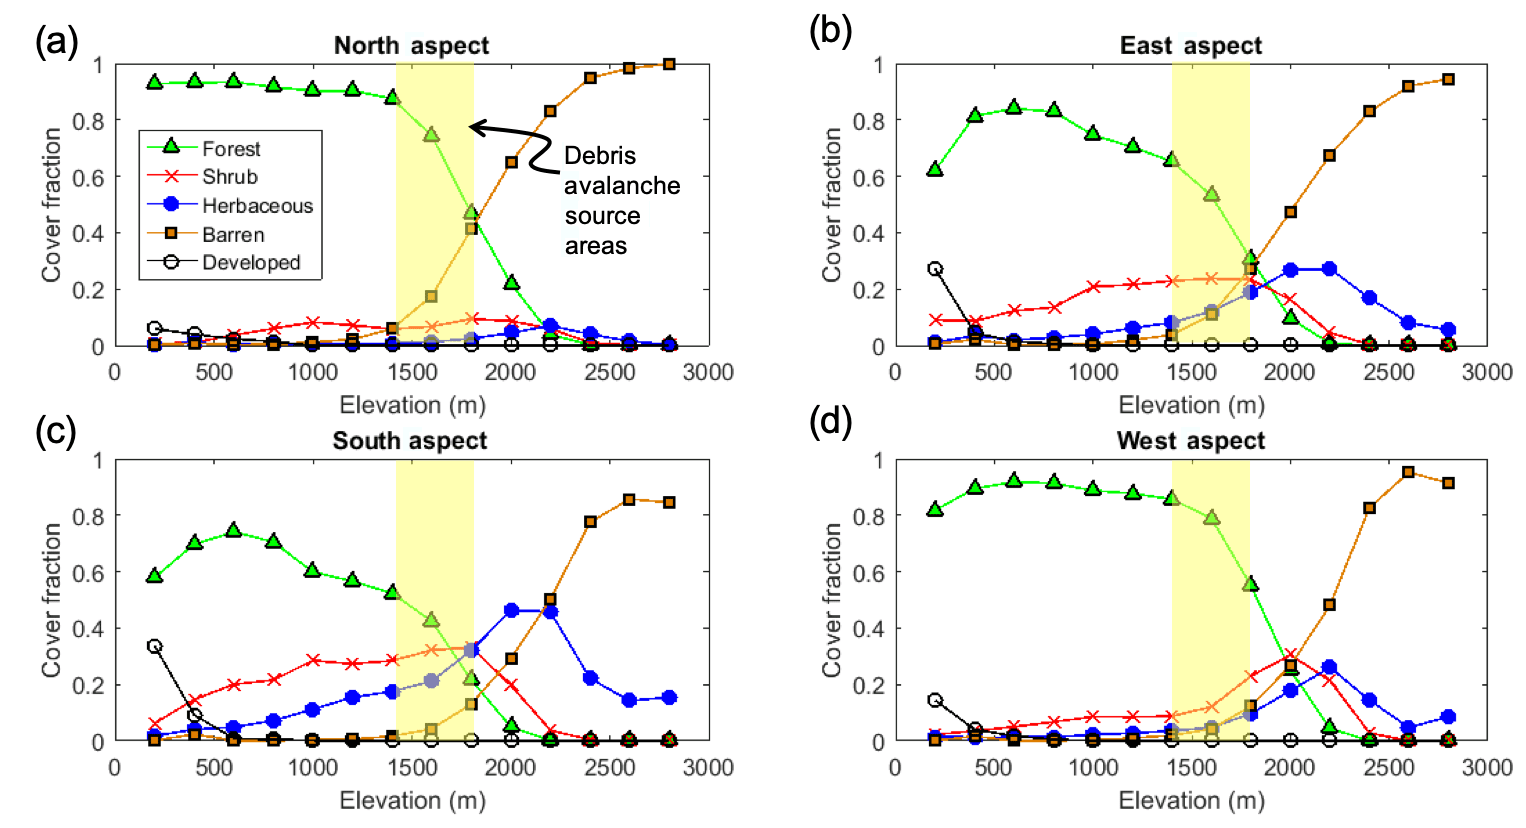
Figure 5Vegetation cover fraction in NOCA on each aspect, taken as the fraction of vegetation type within each 200 m elevation band. Aspects categorized here as (a) north (0 to 45∘ and 315 to 360∘), (b) east (45 to 135∘), (c) south (135 to 225∘), and (d) west (225 to 315∘) cover 23 %, 23 %, 26 %, and 28 % of NOCA, respectively. Yellow highlighted area represents the strongest elevation association for debris avalanche source areas.
When all landslides are considered, northern slopes exhibit a growing landslide association, while landslide frequency declines in southeastern slopes compared to the other landslide datasets (Fig. 4a and b). North-facing slopes have been documented to retain more soil moisture than south-facing aspects in northern latitudes (Geroy et al., 2011), which can be broadly responsible for more initiation, transport, and deposition impacts of all mass wasting types. Hillslope asymmetry (i.e., steeper slopes depending on aspect) was not found during the inspection of the average slope on the four primary aspects. North–south asymmetry has been found to demonstrate a reversal based on elevation and a 49∘ latitude, which corresponds to the northern edge of NOCA (Poulos et al., 2012). In general, the relatively similar aspect associations for different landslide observation datasets likely indicates the connection of source areas to the downstream processes of transport and deposition (Fig. 1).
Comparisons among all landslides, whole debris avalanches, and debris avalanche source areas clearly show that unconsolidated sediments, largely derived from transport and depositional processes, have a stronger association with landslides than other lithologies followed by sedimentary rock (Fig. 4). This strong association is expected given the inclusion of mass wasting landforms in the classification of unconsolidated sediment. The high ultramafic-rock association when considering all landslide types is driven by a single topple/fall occurring in this scarce lithology (<0.02 % of NOCA). The widespread observation of debris avalanche source areas in all rock types may point to the role of steep slopes regardless of lithology. For debris avalanche processes, sedimentary rock is more associated with transport and depositional areas than source areas. Areas without landslide activity were associated with weak metamorphic foliated and intrusive igneous lithology (Fig. 4a).
The association of landslides on concave/converging vs. convex/diverging topography is relatively consistent among the datasets and generally consistent with the literature due to enhanced wetness where vegetative support may be weak in deeper soils (see Hales et al., 2009; Fig. 4). A high-wetness index is associated with landslides for all landslide types as well as entire debris avalanches (Fig. 4a and b). This result is intuitive as this index is an indicator of increased soil saturation and surface runoff. In contrast, source areas were correlated with a low-wetness index (Fig. 4c). This counterintuitive finding, however, aligns with previously discussed results that source areas are associated with the loss of root strength, steep slopes, and higher elevations, resulting in relatively small specific catchment areas. By definition, a wetness index is negatively correlated with the slope and positively correlated with the specific contributing area. Thus, source areas will have a low-wetness index when they are from steep slopes with small contributing areas (i.e., located higher up on hillslopes).
3.2 Susceptibility index
A susceptibility index is calculated for each grid cell within the study area domain by Eq. (3). Cumulative distributions for SI, plotted as a fraction of area of the study domain as well as only in the areas where landslide impact was mapped, show higher SI values for a given fraction of the respective domains where a given SI is exceeded (Fig. 6a, d, and g). Additional support beyond the graphics that these distributions are not equal is provided by the Kolmogorov–Smirnov test, which rejects the null hypothesis of equal distributions at α<0.01. The cumulative distributions show that the SI calculated from the FR method can differentiate mapped landslide locations from non-landslides with a larger SI. The resulting spatial distribution of the SI is right skewed as shown in the relative frequencies of SI for all three landslide datasets (Fig. 6b, e, and h). The right skew indicates that there is a small population of grid cells with a high SI compared to the majority of grid cells in the study domain. This occurs when there are FR subcategories frequently associated with landslides coinciding at the same location. Histograms show a greater relative frequency of landslide grid cells with high SI values than the entire domain (Fig. 6b, e, and h). For source areas, SI bins for the histograms were larger (e.g., 0.5 vs. 0.25) due to the small number of source area cells compared to the two other datasets.
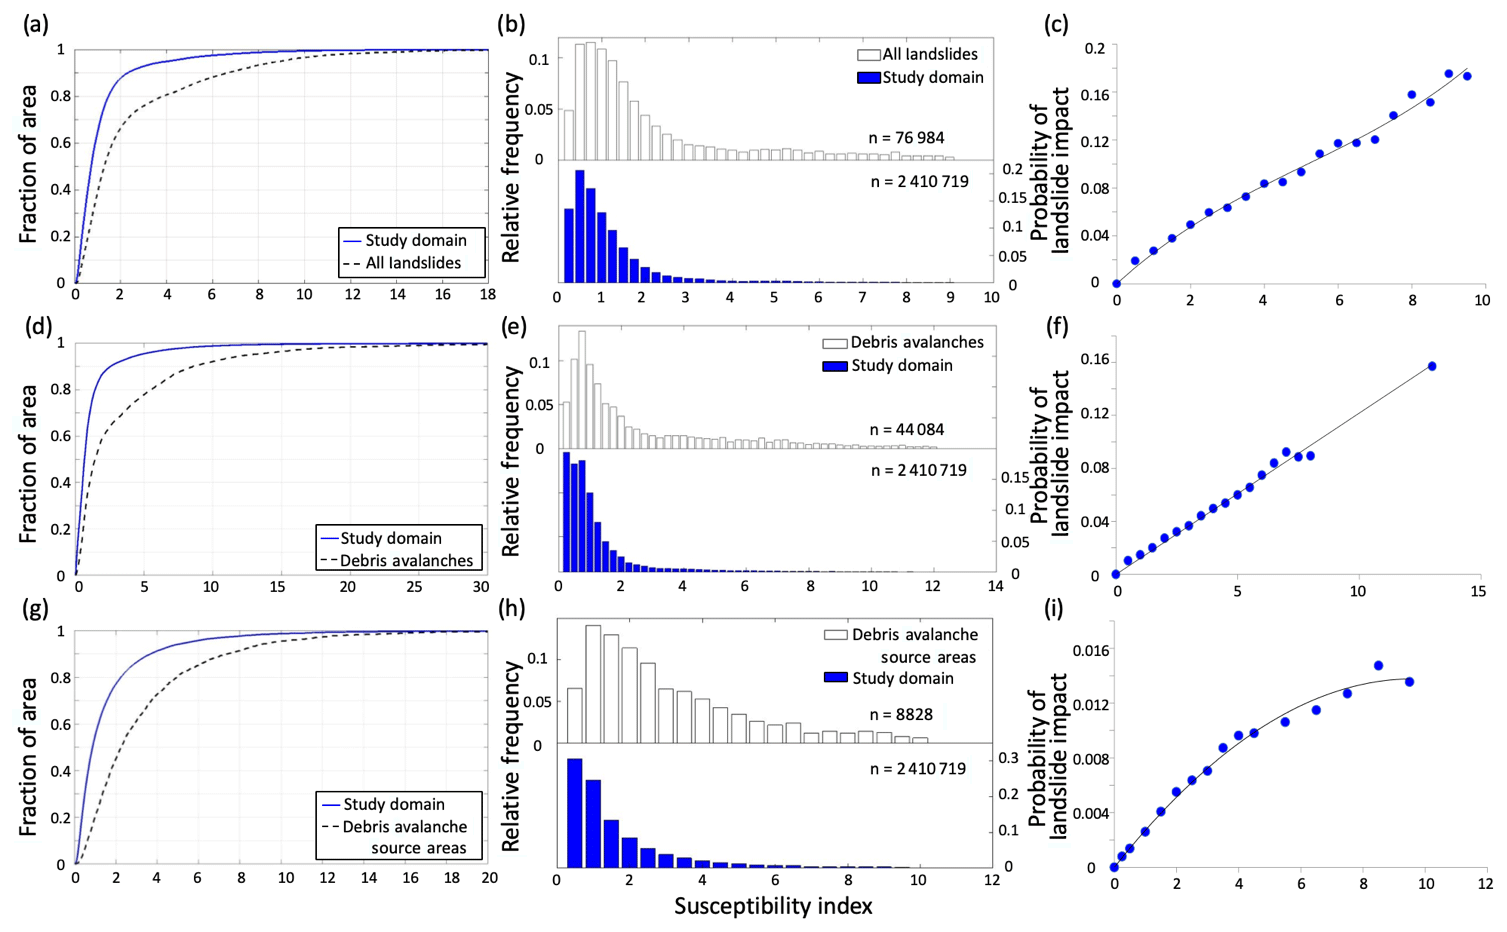
Figure 6Cumulative distributions (a, d, g) and relative frequency plots (b, e, h) of the susceptibility index (SI) for all grid cells included in the analysis and the grid cells contained within mapped landslides. The probability of a landslide impact, P(LSr|SIr), calculated from the ratio of the number of landslide cells to the number of all cells within each SI bin, with fitted curves (c, f, i). Rows represent analysis domains: all landslide types (a–c); debris avalanches (d–f); and debris avalanche source areas (g–i).
The probabilities of a landslide impact, P(LSr|SIr), calculated from Eq. (4) are shown in the third column of Fig. 6 (Fig. 6c, f, and i). In calculating this probability in the highest SI bins (e.g., SI ≥ 8), landslide sample sizes of about 500 or fewer were aggregated into the previous bin. In all three cases, P(LSr|SIr) increases with SI, supporting the statistical power of this empirical approach. The SI-to-P(LSr|SIr) relation is explained by a linear function when debris avalanche data are used (Fig. 6f). The other two cases, with all landslide data and debris avalanche source areas, are better represented by polynomial fits (Fig. 6c and i). The range of probabilities grows with the sample size of the landslide dataset used, leading to maximum probabilities of 0.2, 0.16, and 0.017 for all landslides, debris avalanches, and debris avalanche source areas, respectively. These functions were used to develop continuous empirical probability maps based on SI values assigned to each grid cell of the study domain, limited to the maximum empirical probability of each landslide type.
3.3 Landslide hazard maps
The probability of landslide impacts estimated from SI, P(LSr|SIr), declines as the amount of observational information decreases from all landslides (Fig. 7a), to debris avalanches (Fig. 7b), and debris avalanche source areas (Fig. 7c). This pattern reflects the smaller area of observed landslide data used in each case compared to the study domain. Additionally, the probability of any landslide activity would be expected to be higher than the probability of initiating a debris avalanche alone. When considering all landslides, the highest probabilities are located near the base of valley walls and in topographic depressions or hollows (Fig. 7a). The hazard map developed from the empirical model using only debris avalanches (Fig. 7b) also shows higher probabilities in the valley bottoms, but these probabilities are lower than the map of all landslides at higher elevations in alpine areas, where the footprint of debris avalanches is smaller compared to the deposition area, reducing the overall probabilities in the FR approach. Spatial patterns of landslide probabilities obtained from the source areas of debris avalanches (Fig. 7c) depart from the other two empirical models with the highest probabilities in middle and upper portions of valley walls, similar to the process model (Fig. 8b). Thus, the empirically based modeling using only source areas appears to capture some of the physical processes initiating debris avalanches. Closeup areas mapped for each mapping case more clearly illustrate the landslide hazard in relation to topographic position.
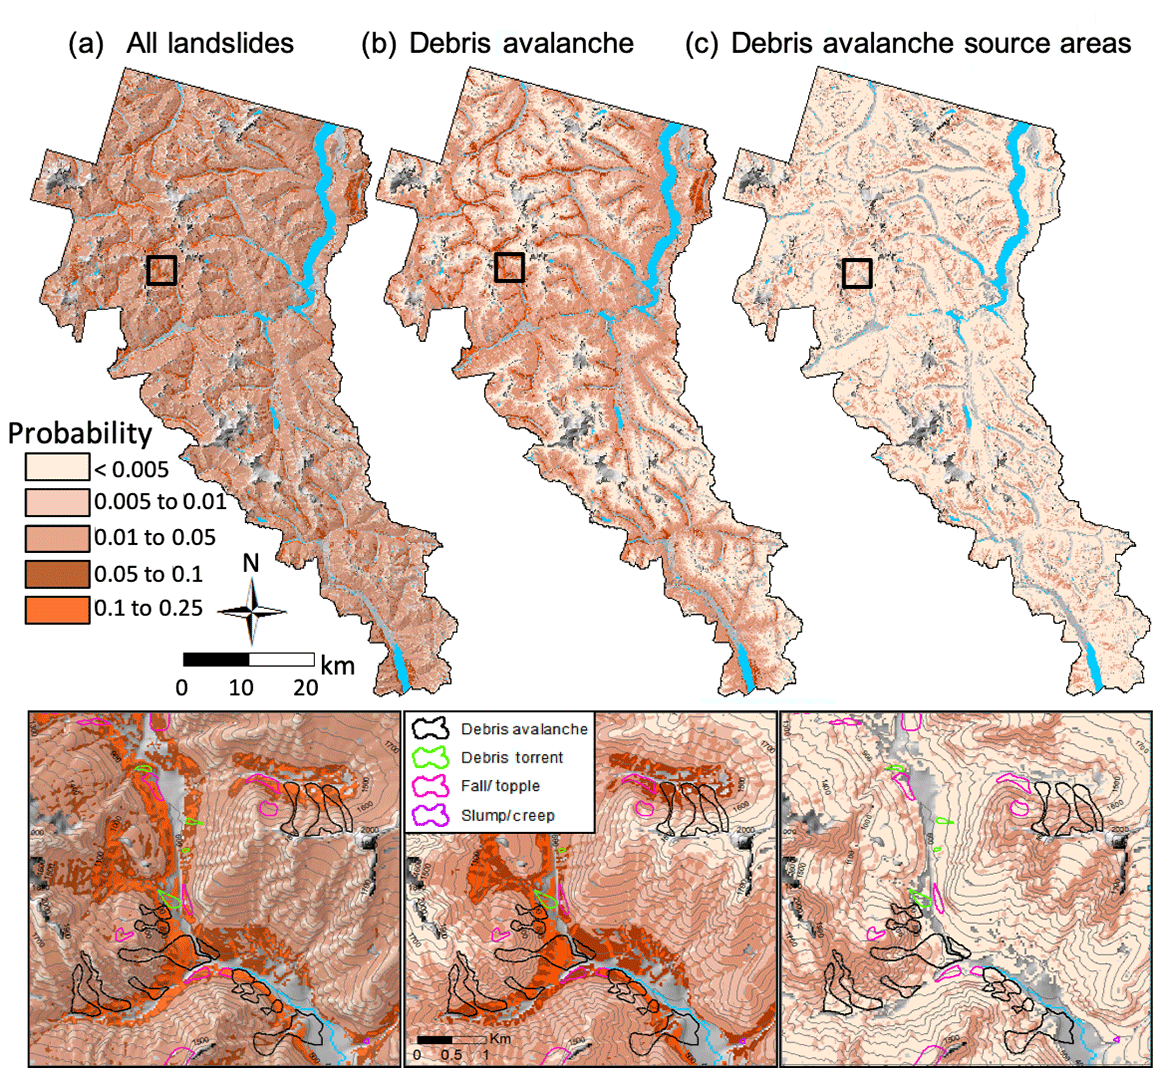
Figure 7Maps of the probability of a landslide impact derived from an empirical model based on (a) all landslide types, (b) debris avalanches, and (c) source areas of debris avalanches overlain on a hillshade raster. Black boxes indicate closeup areas shown below with overlain landslide types and 100 m contours. Gray areas excluded from the analysis show river valleys and glaciated crests.
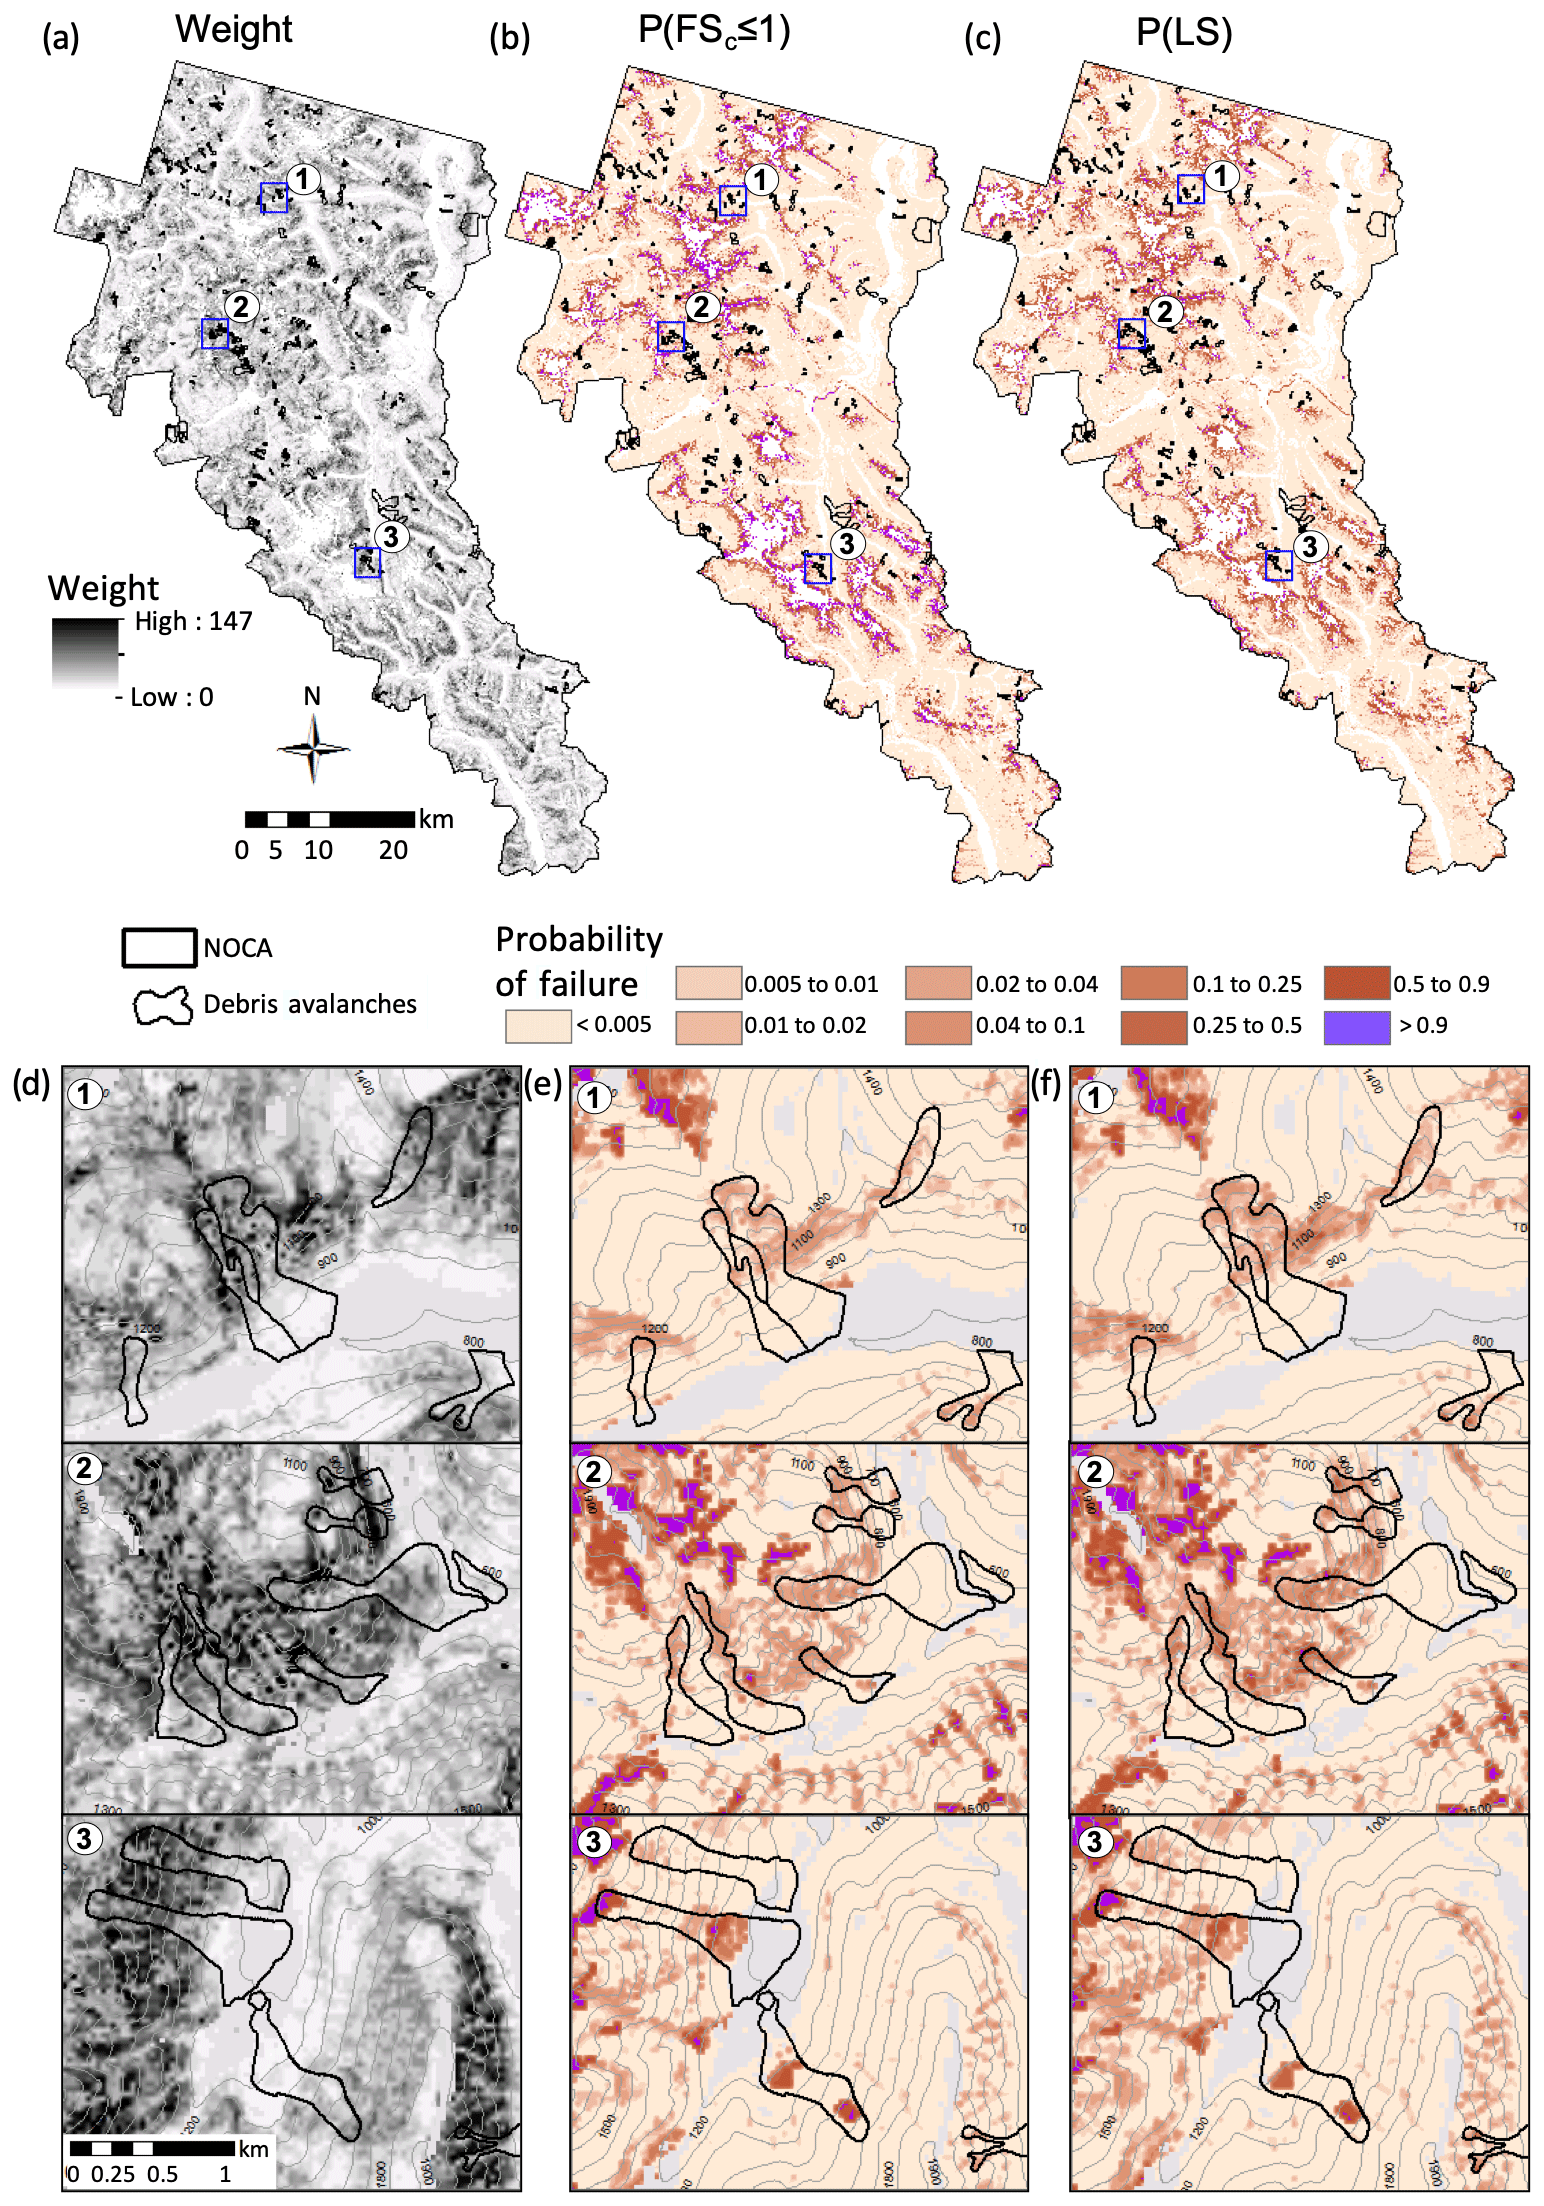
Figure 8Maps of (a) a weight term derived from joint empirical and physically based modeled probabilities, (b) P(FSc≤1) from Strauch et al. (2018), and (c) P(LS) created from multiplying (a) and (b) at each grid cell for the North Cascades National Park Complex (NOCA). Blue boxes indicate three closeup locations shown below in (d–f). Black lines show mapped debris avalanche boundaries. Gray areas are excluded from the analysis, and contours are at 100 m.
We developed a map of annual probability of shallow landslide initiation by combining the empirical SI-based probability (Fig. 7c) and the physically based annual probability of landslide initiation from Strauch et al. (2018), P(FSc≤1), using the methodology developed in this paper (Eqs. 8 and 9). The weight term, P(FSc≤1), and the P(LS) are shown in Fig. 8. Close ups of three locations are shown below the full NOCA maps.
Approximately 30 % of the analyzed cells had weights > 1. Weights are greater in high elevations and steep slopes, commensurate with debris avalanche source areas. Overall 88 % of the NOCA area has an annual landsliding probability of less than 0.1 in the P(FSc≤1) and P(LS) maps. The P(LS) map (Fig. 8c and f) shows an enhanced landslide probability in some areas already modeled as high probability for landslide impacts based on the physically based shallow landslide model (Fig. 8b and e). An anomaly map created by subtracting P(LS) from P(FSc≤1) provides an easier display of the effect of the empirical adjustment. In the anomaly map, much of the original P(FSc≤1) is adjusted by less than ±0.1 (Fig. 9). An east-facing aspect, concave curvature, and elevations in the ∼1000 to 1600 m range show an increase in probability of > 0.1 (Fig. 9). Increasing probabilities on east-facing slopes compared to other aspects align with the FR findings (Fig. 4).
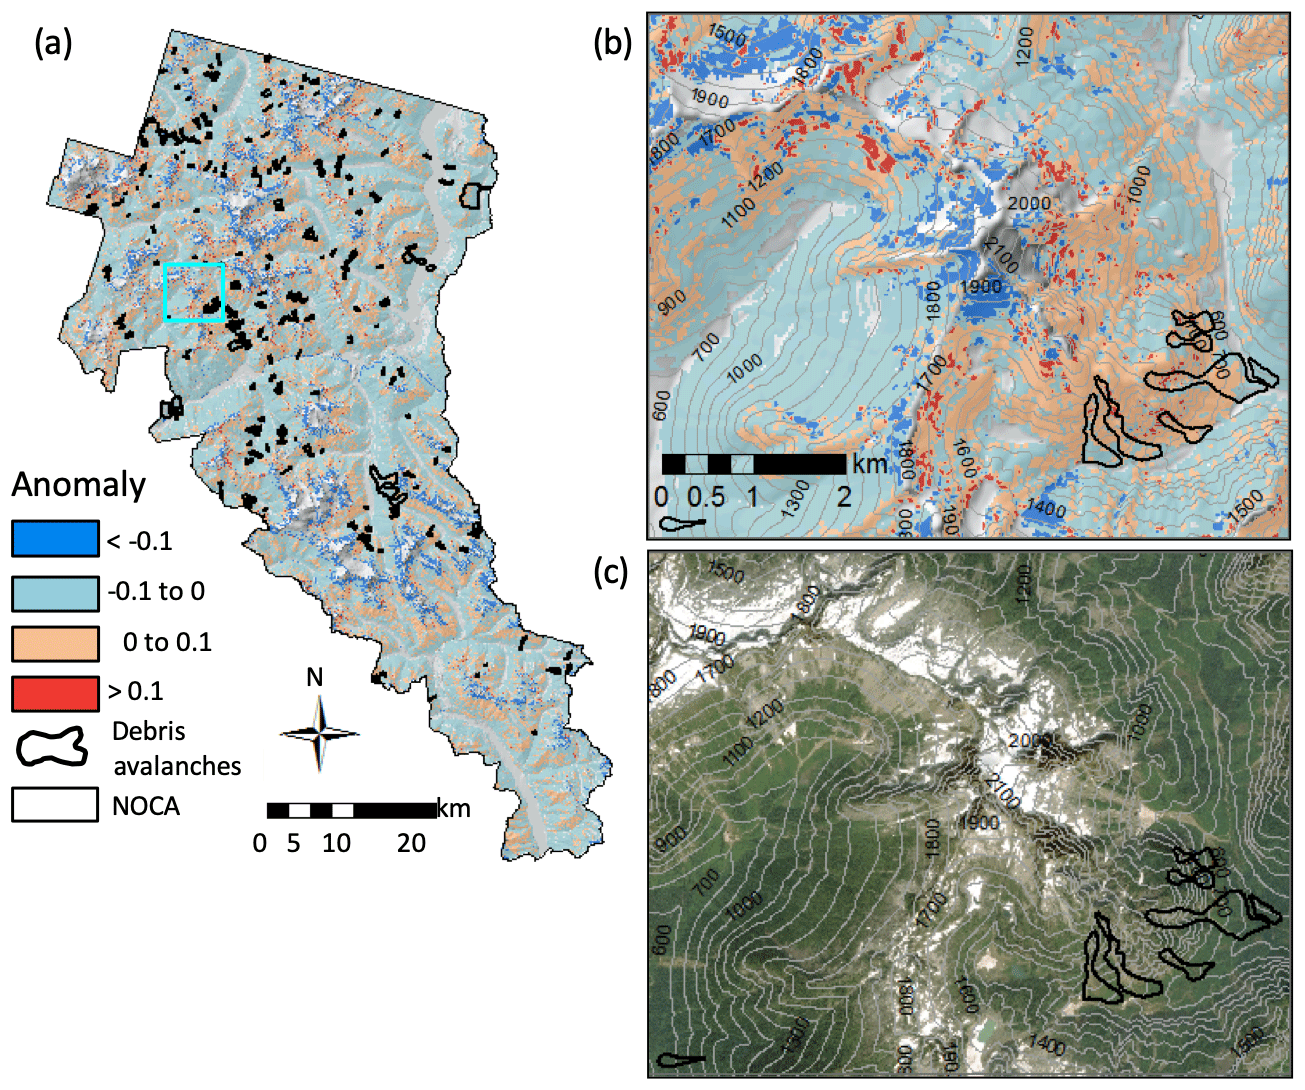
Figure 9Anomaly maps displaying the difference between P(LS) and P(FSc≤1), where blues represent >0.1 reduction in probability and reds represent >0.1 increase in probability due to the empirical adjustment. Maps of (a) the entire North Cascades National Park Complex, (b) a closeup location indicated by the cyan box in (a) overlain on a hillshade raster, and (c) an aerial image of the same location as (b). Aerial image is from World Imagery, Esri Inc. (Images were created using ArcGIS® software by Esri. ArcGIS® and ArcMap™ are the intellectual property of Esri and are used herein under license. © Esri. All rights reserved. For more information about Esri® software, please visit https://www.esri.com/en-us/home, last access: 29 October 2019). Gray areas are excluded from the analysis, and contours are at 100 m.
Other cells declined in probability, particularly on gentler slopes, north-to-west-facing aspects, and at low (<1000 m) and high (>1600 m) elevations (Fig. 9). Areas with reduced probability high on the mountain, above the elevation limit of vegetation (∼2200 m, Fig. 5), and just below actively receding glaciers or permanent snowfields likely represent limited soil development and active surface erosion where slopes are steep (Roering et al., 2003) (Fig. 9). Within the elevation range of the park, debris avalanche initiation is not frequently observed at the highest elevations where soil is thin or the landscape is covered seasonally by snow and ice.
To investigate the spatial distribution of P(FSc≤1) (Strauch et al., 2018) and empirically adjusted model probabilities, P(LS), we plot the cumulative distributions of probabilities (Fig. 10a). In roughly 15 % of the NOCA domain, P(LS) gives a landslide probability lower than P(FSc≤1), indicated by the upward shift in the cumulative distribution (blue line) (Fig. 10a). The modeled landscapes have P (Failure) ≥ 0.9 or a recurrence interval of ≤ 1.1 year of ∼6 % and ∼3 % for the P(FSc≤1) and P(LS) models, respectively (Fig. 10a). These cells represent highly unstable slopes, and the empirical adjustment reduced this area by half from the physically based model. An unconditionally unstable landslide, P (Failure) = 1 (Pack et al., 1998; Montgomery, 2001), corresponds to 0% and 2 % of the P(FSc≤1) and P(LS) models, respectively. Unconditionally stable slopes, P (Failure) = 0, correspond to 49 % of the study domain for both the P(FSc≤1) and P(LS) models (not visible in Fig. 10a). The distributions generally show a high portion (∼87 % to 88 %) of the modeled landscapes have P (Failure) ≤ 0.1 or a return period of ≥10 years. Only between 7 % and 9 % of the landscape has a wide range of potential failure (0.1 ≤ P (Failure) ≤ 0.9) as indicated by the shaded-blue area (Fig. 10a), where empirical evidence diminished the local landscape susceptibility to the initiation of shallow landslides.

Figure 10(a) Cumulative distribution of the probability of failure for the P(FSc≤1) (black) and P(LS) (blue) using only the debris avalanche source areas. (b) ROC curves for the same two datasets. The blue shaded area on (a) represents the fraction of the landscape with 0.1≤P (Failure) ≤0.9. Black diagonal dashed line on a 1:1 line in (b) represents the case of a trivial or random classification model. AUC values are 0.58 for the modeled probability and 0.60 for the integrated probability.
We anticipated that the additional consideration of the empirical model represented by the weighting term improves the performance of the purely physically based model. Thus, to assess the potential performance of the models, we statistically evaluated the models using curves of the receiver operating characteristics (ROCs) (Fawcett, 2006). This approach examines cells within mapped landslides and cells outside landslides for a study area and compares this to randomly distributed landslides over the same landscape. Confusion matrices are generated from observed and modeled landslides based on varying the probability of a landslide threshold used to generate curves of the ROCs (Mancini et al., 2010; El-Ramly et al., 2002; Anagnostopoulos et al., 2015) (Fig. 10b). A better-performing model curves towards the upper-left corner, and a curve along the 1:1 line represents a trivial model that randomly assigns landslide and non-landslide cells. The area under the curve (AUC) statistic provides a numerical indicator of model performance representing the probability of correctly assigning two randomly selected cells to landslide and non-landslide datasets (Hanley and McNeil, 1982).
Both the physically based model, P(FSc≤1), and the P(LS) perform better than a trivial model by plotting the curve of the ROC above the 1:1 line (Fig. 10b). The AUC statistic was 0.58 and 0.60 for P(FSc≤1) and P(LS), respectively. The ROCs and AUC indicate an improvement in the fraction of observed landslides captured by P(LS) over P(FSc≤1). The AUC for P(LS) indicates that there is a 60 % chance that the proposed empirical adjustment to the physically based model would classify a landslide initiation cell and a non-landslide cell correctly from two randomly sampled grid cells. The ROC analysis found that the optimal probability threshold for maximizing the observed landslides captured and minimizing false alarms was a probability threshold of 0.0006 (i.e., apex of the blue curve); thresholds less than this increased the false alarms, and thresholds greater than this reduced the accuracy of capturing observed landslides (Fig. 10b). The additional information from empirical modeling modestly improved the physically based model and indicates empirical evidence on landslides can capture mechanisms lacking in the infinite-slope stability model (Goetz et al., 2011). These include the clustering of debris avalanches due to variability in the bedrock geology (e.g., hydrothermal alteration, steeply dipping bedding planes, and glacial oversteepening). Additional validation approaches, such as separating landslide data into training and testing datasets, may yield additional findings that are deferred to future studies.
Empirically based probability hazard maps were developed from a statistically based susceptibility index, which integrated the influence of site attributes on observed landslides based on a frequency ratio approach. The resulting susceptibility depends on the observations of the landslides considered: all types of landslides, debris avalanches only, or source areas of debris avalanches. Thus, the objectives of a hazard identification study dictate the necessary inventory of landslide features. The empirically based probability model based on source areas was used to adjust a previously developed physically based probabilistic model through a calculated weighting term developed from a joint spatial probability. The frequency analysis, hazard map development, and integrated-probability model identified several key findings when applied to a national park.
-
The frequency analysis shows a clear and growing control of local slopes greater than 35∘ on landslide initiation, while higher landslide hazards at gentler slopes (<30∘) reflect transport and depositional processes.
-
The debris avalanche source areas are associated with mid-to-high elevation (1400 to 1800 m), while all landslide types and whole debris avalanches have a growing impact in lower elevations (<1200 m) with the highest impact falling in elevations < 400 m.
-
The slope is a key attribute for the initiation of landslides, while lithology is mainly tied to transport and depositional processes.
-
The transition from subalpine to alpine herbaceous vegetation with lower root cohesion correlates with a higher frequency of debris avalanche initiation.
-
The east and west aspects are positive and negative landslide-influencing factors, respectively, likely due to differences in the moisture regime and forest cover and associated root cohesion.
-
The empirical statistical modeling used to adjust a physically based model of landslide initiation improved the predictability of observed landslides by accounting for additional factors that influence the landscape's susceptibility to failure not represented in the physically based model.
-
Empirical adjustments generally lowered the probability of failure of the physically based model, especially for 0.1≤P (failure) ≤0.9 that covered between 7 % to 9 % of the study area.
As the occurrence of landslide runout is conditioned on the failure of source areas, future studies could combine the probabilistic initiation methodology we propose in this paper with a landslide runout model to improve the prediction of hazards from entire landslides. The applicability of our approach to characterize shallow landslide hazards is limited by the quality of the site-specific data on soils and vegetation, the extent of hydrologic modeling, as well as the accuracy and completeness of the landslide inventory. Accurate data for environmental variables such as the geology, soils, and vegetation would be as important as comprehensive landslide data, as the empirical approach relates landslide hazards to the environmental variables. Although the approach is applicable elsewhere, our results from the empirical analyses are specific to the region in which they were developed and may differ in another location with a different geology and landslide inventories. Additionally, the probabilities are likely to change as local conditions change from disturbances such as fires or as the climate continues to change. Advancements in surface terrain delineation and in distributed hydrologic modeling specifically contribute to the broad applicability of this approach. We provide multiple landslide hazard maps for the national park that land managers can use for planning and decision-making, as well as educating the public about hazards from landslides so they can minimize risks from these geohazards.
The data used in this analysis are available on HydroShare at
https://doi.org/10.4211/hs.6d8c3c46f4c8422796f28584eb9bdfaa (Strauch et al., 2019).
RS and EI designed the research, developed the models, performed the simulations, and created the figures. JR provided landslide and geology data as well as insights into the approach and model demonstration. RS prepared the paper with contributions from all co-authors.
The authors declare that they have no conflict of interest.
This article is part of the special issue “Advances in computational modelling of natural hazards and geohazards”. It is a result of the Geoprocesses, geohazards – CSDMS 2018, Boulder, USA, 22–24 May 2018.
We thank Stephen Dorsch of the North Cascades National Park Complex for providing electronic copies of landslide data and reports. Dan Miller and Christina Bandaragoda provided helpful suggestions on preliminary results.
This research has been supported by the US National Science Foundation (grant nos. CBET-1336725 and ICER-1663859, PREEVENTS) and by a Department of the Interior USGS Northwest Climate Adaptation Science Center graduate fellowship awarded to Ronda Strauch (grant no. GS240B-B).
This paper was edited by Albert J. Kettner and reviewed by two anonymous referees.
Agee, J. K. and Kertis, J.: Forest types of the north Cascades National Park Service complex, Can. J. Bot., 65, 1520–1530, 1987.
Aleotti, P. and Chowdhury, R.: Landslide hazard assessment: summary review and new perspectives, B. Eng. Geol. Environ., 58, 21–44, 1999.
Anagnostopoulos, G. G., Fatichi, S., and Burlando, P.: An advanced process-based distributed model for the investigation of rainfall-induced landslides: The effect of process representation and boundary conditions, Water Resour. Res., 51, 7501–7523, 2015.
Ayalew, L., Yamagishi, H., and Ugawa, N.: Landslide susceptibility mapping using GIS-based weighted linear combination, the case in Tsugawa area of Agano River, Niigata Prefecture, Japan, Landslides, 1, 73–81, 2004.
Baum, R. L., Galloway, D. L., and Harp, E. L.: Landslide and land subsidence hazards to pipelines, US Geological Survey Open-File Report 2008-1164, US Geological Survey, Reston, Virginia, 192 pp., 2008.
Beaty, C. B.: Landslides and Slope Exposure, J. Geol., 64, 70–74, 1956.
Bellugi, D., Milledge, D. G., Dietrich, W. E., Perron, J. T., and McKean, J.: Predicting shallow landslide size and location across a natural landscape: Application of a spectral clustering search algorithm, J. Geophys. Res.-Earth, 120, 2552–2585, 2015.
Beven, K. J. and Kirkby, M. J.: A physically based, variable contributing area model of basin hydrology, Hydrolog. Sci. J., 24, 43–69, 1979.
Bordoni, M., Meisina, C., Valentino, R., Bittelli, M., and Chersich, S.: Site-specific to local-scale shallow landslides triggering zones assessment using TRIGRS, Nat. Hazards Earth Syst. Sci., 15, 1025–1050, https://doi.org/10.5194/nhess-15-1025-2015, 2015.
Borga, M., Fontana, G. D., and Cazorzi, F.: Analysis of topographic and climatic control on rainfall-triggered shallow landsliding using a quasi-dynamic wetness index, J. Hydrol., 268, 56–71, 2002.
Carrara, A., Cardinali, M., Guzzetti, F., and Reichenback, P.: GIS technology in mapping landslide hazards, in: Geographical Information System in Assessing Natural Hazard, edited by: Carrara, A. and Guzzetti, F., Springer, Dordrecht, 135–175, 1995.
Carson, M. A. and Kirkby, M. J.: Hillslope Form and Process, Cambridge University Press, Cambridge, UK, 475 pp., 1972.
Cevasco, A., Pepe, G., and Brandolini, P.: The influences of geological and land use settings on shallow landslides triggered by an intense rainfall event in a coastal terraced environment, B. Eng. Geol. Environ., 73, 859–875, 2014.
Chalkias, C., Ferentinou, M., and Polykretis, C.: GIS-based landslide susceptibility mapping on the Peloponnese Peninsula, Greece, Geosciences, 4, 176–190, 2014.
Chung, C. J. and Fabbri, A. G.: Modeling the conditional probability of the occurrence of future landslides in a study area characterized by spatial data, Int. Arch. Photogram. Remote Sens. Spat. Inform. Sci., 34, 124–131, 2002.
Coe, J. A.: Landslide hazards and climate change: A perspective from the United States, in: Slope safety preparedness for impact of climate change, Chapter: 14, edited by: Ho, K., Lacasse, S., and Picarelli, L., CRC Press, Boca Raton, FL, 479–523, 2016.
Collins, B. D. and Montgomery, D. R.: The legacy of Pleistocene glaciation and the organization of lowland alluvial process domains in the Puget Sound region, Geomorphology, 126, 174–185, 2011.
Corominas, J., Van Westen, C., Frattini, P., Cascini, L., Malet, J. P., Fotopoulou, S., Catani, F., Van Den Eeckhaut, M., Mavrouli, O., Agliardi, F., and Pitilakis, K.: Recommendations for the quantitative analysis of landslide risk, B. Eng. Geol. Environ., 73, 209–263, 2014.
Croke, J. C. and Hairsine, P. B.: Sediment delivery in managed forests: a review, Environ. Rev., 14, 59–87, 2006.
Crozier, M. J.: Deciphering the effect of climate change on landslide activity: A review, Geomorphology, 124, 260–267, 2010.
Dai, F. C. and Lee, C. F.: Landslide characteristics and slope instability modeling using GIS, Lantau Island, Hong Kong, Geomorphology, 42, 213–228, 2002.
Densmore, A. L., Anderson, R. S., McAdoo, B. G., and Ellis, M. A.: Hillslope evolution by bedrock landslides, Science, 275, 369–372, 1997.
DOI-NPS – United States Department of the Interior, National Park Service: Foundation Document, North Cascades National Park Complex, Washington, available at: https://www.nps.gov/noca/learn/management/upload/North-Cascades-NP-Complex-Foundation-Document_small.pdf, (last access: 23 January 2017), 2012.
El-Ramly, H., Morgenstern, N. R., and Cruden, D. M.: Probabilistic slope stability analysis for practice, Can. Geotech. J., 39, 665–683, 2002.
Ercanoglu, M. and Sonmez, H.: General Trends and New Perspectives on Landslide Mapping and Assessment Methods. In Environmental Information Systems: Concepts, Methodologies, Tools, and Applications, IGI Global, Hershey, Pennsylvania, 64–93, https://doi.org/10.4018/978-1-5225-7033-2.ch004, 2019.
Evans, R. D. and Fonda, R. W.: The influence of snow on subalpine meadow community pattern, North Cascades, Washington, Can. J. Bot., 68, 212–220, 1990.
Fawcett, T.: An introduction to ROC analysis, Pattern Recogn. Lett., 27, 861–874, 2006.
Fischer, L., Kääb, A., Huggel, C., and Noetzli, J.: Geology, glacier retreat and permafrost degradation as controlling factors of slope instabilities in a high-mountain rock wall: the Monte Rosa east face, Nat. Hazards Earth Syst. Sci., 6, 761–772, https://doi.org/10.5194/nhess-6-761-2006, 2006.
Gabet, E. J.: Sediment transport by dry ravel, J. Geophys. Res.-Solid, 108, 2049, https://doi.org/10.1029/2001JB001686, 2003.
Geroy, I. J., Gribb, M. M., Marshall, H. P., Chandler, D. G., Benner, S. G., and McNamara, J. P.: Aspect influences on soil water retention and storage, Hydrol. Process., 25, 3836–3842, https://doi.org/10.1002/hyp.8281, 2011.
Ghirotti, M.: The 1963 Vaiont landslide, Italy, in: Landslides: Types, mechanisms and modeling, edited by: Claque, J. J. and Stead, D., Cambridge University Press, New York, NY, 359 pp., 2012.
Goetz, J. N., Guthrie, R. H., and Brenning, A.: Integrating physical and empirical landslide susceptibility models using generalized additive models, Geomorphology, 129, 376–386, https://doi.org/10.1016/j.geomorph.2011.03.001, 2011.
Gokceoglu, C., Sonmez, H., Nefeslioglu, H. A., Duman, T. Y., and Can, T.: The 17 March 2005 Kuzulu landslide (Sivas, Turkey) and landslide-susceptibility map of its near vicinity, Eng. Geol., 81, 65–83, 2005.
Gupta, R. P. and Joshi, B. C.: Landslide hazard zoning using the GIS approach – a case study from the Ramganga catchment, Himalayas, Eng. Geol., 28, 119–131, 1990.
Haeberli, W., Schaub, Y., and Huggel, C.: Increasing risks related to landslides from degrading permafrost into new lakes in de-glaciating mountain ranges, Geomorphology, 293, 405–417, https://doi.org/10.1016/j.geomorph.2016.02.009, 2017.
Hales, T. C., Ford, C. R., Hwang, T., Vose, J. M., and Band, L. E.: Topographic and ecologic controls on root reinforcement, J. Geophys. Res., 114, F03013, https://doi.org/10.1029/2008JF001168, 2009.
Hamlet, A. F., Elsner, M. M., Mauger, G., Lee, S., and Tohver, I.: An Overview of the Columbia Basin Climate Change Scenarios Project: Approach, Methods, and Summary of Key Results, Atmos. Ocean., 51, 392–415, 2013.
Hanley, J. A. and McNeil, B. J.: The meaning and use of the area under a receiver operating characteristic (ROC) curve, Radiology, 143, 29–36, 1982.
Haugerud, R. A. and Tabor, R. W.: Geologic map of the North Cascade Range, Washington, US Department of the Interior, US Geological Survey, Denver, Colorado, 29 pp., 2009.
Hobley, D. E. J., Adams, J. M., Nudurupati, S. S., Hutton, E. W. H., Gasparini, N. M., Istanbulluoglu, E., and Tucker, G. E.: Creative computing with Landlab: an open-source toolkit for building, coupling, and exploring two-dimensional numerical models of Earth-surface dynamics, Earth Surf. Dynam., 5, 21–46, https://doi.org/10.5194/esurf-5-21-2017, 2017.
Hong, H., Chen, W., Xu, C., Youssef, A. M., Pradhan, B., and Tien Bui, D.: Rainfall-induced landslide susceptibility assessment at the Chongren area (China) using frequency ratio, certainty factor, and index of entropy, Geocarto Int., 32, 139–154, 2017.
Hungr, O.: A review of landslide hazard and risk assessment methodology, in: Landslides and engineered slopes. Experience, theory and practice, edited by: Aversa, S., Cascini, L., Picarelli, L., and Scavia, C., CRC Press, Boca Raton, FL, 3–27, 2018.
Hungr, O., Leroueil, S., and Picarelli, L.: The Varnes classification of landslide types, an update. Landslides, 11, 167–194, 2014.
Jin, S., Yang, L., Danielson, P., Homer, C., Fry, J., and Xian, G.: A comprehensive change detection method for updating the National Land Cover Database to circa 2011, Remote Sens. Environ., 132, 159–175, 2013.
Kelsey, H. M.: Formation of inner gorges, Catena, 15, 433–458, 1988.
Kirschbaum, D. B., Adler, R., Hong, Y., Kumar, S., Peters-Lidard, C., and Lerner-Lam, A.: Advances in landslide nowcasting: evaluation of global and regional modeling approach, Environ. Earth. Sci., 66, 1683–1696, 2012.
LaHusen, S. R., Duvall, A. R., Booth, A. M., and Montgomery, D. R.: Surface roughness dating of long-runout landslides near Oso, Washington (USA), reveals persistent postglacial hillslope instability, Geology, 44, 111–114, 2016.
Lee, S. and Pradhan, B.: Landslide hazard mapping at Selangor, Malaysia using frequency ratio and logistic regression models, Landslides, 4, 33–41, 2007.
Lee, S., Ryu, J. H., and Kim, I. S.: Landslide susceptibility analysis and its verification using likelihood ratio, logistic regression, and artificial neural network models: Case study of Youngin, Korea, Landslides, 4, 327–338, 2007.
Lepore, C., Kamal, S. A., Shanahan, P., and Bras, R. L.: Rainfall-induced landslide susceptibility zonation of Puerto Rico, Environ. Earth Sci., 66, 1667–1681, 2012.
Liang, X., Lettenmaier, D. P., Wood, E. F., and Burges, S. J.: A simple hydrologically based model of land surface water and energy fluxes for GSMs, J. Geophys. Res., 99, 14415–14428, 1994.
Mancini, F., Ceppi, C., and Ritrovato, G.: GIS and statistical analysis for landslide susceptibility mapping in the Daunia area, Italy, Nat. Hazards Earth Syst. Sci., 10, 1851–1864, https://doi.org/10.5194/nhess-10-1851-2010, 2010.
May, C. L., Pryor, B., Lisle, T. E., and Lang, M.: Coupling hydrodynamic modeling and empirical measures of bed mobility to predict the risk of scour and fill of salmon redds in a large regulated river, Water Resour. Res., 45, W05402, https://doi.org/10.1029/2007WR006498, 2009.
Megahan, W. F., Day, N. F., and Bliss, T. M.: Landslide occurrence in the western and central Northern Rocky Mountain physiographic province in Idaho, in: Forest Soils and Land Use: Proceedings of the Fifth North American Forest Soils Conference, edited by: Youngberg, C. T., CSU, Ft. Collins, CO, 116–139, 1978.
Miller, D. J. and Burnett, K. M.: Effects of forest cover, topography, and sampling extent on the measured density of shallow, translational landslides, Water Resour. Res., 43, W03433, https://doi.org/10.1029/2005WR004807, 2007.
Montgomery, D. R.: Road surface drainage, channel initiation, and slope instability, Water Resour. Res., 30, 1925–1932, 1994.
Montgomery, D. R.: Slope distributions, threshold hillslopes, and steady-state topography, Am. J. Sci., 301, 432–454, 2001.
Mustoe, G. E. and Leopold, E. B.: Paleobotanical evidence for the post-Miocene uplift of the Cascade Range, Can. J. Earth Sci., 51, 809–824, 2014.
O'Loughlin, E. M.: Prediction of surface saturation zones in natural catchments by topographic analysis, Water Resour. Res., 22, 794–804, 1986.
Pachauri, A. K. and Pant, M.: Landslide hazard mapping based on geological attributes, Eng. Geol., 32, 81–100, 1992.
Pack, R. T., Tarboton, D. G., and Goodwin, C. N.: The SINMAP approach to terrain stability mapping, in: Proceedings of the 8th international congress of the international association of engineering geology and the environment, vol. 2, 21–25 September 1998, Vancouver, British Columbia, Canada, AA Balkema, Rotterdam, 1157–1165, 1998.
Pelto, M. S. and Riedel, J.: Spatial and temporal variations in annual balance of North Cascade glaciers, Washington 1984–2000, Hydrol. Process., 15, 3461–3472, 2001.
Pollock, M. M.: Biodiversity, in: River Ecology and Management: Lessons From the Pacific Coastal Ecoregion, edited by: Naiman, R. J. and Bilby, R. E., Springer-Verlag, New York, 430–452, 1998.
Poulos, M. J., Pierce, J. L., Flores, A. N., and Benner, S. G.: Hillslope asymmetry maps reveal widespread, multi-scale organization, Geophys. Res. Lett., 39, L06406, https://doi.org/10.1029/2012GL051283, 2012.
Reichenbach, P., Rossi, M., Malamud, B. D., Mihir, M., and Guzzetti, F.: A review of statistically-based landslide susceptibility models, Earth-Sci. Rev., 180, 60–91, 2018.
Riedel, J. L. and Probala, J.: Mapping ecosystems at the landform scale in Washington state, Park Science, 23, 37–42, 2005.
Riedel, J. L., Haugerud, R. A., and Clague, J. J.: Geomorphology of a Cordilleran Ice Sheet drainage network through breached divides in the North Cascades Mountains of Washington and British Columbia, Geomorphology, 91, 1–18, 2007.
Riedel, J. L., Dorsch, S., and Wenger, J.: Geomorphology of the Stehekin River watershed: Landform mapping at North Cascades National Park Service Complex, Washington, Natural Resource Technical Report NPS/NCCN/NRTR-2012/566, National Park Service, Fort Collins, Colorado, 90 pp., 2012.
Roe, G. H.: Orographic Precipitation, Annu. Rev. Earth Planet. Sci., 33, 645–671, 2005.
Roering, J. J., Schmidt, K. M., Stock, J. D., Dietrich, W. E., and Montgomery, D. R.: Shallow landsliding, root reinforcement, and the spatial distribution of trees in the Oregon Coast Range, Can. Geotech. J., 40, 237–253, 2003.
Sidle, R. C. and Ochiai, H.: Landslides: processes, prediction, and land use, Water Resources Monogram 18, American Geophysical Union, Washington, D.C., 2006.
Strauch, R., Istanbulluoglu, E., Nudurupati, S. S., Bandaragoda, C., Gasparini, N. M., and Tucker, G. E.: A hydro-climatological approach to predicting regional landslide probability using Landlab, Earth Surf. Dynam., 6, 49–75, https://doi.org/10.5194/esurf-6-49-2018, 2018.
Strauch, R., Istanbulluoglu, E., Riedel, J.: A New Approach to Mapping Landslide hazards: a probabilistic integration of empirical and physically based models in the North Cascades of Washington, USA – Research Data, HydroShare, https://doi.org/10.4211/hs.6d8c3c46f4c8422796f28584eb9bdfaa, 2019.
Swanson, F. J. and Dyrness, C . T .: Impact of clear-cutting and road construction on soil erosion by landslides in the western Cascade Range, Oregon, Geology, 3, 393–396, 1975.
Tabor, R. W. and Haugerud, R. A.: Geology of the North Cascades: a mountain mosaic, The Mountaineers Books, Seattle, WA, 1999.
Taylor, F. A. and Brabb, E. E.: Map showing landslides in California that have caused fatalities or at least $1,000,000 in damages from 1906 to 1984, US Geological Survey Miscellaneous Field Studies Map, MF-1867, scale: 1:1 000 000, US Geological Survey, Reston, Virginia, https://doi.org/10.3133/ofr86100, 1986.
USGS – United States Geological Survey: National Elevation Data last modified March 6, 2014, National Map Viewer, available at: https://www.nrcs.usda.gov/wps/portal/nrcs/detail/national/?&cid=nrcs143_021626 (last access: 24 November 2014), 2014a.
USGS: National Land Cover Data (NLCD) version Marched 31, 2014, National Map Viewer, available at: https://www.usgs.gov/core-science-systems/national-geospatial-program/land-cover (last access: 25 November 2014), 2014b.
Van Westen, C. J., Van Asch, T. W., and Soeters, R.: Landslide hazard and risk zonation – why is it still so difficult?, B. Eng. Geol. Environ., 65, 167–184, 2006.
WADNR – Washington State Department of Natural Resources: Geologic_unit_poly_100k, Vector digital data, published June 2010, Division of Geology and Earth Resources, Olympia, WA, available at: https://www.dnr.wa.gov/programs-and-services/geology/publications-and-data/gis-data-and-databases, last access: 27 March 2014.
Wartman, J., Montgomery, D. R., Anderson, S. A., Keaton, J. R., Benoît, J., dela Chapelle, J., and Gilbert, R.: The 22 March 2014 Oso landslide, Washington, USA, Geomorphology, 253, 275–288, 2016.
Wooten, R. M., Witt, A. C., Miniat, C. F., Hales, T. C., and Aldred, J. L.: Frequency and magnitude of selected historical landslide events in the southern Appalachian Highlands of North Carolina and Virginia: relationships to rainfall, geological and ecohydrological controls, and effects, in: Natural Disturbances and Historic Range of Variation, edited by: Greenberg, C. H. and Collins, B. S., Springer International Publishing, Switzerland, 203–262, https://doi.org/10.1007/978-3-319-21527-3, 2016.
Wu, Z., Wu, Y., Yang, Y., Chen, F., Zhang, N., Ke, Y., and Li, W.: A comparative study on the landslide susceptibility mapping using logistic regression and statistical index models, Arab. J. Geosci., 10, 187, 2017.