the Creative Commons Attribution 4.0 License.
the Creative Commons Attribution 4.0 License.
 | 28 Jan 2019
Response time to flood events using a social vulnerability index (ReTSVI)
Alvaro Hofflinger
Marcelo A. Somos-Valenzuela
Arturo Vallejos-Romero
Current methods to estimate evacuation time during a natural disaster do not consider the socioeconomic and demographic characteristics of the population. This article develops the Response Time by Social Vulnerability Index (ReTSVI). ReTSVI combines a series of modules that are pieces of information that interact during an evacuation, such as evacuation rate curves, mobilization, inundation models, and social vulnerability indexes, to create an integrated map of the evacuation rate in a given location. We provide an example of the application of ReTSVI in a potential case of a severe flood event in Huaraz, Peru. The results show that during the first 5 min of the evacuation, the population that lives in neighborhoods with a high social vulnerability evacuates 15 % and 22 % fewer people than the blocks with medium and low social vulnerability. These differences gradually decrease over time after the evacuation warning, and social vulnerability becomes less relevant after 30 min. The results of the application example have no statistical significance, which should be considered in a real case of application. Using a methodology such as ReTSVI could make it possible to combine social and physical vulnerability in a qualitative framework for evacuation, although more research is needed to understand the socioeconomic variables that explain the differences in evacuation rate.
- Article
(4565 KB) - Full-text XML
- BibTeX
- EndNote


The costs associated with health, food security, and the physical environment produced by climate change are expected to reach between USD 2 and 4 trillion by 2030 (Hallegatte, 2014). The United Nations has indicated that the frequency and severity of climate-change-related natural disasters are expected to increase faster than risk reduction can be achieved (UN, 2009). For example, worldwide natural disasters caused around USD 3.5 trillion in damages from 1980 to 2011, with a third taking place in low- or middle-income countries and the number of people affected by natural disasters increasing 1.5 times, economic damage 1.8 times, and total deaths doubling (Basher, 2006; Hallegatte, 2014).
A key strategy to reduce the loss of human life during a disaster is to improve community preparedness. A common means to achieve this is to develop early warning systems (EWSs) to alert the population to evacuate before disaster strikes. Ideally, EWSs should consider not only the so-called physical dimensions such as exposure and intensity, but also the human or social dimensions that help us understand differences in response to similar stresses (Basher, 2006; Bouwer, 2011; Nagarajan et al., 2012; Nicholls and Klein, 1999). Individual characteristics such as race, age, gender, education, income, and type of job influence the susceptibility to exposure of certain groups or communities and also define their ability to respond to a natural hazard (Cutter et al., 2003; Gaillard and Dibben, 2008). For example, women and men or those people with different levels of physical and cognitive ability experience and respond to disasters differently (Cutter and Finch, 2008; Ionescu et al., 2005; ISDR, 2004; Santos and Aguirre, 2004). Despite the evidence, the literature focuses mainly on the physical dimension of natural hazards and disregards the human aspects. A real improvement in our understanding of emergency evacuations will depend on the integration of both (Basher, 2006; Couling, 2014; Santos and Aguirre, 2004).
The real issue is how to incorporate social and physical vulnerability comprehensively to improve our understanding of an evacuation process. Both concepts have been developed independently in the social sciences and engineering; therefore, linking them is not a straightforward process. In fact, there are few data on how social vulnerability influences the evacuation process and how it is linked to the number of human casualties (Bolin, 2007; Morss et al., 2011). To address this problem, some scholars have mapped physical and social vulnerability to visualize how they overlap. They have also combined them using arithmetic operations such as multiplication or addition of social and physical vulnerability indexes to create a unique indicator that includes both vulnerabilities to study evacuation (Chakraborty et al., 2005) or the recovery process after hazards occur (Cutter and Emrich, 2006; Hegglin and Huggel, 2008). This information is still descriptive and provides policy makers, government institutions, or local governments with qualitative information to understand how a population would react in an evacuation process. Therefore, questions such as what it means to live in a neighborhood with high physical and social vulnerability and, how much time will the population need to evacuate neighborhoods with high social vulnerability and low physical vulnerability cannot be answered with the methods currently available in either social sciences or engineering.
1.1 Social vulnerability and natural disasters
Recent major natural disasters such as Hurricane Katrina and the 2010 earthquake in Haiti have shown the relevance of integrating social vulnerability into risk management and decision-making (Flanagan et al., 2011). This integration refers to identifying which problems exist where before a natural disaster strikes, making it possible to take steps to prevent possible damage (Schmidtlein et al., 2008). In this context, a better understanding of how problems like segregation, socioeconomic deprivation, and inequalities affect the type of response and the degree of resiliency of communities affected by natural disasters is crucial. With this information, federal and local governments could be more effective in mitigating losses or improving community recovery (Cutter and Emrich, 2006; Heinz Center, 2002). The degree to which communities and people are vulnerable to hazards is explained not only by proximity to potential natural disasters, but also social characteristics such as socioeconomic and demographic features that could exacerbate or lessen the impact of a disaster (Chakraborty et al., 2005; Cutter et al., 2000).
The study of vulnerability can be traced back to the early 1950s and 1960s in the field of behavioral sciences, the main objective of which was to understand the features of areas that make them suitable to inhabit. During the 1970s, the US federal government was interested in the relationship between social well-being and progress indicators; consequently, the connection between socioeconomic inequalities and social problems became clearer at that time (Cutter and Emrich, 2006). Today, the concept has broadened to include a more comprehensive approach that combines different areas, such as social, demographic, economic, and geographic vulnerability, but each discipline defines the concept differently (Alwang et al., 2001; Balica, 2012; Birkmann, 2007). For example, in the economic literature, vulnerability includes food security and sustainable development (Fekete, 2012; Rygel et al., 2006). In the disaster risk community, vulnerability is defined as the physical, social, and environmental factors that increase the likelihood of a community being impacted by hazards (Zhou et al., 2014); social vulnerability models in this area have been used to explain a community's ability to face and recover from disasters (Chakraborty et al., 2005).
Scholars have tried to understand whether a population's socioeconomic and demographic characteristics are relevant to understanding why neighborhoods or communities respond differently during an evacuation, why some people evacuate and others do not during disasters. Huang et al. (2016) analyzed 49 studies conducted since 1991 linking evacuations to hurricane warnings and they concluded that demographic variables have a minor or inconsistent impact on household evacuations. In the case of floods, however, we found few studies that seek to understand the relationship between evacuation and socioeconomic variables. For example, Henry et al. (2017) analyzed the relationship between income disparity and disaster information collection, and the resulting impacts on people's vulnerability after the 2011 Chao Phraya River flood in Thailand. They found that among different demographic and socioeconomic variables, income was the strongest predictor of the population's decision to evacuate during the flood (p<0.01). They concluded that “among those respondents affected by the flood, it could be seen that lower-income respondents had a higher tendency not to evacuate their homes”. Furthermore, Medina and Moraca (2016) conducted a study to identify factors that influence the decision to evacuate upon flood warning by authorities in the province of Bukidnon, Philippines. They found that household income, measured as poverty, was a significant factor to explain whether families will evacuate upon advice by local authorities.
Research on social vulnerability linked to natural hazards can be divided into two groups. The first group, “post-disaster case studies”, tries to understand how natural disasters impact communities differently based on their level of social vulnerability (Rufat et al., 2015). Most of the research in this area uses qualitative methods, such as semi-structured interviews, focus groups, key informant interviews, and participant observation (Działek et al., 2016). One of the main limitations of these studies is that their findings cannot be generalized to aggregated levels such as regions, or countries. The second group is “geospatial modeling studies”. Scholars in this subfield primarily use quantitative methods and focus on creating maps or developing indexes to compare the different levels of social vulnerability among communities, regions or countries (Rufat et al., 2015). A central aim of developing techniques to quantify vulnerability is to reduce gaps between theoretical concepts of vulnerability and the decision-making process (Birkmann, 2007).
There are multiple challenges in constructing an index to measure the social vulnerability of a certain population. The most evident is the degree of subjectivity in the selection of variables as well as the application and operationalization of vulnerability as a concept (Fekete, 2012). Furthermore, an index does not indicate the structure and causes of social vulnerability; therefore, using a single factor to measure vulnerability might disregard the importance of particular variables that are relevant to explaining social vulnerability in a particular area (Rygel et al., 2006). In fact, a community's ability to cope with and recover from disaster seems to also depend on other factors such as vigor, vitality, energy, strength, etc., which are usually excluded from studies on social vulnerability (De Marchi, 2007; De Marchi and Scolobig, 2012). Despite these limitations, scholars have developed indexes to quantify social vulnerability based on their interests. Some researchers use the percentage of women, racial groups, or average age as indexes to estimate different levels of social vulnerability (Harvey et al., 2016; Jonkman et al., 2009; Sadia et al., 2016). Other scholars use variables linked to social vulnerability as independent variables in regression models (Działek et al., 2016); variables are simply ranked from lowest to highest values (Flanagan et al., 2011) or using the weighted average to estimate social vulnerability (Adger and Vincent, 2005). However, these indexes have some limitations; namely, they use a limited number of variables and do not consider the interrelationship among variables to quantify social vulnerability. To address this issue, researchers have employed strategies such as including a higher number of variables to construct social vulnerability indexes (SVIs) or estimating the connection among variables theoretically linked to social vulnerability. In this area, one of the most recognized indexes that has been applied in both the US and abroad is the Social Vulnerability Index (SoVI) (Cutter, 1996). The SoVI has been used in California, Colorado, and South Carolina in the US and in countries such as England, Australia, Germany, and Norway (Zhou et al., 2014). The SoVI approach has been replicated in different geographical settings and on different spatial and temporal scales (Schmidtlein et al., 2008). The use of the SoVI is relevant because the method makes it possible to compare the spatial variability in socioeconomic vulnerability using a single index value. The SoVI can also be linked spatially to physical aspects to calculate the overall vulnerability of a specific place (Boruff et al., 2005).
SVIs are useful for detecting differences in social vulnerability to flood events (Fekete, 2009). In particular, the SoVI (Cutter, 1996) is adaptable to developing countries since it can be constructed using census data from the study area.
The literature identifies several variables that contribute to social vulnerability (post-disaster). At the individual level, social vulnerability is related to poverty and health indexes, age, and education level. At the community level, social vulnerability is affected by income distribution, access to economic assets and qualitative indicators of institutional arrangements (Adger, 1999). Furthermore, Fekete (2010) identified key variables that may explain the different levels of social vulnerability such as age group, gender, income, education, home ownership, social capital, and household size. Cutter et al. (2003) also included race and ethnicity, commercial and industrial development, unemployment, rural–urban residency, residential property, infrastructure and lifelines, occupation, family structure, population growth, medical services, social dependence, and special needs populations as fundamental variables to quantify social vulnerability.
1.2 Response time, evacuation and flood impacts
Multiple factors seem to affect people's decision-making process to evacuate, including but not limited to risk perception, beliefs, demographic characteristics, previous knowledge, social networks, gender, age, and class (Elliott and Pais, 2006; Lindell et al., 2005; Mileti and O'Brien, 1992; Whitehead et al., 2000). Understanding what factors influence people's decisions in an evacuation is relevant because this information could help improve the evacuation process, for example, reducing the evacuation response time and consequently decreasing the percentage of human casualties.
The most sensitive cost of disaster is the loss of life; nonetheless, a limited number of methods estimate the loss of life due to natural disasters and only a few include social vulnerability as an explanatory variable in their models (Jonkman et al., 2008).
In ocean and river floods, variables such as the percentage of buildings collapsed and the proportion of people evacuated seem to influence the number of human fatalities (Vrouwenvelder and Steenhuis, 1997). Other scholars take into account the water level, flow velocity, possibilities for evacuation, flood hazard, and area vulnerability (Boyd et al., 2005; Jonkman, 2001). In the case of dam break floods, Brown and Graham (1988) analyzed 24 major dam failures and flash floods to estimate the number of lives lost as a function of time available for evacuation and the number of people at risk, they found that time available for evacuation and population size are critical; similar results were found by DeKay and McClelland (1993). Graham (1999) proposed that fatality rates are functions of the severity of the flood, the amount of warning time, and the population's understanding of the hazard. In another example, to estimate human casualties due to flood events, the U.S. Army Corps of Engineers developed the Hydrologic Engineering Center's Flood Impact Analysis (HEC-FIA). Models generally assume that people react the same way during an evacuation process and do not consider that people can respond differently based on their social vulnerability.
Reiter (2001) incorporated some variables linked to social vulnerability such as the number of children and elderly to estimate the loss of life during a flood event. Penning-Rowsell et al. (2005) considered “people vulnerability” defined by age, disability, or illness using census data. A general conclusion from the literature explored is that only a few of the methods studied have systematically included social vulnerability as an explanatory variable of human fatalities during natural disasters. In fact, Jonkman et al. (2008) reviewed 20 methods to quantify the loss of life during different types of flood events and found that only Ramsbottom et al. (2004) included levels of population vulnerability, and this category is based on expert judgment. Consequently, even though there is an upward trend in research that endeavors to understand how a population's social characteristics influence human response to natural disasters, academics have failed to incorporate social vulnerability into loss of life estimations (Elliott and Pais, 2006; Rodriguez et al., 2007). We argue that this is due to the lack of understanding of how social vulnerability influences the evacuation process and human casualties (Bolin, 2007; Morss et al., 2011). In fact, current methods to quantify social vulnerability allow for the classification of neighborhoods, counties, or regions from the lowest to highest levels of vulnerability. However, using these classifications scholars or policy makers cannot predict how many people from neighborhoods with low vulnerability will evacuate versus those who live in neighborhoods with high vulnerability or how much time people who live in neighborhoods with medium vulnerability will take to evacuate versus those who live in highly vulnerable areas, etc.
In order to have a methodology that enables researchers and practitioners to include social vulnerability and test if it has any impact on the evacuation process during a flood event, we propose the Response Time by Social Vulnerability Index (ReTSVI), a methodology that incorporates the demographic and socioeconomic characteristics of population into current evacuation models.
2.1 Conceptual model of ReTSVI
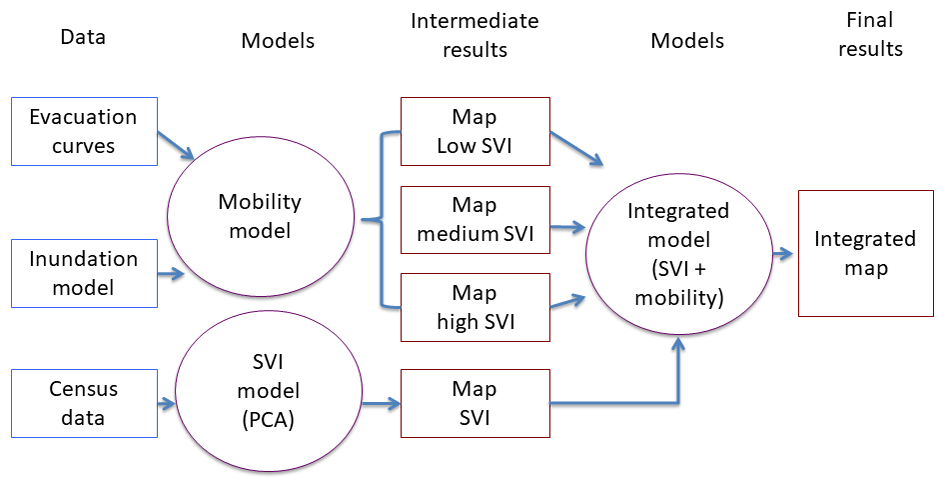
The objective of this work is to propose a conceptual model – ReTSVI – a methodology that allows for the inclusion of social vulnerability into the traditional evacuation–mobilization models and moves away from traditional methods that combine social vulnerability and hazard magnitude by ranking in a matrix system resulting in a qualitative assessment. Figure 1 is a chart of ReTSVI. We use three types of input data: (1) evacuation curves, one for each level of vulnerability (high, medium, and low); (2) a model that describes the physical hazard that the population may be exposed to, for example, the time that a flood takes to reach a populated area; and (3) demographic information such as census data that allow us to categorize the population into different levels of social vulnerability. Then we have two intermediate models. The first corresponds to the mobilization model that combines the evacuation curves and the inundation model. The results of this step are three maps (one for each level of vulnerability) of the percentage of people that evacuate before the flood strikes a place. The second intermediate model is the calculation of the SVI using the census data, which produces a map of the city where we can classify each block by social vulnerability. Finally, we combined the results (integration model Fig. 1) from the mobilization model and the SVI calculations to generate a map with the percentage of people that can evacuate, which includes their social vulnerability level.
2.2 Application of ReTSVI in a potential flood in Huaraz, Peru
In 1941, the city of Huaraz was affected by a glacial lake outburst flood (GLOF) generated at Lake Palcacocha in the Cordillera Blanca, Peru (Fig. 2). The GLOF killed approximately 2000 people and damaged infrastructure all the way from the lake to the Pacific Ocean (Carey, 2010, 2005; Wegner, 2014). According to new observations and data, a new GLOF could occur at this location. In fact, Lake Palcacocha has been declared to be in a state of emergency several times, and there are currently initiatives to mitigate the risk by lowering the water level and installing EWSs to protect the population in case a GLOF occurs (HiMAP, 2014). The physical aspects of a potential GLOF have been studied extensively with the support of international agencies such as USAID, the Inter-American Development Bank (IDB), and the government of Peru (Rivas et al., 2015; Somos-Valenzuela, 2014, 2016). However, the social aspects of a flood hazard have only been studied qualitatively (Hegglin and Huggel, 2008; Somos-Valenzuela, 2014).
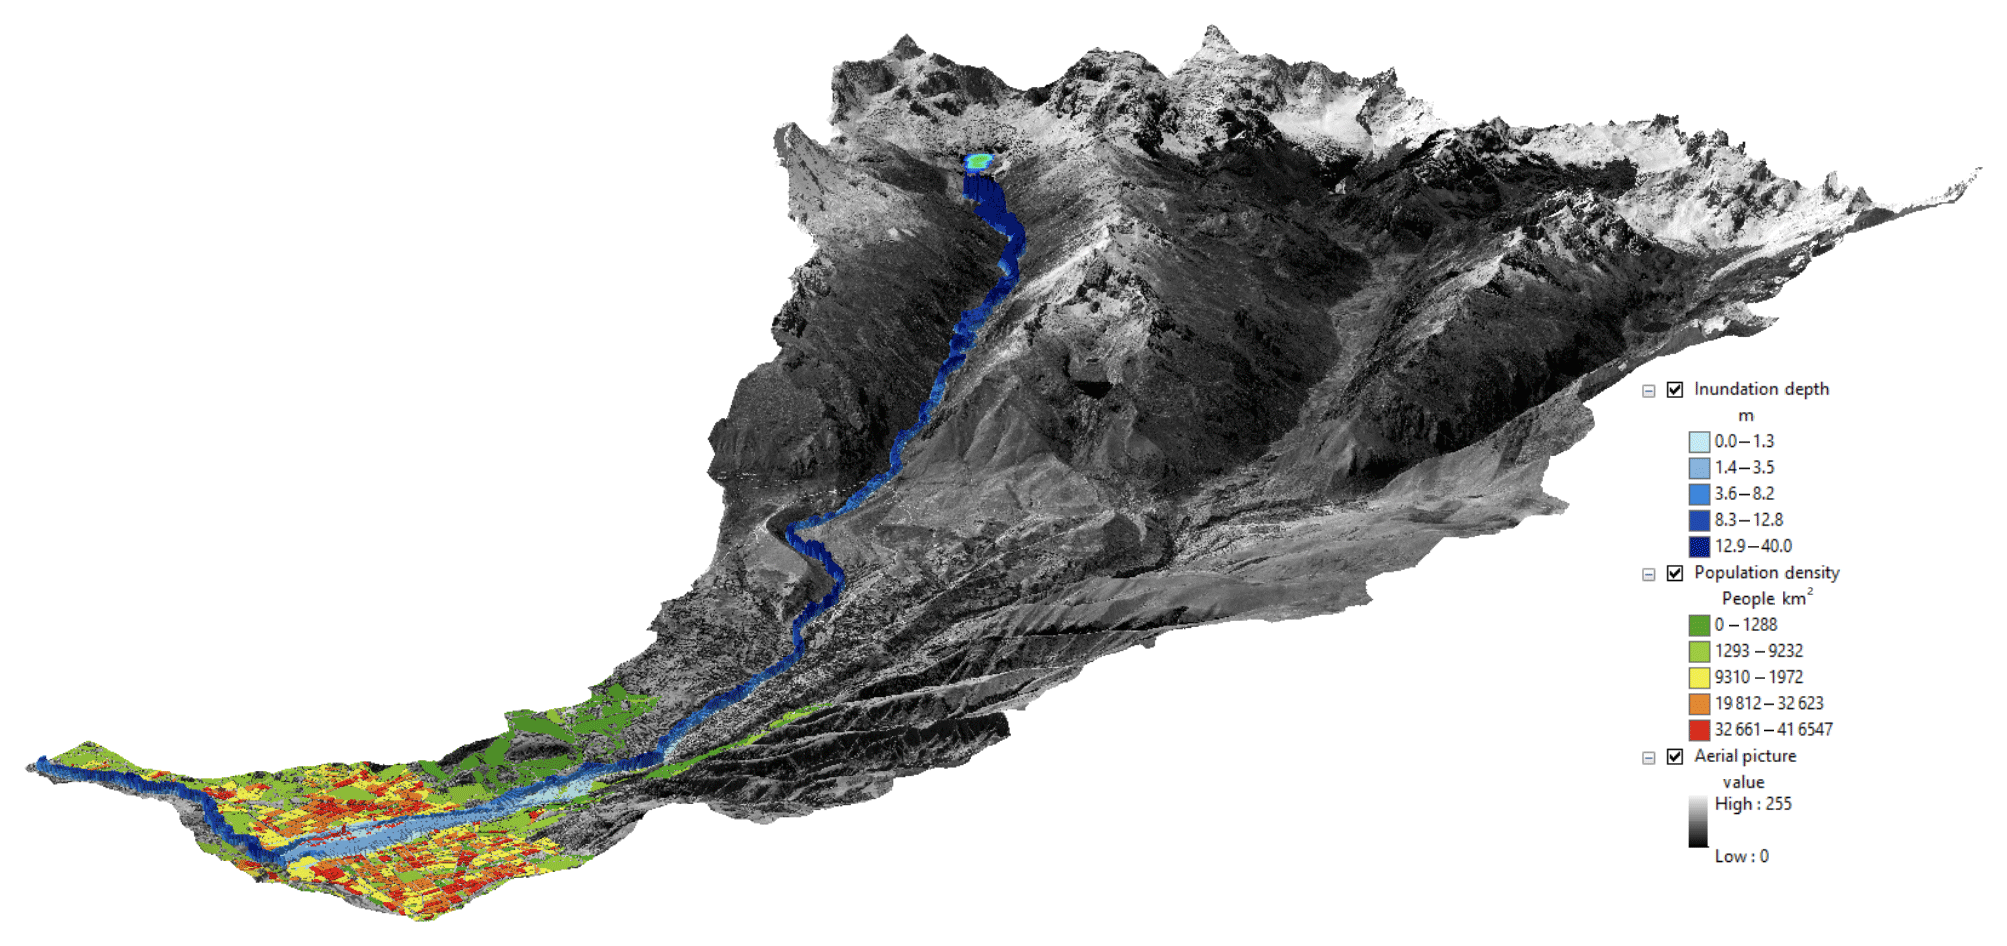
Figure 2Huaraz, Peru, at the bottom of the Cojup River. Lake Palcacocha, a potential source of a GLOF, is located at the head of the river.
2.2.1 Input data
To produce the ReTSVI we use three types of input data (Fig. 1). First, we need the evacuation curves, one for each level of social vulnerability. The evacuation curves that we used are ideally generated in the study area; however, there are no data that describe how people in Huaraz evacuate after an EWS is released. Therefore, we had to generate this information. Our closest available event was the tsunami triggered by an 8.3 magnitude earthquake on 16 September 2015 in Coquimbo, Chile. Second, a model describing a potential hazard is also needed; thus we use the model of a potential GLOF in Huaraz developed by Somos-Valenzuela et al. (2016). This model provides the time that people have to react before the inundation arrives. Finally, we have the 2007 census data provided by the Peruvian Ministry of the Environment to create a social vulnerability map of Huaraz.
Surveys in Coquimbo, Chile
We conducted 22 surveys with first responders regarding the 8.3 magnitude earthquake and tsunami that occurred on 16 September 2015 in Coquimbo, Chile. Four institutions that work directly to help the population during the evacuation process participated in this study: the navy, the police, firefighters, and the emergency office from the municipality of Coquimbo. First, we contacted each institution by phone to explain the purpose of the study and asked them if they would agree to participate in the study, and all did so. Then, a research assistant visited each institution and asked them to select at least five emergency experts to respond to our questionnaire. The main requirement was that the participants had to have worked directly during the emergency to help people evacuate their houses. A research assistant conducted a survey with each participant. We asked the first responders “in your opinion and based on your experience during the tsunami of 16 September, when the evacuation alarm was activated, how long did it take the population living in areas of low, medium, or high social vulnerability to evacuate?” They needed to estimate the average evacuation time in neighborhoods with low, medium, and high social vulnerability. Then we asked “what is the percentage of the population that evacuated in the first x minutes? ()”. The first responders wrote down the percentage of the population that evacuated their homes from 0 to 5 min, 0 to 15 min, 0 to 30 min, 0 to 45 min, and 0 to 60 min in neighborhoods with low, medium, and high social vulnerability in Coquimbo. The answers were collected on two scales: percentages and average time (in minutes).
We used the National Socioeconomic Characterization Survey (CASEN)1 from 2015, the same year that the earthquake–tsunami occurred, to calculate a SVI at the municipality level following the same procedure identified in Sect. 2.2.3. This way we were able to identify the socioeconomic and demographic characteristics of the neighborhoods with high, medium, and low social vulnerability in Chile. We incorporated this information in the survey so the first responders could identify which neighborhood belonged to which category; all responders generated separate curves for low-, medium-, or high-vulnerability neighborhoods.
Census data from Peru
We used the 2007 national population census to quantify the social vulnerability of Huaraz, Peru. The census has 53 questions that describe the main sociodemographic characteristics of the population of Peru (INE, 2015). The census data are aggregated at block level and in the case of Huaraz provide full information on 1404 blocks. The census data are divided into three main categories: (a) location of household (blocks), (b) household characteristics (number of rooms, ownership, type of house, etc.), and (c) population characteristics by block: age, religion, marital status, education, occupation, etc. There are 245 variables available in these three categories. Blocks without population are excluded from the analysis.
Flood model
In this study, we used the inundation results obtained by Somos-Valenzuela et al. (2016) that consider that an avalanche of rocks and ice could potentially fall into Palcacocha Lake and produce a chain of events that would lead to flooding in Huaraz. From all the scenarios analyzed in this study, we used the scenario in which an avalanche of 3 million cm3 falls into Palcacocha Lake producing a wave that overtops the moraine dike and inundates Huaraz. In Fig. 3 (0 m lowering), we show the physical hazard map for that scenario with no mitigation.
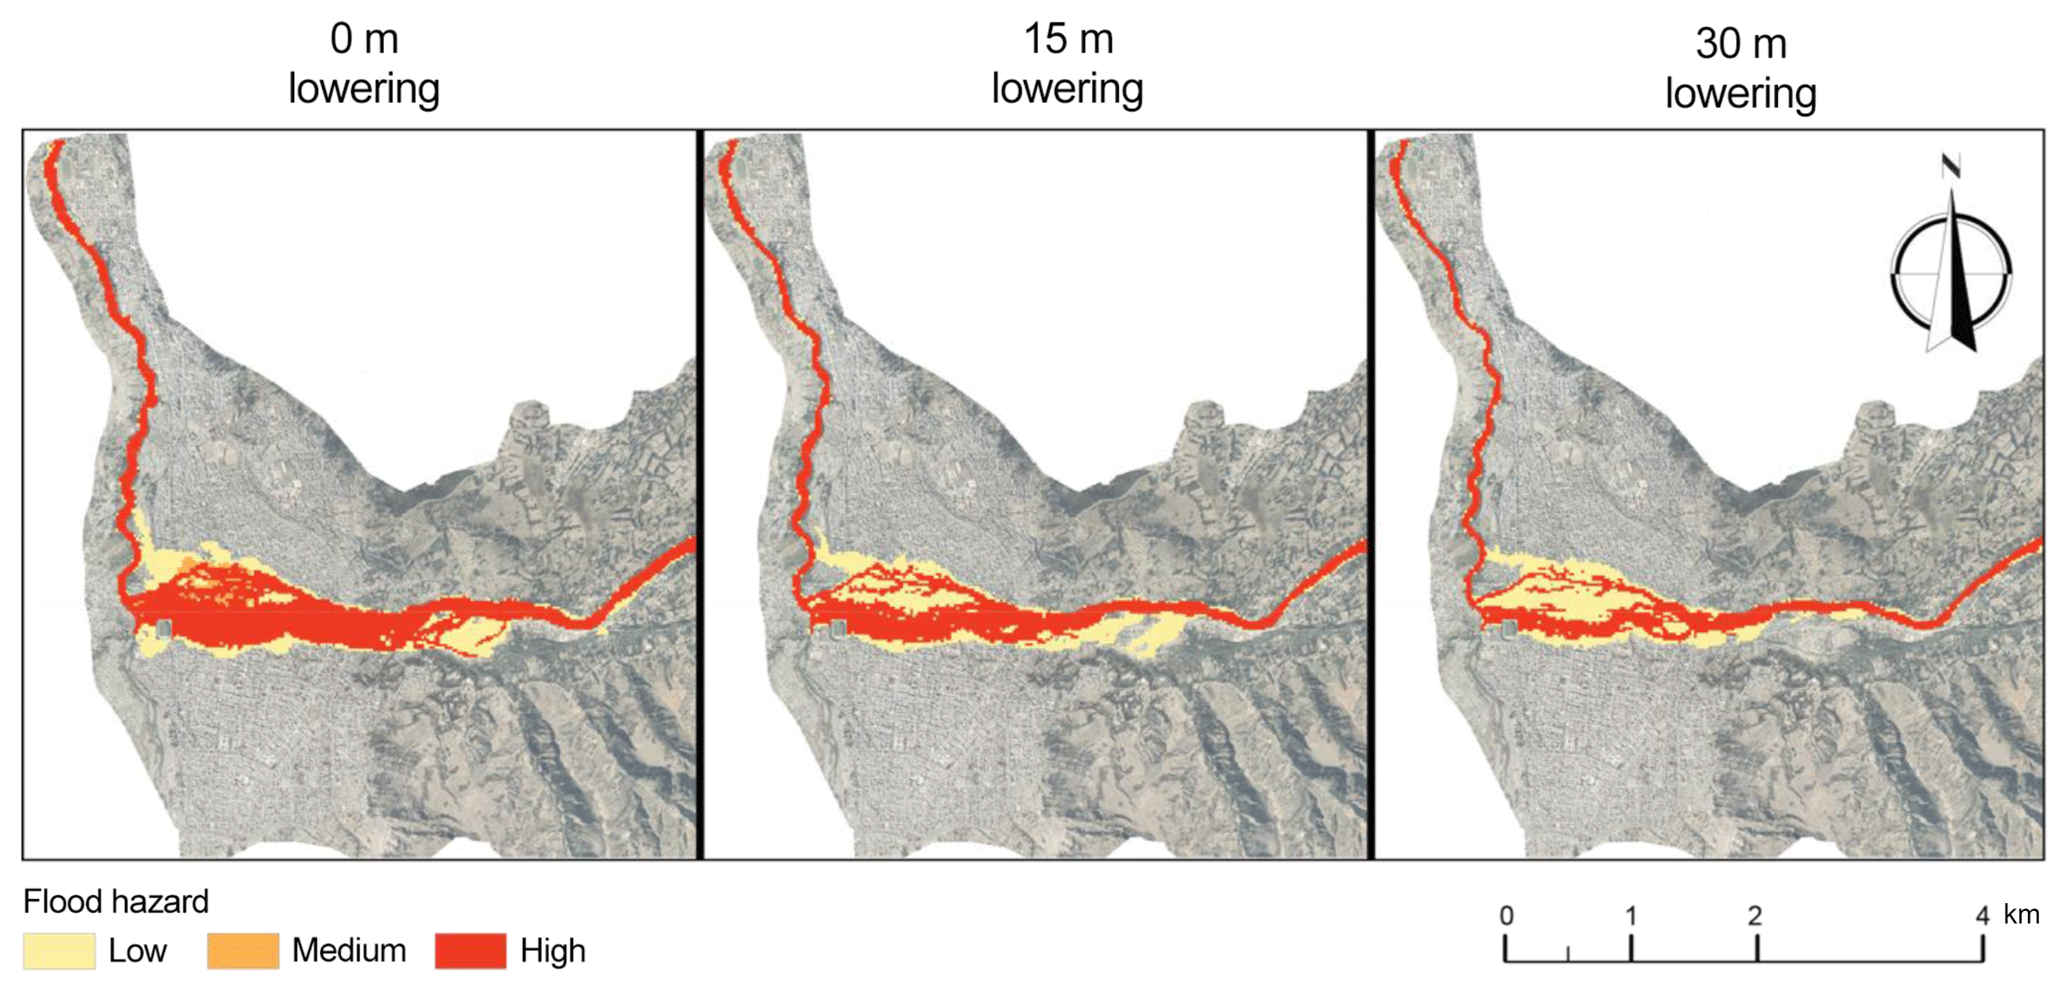
Figure 3This image corresponds to Fig. 9 from Somos-Valenzuela et al. (2016). Preliminary hazard map of Huaraz due to a potential GLOF originating from Lake Palcacocha with the lake at its current level (0 m lowering) and for the two mitigation scenarios (15 and 30 m lowering).
2.2.2 Evacuation model
To estimate the percentage of people who evacuate we use the LifeSim model as a base framework. The Army Corps of Engineers incorporated this model into the HEC-FIA model (Lehman and Needham, 2009; USACE, 2012) to assess evacuation during flood events. LifeSim has three modules: (1) warning and evacuation, (2) loss of shelter, including prediction of building performance, and (3) loss of life calculation.
To estimate the number of people that can perish during a flood event, we need to divide the calculation into two main processes. First, we need to estimate the number of people at risk (Npar) who cannot escape before a flood arrives, or what it is known as the number of people exposed to risk (Nexp). Second, we need to calculate the percentage of Nexp who can survive once they are in the inundation zone. This paper deals with the first process, the calculation of Nexp, by including social vulnerability.
Explaining why people evacuate faster, slower, or not at all is a process with many layers that is difficult to quantify. The literature describes marked processes that can be generalized in Eq. (1). First, we need to know the fraction of people who can escape (FE), for which we need to know how much time people have to escape (TE) and how feasible it is that in TE people can reach a safe area. For example, in a sudden dam breach, the maximum TE is the time that a flood has to travel from the dam to the area of interest (Graham, 2009; Jonkman et al., 2008; McClelland and Bowles, 2002). Then, we have the fraction of people who can find shelter (FS) within the inundated area, and finally the number of people who can be rescued (Nres).
Since we are interested in the impact of social vulnerability on the evacuation process, we reduce Eq. (1) to Eq. (2).
The model LifeSim provides a methodology for how to calculate the FE (Aboelata and Bowles, 2005). We use LifeSim to illustrate how to apply our findings, but the accuracy of the methodology is beyond the scope of this paper and requires further analysis. To calculate the proportion of people who escape we consider three processes: warning, mobilization, and evacuation–transportation.
Warning
Time is a key component of the evacuation process; therefore, an efficient EWS is crucial to saving lives. However, understanding the presence of an imminent threat is not a direct process. Equation (3) from Rogers and Sorensen (1991) is used to estimate the proportion of people who understand the alarm when they hear it or learn from others' behavior that there is an imminent hazard and they need to evacuate.
where
-
is the proportion of people who understand that there is imminent hazard, and k is the percentage of people alerted as a function of the broadcast system (Rogers and Sorensen, 1991);
-
(1−k) is the proportion of people left to be warned (Rogers and Sorensen, 1991);
-
a1 is the effectiveness of the warning system (Table 1 from Rogers and Sorensen, 1991);
-
a1f is the adjustment factor by location and activity (Table 2 from Rogers and Sorensen, 1991);
-
a2 is the effectiveness of the contagion warning process (Table 1 from Rogers and Sorensen, 1991);
-
N is the fraction that the system is designed to warn in the first 30 min after issuance of the warning, also referred to in Table 1 from Rogers and Sorensen (1991), as the 30 min limit; and
-
n is the proportion of people warned.
Mobilization process
After people understand that there is a threat, they start to evacuate to a safe zone. Figure 35 from Aboelata and Bowles (2005) defines mobilization curves, below which we show the “improved” curves from the cited reference.
HEC-FIA, which applies a version of LifeSim, includes the activities in which people are involved at the moment of a flood. To understand the impact of engaging in daily activities on the evacuation, we combined the warning penetration (using sirens and tone alert radios) and the mobilization process, including the uncertainty bounds for both processes. In addition, a Monte Carlo simulation with 1000 samples shows that the activity as described in LifeSim that people are engaged in when the alarm is triggered does not keep the warning from penetrating.
Although the emphasis of this work is to include social vulnerability, it is pertinent to show a current methodology adapted by the U.S. Army Corps of Engineers to provide context on how our data fit into state-of-the-art evacuation process assessments. Figure 4 illustrates that according to the LifeSim and HEC-FIA models the activity that people are doing when the alarm is released does not cause significant changes in the percentage of people mobilized. Therefore, we will not include activities in our calculations when we consider social vulnerability. Additionally, at the moment of the survey, we did not ask the first responder to quantify the time people take to understand the alarm (warning penetration) nor the time it took them to get ready to evacuate (mobilization). Therefore, the answers from the first responders correspond to the penetration and mobilization processes aggregated, which is equivalent to Fig. 4.
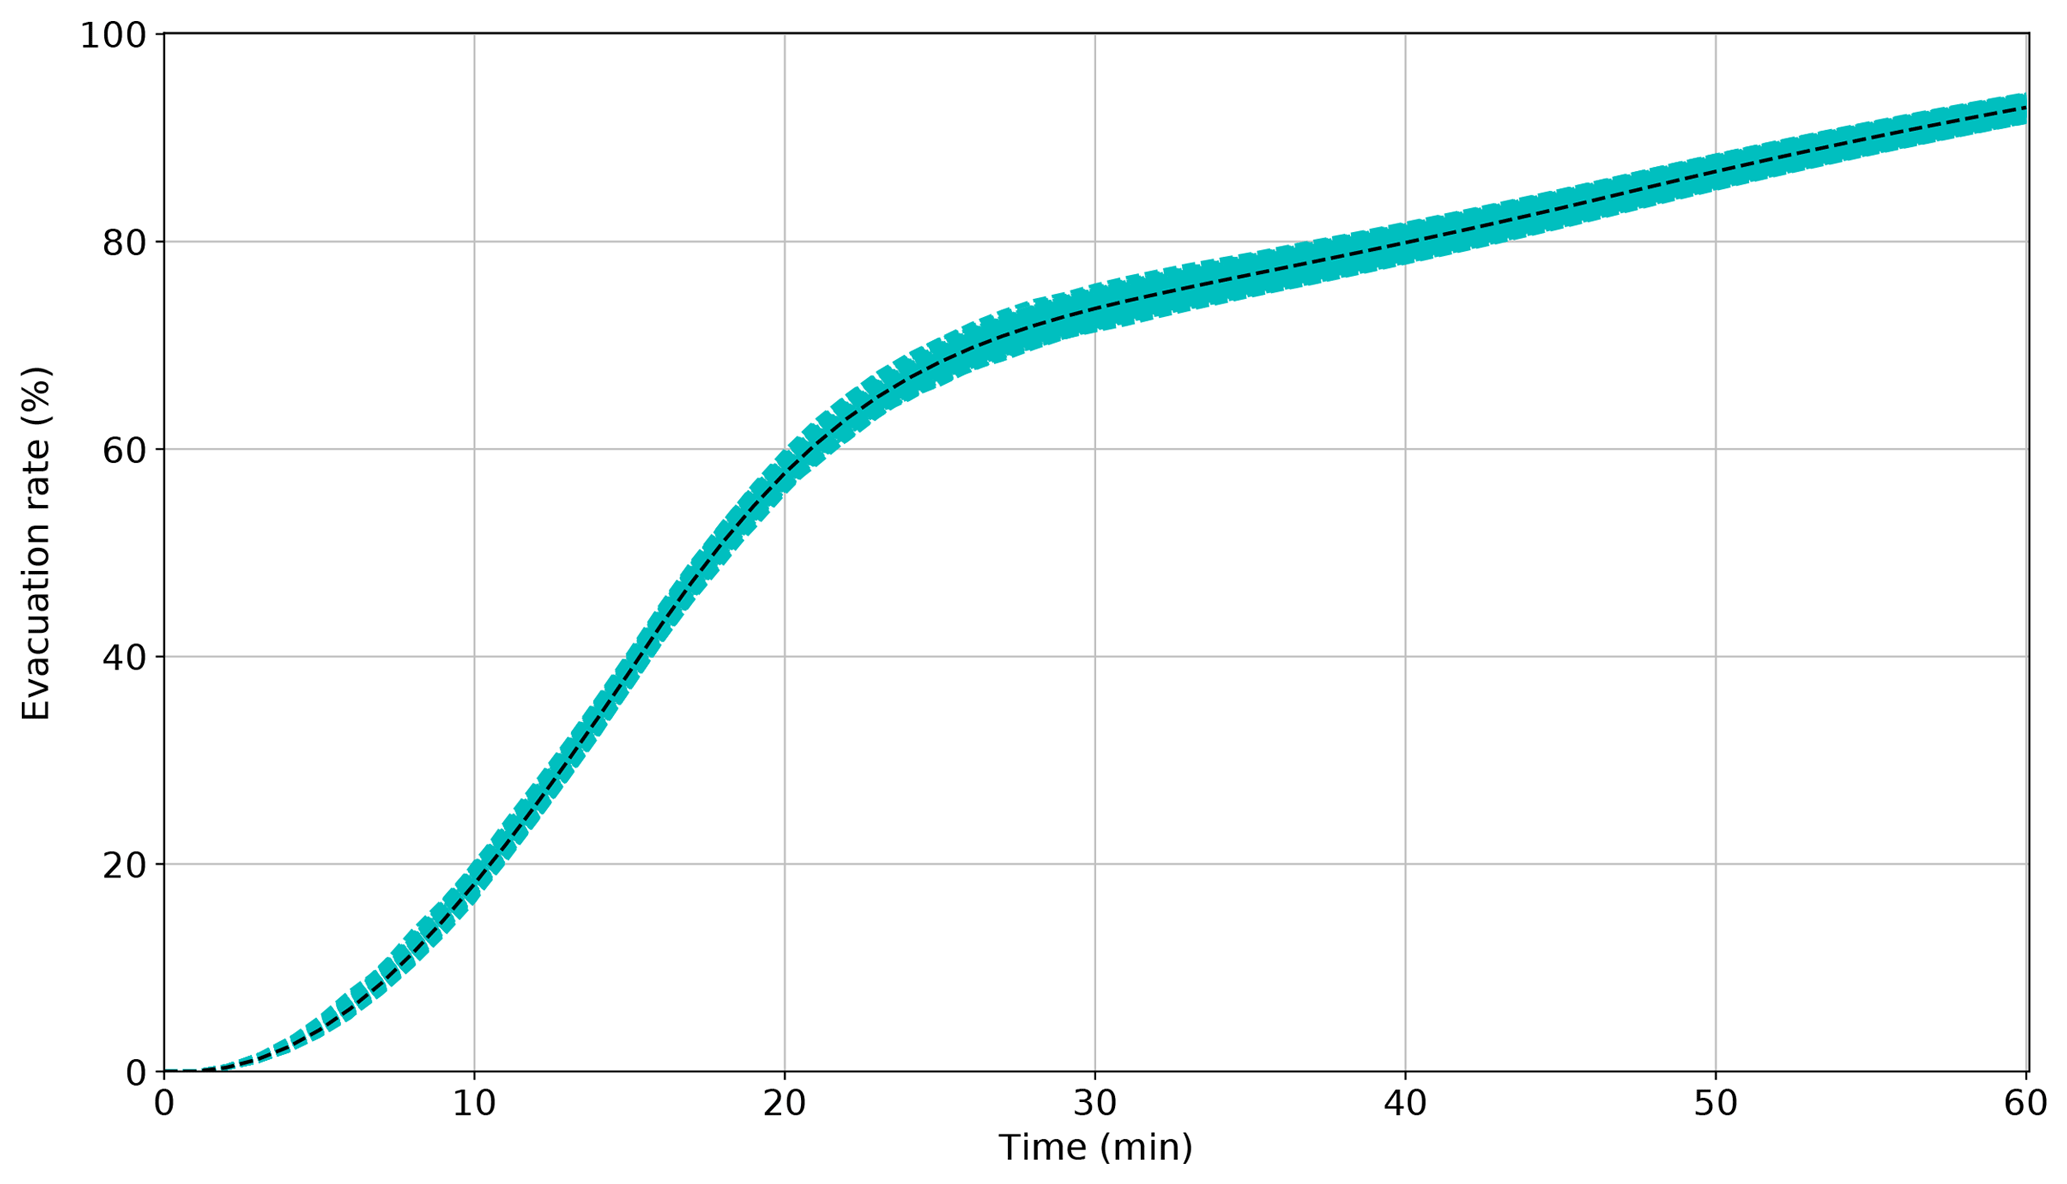
Figure 4Evacuation rate during the first hour calculated using 1000 samples in a Monte Carlo simulation.
Escape
In the example of the application of this methodology, we assumed that people would walk at speeds ranging from 80 to 187 m min−1 with an average of 107 m min−1 (Aboelata and Bowles, 2005). The shortest path was calculated using ArcGIS.
2.2.3 Social vulnerability index
One of the main criticisms of the use of indexes to quantify social vulnerability is the limited number of variables and the lack of connection and interrelationship among variables used by the indexes. To address these limitations, we constructed a SVI by analyzing census data using a principal component analysis (PCA) following the methodology developed by Cutter et al. (2003). The main objective of a PCA is to extract information from the variables and represent this information as a set of new orthogonal variables called principal components (Wold et al., 1987). This technique allows for robust and consistent numbers of variables that can be analyzed to estimate changes in social vulnerability over time (Cutter et al., 2003). To construct a SVI, we analyzed census data using a PCA. This is a multivariate technique “that analyzes a data table in which observations are described by several inter-correlated quantitative dependent variables” (Abdi and Williams, 2010). The main objective of a PCA is to extract information from the variables and represent this information as a set of new orthogonal variables called principal components. For example, a PCA “provides an approximation of a data table, a data matrix, X, in terms of the product of two small matrices T and P′. These matrices, T and P′, capture the essential data pattern of X” (Wold et al., 1987). The use of this technique allows for robust and consistent numbers of variables that can be analyzed to estimate changes in social vulnerability over time (Cutter et al., 2003).
We followed Schmidtlein et al. (2008), who listed seven steps to calculate the SVI. (1) First, we performed a multicollinearity test called the variance inflation factor (VIF). Variables with a VIF > 10 were excluded. Then, we normalize all variables as a percentage, per capita or density functions. For the purposes of this paper, we normalized all variables as percentages; for example, the percentage of independent houses per block or the percentage of elderly people per block. Then all input (census) variables were standardized to z scores . This creates variables with a mean of 0 and standard deviation of 1. Finally, we used the Bartlett's test of sphericity to determine if the variables were suitable for structure detection. (2) The PCA was performed with the standardized input variables (z scores). The number of components with eigenvalues of greater than 1 were selected and the selection corroborated with a scree test. (3) The initial PCA solution was rotated. In our work we used a normal Kaiser varimax rotation for component selection. (4) The Kaiser–Meyer–Olkin (KMO) measure of sampling adequacy was calculated. (5) The resulting components were interpreted as to how they may influence (increase or decrease) social vulnerability and signs were allocated to the components accordingly. (6) The selected component scores were combined into a univariate score using a predetermined weighting scheme. The factors were named based on variables with significant factor loading, usually greater than 0.3 or less than −0.3. (7) Finally, we standardized the resulting scores to a mean of 0 and standard deviation of 1.
All the steps but step 7 were straightforward. In step 5, we had to decide how we wanted to combine the different components. The first criterion was to use the scores from the PCA, adding them but assuming that all the components had the same contribution to the SVI (Cutter et al., 2003). The second criterion used the scores from the PCA but assigned different weights to the principal components according to the fraction of variability they explained (Schmidtlein et al., 2008). The third method also does not assume that each component contributes equally to social vulnerability, but in contrast to the second method, it multiplies each z score by the factor load and then each component is multiplied by its explained variance. We used the first criterion; in other words, we gave all the components the same weight. The same was performed by Chakraborty et al. (2005), Chen et al. (2013), Cutter et al. (2003), Fekete (2009), and Zhang and You (2014). Fekete (2011) provided a solid argument for using equal weighting, which avoids adding assumptions that are qualitative and mostly not empirically supported, although it may sound intuitive to use the loading factor or the variance explained by the factor to combine the variables selected. Moreover, Roder et al. (2017) argued that there is no appropriate methodology for the calculation of the index.
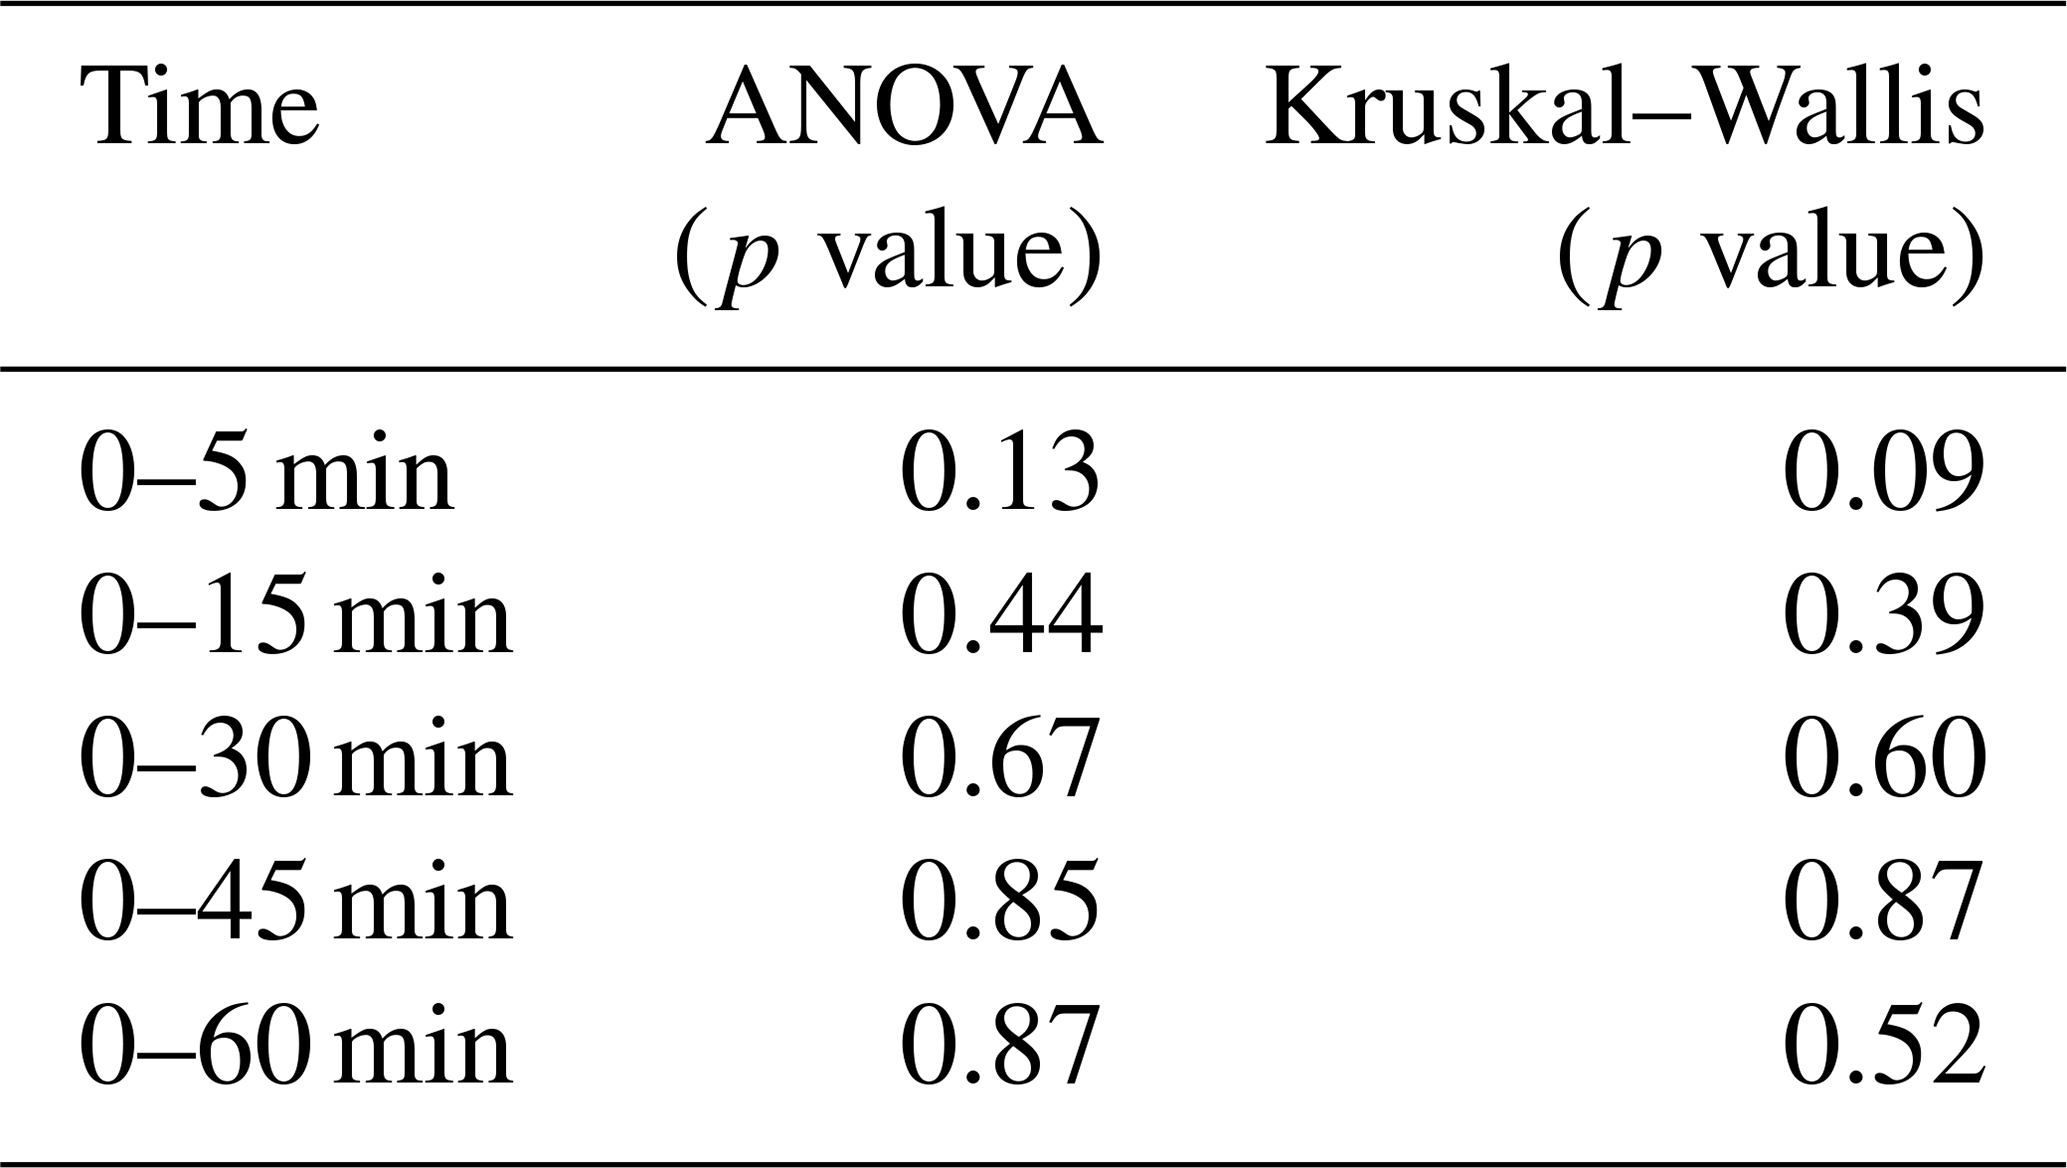
Table 1Parametric and nonparametric statistical difference test among levels of social vulnerability.
3.1 Survey to first responders
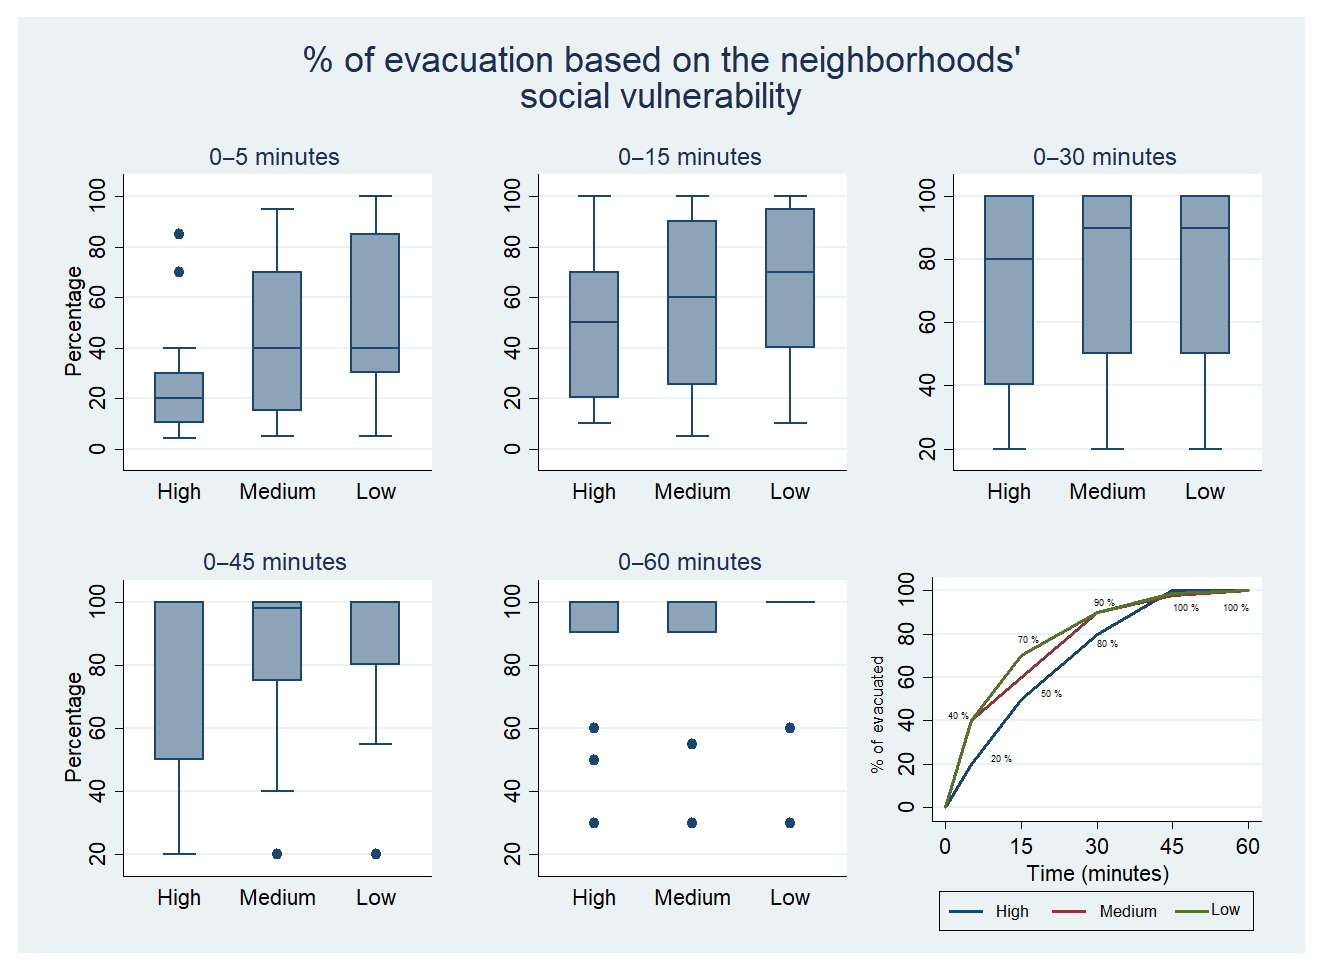
Figure 5 shows the percentage of population that evacuates after the tsunami alarm has been activated in neighborhoods with high, medium, and low social vulnerability. Each box presents the 75th percentile (upper hinge), the median (center), the 25th percentile (lower hinge), and the outlier values. Figure 5 indicates that neighborhoods with high social vulnerability systematically evacuate fewer people than areas with medium or low social vulnerability; for example, the first 5 min after the alarm is activated, the median (percentage of evacuation) for neighborhoods with high social vulnerability is 20 % and 40 % for medium and low social vulnerability. Figure 5 also shows that the differences in terms of the evacuation percentage decrease over time and eventually disappear after an hour after the alarm has been activated.
We test if the mean response time to the evacuation alarm among the three types of neighborhoods was statistically significant using two methods: ANOVA (parametric method) and Kruskal–Wallis (nonparametric method). Table 1 shows that the p values between the response time and level of social vulnerability (low, medium, and high) are not statistically significant. All the p values are higher than 0.05 (alpha level), and therefore we accept the null hypothesis that the response times among the three groups of social vulnerability are not statistically significant (p value >0.05). This could be due to the limited sample size. Consequently, we opted for the median rather than the mean as the middle point of the distribution of the mean response time.
3.2 Case study: hypothetical application case of ReTSVI in Huaraz, Peru
3.2.1 Social vulnerability index
Peru has a long history of mudflows generated from glacial lakes in the Cordillera Blanca. As global warming progresses and glaciers start shrinking at a higher rate, this problem is growing. In some cases, glaciers leave behind a weak moraine that holds a large amount of water that can suddenly release and cause floods (for more details see Carey, 2010; Hegglin and Huggel, 2008; Somos-Valenzuela et al., 2016).
Using the population census of Peru, Bartlett's test of sphericity (Table 2), and a PCA, we identified 20 census variables grouped into six components that explained 57 % of the total variance of the variable in which we applied the PCA to construct the SVI among all the neighborhoods in Huaraz (Table 3). The first component explained 20 % of the variance and identified the wealth of each block measured by population with primary and college education, with health insurance, indigenous population, white collar jobs, and households with five or more rooms. The elderly, women, and people with disabilities were grouped in the second component, which explains 9 % of the variance. The third component described variables linked to poverty such as illiteracy rates, the existence of informal settlements, and households without electricity. A total of 8 % of the variation in blocks was captured by this component. The fourth component identified home ownership and marital status; this factor explained 7 % of the variance. The fifth component grouped neighborhoods with high population density and workers in blue collar jobs that are usually linked with a low income and insecure and more precarious working conditions. This component captured 7 % of the variation in blocks. Finally, the sixth component identified children (<1 year old) and the population working in the manufacturing sector; this component explained 6 % of the variance.
Table 2Bartlett test of sphericity.

H0 variables are not intercorrelated.

The resulting SVI ranges from −1.3424 to 1.365 with a mean of 0.03 and a standard deviation of 0.4367. As Fig. 6 illustrates, most of the blocks located close to the Quellcayhuanca River exhibit a higher level of social vulnerability. Conversely, those blocks concentrated in the south of the city (away from the Quellcayhuanca River) are less vulnerable. Finally, the population who lives upriver, north of Huaraz, presents a middle level of vulnerability with a combination of medium-low and low levels of social vulnerability.
The proportion of high-, medium-, and low-vulnerability blocks within the inundation zone are 15 %, 35 %, and 50 %, respectively.
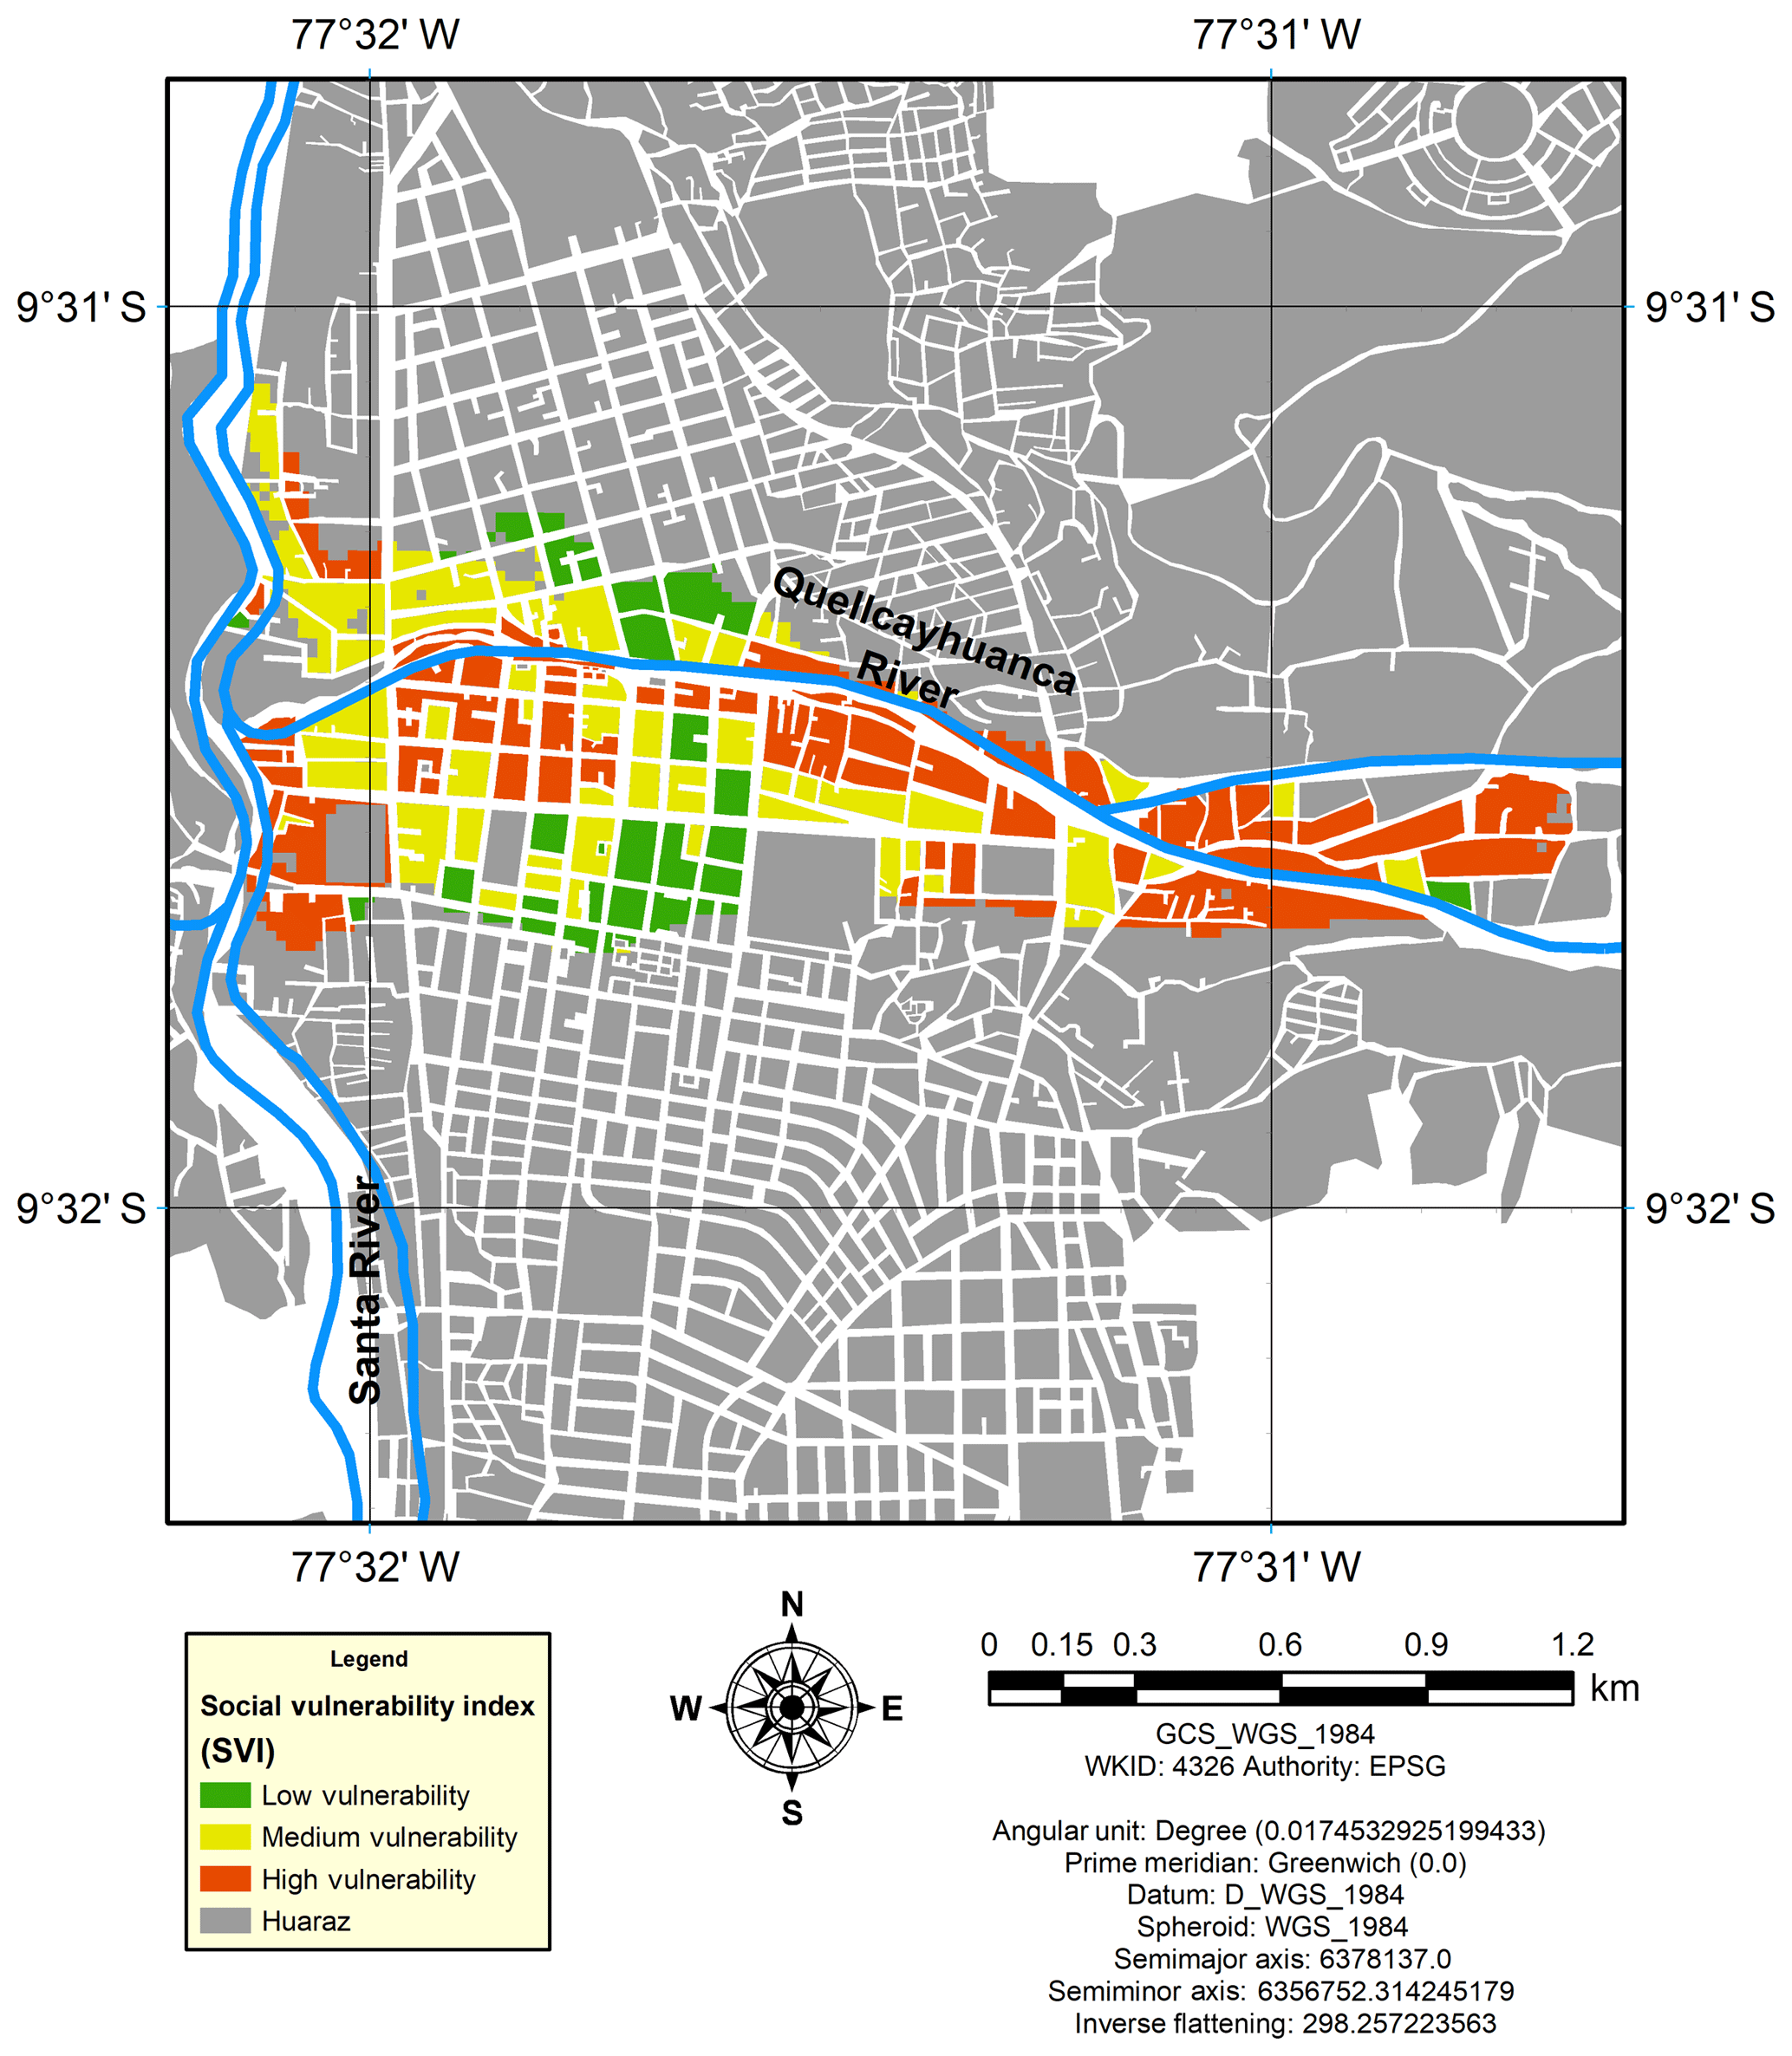
Figure 6Comparative vulnerability of blocks in Huaraz using the social vulnerability index (SVI).
3.2.2 Evacuation process
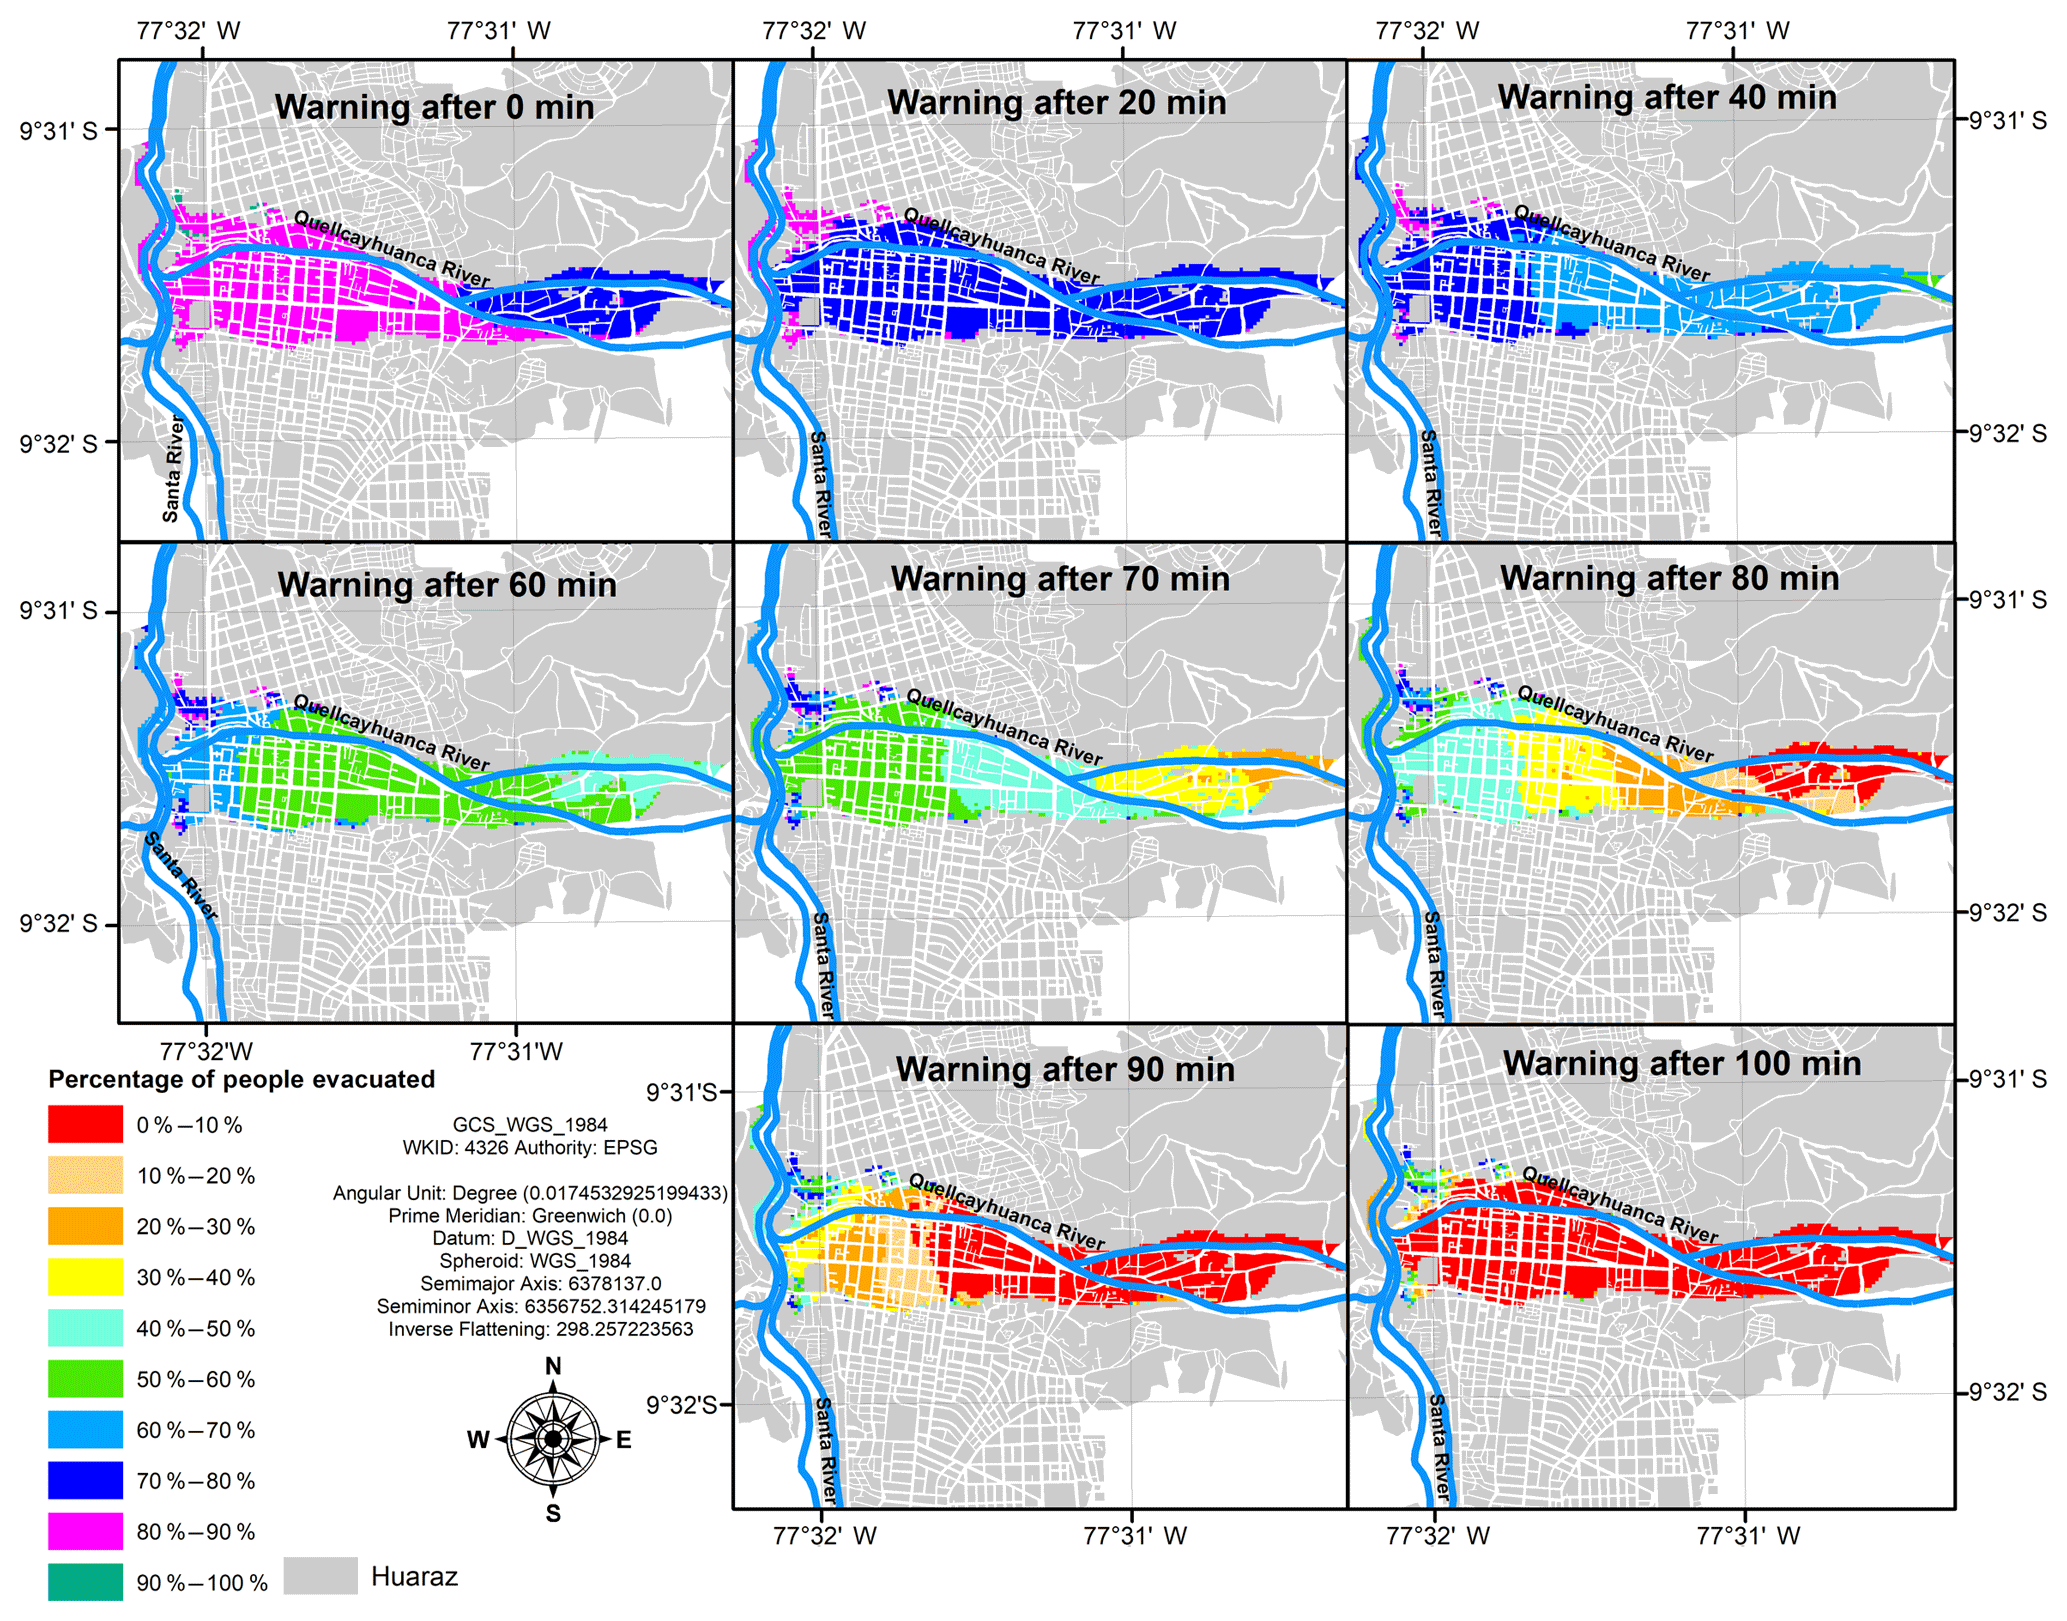
We calculated the percentage of people that could evacuate after a GLOF from Palcacocha Lake, Peru. An ideal EWS would trigger an alarm as soon as the hazard is detected. However, the protocols normally require that multiple sensors be checked in order to avoid a false positive error. This process delays the alarm's release, consuming important time that could otherwise be used for the population to begin evacuating. We used two methodologies to estimate the proportion of inhabitants who can leave their household before the hazard strikes. First, we used the empirical equations described in the methodology, in which we assumed that different groups react and evacuate homogeneously (Fig. 7). Second, we used the information provided by the first responders, census data, and SVI to include social vulnerability in the evacuation process (Fig. 8). In both cases, we estimated the percentage of people who would evacuate if the alarm were sounded at 0, 20, 40, 60, 70, 80, 90, and 100 min after the inundation starts traveling from Palcacocha Lake toward Huaraz.
An obvious but no less important finding is that as the alarm is delayed the population has less time to escape. The results also suggest that social vulnerability has a greater impact when the warning alarm is delayed. After 60 min, Fig. 8 gets patchier, which indicates that the population has different evacuation rates, even though they have a similar amount of time to respond. Also, when we use information from the first responders, the evacuation is faster than when we use empirical equations from LifeSim. The finding that evacuations were completed more rapidly with the earthquake–tsunami response data than with the LifeSim equations is due to the fact that, as long as the local population recognizes earthquake shaking as a tsunami warning cue, the shaking is an instantaneous broadcast mechanism (see Lindell et al., 2015; Wei et al., 2017). In those situations, k tends to 1 in Eq. (3), which makes the time-consuming contagion process less important.

This paper proposes a methodology to integrate social vulnerability into the calculation of the evacuation rate after an EWS is activated. We developed the ReTSVI methodology, which is a three-step process to determine the percentage of people who would leave an area that could be potentially inundated.
We found that the aggregated evacuation rate curve for the 2015 tsunami in Coquimbo has similarities to the evacuation curve for the 2009 tsunami in American Samoa after the 8.1 earthquake described in Lindell et al. (2015). This similarity is notable considering the distance as well as socioeconomic and cultural differences. The evacuation results in both studies show that in the first 15 min the aggregated evacuation rate falls between 50 % and 70 %, in 30 min it falls from 80 % to 90 %, and after an hour it is close to 100 %. These aggregated evacuation curves for tsunamis are faster than the results from Eq. (1) (Fig. 4) and the results from Abolaeta et al. (2003) that deal with rivers and dam break floods, suggesting that the process is understood earlier by the population. This could be due to awareness and training or to the shaking felt by most people immediately.
When we separate the results by social vulnerability, the results suggest that people with a higher level of vulnerability need more time to evacuate than people with a lower level of vulnerability. However, in our results, the differences between the evacuation curves are not statistically significant. In Fig. 9, in which we compare the aggregate survey responses with the evacuation responses categorized by social vulnerability level, we find that people at a medium level of vulnerability respond similarly to the aggregated values. Then, people with low and high vulnerability behave almost symmetrically around the average, which in a more general application could be used to generate boundaries for the evacuation curves.
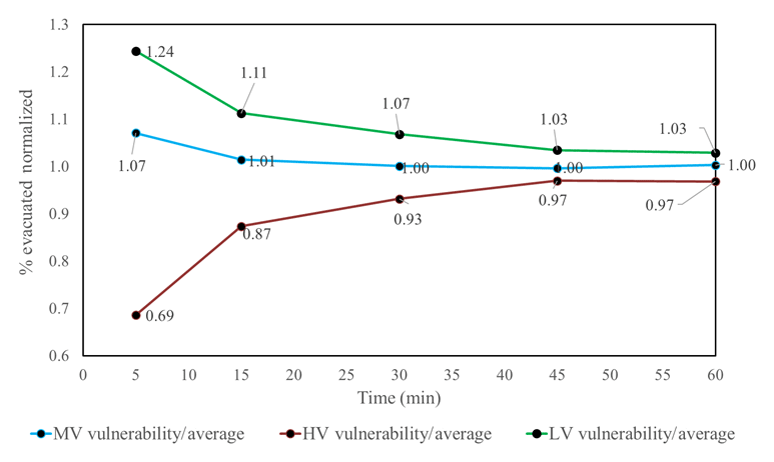
Figure 9People evacuated per social vulnerability level normalized by the average number of people evacuated.
To overcome the limitation of the non-significance in the difference among the evacuation curves more data related to the evacuation process, specifically when people decided to evacuate, need to be collected.
One of the primary variables that are linked to social vulnerability is household income (Cutter et al., 2003), but in the case of Peru, this variable is not surveyed in the census. Consequently, we used proxy variables of income such as job types, marital status, renters, and houses without electricity. The relationship between income distribution and the job type has been established worldwide (Galbraith and Berner, 2001) as well as in literature linked to social vulnerability (post-disaster): “some occupations, especially those involving resource extraction, may be severely impacted by a hazard event” (Cutter, 2003, p. 248). In relation to renters, they are considered to be more vulnerable to disaster: “people that rent do so because they are either transient or do not have the financial resources for home ownership. They often lack access to information about financial aid during recovery. In the most extreme cases, renters lack sufficient shelter options when lodging becomes uninhabitable or too costly to afford”. (Cutter, 2003, p. 247). Regarding “houses without electricity”, we assumed that this indicates more precarious conditions and the same is true for many other variables in the census such as houses without restrooms and running water, which were disregarded in the collinearity test. Finally, we use “adult population divorced” as a proxy for household income, for example Schoeni (1995) found that “in most cases, both separated and divorced men earn more than men who are never married but less than those who are currently married”. We recalculate the SVI excluding marital status (adult population divorced) and gender, and we found differences between the former and the recalculated SVI. However, after a lengthy discussion, we do not have strong arguments to support such changes, especially because the variables initially selected are easily found in the literature to influence the level of social vulnerability.
A limitation that arises when we apply a methodology such as ReTSVI, which relies on the construction of a SVI, is that we could not find any studies that relate evacuation rates with social vulnerability for inundations that take less than an hour from the triggering to the flooding. In this study, we used a PCA-based SVI to select the variables as proxies; however, this index was created and validated for post-event assessments. Therefore, this is a limitation that needs to be addressed before applying this framework.
Traditionally, the evacuation rate is calculated using one evacuation rate curve; therefore, ReTSVI seeks to overcome this limitation by allowing the user to include social vulnerability. The user decides which SVI and which evacuation curves to use for the levels of vulnerability. Here we have provided an example using as a proxy a SVI for post-disaster and evacuation curves that have no statistical significance. However, it still provides valuable information (Fig. 8) with respect to the implications of including social vulnerability that need to be validated. For example, more vulnerable people, according to the PCA-based SVI and census data, live closer to the river where the inundation strikes earlier and harder, having less time to evacuate while at the same time evacuating later. Additionally, social vulnerability seems to be less important as the EWS is delayed.
By incorporating social vulnerability in the evacuation models, we can identify not only areas where people need more time but also how much time to evacuate. The application of ReTSVI allows for the identification of groups that need more support at the block level. This allows policy makers to allocate resources properly, improving evacuation routes and providing training to meet the evacuation time according to their social vulnerability level.
This article proposes a methodology to incorporate social vulnerability into current methodologies to estimate the percentage of people who evacuate an inundation hazard zone. Previous research recognizes the relevance of social vulnerability in risk assessments; however, in general, the methodologies available fail to connect the physical vulnerability or the characteristics of an inundation event with social vulnerability in a quantitative framework. The results of the example of the ReTSVI in Huaraz show how a SVI could be used in the evacuation planning process. For example, such an analysis might show that there are distinct differences in the percentage of people evacuated in Huaraz for blocks that are close to each other, which could be explained by the SVI since their exposure to the physical hazard and the distance to escape are similar. The same is true when the alarm is delayed: the longer it takes for the authorities to warn people, the greater the influence of the SVI. However, although it seems intuitively probable that people with different levels of social vulnerability would differ in their evacuation rates and departure times, there are no empirical data to support this assumption. Differences in evacuation rates associated with level of social vulnerability need further study because with the current state of the science and the data collected in this study, we cannot answer this question with statistical significance. We faced a similar situation when constructing a pre-inundation SVI. It is unclear which variables explain the differences in departure time, which is critical to applying the ReTSVI framework; therefore, it also requires further study.
The Python notebook used to combine social vulnerability and the evacuation model is available at https://github.com/msomos/ReTSVI. The 2007 census data from Peru are described in http://censos.inei.gob.pe/cpv2007/tabulados/ (last access: 30 March 2017). The CASEN Survey from Chile is available at http://observatorio.ministeriodesarrollosocial.gob.cl/casen-multidimensional/casen/basedatos.php (last access: 30 October 2017).
MASV and AH developed the conceptualization of RESTVI and produced formal analysis and methodology. AVR coordinated the data collection in Coquimbo (Chile). MASV and AH wrote the original draft and answered the reviewers' comments and suggestions.
The authors declare that they have no conflict of interest.
We would like to acknowledge the Ministry of the Environment of Peru for
providing the 2007 Census of Peru. We also wish to thank Cesar Portocarrero
for inspiring us to develop new methodologies to help those in need.
Finally, we would like to thank Luis Rios-Cerda for his help applying the
survey to first responders and Lindsey Carte for all her feedback and
English review that helped us improve this study.
Edited by: Paolo Tarolli
Reviewed by: two anonymous referees
Abdi, H. and Williams, L. J.: Principal component analysis, Wiley Interdiscip. Rev. Comput. Stat., 2, 433–459, https://doi.org/10.1002/wics.101, 2010.
Aboelata, M. and Bowles, D. S.: LIFESim: A Model for Estimating Dam Failure Life Loss, Logan, Utah, 18 pp., 2005.
Adger, N.: Social Vulnerability to Climate Change and Extremes in Coastal Vietnam, World Dev., 27, 249–269, https://doi.org/10.1016/S0305-750X(98)00136-3, 1999.
Adger, N. and Vincent, K.: Uncertainty in adaptive capacity, Comptes Rendus Geosci., 337, 399–410, https://doi.org/10.1016/j.crte.2004.11.004, 2005.
Alwang, J., Siegel, P. B., Jørgensen, S. L., and Tech, V.: Series Vulnerability?, A View From Different Disciplines, 42 pp., 2001.
Balica, S.: Applying the Flood Vulnerability Index as a Knowledge base for flood risk assessment, Delft University of Technology, 142 pp., 2012.
Basher, R.: Global early warning systems for natural hazards: systematic and people-centred, Philos. T. Roy. Soc. A, 364, 2167–2182, https://doi.org/10.1098/rsta.2006.1819, 2006.
Birkmann, J.: Risk and vulnerability indicators at different scales: Applicability, usefulness and policy implications, Environ. Hazards, 7, 20–31, https://doi.org/10.1016/j.envhaz.2007.04.002, 2007.
Bolin, B.: Race, Class, Ethnicity, and Disaster Vulnerability, in: Handbooks of Disaster Research, Springer Science, New York, 113–129, 2007.
Boruff, B., Emrich, C., and Cutter, S.: Erosion Hazard Vulnerability of US Coastal Counties, J. Coast. Res., 21, 932–942, https://doi.org/10.2112/04-0172.1, 2005.
Bouwer, L. M.: Have Disaster Losses Increased Due to Anthropogenic Climate Change?, B. Am. Meteorol. Soc., 92, 39–46, https://doi.org/10.1175/2010BAMS3092.1, 2011.
Boyd, E., Levitan, M., and van Heerden, I.: Further specification of the dose-response relationship for flood fatality estimation, in US-Bangladesh workshop on innovation in windstorm/storm surge mitigation construction, National Science Foundation and Ministry of Disaster and Relief, Government of Bangladesh, Dhaka, 19–21, 2005.
Brown, C. and Graham, W.: Assessing the threat to life from dam failure, Water Resour. Bull., 24, 1303–1309, 1988.
Carey, M.: Living and dying with glaciers: people's historical vulnerability to avalanches and outburst floods in Peru, Global Planet. Change, 47, 122–134, 2005.
Carey, M.: In the Shadow of Melting Glaciers: Climate Change and Andean Society, Oxford Univ. Press, New York, 265 pp., 2010.
Chakraborty, J., Tobin, G. A., and Montz, B. E.: Population Evacuation: Assessing Spatial Variability in Geophysical Risk and Social Vulnerability to Natural Hazards, Nat. Hazards Rev., 6, 23–33, https://doi.org/10.1061/(ASCE)1527-6988(2005)6:1(23), 2005.
Chen, W., Cutter, S., Emrich, C., and Shi, P.: Measuring social vulnerability to natural hazards in the Yangtze River Delta region, China, Int. J. Disaster Risk Sci., 4, 169–181, 2013.
Couling, M.: Tsunami risk perception and preparedness on the east coast of New Zealand during the 2009 Samoan Tsunami warning, Nat. Hazards, 71, 973–986, https://doi.org/10.1007/s11069-013-0945-y, 2014.
Cutter, S.: Vulnerability to environmental hazards, Prog. Hum. Geogr., 20, 529–539, https://doi.org/10.1177/030913259602000407, 1996.
Cutter, S. and Emrich, C.: Moral Hazard, Social Catastrophe, The Changing Face of Vulnerability along the Hurricane Coasts, Ann. Am. Acad. Pol. Soc. Sci., 604, 102–112, https://doi.org/10.1177/0002716205285515, 2006.
Cutter, S. and Finch, C.: Temporal and spatial changes in social vulnerability to natural hazards, P. Natl. Acad. Sci. USA, 105, 2301–2306, https://doi.org/10.1073/pnas.0710375105, 2008.
Cutter, S., Mitchell, J., and Scott, M.: Revealing the Vulnerability of People and Places?: A Case Study of Georgetown County, South Carolina, Ann. Assoc. Am. Geogr., 90, 713–737, 2000.
Cutter, S., Boruff, B., and Shirley, L.: Social Vulnerability to Environmental Hazards, Soc. Sci. Q., 84, 242–261, 2003.
De Marchi, B.: Risk construction and social vulnerability in an italian alpine region, Country Report Italy, ISIG, available at: http://resolver.tudelft.nl/uuid:ab65811e-6394-470e-9663-530c0751382e, 359 pp., 2007.
De Marchi, B. and Scolobig, A.: The views of experts and residents on social vulnerability to flash floods in an Alpine region of Italy, Disasters, 36, 316–337, 2012.
DeKay, M. and McClelland, G.: Predicting loss of life in cases of dam failure and flash flood, Risk Anal., 13, 193–205, 1993.
Działek, J., Biernacki, W., Fiedeń, Ł., Listwan-Franczak, K., and Franczak, P.: Universal or context-specific social vulnerability drivers-Understanding flood preparedness in southern Poland, Int. J. Disaster Risk Reduct., 19, 212–223, 2016.
Elliott, J. and Pais, J.: Race, class, and Hurricane Katrina: Social differences in human responses to disaster, Soc. Sci. Res., 35, 295–321, https://doi.org/10.1016/j.ssresearch.2006.02.003, 2006.
Fekete, A.: Validation of a social vulnerability index in context to river-floods in Germany, Nat. Hazards Earth Syst. Sci., 9, 393–403, https://doi.org/10.5194/nhess-9-393-2009, 2009.
Fekete, A.: Assessment of Social Vulnerability to River Floods in Germany, available at: http://www.ehs.unu.edu/article/read/graduate-research-series-vol-4-assessment-of-social-vulnerability (last access: 5 January 2015), 2010.
Fekete, A.: Spatial disaster vulnerability and risk assessments: challenges in their quality and acceptance, Nat. Hazards, 61, 1161–1178, https://doi.org/10.1007/s11069-011-9973-7, 2011.
Flanagan, B., Gregory, E., Hallisey, E., Heitgerd, J., and Lewis, B.: A social vulnerability index for disaster management, J. Homel. Secur. Emerg. Manag., 8, 22 pp., 2011.
Gaillard, J.-C. and Dibben, C. J. L.: Volcanic risk perception and beyond, J. Volcanol. Geoth. Res., 172, 163–169, https://doi.org/10.1016/j.jvolgeores.2007.12.015, 2008.
Galbraith, J. and Berner, M.: Inequality and industrial change: a global view, Cambridge University Press, 313 pp., 2001.
Graham, W. J.: A procedure for estimating loss of life caused by dam failure, Rep. No. DSO-99-06, Denver, Colorado, 1999.
Graham, W. J.: A comparison of methods for estimating loss of life from dam failure, in Managing Our Water Retention Systems On the Cover, 29th Annual USSD Conference, 20–24 April 2009, USSD-U.S. Society on Dams, Nashville, Tennessee, 1143–1166, 2009.
Hallegatte, S.: Risk and Opportunity: Managing Risk for Development, available at: http://www-wds.worldbank.org/external/default/WDSContentServer/WDSP/IB/2013/10/08/000333037_20131008124616/Rendered/PDF/816990PUB0REPL00Box379840B00PUBLIC0.pdf, pdf (last access: 12 November 2018), 363 pp., 2014.
Harvey, D., Kato, Y., and Passidomo, C.: Rebuilding others' communities: a critical analysis of race and nativism in non-profits in the aftermath of Hurricane Katrina, Local Environ., 21, 1029–1046, 2016.
Hegglin, E. and Huggel, C.: An Integrated Assessment of Vulnerability to Glacial Hazards, Mt. Res. Dev., 28, 299–309, https://doi.org/10.1659/mrd.0976, 2008.
Heinz Center: Human Links to Coastal Disasters, The H. John Heinz III Center for Science, Economics and the Environment, 139 pp., 2002.
Henry, M., Kawasaki, A., Takigawa, I., and Meguro, K.: The impact of income disparity on vulnerability and information collection: an analysis of the 2011 Thai Flood, J. Flood Risk Manag., 10, 339–348, https://doi.org/10.1111/jfr3.12144, 2017.
HiMAP: Quillcay Plan de Acción Local Para la Adaptacion al Cambio Climatico Subcuenca de Quillcay, Mancomunidad Municipal WARAQ, Climate Change Resilient Development Project, United States Agency for International Development, Washington DC, available at: http://siar.minam.gob.pe/ancash/documentos/quillcay-plan-accion-local-adaptacion-cambio-climatico (last access: 12 November 2018), 2014.
Huang, S.-K., Lindell, M. K., and Prater, C. S.: Who leaves and who stays? A review and statistical meta-analysis of hurricane evacuation studies, Environ. Behav., 48, 991–1029, 2016.
INE: Censo de Poblacion y Vivienda, available at: http://www.inei.gob.pe/estadisticas/censos/, last access: 7 October 2015.
Ionescu, C., Klein, R. J. T., Hinkel, J., Kavi Kumar, K., and Klein, R.: Towards a Formal Framework of Vulnerability to Climate Change, NeWater Working Paper 2 and FAVAIA Working Paper 1, Potsdam, Germany, 22 pp., 2005.
ISDR: Living with risk, a global review of disaster reduction initiatives, International Strategy for Disaster Reduction initiatives, New York and Geneva, 429 pp., 2004.
Jonkman, S. N.: Overstromingsrisico's: een onderzoek naar de toepasbaarheid van risicomaten, available at: https://repository.tudelft.nl/islandora/object/uuid:340c6631-1d4e-490f-8720-a85e41f40ac4?collection=education (last access: 12 November 2018), 273 pp., 2001.
Jonkman, S. N., Vrijling, J. K., and Vrouwenvelder, A. C. W. M.: Methods for the estimation of loss of life due to floods: A literature review and a proposal for a new method, Nat. Hazards, 46, 353–389, https://doi.org/10.1007/s11069-008-9227-5, 2008.
Jonkman, S. N., Maaskant, B., Boyd, E., and Levitan, M. L.: Loss of life caused by the flooding of New Orleans after Hurricane Katrina: analysis of the relationship between flood characteristics and mortality, Risk Anal., 29, 676–698, 2009.
Koks, E., Jongman, B., Husby, T., and Botzen, W.: Combining hazard, exposure and social vulnerability to provide lessons for flood risk management, Environ. Sci. Policy, 47, 42–52, 2015.
Lehman, W. and Needham, J.: Consequence Estimation for Dam Failures, available at: http://www.hec.usace.army.mil/software/hec-fia/documentation/HEC-FIA_22_Consequence_Estimation.pdf (last access: 23 January 2019), 22 pp., 2009.
Lindell, M. K., Lu, J.-C., and Prater, C. S.: Household decision making and evacuation in response to Hurricane Lili, Nat. Hazards Rev., 6, 171–179, 2005.
Lindell, M. K., Prater, C. S., Gregg, C. E., Apatu, E. J. I., Huang, S.-K., and Wu, H. C.: Households' immediate Responses to the 2009 American Samoa Earthquake and Tsunami, Int. J. Disaster Risk Reduct., 12, 328–340, https://doi.org/10.1016/j.ijdrr.2015.03.003, 2015.
McClelland, D. M. and Bowles, D. S.: Estimating life loss for dam safety risk assessment – a review and new approach, Logan, Utah, 404 pp., 2002.
Medina, M. and Moraca, J.: Should I Stay or should I Go?, Determinants of Evacuation upon Flood Warning among Households in a Flood Prone Area in Bukidnon, Philippines, Int. Lett. Nat. Sci., 50, 70–75, https://doi.org/10.18052/www.scipress.com/ILNS.50.70, 2016.
Mileti, D. S. and O'Brien, P. W.: Warnings during disaster: Normalizing communicated risk, Nat. Hazard Rev., 39, 40–57, 1992.
Morss, R. E., Wilhelmi, O. V., Meehl, G. A., and Dilling, L.: Improving societal outcomes of extreme weather in a changing climate: An integrated perspective, Annu. Rev. Environ. Resour., 36, 1–25, https://doi.org/10.1146/annurev-environ-060809-100145, 2011.
Nagarajan, M., Shaw, D., and Albores, P.: Disseminating a warning message to evacuate, A simulation study of the behaviour of neighbours, Eur. J. Oper. Res., 220, 810–819, https://doi.org/10.1016/j.ejor.2012.02.026, 2012.
Nicholls, R. J. and Klein, R.: Assessment of Change Climate Coastal Vulnerability to, Ambio, 28, 182–187, 1999.
Penning-Rowsell, E., Floyd, P., Ramsbottom, D., and Surendran, S.: Estimating injury and loss of life in floods: a deterministic framework, Nat. Hazards, 36, 43–64, 2005.
Ramsbottom, D., Wade, S., Bain, V., Hassan, M., Penning-Rowsell, E., Wilson, T., Fernandez, A., House, M., and Floyd, P.: R&D outputs: flood risks to people, Phase 2, FD2321/IR2, Department for the Environment, Food Rural Aff. Agency, 2004.
Reiter, P.: RESCDAM – Loss of life caused by dam failure, the RESCDAM LOL method and its application to Kyrkosjarvi dam in Seinajoki, PR Water Consulting Ltd, Helsinki, 10 pp., 2001.
Rivas, D. S., Somos-Valenzuela, M. A., Hodges, B. R., and McKinney, D. C.: Predicting outflow induced by moraine failure in glacial lakes: the Lake Palcacocha case from an uncertainty perspective, Nat. Hazards Earth Syst. Sci., 15, 1163-1179, https://doi.org/10.5194/nhess-15-1163-2015, 2015.
Roder, G., Sofia, G., Wu, Z., and Tarolli, P.: Assessment of Social Vulnerability to Floods in the Floodplain of Northern Italy, Weather Clim. Soc., 9, 717–737, 2017.
Rodriguez, H., Quarentelli, E., and Dynes, R.: Handbook of Disaster Research, Springer Science, New York, 619 pp., 2007.
Rogers, G. O. and Sorensen, J. H.: Diffusion of Emergency Warning: Comparing Empirical and Simulation Results, in: Risk Analysis Prospects and Opportunities, edited by: Zervos, C., Knox, K., Abramson, L., and Coppock, R., Plenum Press, New York, 8, 117–134, 1991.
Rufat, S., Tate, E., Burton, C., and Maroof, A. S.: Social vulnerability to floods: Review of case studies and implications for measurement, Int. J. Disaster Risk Reduct., 14, 470–486, 2015.
Rygel, L., O'sullivan, D., and Yarnal, B.: A Method for Constructing a Social Vulnerability Index, An Application to Hurricane Storm Surges in a Developed Country, Mitig. Adapt. Strateg. Glob. Chang., 11, 741–764, https://doi.org/10.1007/s11027-006-0265-6, 2006.
Sadia, H., Iqbal, M., Ahmad, J., Ali, A., and Ahmad, A.: Gender-sensitive public health risks and vulnerabilities' assessment with reference to floods in Pakistan, Int. J. Disaster Risk Reduct., 19, 47–56, 2016.
Santos, G. and Aguirre, B.: A Critical Reiew of Emergency Evacuation Simulation Models, Preliminary paper #339, Disaster Research Center, University of Delaware, 54 pp., 2004.
Schmidtlein, M., Deutsch, R., Piegorsch, W., and Cutter, S.: A sensitivity analysis of the social vulnerability index, Risk Anal., 28, 1099–1114, https://doi.org/10.1111/j.1539-6924.2008.01072.x, 2008.
Schoeni, R.: Marital status and earnings in developed countries, J. Popul. Econ., 8, 351–359, 1995.
Somos-Valenzuela, M. A.: PhD Dissertation: Vulnerability and Decision Risk Analysis in Glacier Lake Outburst Floods (GLOF), Case Studies: Quillcay Sub Basin in the Cordillera Blanca in Peru and Dudh Koshi Sub Basin in the Everest Region in Nepal, 229 pp., 2014.
Somos-Valenzuela, M. A., Chisolm, R. E., Rivas, D. S., Portocarrero, C., and McKinney, D. C.: Modeling a glacial lake outburst flood process chain: the case of Lake Palcacocha and Huaraz, Peru, Hydrol. Earth Syst. Sci., 20, 2519–2543, https://doi.org/10.5194/hess-20-2519-2016, 2016.
UN: Risk and poverty in a changing climate: Invest today for a safer tomorrow, available at: http://www.preventionweb.net/english/hyogo/gar/report/documents/GAR_Prelims_2009_eng.pdf, (last access: 23 January 2019), 14 pp., 2009.
USACE: HEC-FIA Flood Impact Analysis User's Manual, September, 1–352, 2012.
Vrouwenvelder, A. and Steenhuis, C.: Tweede waterkeringen Hoeksche Waard, berekening van het aantal slachtoffers bij verschillende inundatiescenario's, Rep. TNO, 1997.
Wegner, S. A.: Lo Que el Agua se Llevó: Consecuencias y Lec-ciones del Aluvión de Huaraz de 1941, Technical Notes on Climate Change, No. 7, Ministry of Environment, Lima, Peru, available at: http://www.mountain.pe/wp-content/uploads/2015/04/HIMAP-TMI_MINAM_-Aluvion_1941.pdf (last access: 23 January 2019), 83 pp., 2014.
Wei, H.-L., Wu, H.-C., Lindell, M. K., Prater, C. S., Shiroshita, H., Johnston, D. M., and Becker, J. S.: Assessment of households' responses to the tsunami threat: A comparative study of Japan and New Zealand, Int. J. Disaster Risk Reduct., 25, 274–282, https://doi.org/10.1016/j.ijdrr.2017.09.011, 2017.
Whitehead, J. C., Edwards, B., Van Willigen, M., Maiolo, J. R., Wilson, K., and Smith, K. T.: Heading for higher ground: factors affecting real and hypothetical hurricane evacuation behavior, Glob. Environ. Chang. Part B Environ. Hazards, 2, 133–142, 2000.
Wold, S., Esbensen, K., and Geladi, P.: Principal component analysis, Chemom. Intell. Lab. Syst., 2, 37–52, https://doi.org/10.1016/0169-7439(87)80084-9, 1987.
Zhang, Y.-L. and You, W.-J.: Social vulnerability to floods: a case study of Huaihe River Basin, Nat. Hazards, 71, 2113–2125, 2014.
Zhou, Y., Li, N., Wu, W., Wu, J., and Shi, P.: Local spatial and temporal factors influencing population and societal vulnerability to natural disasters, Risk Anal., 34, 614–639, https://doi.org/10.1111/risa.12193, 2014.
CASEN is a tool to describe and analyze the socioeconomic situation of Chilean families, including housing, education, and labor characteristics. This is a cross-sectorial survey, whose periodicity yields a time-based picture of the evolution of individual–household welfare (Contreras, 2001).