the Creative Commons Attribution 4.0 License.
the Creative Commons Attribution 4.0 License.
 | 18 Apr 2019
Impact of airborne cloud radar reflectivity data assimilation on kilometre-scale numerical weather prediction analyses and forecasts of heavy precipitation events
Mary Borderies
Olivier Caumont
Julien Delanoë
Véronique Ducrocq
Nadia Fourrié
Pascal Marquet
This article investigates the potential of W-band radar reflectivity to improve the quality of analyses and forecasts of heavy precipitation events in the Mediterranean area. The “1D+3DVar” assimilation method, operationally employed to assimilate ground-based precipitation radar data in the Météo-France kilometre-scale numerical weather prediction (NWP) model AROME, has been adapted to assimilate the W-band reflectivity measured by the airborne cloud radar RASTA (Radar Airborne System Tool for Atmosphere) during a 2-month period over the Mediterranean area. After applying a bias correction, vertical profiles of relative humidity are first derived via a 1-D Bayesian retrieval, and then used as relative humidity pseudo-observations in the 3DVar assimilation system of AROME. The efficiency of the 1-D Bayesian method in retrieving humidity fields is assessed using independent in-flight humidity measurements. To complement this study, the benefit brought by consistent thermodynamic and dynamic cloud conditions has been investigated by separately and jointly assimilating the W-band reflectivity and horizontal wind measurements collected by RASTA in the 3 h 3DVar assimilation system of AROME.
The data assimilation experiments are conducted for a single heavy precipitation event and then also for 32 cases. Results indicate that the W-band reflectivity has a larger impact on the humidity, temperature and pressure fields in the analyses compared to the assimilation of RASTA wind data alone. Besides, the analyses get closer to independent humidity observations if the W-band reflectivity is assimilated alone or jointly with RASTA wind data. Nonetheless, the impact of the W-band reflectivity decreases more rapidly as the forecast range increases when compared to the assimilation of RASTA wind data alone. Generally, the joint assimilation of the W-band reflectivity with wind data results in the best improvement in the rainfall precipitation forecasts. Consequently, results of this study indicate that consistent thermodynamic and dynamic cloud conditions in the analysis leads to an improvement of both model initial conditions and forecasts. Even though to a lesser extent, the assimilation of the W-band reflectivity alone also results in a slight improvement of the rainfall precipitation forecasts.


Kilometre-scale numerical weather prediction (NWP) models are now able to explicitly resolve convection, and to represent clouds and precipitation with a reasonable degree of realism (Gustafsson et al., 2018). Doppler radar observations are particularly well suited to initialize these NWP models because they provide wind and reflectivity measurements at a comparable spatial and temporal resolution. Consequently, observations from ground-based precipitation radars are operationally assimilated in many kilometre-scale NWP models to initialize precipitation areas (Gustafsson et al., 2018). However, ground-based precipitation radars have a very poor sensitivity to clouds. Hence, the increased number of Doppler cloud-profiling radars (Wolde and Pazmany, 2005; Delanoë et al., 2013, 2016; Illingworth et al., 2015; Chahat et al., 2016) is extremely appealing in data assimilation to initialize kilometre-scale NWP models in cloudy areas. Indeed, cloud-profiling radars, either operating in the Ka-band (≈35 GHz) or in the W-band (≈95 GHz), provide valuable observations on cloud microphysical properties and light-to-moderate precipitation (Kollias et al., 2007). In addition, compared to lower-frequency radars, they require small antennas to provide high spatial resolution measurements, which makes them more easily deployable aboard moving platforms such as spacecraft or aircraft (Kollias et al., 2007). Besides, recent technological breakthroughs might lead to a deployment of lower-cost ground-based W-band radar networks (Delanoë et al., 2016).
Over the last few years, cloud radar data have been used several times for kilometre-scale NWP model validation (Di Michele et al., 2012; Iguchi et al., 2012; Hashino et al., 2013; Borderies et al., 2018), but only a few studies were devoted to evaluate their potential in data assimilation. In particular, within the Japan Meteorological Agency's (JMA) non-hydrostatic model (JMA-NHM) with an ensemble variational method (Aonashi and Eito, 2011), Okamoto et al. (2016) performed a direct assimilation of vertical reflectivity profiles of the dual-frequency precipitation radar (DPR) reflectivity observations from the Global Precipitation Measurement (GPM) core observatory (Hou et al., 2014) for the case of Typhoon Halong in July 2014. The assimilation of DPR data resulted in an improvement in the rain mixing ratio and updraught. However, because of negative model biases in the ice regions, observations were discarded in and above the melting layer. Therefore, Okamoto et al. (2016) did not take advantage of the cloud-affected observations measured by the Ka-band radar, which are very sensitive to clouds. In addition, ensemble variational methods are costly in terms of computing time, which hampers their use in most current operational systems.
Assimilating reflectivity with traditional variational assimilation techniques (3DVar and 4DVar) remains challenging. Indeed, the linearization of the observation forward operator is not straightforward. In addition, it is necessary to add hydrometeor contents in the control variables, which requires us to specify the associated forecast error covariances. Besides, the assimilation of humidity, wind and temperature variables have a larger impact on the forecasts compared to hydrometeor observations (Fabry and Sun, 2010). Consequently, several studies used indirect assimilation methods to assimilate cloud radar reflectivity measurements (Storto and Tveter, 2009; Janiskovà et al., 2012; Janisková, 2015). The reflectivity profiles are first inverted into pseudo-observations that are closer to the control variables of the NWP model (such as temperature or humidity) through the use of either a 1-D variational assimilation technique (Janiskovà et al., 2012; Janisková, 2015) or a 1-D Bayesian retrieval (Storto and Tveter, 2009). These pseudo-observations are then assimilated into the variational assimilation system like any other conventional observation. In most of these studies, cloud profiling radar (CPR) data on board CloudSat (Stephens, 2005) satellite were assimilated in NWP models running at coarse horizontal resolutions (larger than 10 km). For example, using a technique combining a one-dimensional variational (1DVar) assimilation method followed by a four-dimensional variational (4DVar) assimilation method, Janisková (2015) performed several assimilation experiments with the global-scale NWP model Integrated Forecasting System (IFS). To take full advantage of the W-band reflectivity in cloudy areas, Janisková (2015) applied an appropriate bias correction scheme which depends on the altitude and on the temperature. Results suggest a slight positive impact on the subsequent forecasts when appropriate bias correction, error estimates and quality controls are performed. However, because of the inability of the reflectivity forward operator (Di Michele et al., 2012) to simulate the multiple scattering effects, observations of the most convective situations were rejected from the assimilation process. Storto and Tveter (2009) also employed a two-step method consisting of a one-dimensional Bayesian retrieval of relative humidity pseudo-observations, followed by a 3DVar assimilation method in the ALADIN NWP model (Fischer et al., 2005). Results show that, despite the small number of assimilated observations, the impact of relative humidity pseudo-observations is greater in areas poorly covered by the conventional observation networks, such as over the oceans. However, Storto and Tveter (2009) failed to identify a case study for which the humidity pseudo-observations led to a significant impact on the analysis and on the subsequent forecasts.
So far, the impact of the assimilation of W-band radar reflectivity in a kilometre-scale NWP model, with horizontal resolutions of less than 3 km, has never been investigated. Therefore, the primary objective of this article is to investigate the benefits brought by the assimilation of W-band radar reflectivity measurements to improve the forecasts of the heavy precipitation events that regularly occur in the Mediterranean area. Indeed, the accurate forecasting of the timing, position and intensity of such mesoscale convective systems remains a challenge (Duffourg et al., 2016; Martinet et al., 2017). Doppler cloud radar data also provide valuable information on dynamical cloud properties. Borderies et al. (2019) highlighted a positive impact of the assimilation of such data in a kilometre-scale NWP model. The joint assimilation of W-band reflectivity measurements with wind data measured by Doppler cloud radar is expected to provide more consistent thermodynamic and dynamic cloud conditions in the initial state. Nonetheless, Bachmann et al. (2018) suggested that the joint assimilation leads to skill scores which are comparable to the experiments in which reflectivity and Doppler velocity observations are assimilated independently. However, their data assimilation experiments were conducted in an idealized setup, and the observations were provided by ground-based precipitation radar data. Therefore, to investigate the benefit brought by consistent thermodynamic and dynamic cloud conditions in the initial state, the W-band reflectivity will be separately and jointly assimilated with horizontal wind data measured by a Doppler W-band radar.
To assess the potential of Doppler W-band radar data to improve short-term forecasts of heavy precipitation events, we take advantage of the data collected by the airborne Doppler W-band radar RASTA (Radar Airborne System Tool for Atmosphere; Delanoë et al., 2013) in 2012 over the western Mediterranean area during the HyMeX first “special observing period” (HyMeX-SOP1; Ducrocq et al., 2014) dedicated to heavy precipitation events. The W-band reflectivity and wind measurements collected by RASTA are separately and jointly assimilated into the 3DVar assimilation system of a special version, named AROME-WMed (Fourrié et al., 2015), of the Météo-France operational convective-scale model AROME (Seity et al., 2011). The impact of the assimilation of RASTA data in synergy with all other conventional assimilated data is first evaluated for one of the most significant rainfall events which occurred during the “intensive observing period” 7a (Hally et al., 2014, IOP7a) of the HyMeX-SOP1. Next, the experiments are run for 32 case studies of the HyMeX-SOP1 in which RASTA data are available. The “1D+3DVar” assimilation method of Caumont et al. (2010), used operationally to assimilate ground-based precipitation radars in AROME (Wattrelot et al., 2014), is particularly well suited for vertically pointing radars and is thus employed to assimilate the W-band reflectivity observed by RASTA. Vertical profiles of relative humidity are first derived via a 1-D Bayesian retrieval, and then used as pseudo-observations in the 3DVar assimilation system of AROME. For the first time, a validation of the 1-D Bayesian retrieval with in situ humidity measurements is performed in this study.
This article is organized as follows. In Sect. 2, the data collected by the RASTA airborne Doppler W-band radar are presented, followed by a brief description of the NWP model AROME-WMed with its 3 h 3DVar assimilation system. Section 3 provides a full description of the 1D+3DVar assimilation method used to assimilate the W-band radar reflectivity. The different data assimilation experiments are presented in Sect. 4. These different experiments are evaluated in Sect. 5, followed in Sect. 6 by an evaluation of the 32 assimilation cases of the SOP1. Conclusions are drawn in Sect. 7.
This study takes advantage of the data collected by the RASTA Doppler W-band radar during the HyMeX first special observing period (HyMeX-SOP1), which took place from 5 September to 5 November 2012 over the western Mediterranean (Ducrocq et al., 2014). The main goal of the HyMeX-SOP1 was to document the heavy rainfall events that regularly affect the Mediterranean area.
2.1 The Doppler W-band radar RASTA during the HyMeX-SOP1
The airborne cloud radar RASTA is a monostatic Doppler multi-beam antenna system operating in the W band at 95 GHz (Bouniol et al., 2008; Protat et al., 2009; Delanoë et al., 2013). The aircraft platform used is the French Falcon 20 research aircraft from the SAFIRE unit (Service des Avions Français Instrumentés pour la Recherche en Environnement). RASTA has six Cassegrain antennas to measure the reflectivity and radial velocity in three non-collinear directions above and below the aircraft. The maximum unambiguous distance is 15 km with an unambiguous velocity of 7.8 m s−1 (the pulse repetition frequency equals 10 kHz).
After processing, the Doppler velocities of the three upward-looking and downward-looking antennas are combined to retrieve the three components of the wind field above and below the aircraft (Bousquet et al., 2016). The measurements are collected at a time resolution of 250 m s−1 (i.e. 1.5 s between two measurements of the same antenna) and at a vertical resolution of 60 m. In addition, this study takes advantage of the reflectivity measurements collected by the nadir- and zenith-pointing antennas. The zenith-pointing antenna is slightly less sensitive than the nadir-pointing antenna (−26 dBZ versus −27 dBZ at 1 km).
Therefore, this unique instrument allows for the recording of the microphysical and dynamic properties of clouds in the vertical at a high resolution of 60 m and quasi-continuously in time (≈1.5 s) during the flights. In particular, during the HyMeX-SOP1, RASTA collected data during 18 flights in stratiform (72.6 %), convective (14.3 %) and clear-sky (13.1 %) columns over land, sea and complex terrain (Borderies et al., 2018). RASTA flight tracks during the HyMeX-SOP1 are represented by the black lines in Fig. 1. Further details about the RASTA configuration during the HyMeX-SOP1 are given by Bousquet et al. (2016).
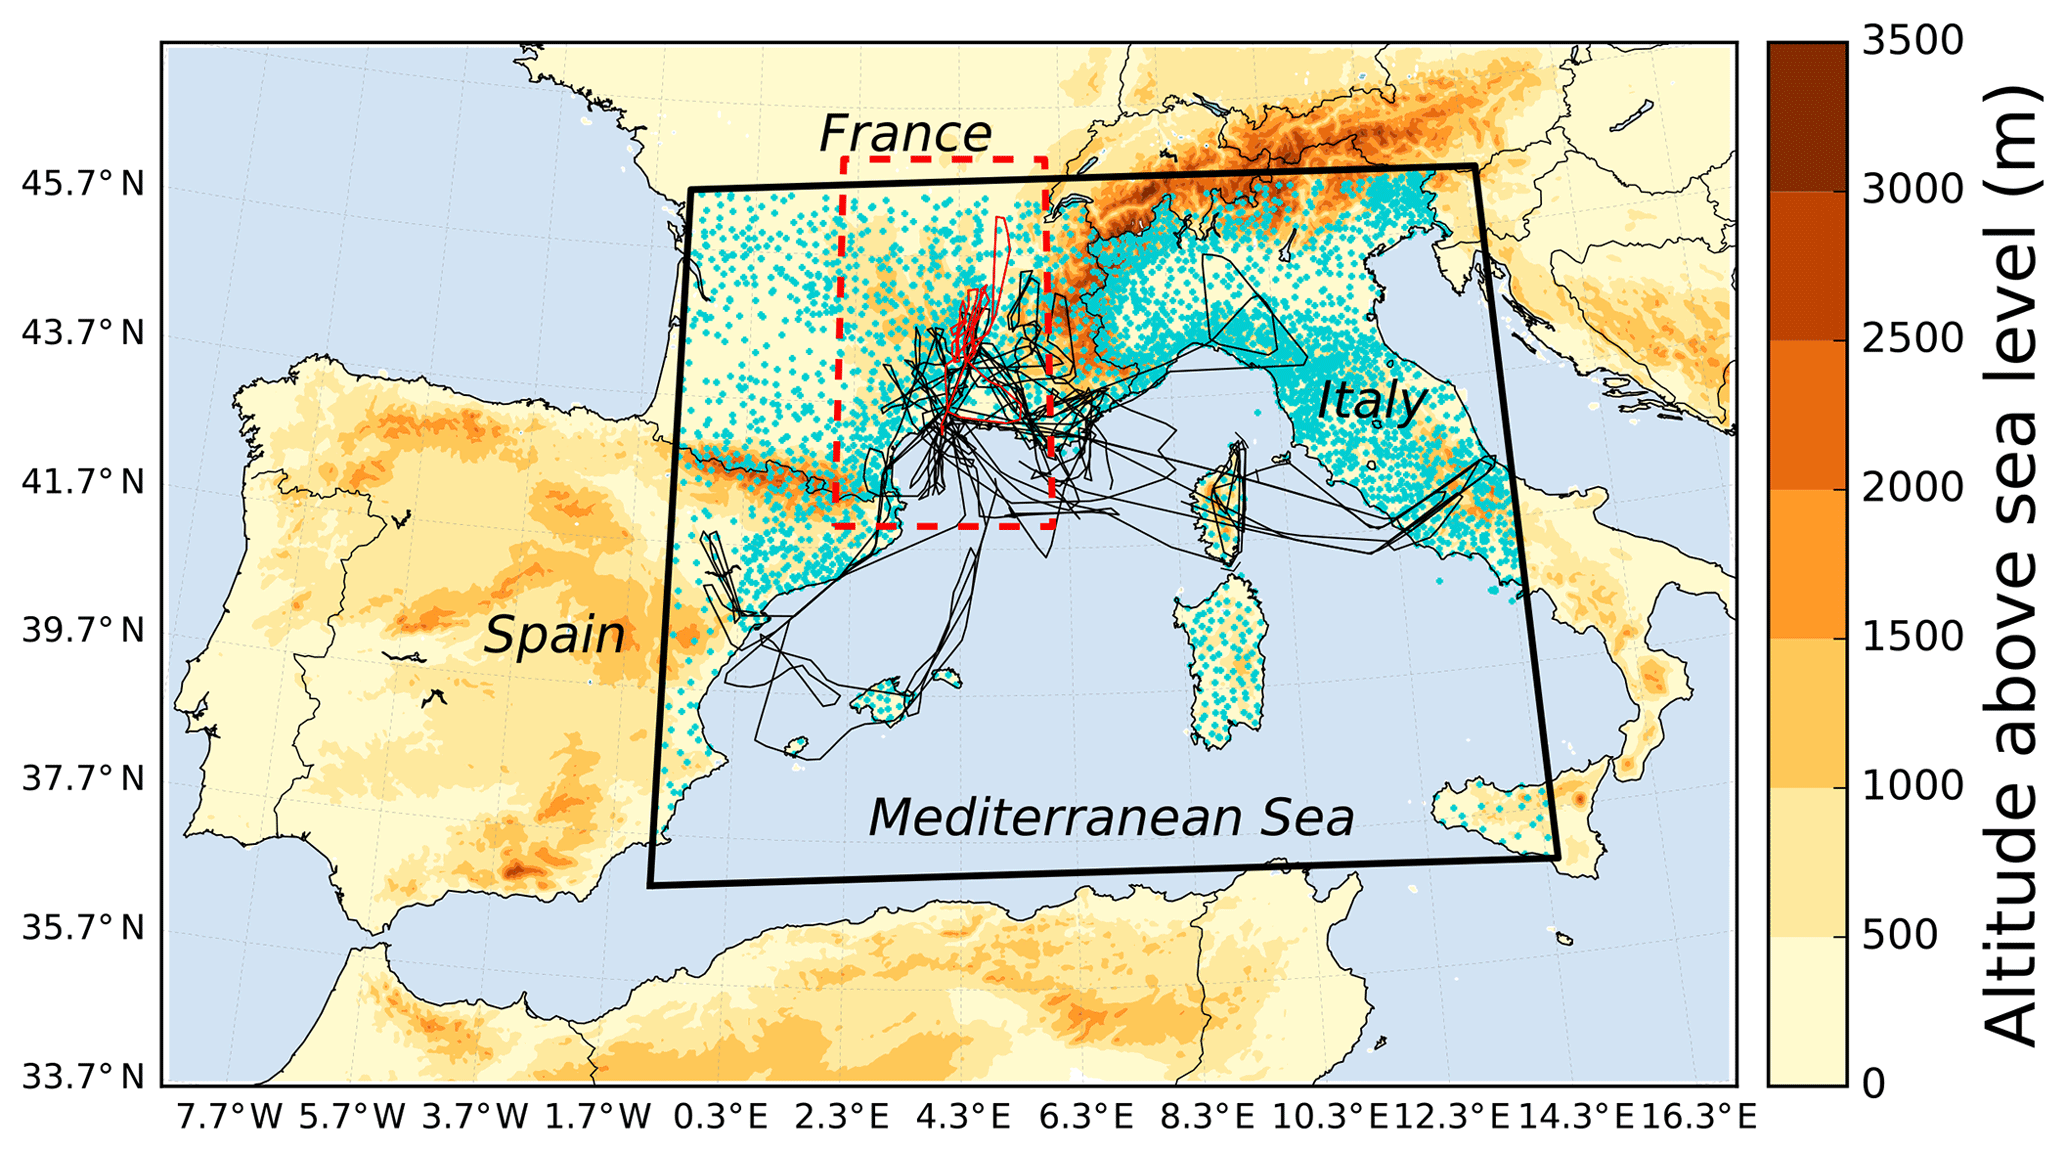
Figure 1The Falcon 20 flight tracks (black lines) during the HyMeX first special observing period over the AROME-WMed domain. The Falcon 20 flight track during IOP7a (flight 15) is indicated by the red line. IOP7a case study is delimited by the red box. The altitude of ground above sea level (in metres) is represented by the colour shades. The rain gauges are represented by the blue markers. The black box shows the domain used for the impact study in Sect. 6.1.
2.2 The AROME-WMed NWP model
This study is performed with a special version of the Météo-France operational kilometre-scale NWP model AROME (Seity et al., 2011), named AROME-WMed (Fourrié et al., 2015). AROME-WMed, which covers the entire northwestern Mediterranean Basin, was specially designed for the HyMeX-SOP1 and ran in real time to plan the airborne operations, especially in the mesoscale convective systems. The AROME-WMed domain is displayed in Fig. 1. AROME-WMed runs at a horizontal resolution of 2.5 km with 60 vertical levels ranging from approximately 10 m a.g.l. to 1 hPa. The deep convection is explicitly resolved and the microphysical processes are governed by the ICE3 one-moment bulk microphysical scheme (Pinty and Jabouille, 1998). Six water species are predicted by AROME-WMed (water vapour, rain, cloud liquid droplets, snow, pristine ice and graupel). The particle size distributions (PSDs) are expressed as generalized gamma distributions multiplied by the total number concentrations. PSDs are reduced to exponential distributions for snow, graupel and rain.
The analyses of the ARPEGE global operational NWP model are used to provide boundary conditions. AROME-WMed has a 3 h 3D variational (3DVar) data assimilation system (Brousseau et al., 2014) based on an incremental formulation (Fischer et al., 2005). The control variables of this system are temperature, specific humidity, surface pressure, vorticity and divergence. The resolution of the analysis grid is the same as that of AROME-WMed. Following the results of Brousseau (2012), the incremental analysis update (IAU; Bloom et al., 1996) is not used for the 3DVar assimilation scheme. Background error covariances were computed using a period characterized by convective systems in October 2010 over the northwestern Mediterranean region (Fourrié et al., 2015). Every 3 h, an analysis is computed by using all observations available within a ±1 h 30 min assimilation window and a 3 h forecast is produced to provide a background for the next cycle. The assimilation system ingests a wide variety of observations from satellite, ground-based GPS, aircraft, radiosondes, drifting buoys, balloons and wind profilers, automatic land and ship weather stations, and ground-based precipitation radars of the French network ARAMIS (reflectivity and radial velocity). The purpose of this study is to assess the impact of the assimilation of RASTA data in addition to this already dense observing network.
2.3 RASTA data pre-processing
RASTA data are discarded between 250 m above and 250 m below the aircraft, which is the minimal measuring range of the zenith- and nadir-pointing antennas. Ground clutter is also removed. To reduce observation and representativeness errors, RASTA data are interpolated in the model vertical and horizontal resolutions. For the reflectivity measurements, this interpolation is done by taking the average value (in mm6 m−3) of all data available along the aircraft track within a box of 2.5 km length between the two half model levels surrounding each model level. From a given range from the radar, when the aircraft roll and/or pitch angles are greater than a threshold (|roll| >7∘ at 10 km range), some measurements might come out of the grid box of interest (Borderies et al., 2019). Therefore, these data are removed from the interpolation. The same interpolation is done for the retrieved horizontal wind component except that a median filter is employed. Indeed, applying a median filter instead of averaging allows us to reduce the influence of outliers, due to the difficulty of having high-quality measurements for airborne Doppler radar (Bosart et al., 2002).
After this pre-processing, a thinning is applied to RASTA data to decrease observation density and satisfy assumptions about observation error covariances, which are supposed to be 0 dB2. It is particularly true for measurements made by different instruments, which have independent physical errors. However, this hypothesis might be no more valid if the observations are collected very close to each other by the same instrument. Applying a thinning to the observations is therefore necessary for having satisfactory assumptions about observation error covariances (Rohn et al., 2001; Liu and Rabier, 2002). Therefore, RASTA data are assimilated every 3 time steps, which is equivalent to a distance of approximately 5 to 9 km depending on the aircraft speed. The data are not thinned vertically because the vertical forecast error covariances are less marked than the horizontal ones (Brousseau et al., 2011) and it is thus not useful to apply any thinning in that case (Jacques and Zawadzki, 2014).
3.1 The 1D+3DVar assimilation method
Here, we employ the 1D+3DVar assimilation method (Caumont et al., 2010; Wattrelot et al., 2014) used operationally to assimilate ground-based precipitation radar data in AROME. This data assimilation technique allows us to shift a pattern that was well simulated by the model but at a wrong location. It relies on the ability of the model to create consistent moisture and reflectivity profiles. Indeed, cloudy areas are generally associated with relative humidity close to the saturation and high reflectivity values. This method is particularly well suited for vertically pointing radars because the first step of the assimilation method is based on the differences between different vertical profiles of reflectivities. For instance, since March 2016, this assimilation method is operationally employed to assimilate vertical profiles of DPR reflectivity data in the Japanese kilometre-scale NWP model (JMA-NHM) (Ikuta, 2016).
The first step consists of a 1-D Bayesian retrieval of the best estimate of relative humidity (RH) profiles, named hereafter pseudo-observations (PO), given the observed vertical profile of reflectivity Zo. For each observed column of reflectivity Zo, the corresponding vertical profile of RH pseudo-observation is given by
with
where
-
subscript i denotes the index of the model profile in the vicinity of the observed profile of reflectivity;
-
is the vertical column of relative humidity from the model background;
-
Hz(xk) is the simulated reflectivity (in dBZ) at the model level k, given the model state xk; Hz being the forward operator;
-
no is the number of valid observed reflectivity data in the column;
-
bk is the bias correction value used at the altitude k (in dB), described in Sect. 3.2; and
-
σo is the standard deviation of observation and forward operator errors (in dB).
The W-band reflectivity forward operator Hz described by Borderies et al. (2018) is used to simulate the reflectivity. It is consistent with the ICE3 one-moment microphysical scheme of AROME and takes the hydrometeor contents of the five hydrometeor species (rain, snow, graupel, cloud liquid water and pristine ice), temperature, pressure and relative humidity as input parameters. The T-matrix method (Mishchenko et al., 1996) is employed to compute the single scattering properties. Following the results of Borderies et al. (2018), the graupel axis ratio is set to 0.8, snow axis ratio to 0.7 and pristine ice axis ratio to 1. The forward operator returns the simulated reflectivity at each range gate from the radar and accounts for hydrometeors and water vapour attenuation.
According to Eq. (1), for each observed vertical profile Zo, the vertical column of RH pseudo-observation is a linear combination of the neighbouring RH profiles taken from the model background .
The neighbouring profiles are located in a 160 km wide square centred on the aircraft location. For the AROME-WMed model, this size is sufficient to reduce the effects of spatial mismatches between model and observations (Borderies et al., 2018) and to gather a database of which are consistent with the meteorological situation. In addition, the profiles would become less representative with a larger size since meteorological environments can change over ≈100 km.
In Eq. (1), the profiles are weighted by a function (JPO) of the difference between the observed Zo and simulated Hz(xi) column of reflectivities (cf. Eq. 2). Thus, larger weights are given to the neighbouring columns that most closely resemble the observations. To ensure equivalent weights regardless of the number of altitude levels used for each neighbourhood profile, the square difference in Eq. (2) is divided by the number of valid data over the observed column of reflectivity.
The square difference is also divided by the observation error variance . A small σo will favour the neighbouring columns that most closely resemble the observation. However, if there is no simulated profile of reflectivity which is close enough to the observed one, there will be no retrieval since the weight tends towards a value close to 0. Hence, a small σo either leads to an accurate retrieval or to no retrieval at all. On the other hand, a large σo would give similar weights and smooth the neighbourhood profiles, regardless of the extent to which they resemble the observed profile of reflectivity (Caumont et al., 2010). Therefore, a sensitivity study is performed in Sect. 3.3 to σo values.
The Bayesian retrieval is not applied in the case of clear sky, i.e. when all the reflectivities over the whole vertical column are below the radar sensitivity in both the simulations and the observations. However, if the simulations indicate cloud or precipitation, the closest “clear-sky” profile in the vicinity of the radar is selected for the retrieval.
In the second step of the 1D+3DVar assimilation approach, the retrieved vertical profiles of relative humidity pseudo-observations are assimilated in the 3DVar assimilation system of AROME-WMed, like any other conventional observations.
3.2 Bias correction
The Bayesian retrieval can also be applied to other variables using the same weights as those from the retrieval of RH profiles (in Eq. 2), for example to retrieve reflectivity pseudo-observations :
The reflectivity pseudo-observation can be used as an indicator to evaluate the quality of the 1-D Bayesian retrieval and to estimate the biases that can arise between observations and simulations. Indeed, in data assimilation it is necessary to have unbiased quantities and to remove these systematic errors (Janisková, 2015; Okamoto et al., 2016). These biases can arise from the observations, the ICE3 microphysical scheme and/or the forward operator formulations. Janisková (2015) showed that the biases between observations and simulations depend on the temperature and on the altitude. Since this study is focused on one specific area of interest during the same season, the bias is mainly a function of the altitude. The bias is also a function of the error standard deviation σo. Indeed, while a small value of σo favours the simulated columns that most closely resemble the observations, a larger value of σo smooths the simulated reflectivity profiles.
Therefore, a bias b was determined from the statistics between Zo and using the altitude and the error standard deviation σo as predictors. Calculations were performed for all flights during the HyMeX-SOP1 every 4 time steps. The background states of a control (CTRL) experiment were used as a reference to simulate the reflectivity pseudo-observations and to estimate the biases. The CTRL experiment was run during a 45-day cycled period from 00:00 UTC 24 September 2012 – which is the day when the Falcon 20 first flew during HyMeX-SOP1 – to 5 November 2012, after the last flight. It includes all the observations that are operationally assimilated (see Sect. 2.2).
The bias between RASTA observations and the reflectivity pseudo-observations is depicted in Fig. 2 as a function of the altitude for different values of σo (see legend). Calculations were only performed if both the observation and the reflectivity pseudo-observation are above the radar sensitivity. The number of observations used for the calculations is also shown in Fig. 2b. This number is smaller for small values of σo (red curve) because it constrains the amount of retrieved profile of reflectivity pseudo-observations to only those which most closely resemble the observations.

Figure 2Bias (a) between RASTA reflectivity and the reflectivity pseudo-observation as a function of the altitude for different values of error standard deviation σo (see legend box). Panel (b) shows the number of observations used for the calculations as a function of the altitude for the different values of error standard deviation σo.
Figure 2 shows that the bias increases with the altitude, which is consistent with the existence of model biases in cloudy areas in the ICE3 microphysical scheme of AROME-WMed (Borderies et al., 2018; Taufour et al., 2018). Figure 2 highlights the fact that, because of the smoothing effect, the bias increases with the error standard deviation σo. Indeed, at approximately 6 km altitude, the bias can reach up to 6 dB if σo equals 9 dB, and only ≈1.5 dB if σo equals 2 dB.
The effect of the bias correction is shown in Fig. 3, in which a contoured frequency by altitude diagram (CFAD) of the differences between the observed reflectivity and the bias-corrected reflectivity pseudo-observations are shown for a σo of 2 dB. The residual bias is indicated by the black line. Figure 3 demonstrates that, after applying the bias correction in Eq. (2), the residual bias is close to 0 dB except above an altitude of approximately 10 km, which is probably due to the smaller number of points used to calculate the bias correction. As explained by Janisková (2015), the use of additional predictors, such as temperature or hydrometeor contents, could lead to an improvement in the bias correction at higher altitude.
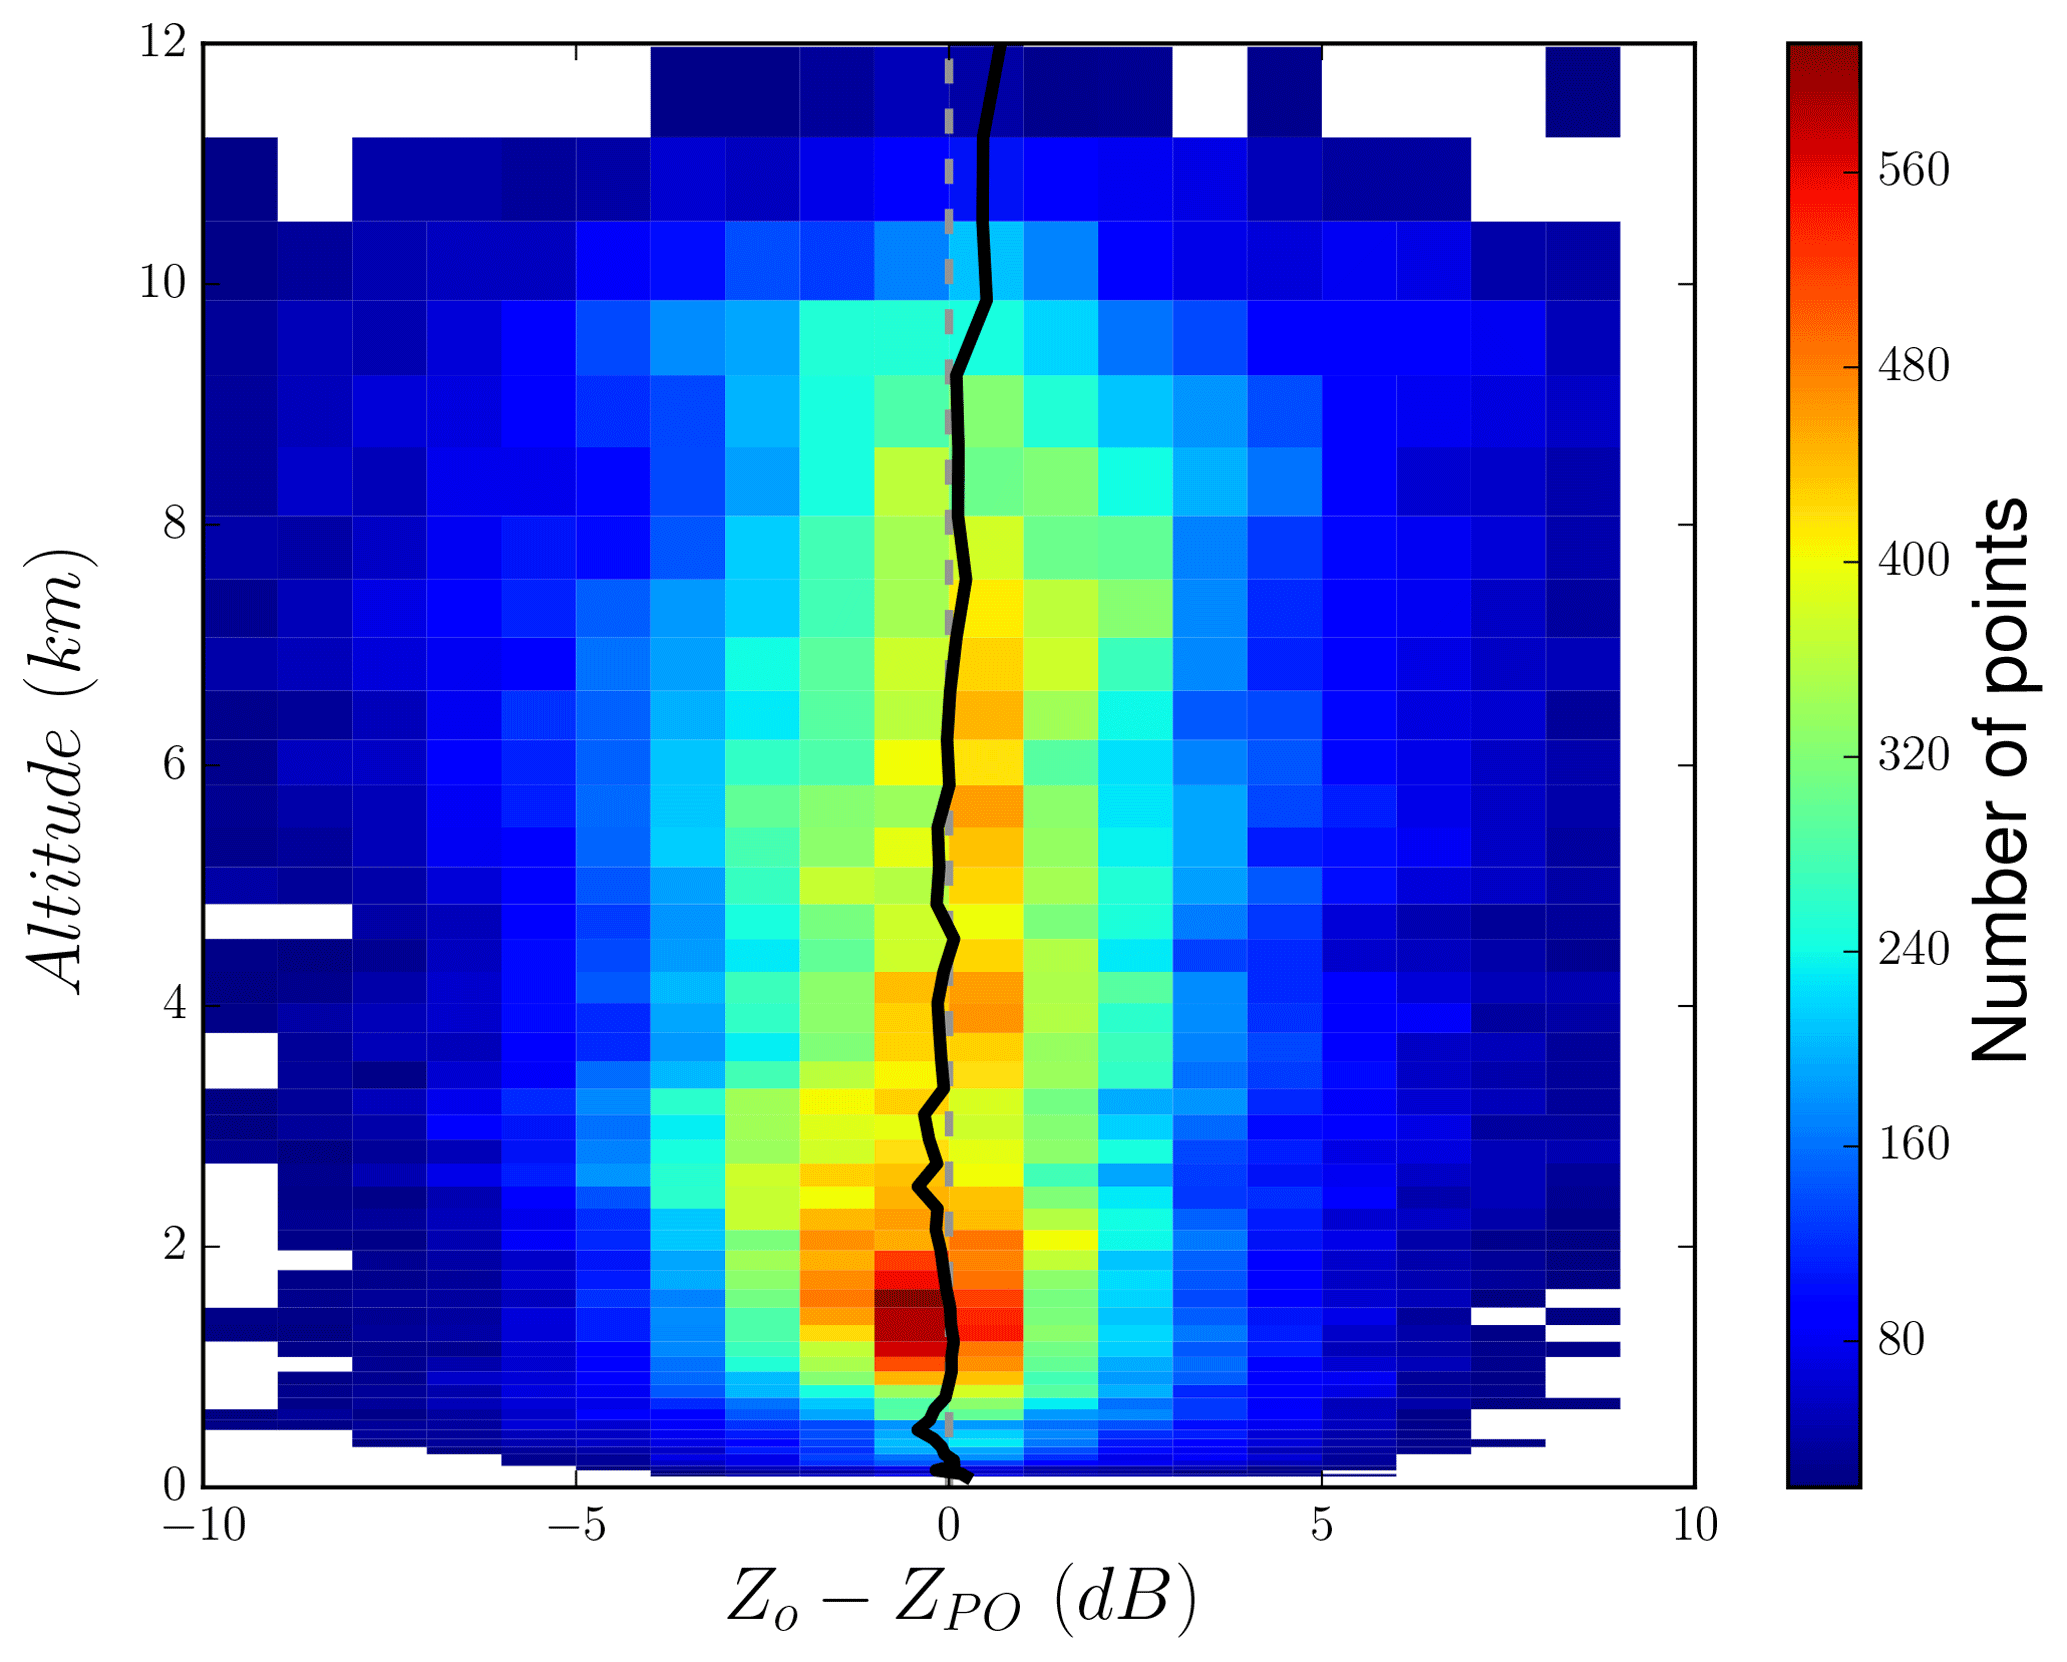
Figure 3Contoured frequency by altitude diagram (CFAD) of the differences between the observed reflectivity and the bias-corrected reflectivity pseudo-observations. The residual bias after applying the bias correction is indicated by the black line.
3.3 Observation error within the Bayesian inversion
As explained in Eq. (2), the quality of the 1-D Bayesian retrieval relies on the specification of standard deviation of observation and forward operator errors σo (in dB). In-flight water vapour mixing ratio measurements, ro, are available at the flight level and can be used to estimate σo and to evaluate the quality of the retrieval. These data present the advantage of being completely independent from the retrieval and they allow the evaluation of the humidity pseudo-observations which will then be assimilated in the 3DVar assimilation system of AROME-WMed.
The 1-D Bayesian retrieval is applied to the CTRL background states for error standard deviations σo ranging from 0.6 to 9 dB. The bias correction, which has been calculated for each σo in Sect. 3.2, is applied in Eq. (2). The retrieved pseudo-observations, rm, of water vapour mixing ratio at the flight level are then compared with the in-flight measurements, ro, over 32 flights of the HyMeX SOP1. The comparison is done as follows. First, a manual data quality control is applied to in situ humidity observations in order to remove the poor-quality measurements that can arise from instabilities or periods of malfunctioning during the flights. After this quality control, 24 flights out of 32 remain. Second, water vapour mixing ratio measurements are averaged over 12 time steps to reduce observation noise and representation errors.
Figure 4 shows the standard deviations (Fig. 4b) and biases (Fig. 4a) between the observed in-flight water vapour mixing ratio and the retrieved ones (red curve) as a function of the error standard deviations σo. The standard deviations between in-flight measurements and the background water vapour mixing ratio are also represented by the black data points.
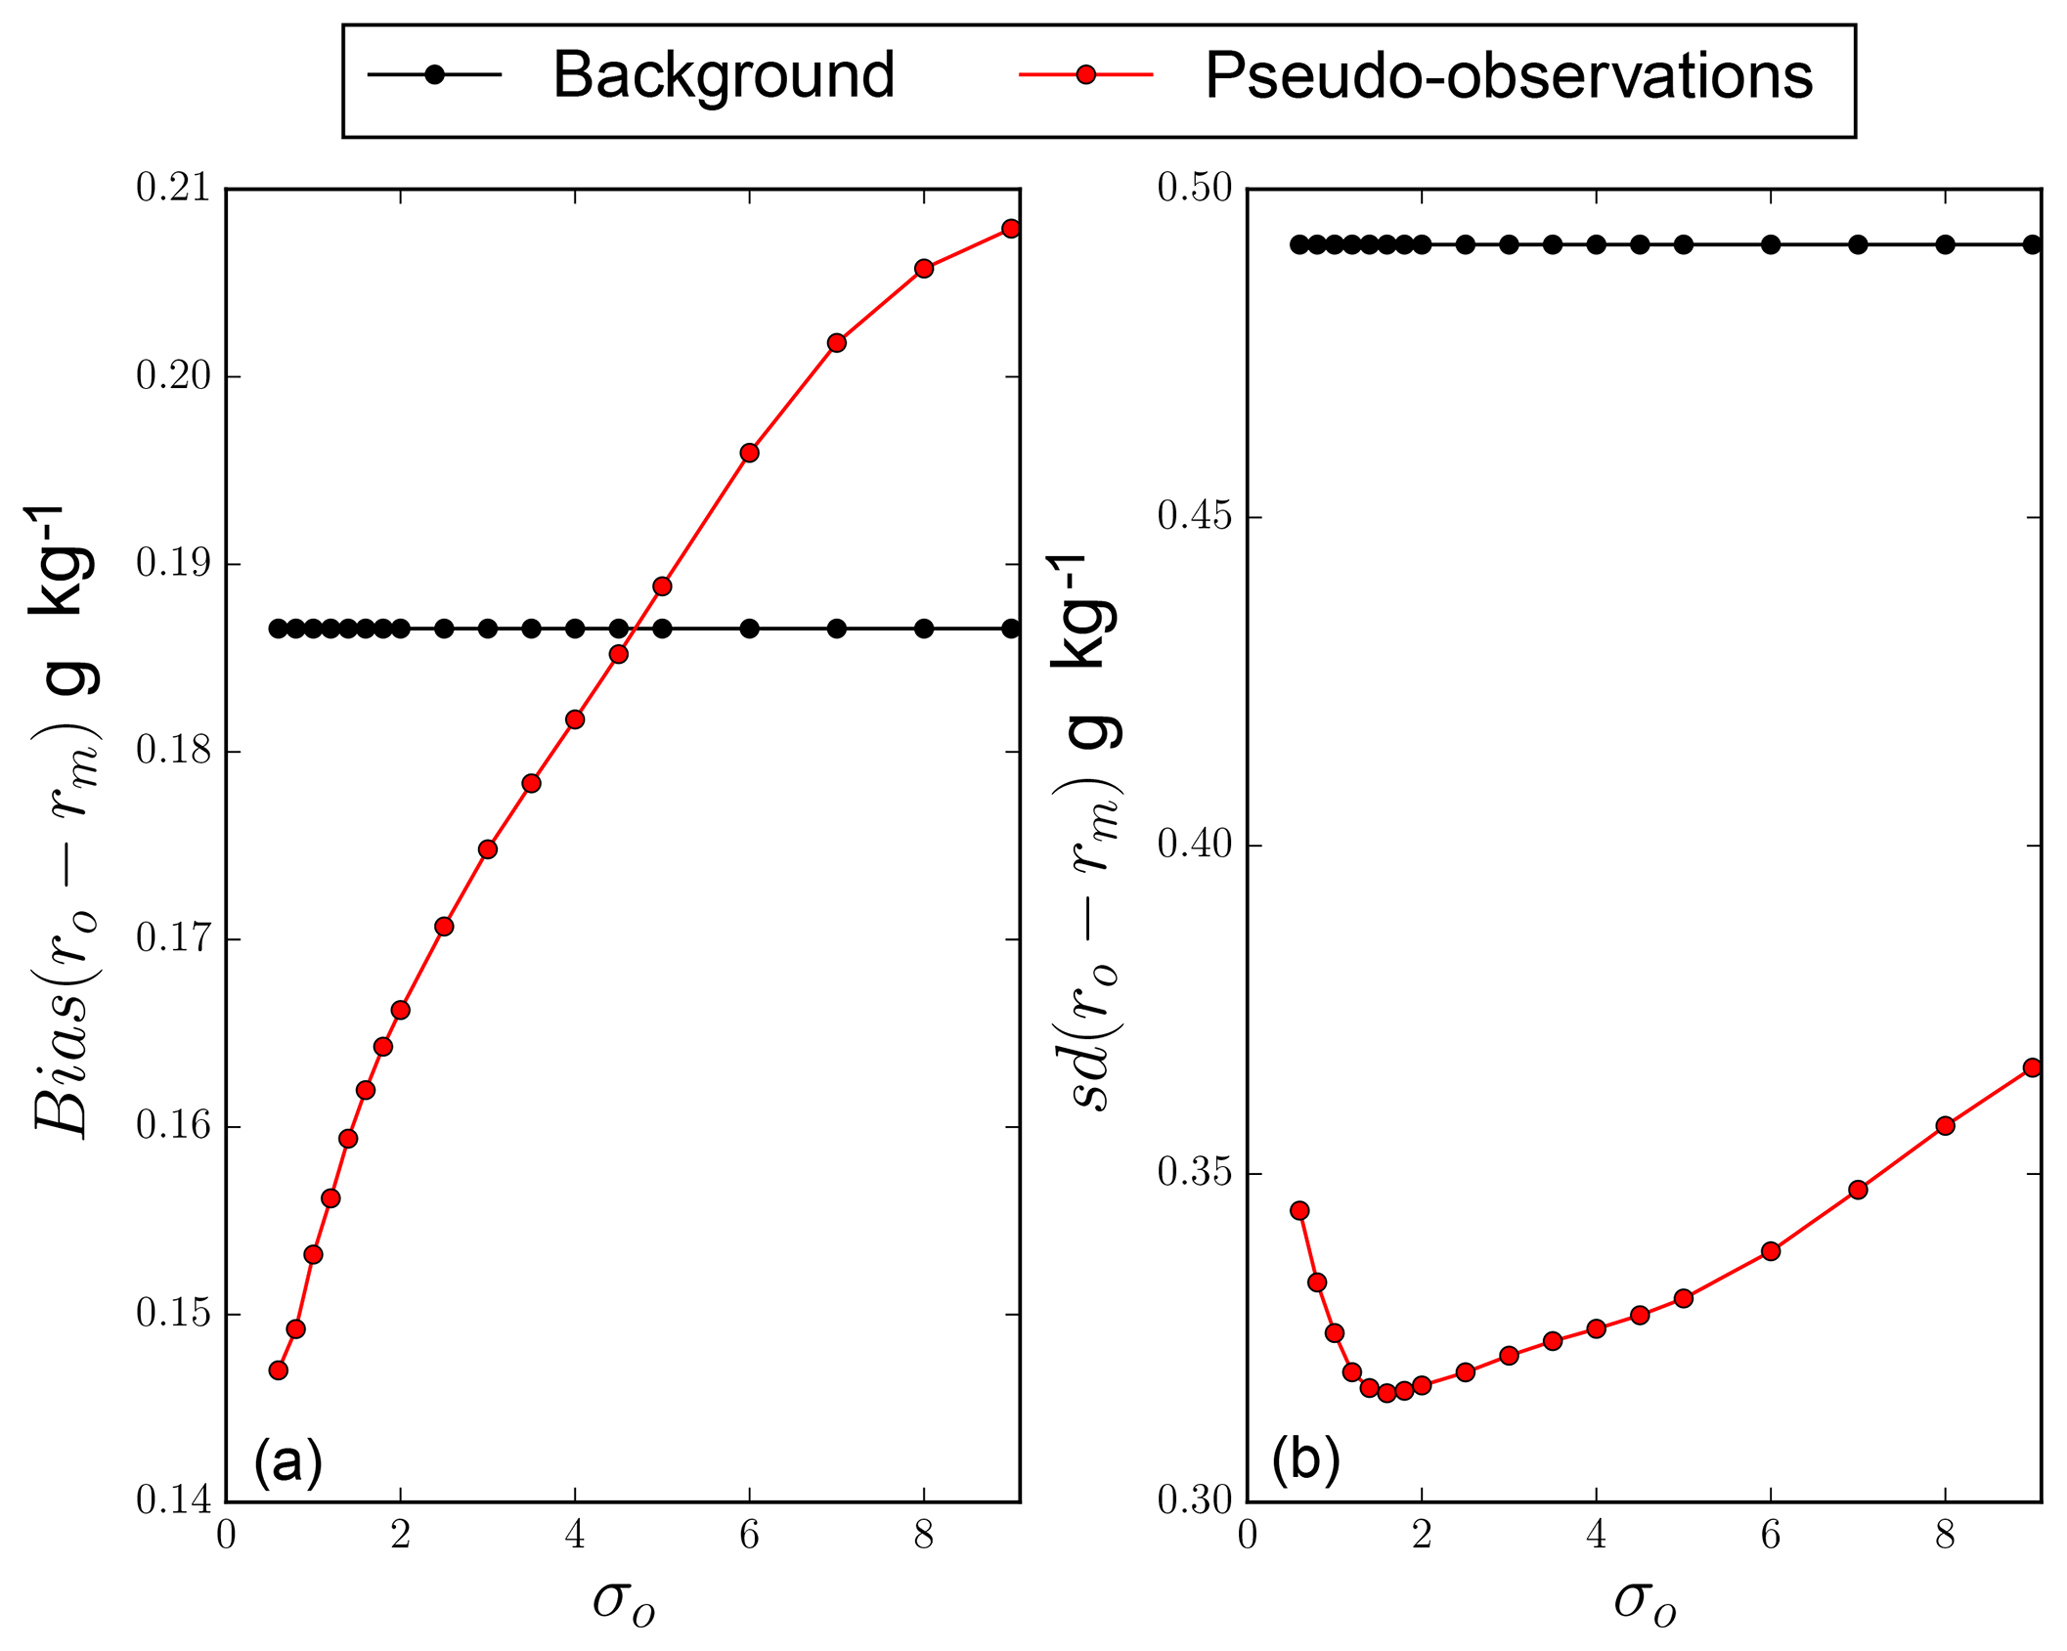
Figure 4Standard deviations (b, in g kg−1) and biases (a, in g kg−1) of the water vapour mixing ratio differences between in-flight measurements, rq, and the retrieved ones, rm (red), as a function of the error standard deviations σo (in dB). The standard deviations and biases before applying the 1-D Bayesian retrieval are represented by the black data points.
The standard deviation values in Fig. 4 demonstrate that the retrieved water vapour mixing ratios are always in better agreement with the in-flight measurements compared to the background state. This improvement highlights the ability of the 1-D Bayesian method to retrieve humidity fields that are closer to independent observations. The variation in the standard deviation indicates the existence of an optimal value of σo of approximately 2 dB. Indeed, below 2 dB, the standard deviation increases with decreasing σo. This is due to the tendency of the retrieval to be more selective for small values of σo, which results in using the background state instead of applying the retrieval. On the contrary, above 2 dB, the standard deviation increases with σo. Indeed, a large σo increases the number of successful inversions, but smooths them to produce the resulting humidity pseudo-observations. Finally, it should be noted that the bias is also improved with a σo of 2 dB (Fig. 4a). Hence, we decided to use an error standard deviation σo of 2 dB for the rest of this study.
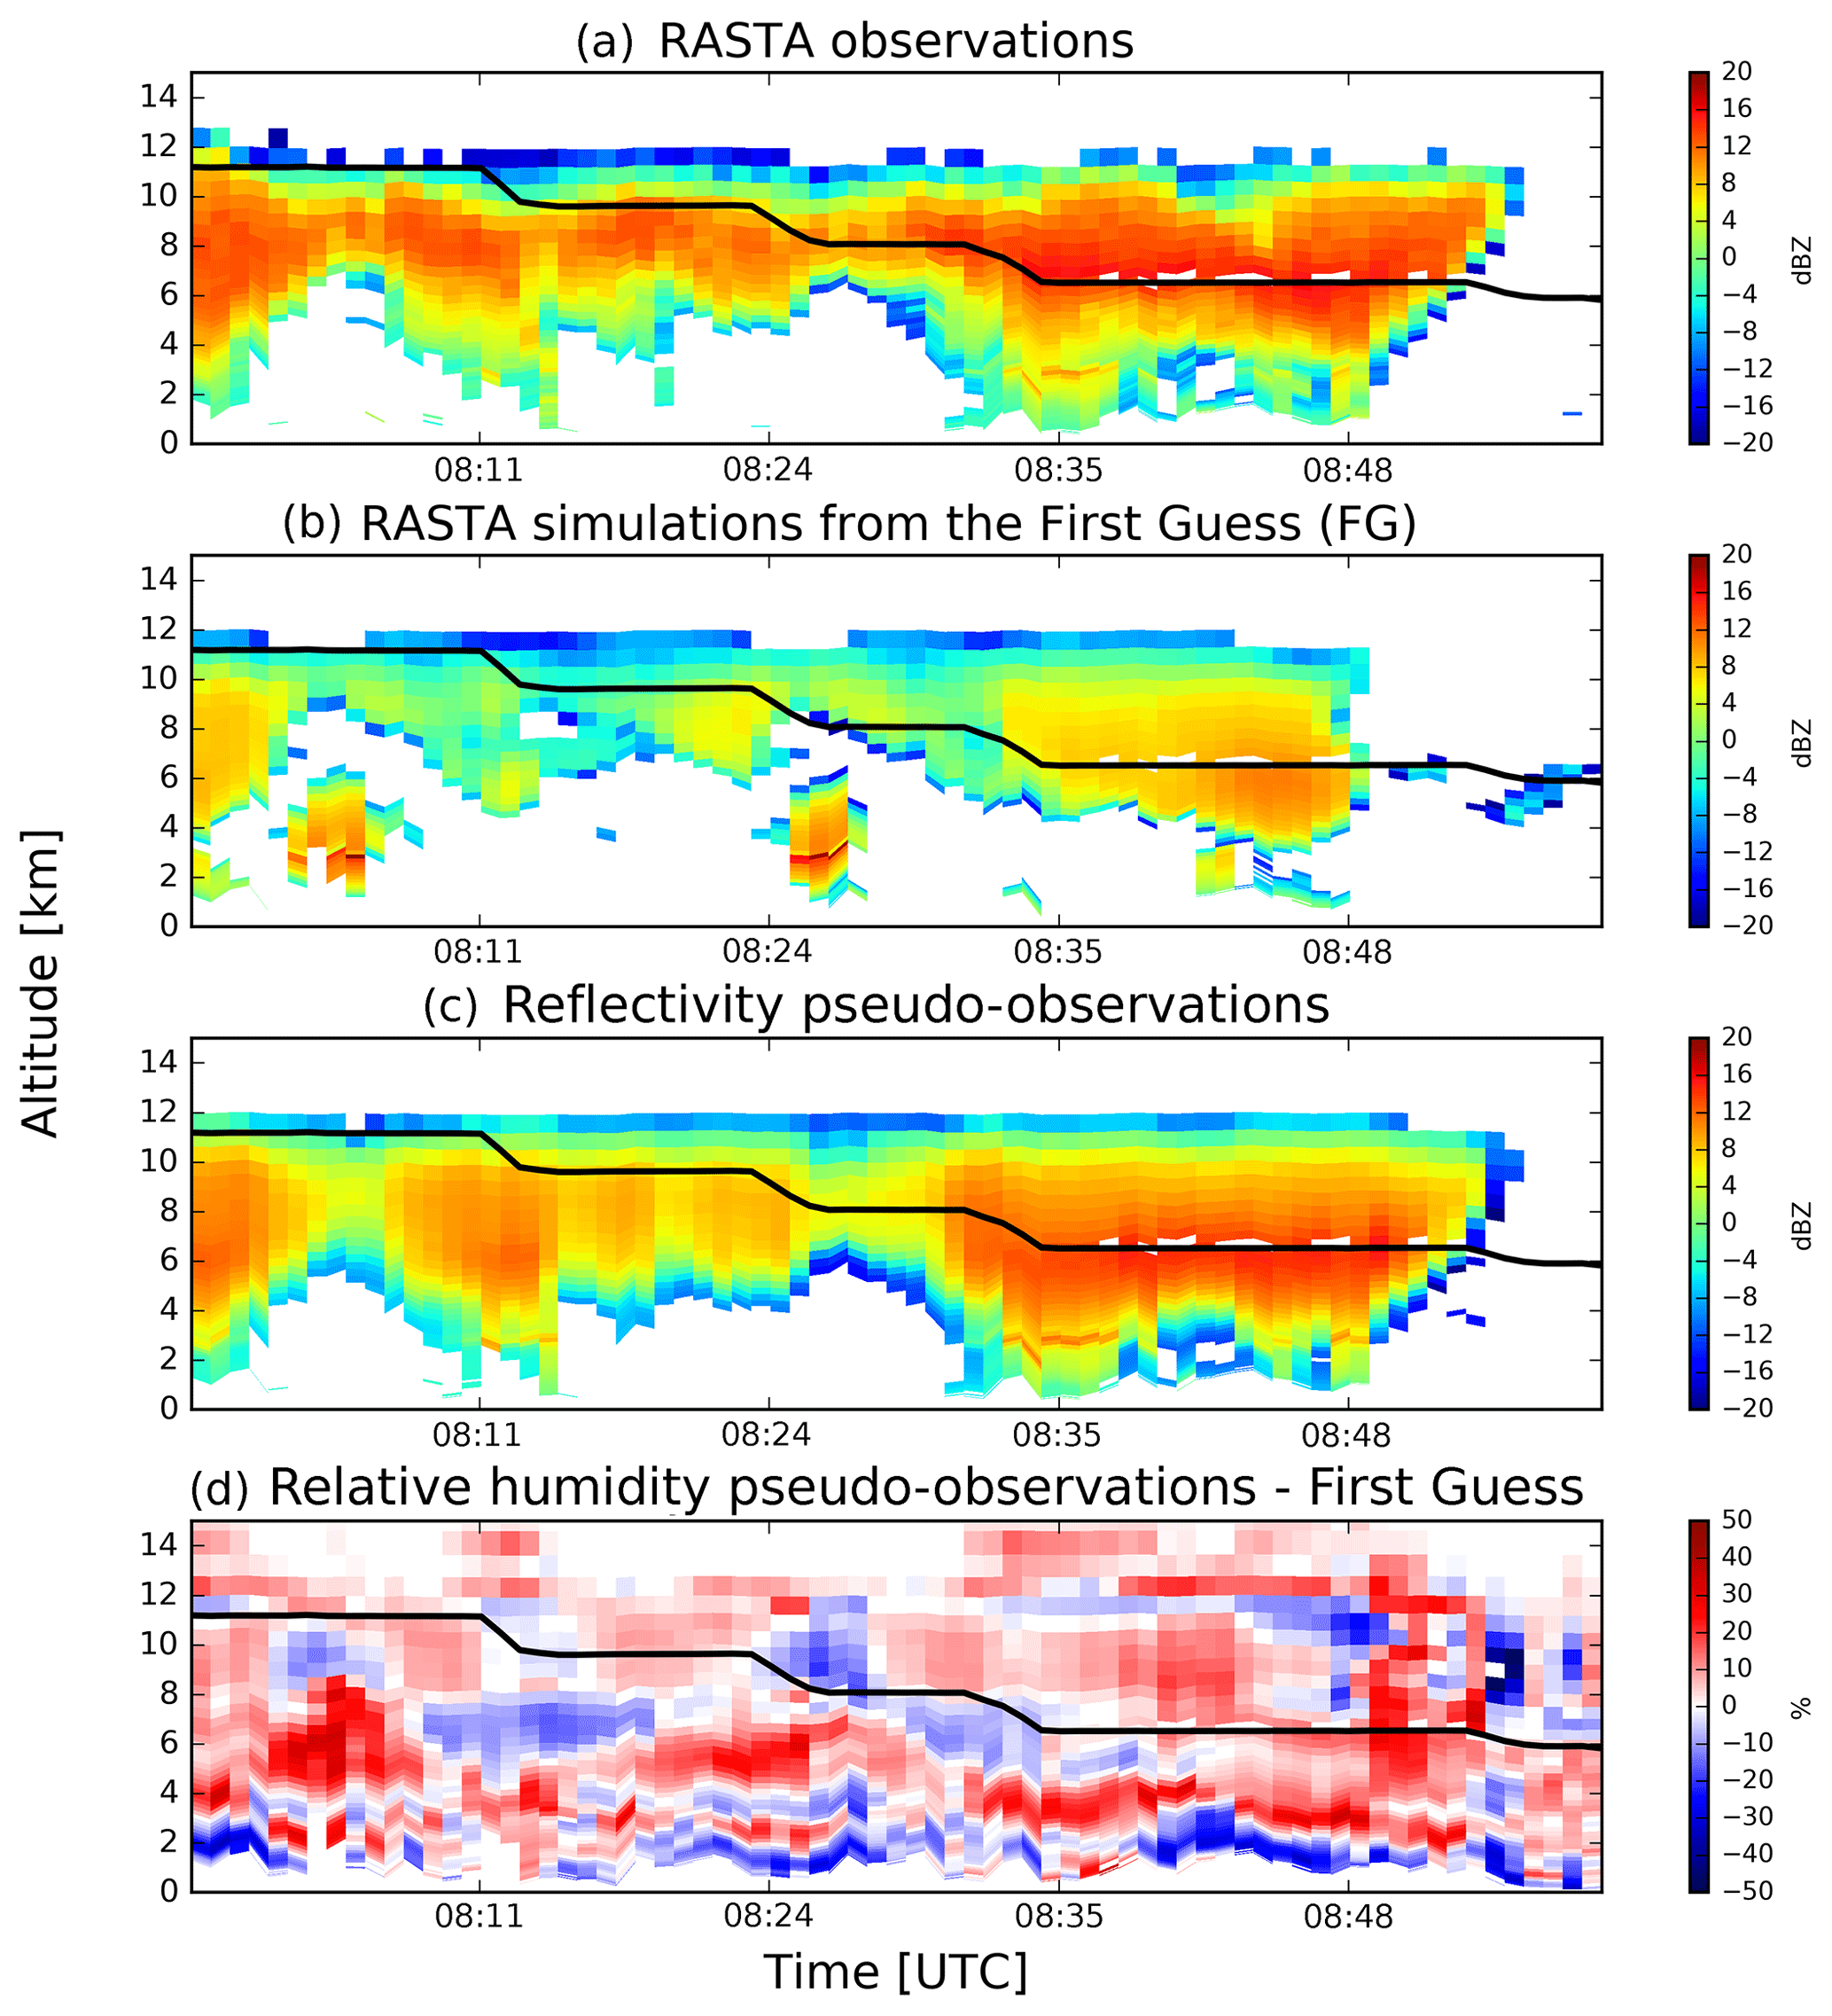
Figure 5Time–height cross section of the reflectivity observed by RASTA (a), simulated from the background (b) and pseudo-observations (c). The differences between the RH pseudo-observations and the relative humidity from the background state are shown in (d). Aircraft altitude is indicated by the black line.
To assess the potential of RASTA data to improve analyses and forecasts of heavy precipitation events, a total of 4 experiments is conducted. The CTRL experiment includes all the observations that are operationally assimilated (see Sect. 2.2). Three additional RASTA experimental designs (Z, V, ZV) share the same configuration as CTRL, except that they also include the assimilation of RASTA data. The reflectivity observed by RASTA is assimilated alone in the Z experiment, and jointly with RASTA horizontal wind components in the ZV experiment. The 1D+3DVar assimilation method described in Sect. 3.1 is employed to assimilate RASTA reflectivity observations in the Z and ZV experiments. In addition, the V experiment includes the assimilation of RASTA wind data alone. As explained by Borderies et al. (2019), the assimilation of RASTA wind data is straightforward and does not require the use of a radial wind observation operator. Indeed, the Doppler multi-beam antenna system of RASTA allows the retrieval of the horizontal wind components (u, v), which are directly linked to two control variables of the AROME model (vorticity and divergence).
RASTA data are not measured simultaneously but over the flight leg. Consequently, at each assimilation cycle, the 3DVar assimilation system of AROME-WMed ingests all the RH pseudo-observations and/or RASTA wind data available during a 2 h assimilation window centred on the assimilation time T, as if they were valid at time T. A larger assimilation window increases the number of observations and results in larger coverage. However, since RH pseudo-observations vary with convective systems, which can evolve quickly in time, a larger assimilation window would result in assimilating data that are no longer valid at the current assimilation time T. Besides, Borderies et al. (2019) conducted a sensitivity study to the length of the assimilation window by assimilating airborne Doppler wind radar data in the 3DVar assimilation system of AROME-WMed. Results indicated that, even though the best scores were reached with a 3 h assimilation window, a slight positive improvement of the 8 h precipitation forecasts was also evidenced with a 2 h assimilation window. Therefore, a 2 h assimilation window is a good compromise to assimilate a larger number of observations, which are nearly valid at the assimilation time, without adding any detrimental observation in the assimilation system. Hence, the length of the assimilation window has been set to 2 h in this study.
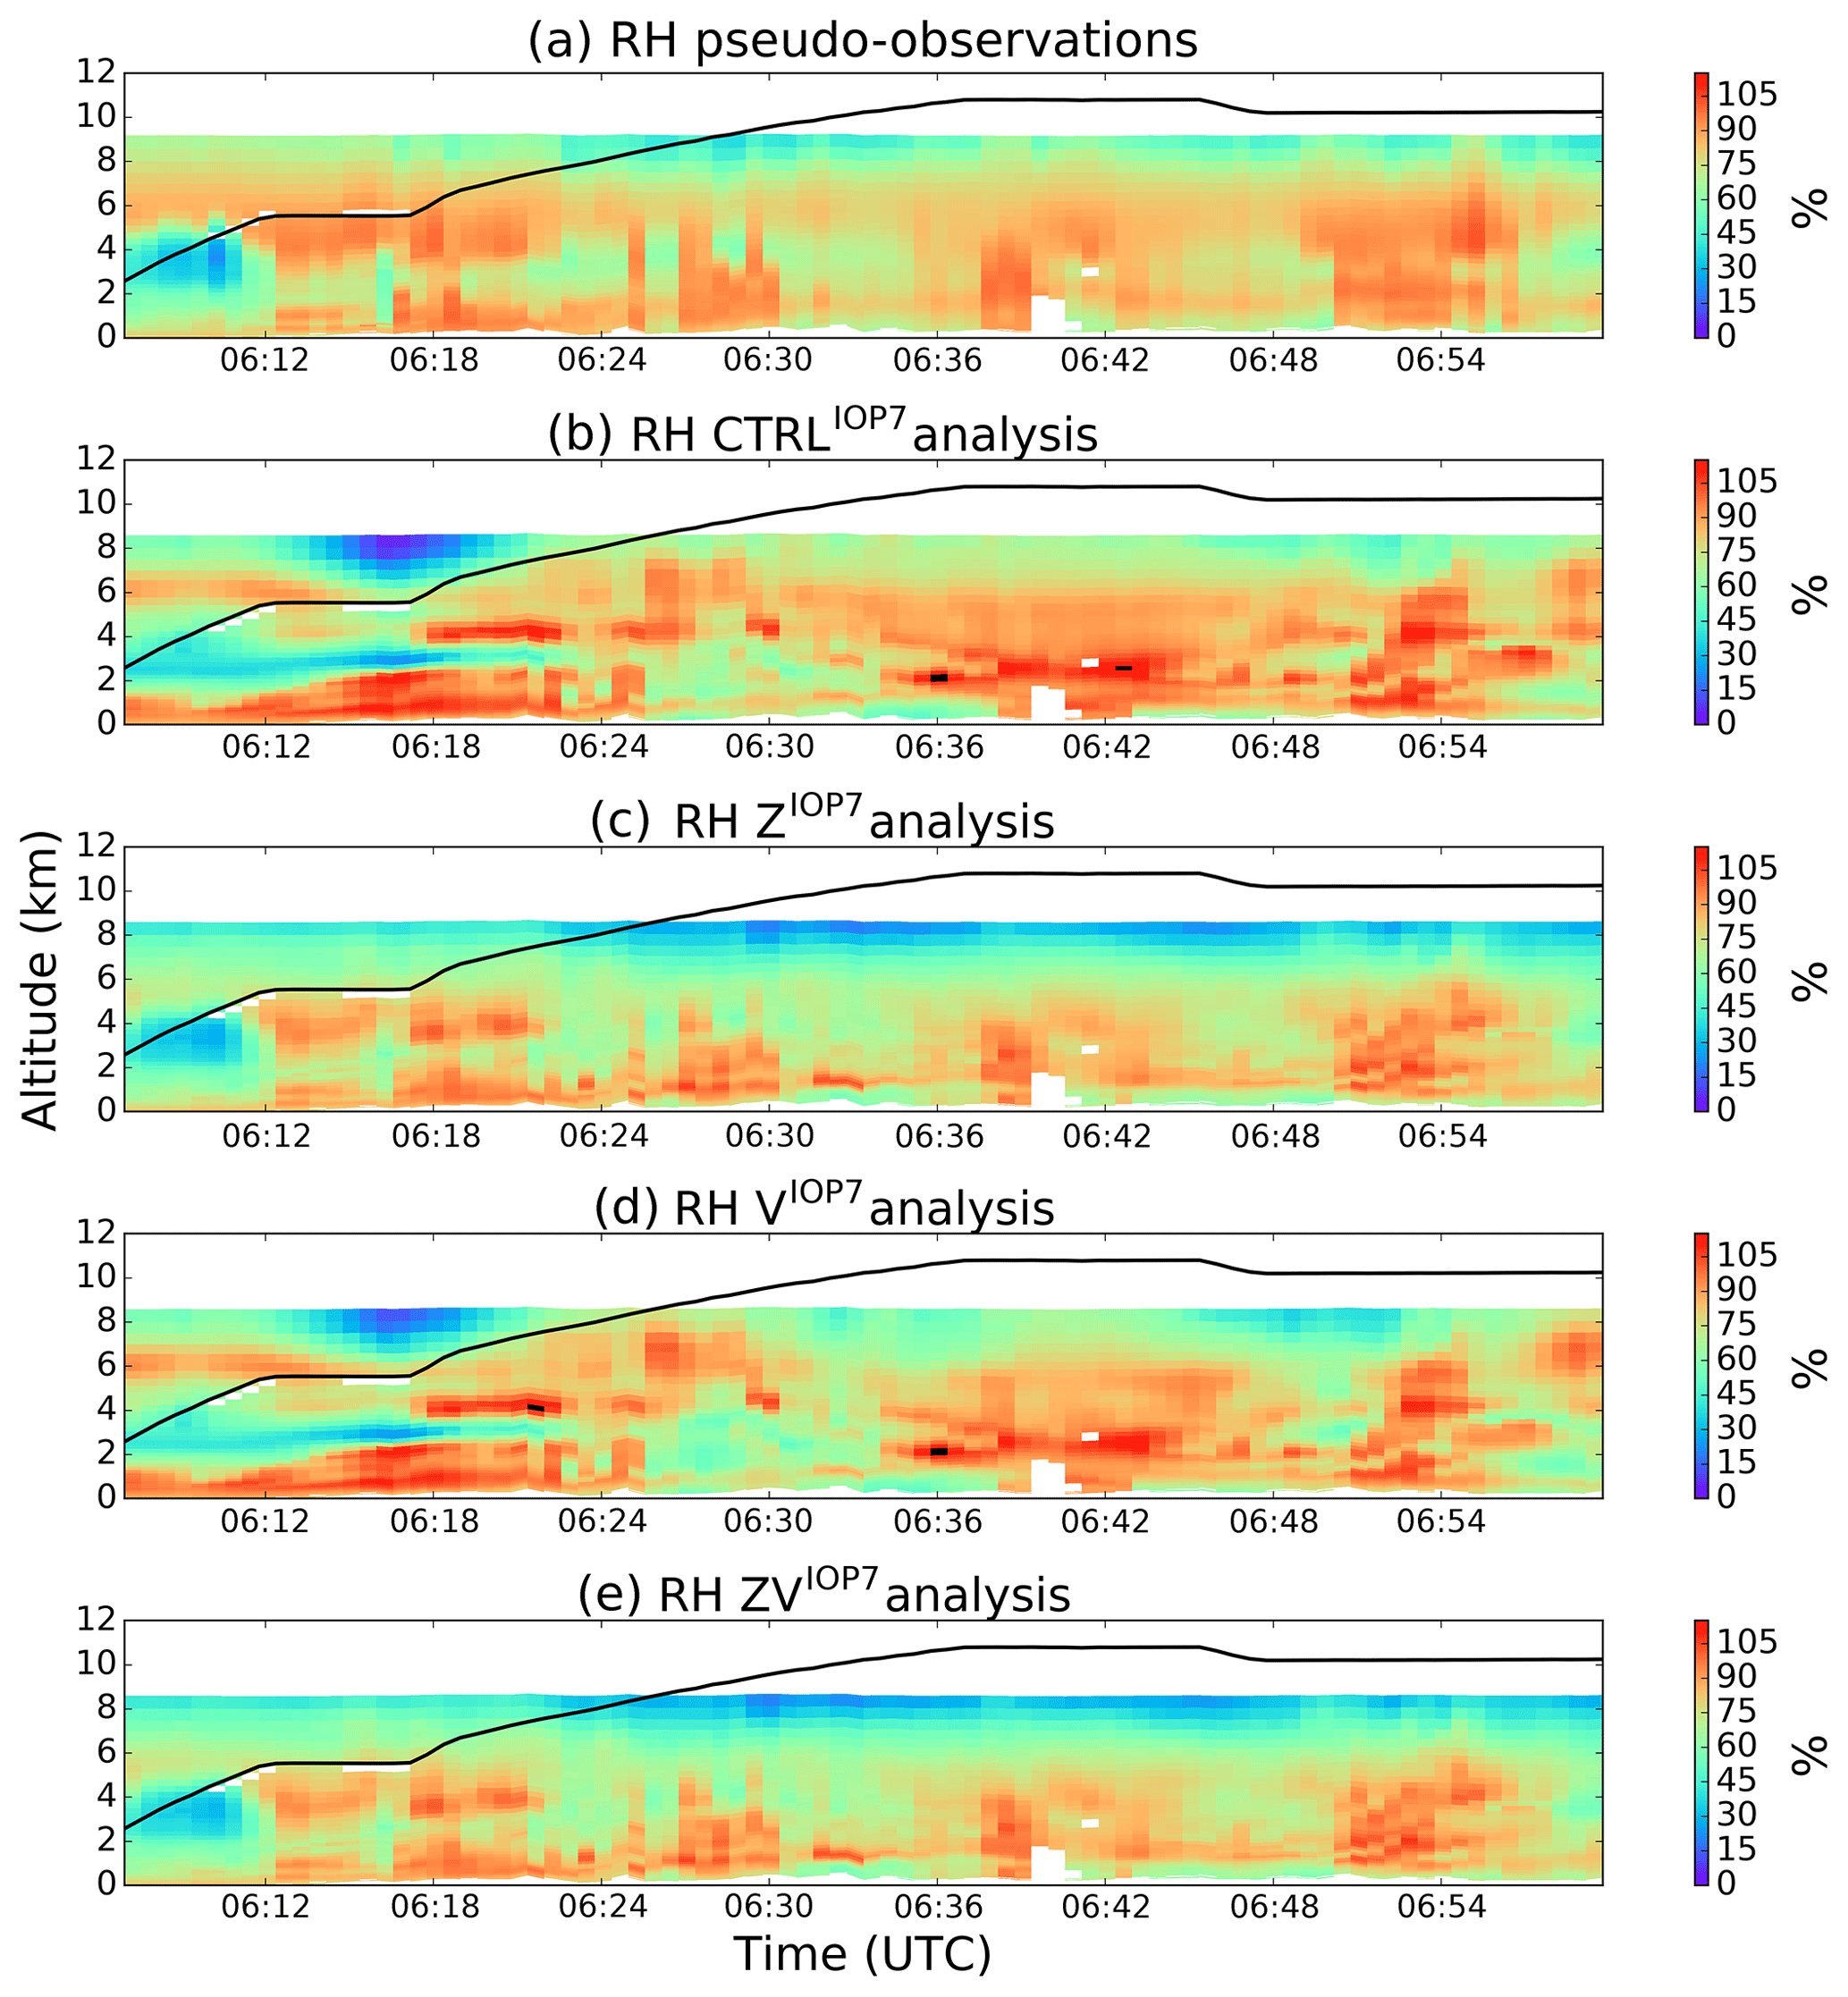
Figure 6Relative humidity (RH, in %) for (a)–(e): the pseudo-observations, the CTRLIOP7, the ZIOP7, the VIOP7 and the ZVIOP7 experiments.
The observation errors for the RH pseudo-observations and RASTA wind data are the same as the one used for the radiosonde measurements. It is set to 12 % for the RH pseudo-observations. RASTA wind observation error increases with the altitude from approximately 1.8 m s−1 at 900 hPa to approximately 2.5 m s−1 at 200 hPa. Finally, in addition to the pre-processing described in Sect. 2.3, a quality control is also performed prior to the assimilation: observations with innovation (observations minus background) greater than a threshold are rejected. This threshold depends on both the observation and background errors. It has a constant value of approximately 55 % for the RH pseudo-observations. It increases with the altitude for RASTA wind data because the error standard deviation is a function of the altitude (approximately 25 m s−1 at the maximum).
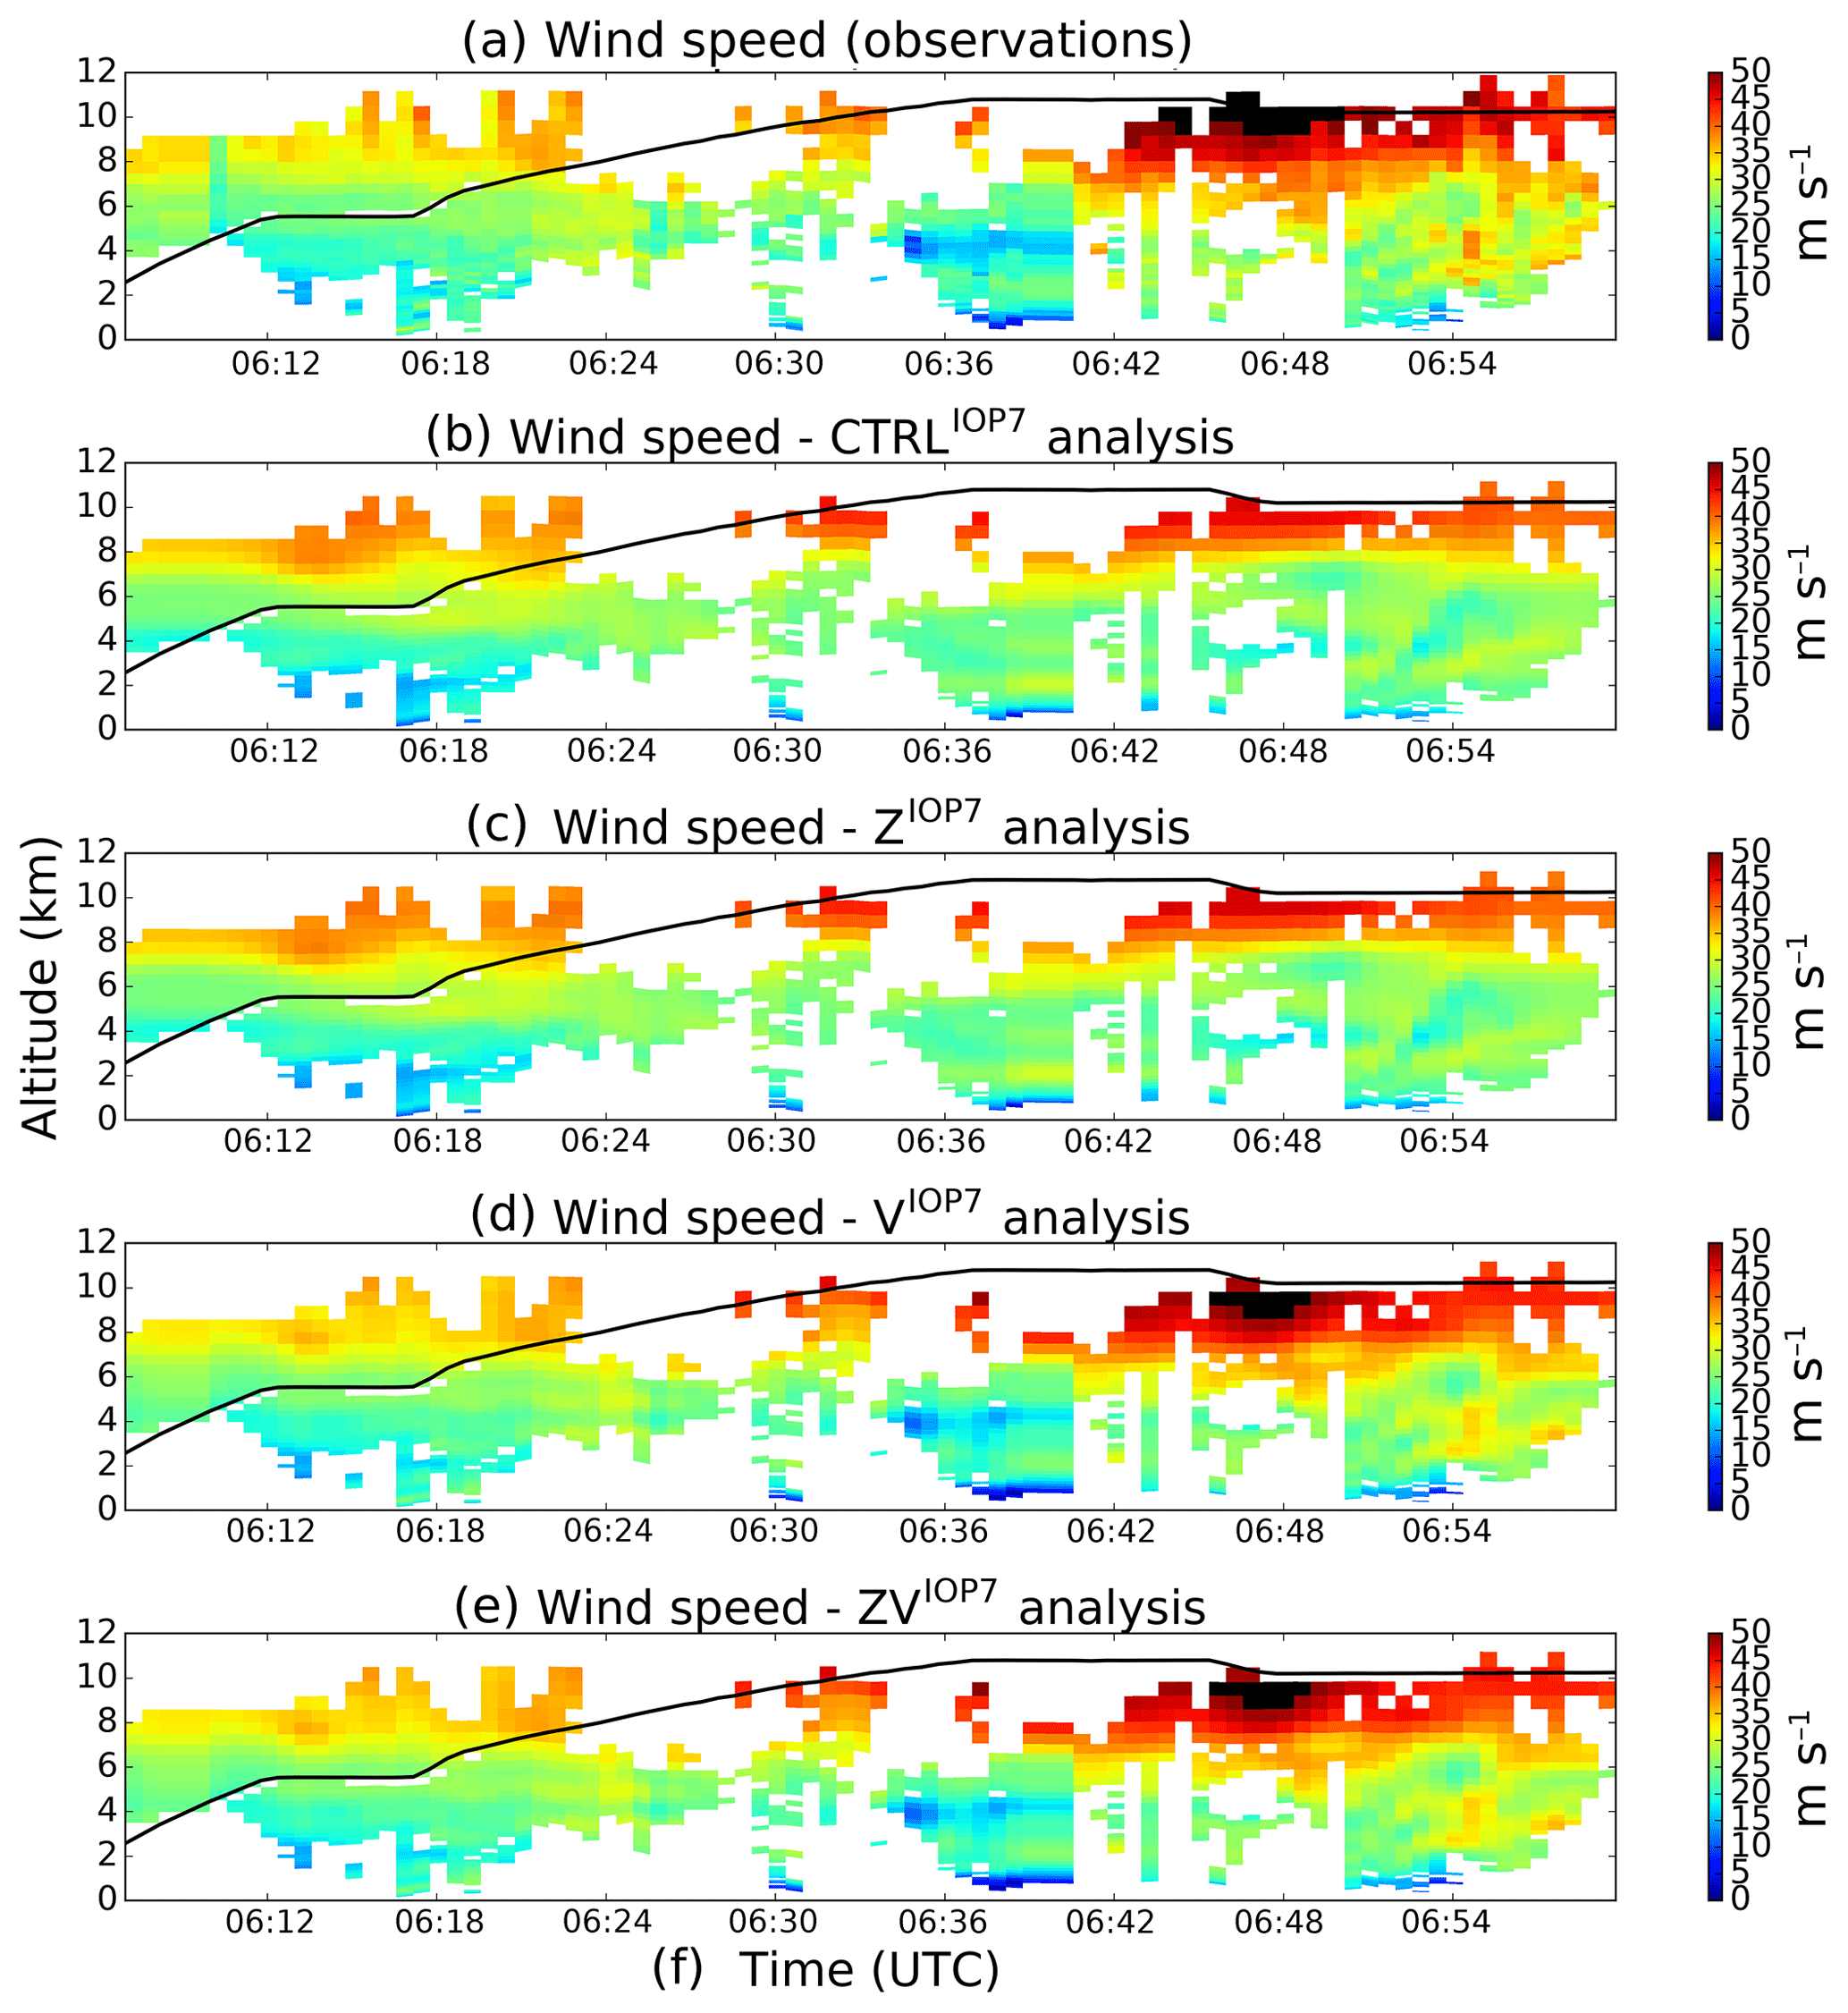
Figure 7Wind speed (m s−1) for (a)–(e): the observations, the CTRLIOP7, the ZIOP7, the VIOP7 and the ZVIOP7 experiments.
The four different experiments are first conducted for a heavy precipitation event which occurred during the intensive observing period 7a (IOP7a) over south-eastern France on 26 September 2012. During this case study, RASTA data were collected during flight 15 between 06:10 and 09:45 UTC (red line in Fig. 1). Therefore, RASTA data are assimilated for the first time at the 06:00 UTC analysis. The different experiments are named CTRLIOP7, ZIOP7, VIOP7 and ZVIOP7. They share the same background field to compute the 06:00 UTC analysis. They start at 00:00 UTC 26 September 2012 and end at 12:00 UTC 26 September 2012. Next, in order to study the impact of the assimilation of RASTA data in various conditions during the whole HyMeX-SOP1, the four experiments are run for the 32 analysis cases in which RASTA data are available. For this configuration, the CTRL experiment is the same as the one used in Sect. 3.2, which was run during a 45-day cycled period from 00:00 UTC 24 September to 5 November 2012. For the sake of simplicity, the CTRL experiment is named CTRLSOP1. The three RASTA experiments are respectively named ZSOP1, VSOP1 and ZVSOP1. In order to disentangle the cycling effect from the impact of the assimilation of RASTA data on the analyses, the ZSOP1, VSOP1 and ZVSOP1 experiments are not cycled and share the same background fields as the CTRLSOP1 experiment ones.
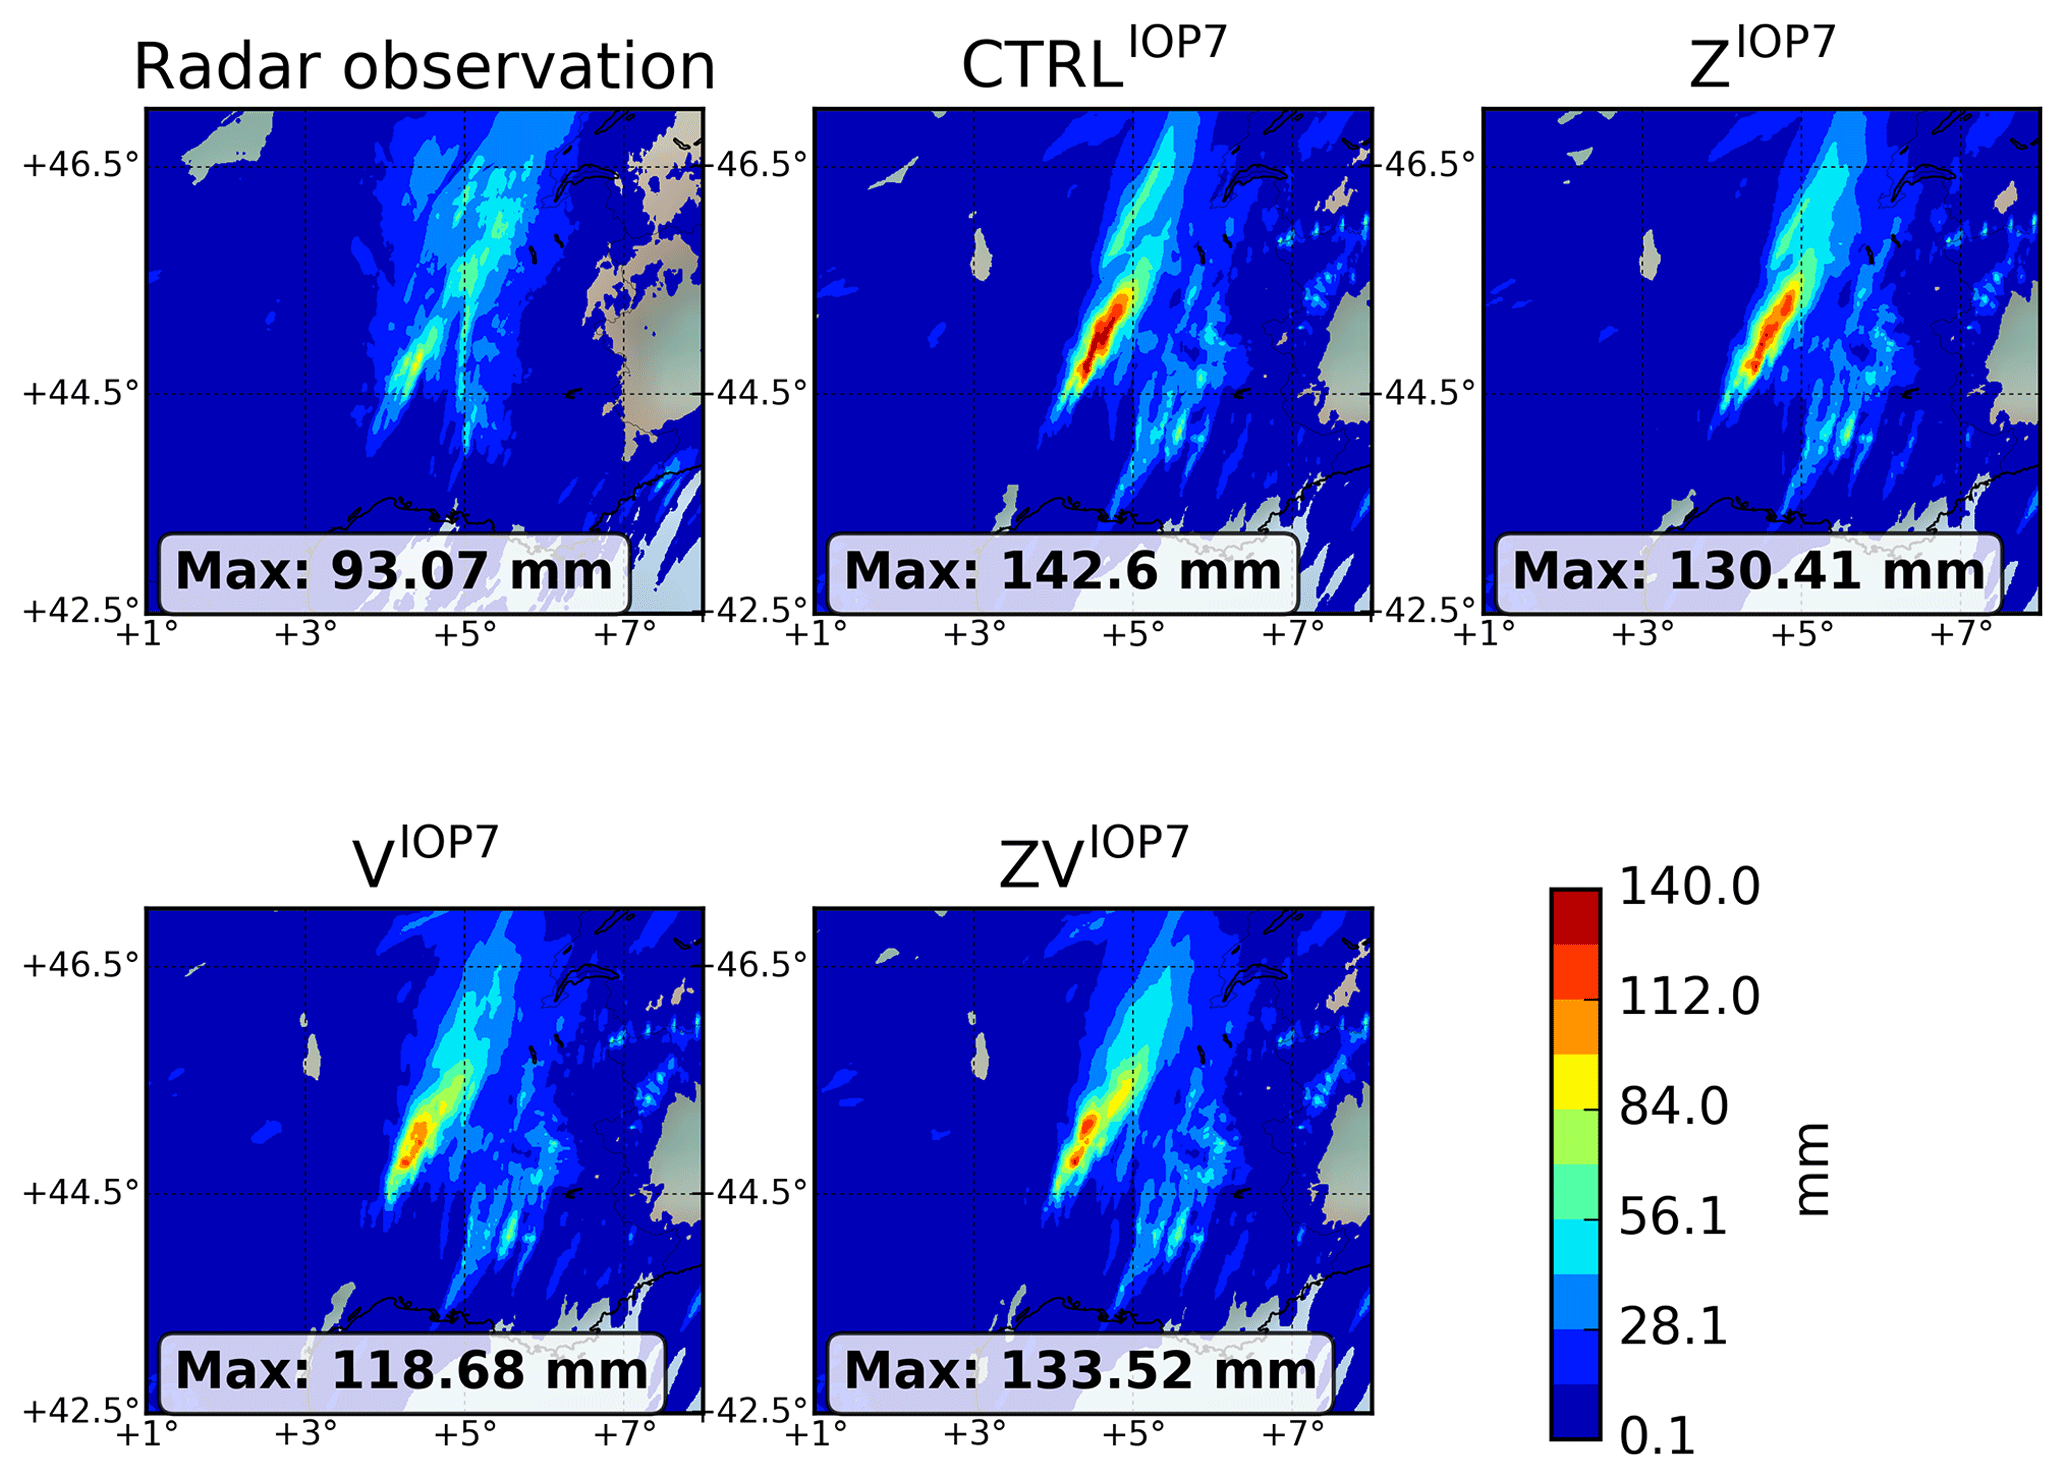
Figure 8The 12 h accumulated rainfall between 06:00 and 18:00 UTC 26 September 2012 (IOP7a) for radar observations, the CTRLIOP7, the ZIOP7, the VIOP7 and the ZVIOP7 experiments.
To assess the potential of RASTA observations to improve short-term forecasts, focus is first concentrated on one of the most significant precipitation events which occurred during IOP7a. More than 100 mm of rain was observed between 00:00 UTC on 26 September and 00:00 UTC on 27 September in the area delimited by the red box in Fig. 1 (Hally et al., 2014). As mentioned in Sect. 4, RASTA data are assimilated for the first time at the 06:00 UTC analysis in the ZIOP7, VIOP7 and ZVIOP7 experiments. Most of these data are located upwind of where the rainfall event took place later in the morning at approximately 08:00 UTC. Such a configuration is required to evaluate the impact of the assimilation of RASTA data to improve heavy precipitation events.
5.1 1-D Bayesian retrieval
As explained in Sect. 3.1, the first step to assimilate the reflectivity consists of a 1-D Bayesian retrieval of RH pseudo-observation profiles, given the vertical profile of reflectivity observed by RASTA. Since no direct RH observations are available with such a high vertical resolution as the one of RASTA data, the method is validated by comparing the reflectivity pseudo-observations with RASTA Zo observations. Figure 5 shows RASTA observations (interpolated on the vertical grid model; (a), the simulated profile of reflectivities from the background (b) and the retrieved reflectivity pseudo-observations (c). The differences between the RH pseudo-observations and the background RH profiles are also shown in panel (d). Differences are displayed in red (blue) if RH pseudo-observations are larger (smaller) than the background.
Figure 5 highlights the capability of the 1-D Bayesian method to retrieve profiles which are in better agreement with the observations than the background. For example, at approximately 06:30 UTC, the observation profiles indicate clouds below an altitude of 6 km, as opposed to the simulated profiles from the background which only indicate clear-sky profiles. This has been rectified in the reflectivity pseudo-observation profiles, and in the corresponding RH pseudo-observation profiles. Indeed, the RH pseudo-observation values are larger than the background RH values (red values in d), and are thus more representative of the presence of cloud. Inversely, at approximately 06:25 UTC, the Bayesian retrieval has been able to remove the low-level clouds present in the background, and to add clouds above an altitude of about 4 km. Between 06:50 and 07:00 UTC, the reflectivity pseudo-observations are also in much better agreement with the observations than the background. The corresponding RH pseudo-observations values are also larger than the background, which is consistent with the fact that larger RH values are usually associated with larger reflectivity values. Hence, Fig. 5 demonstrates the ability of the Bayesian retrieval to pick up vertical profiles in the neighbourhood which are more consistent with the observations. Indeed, this retrieval successfully dried areas associated with low reflectivity values, and moistened areas associated with high reflectivity values. These retrieved RH pseudo-observation profiles are then assimilated in the 3DVar assimilation system of AROME-WMed in the ZIOP7 and ZVIOP7 experiments.
5.2 Impact on analyses
Figure 6 shows (from the top to the bottom panels), the relative humidity for the pseudo-observations, the CTRLIOP7, the ZIOP7, the VIOP7 and the ZVIOP7 analyses. Similarly, Fig. 7 represents the wind speed for the observations and the different experiments. The four different analyses were computed using the same background state.
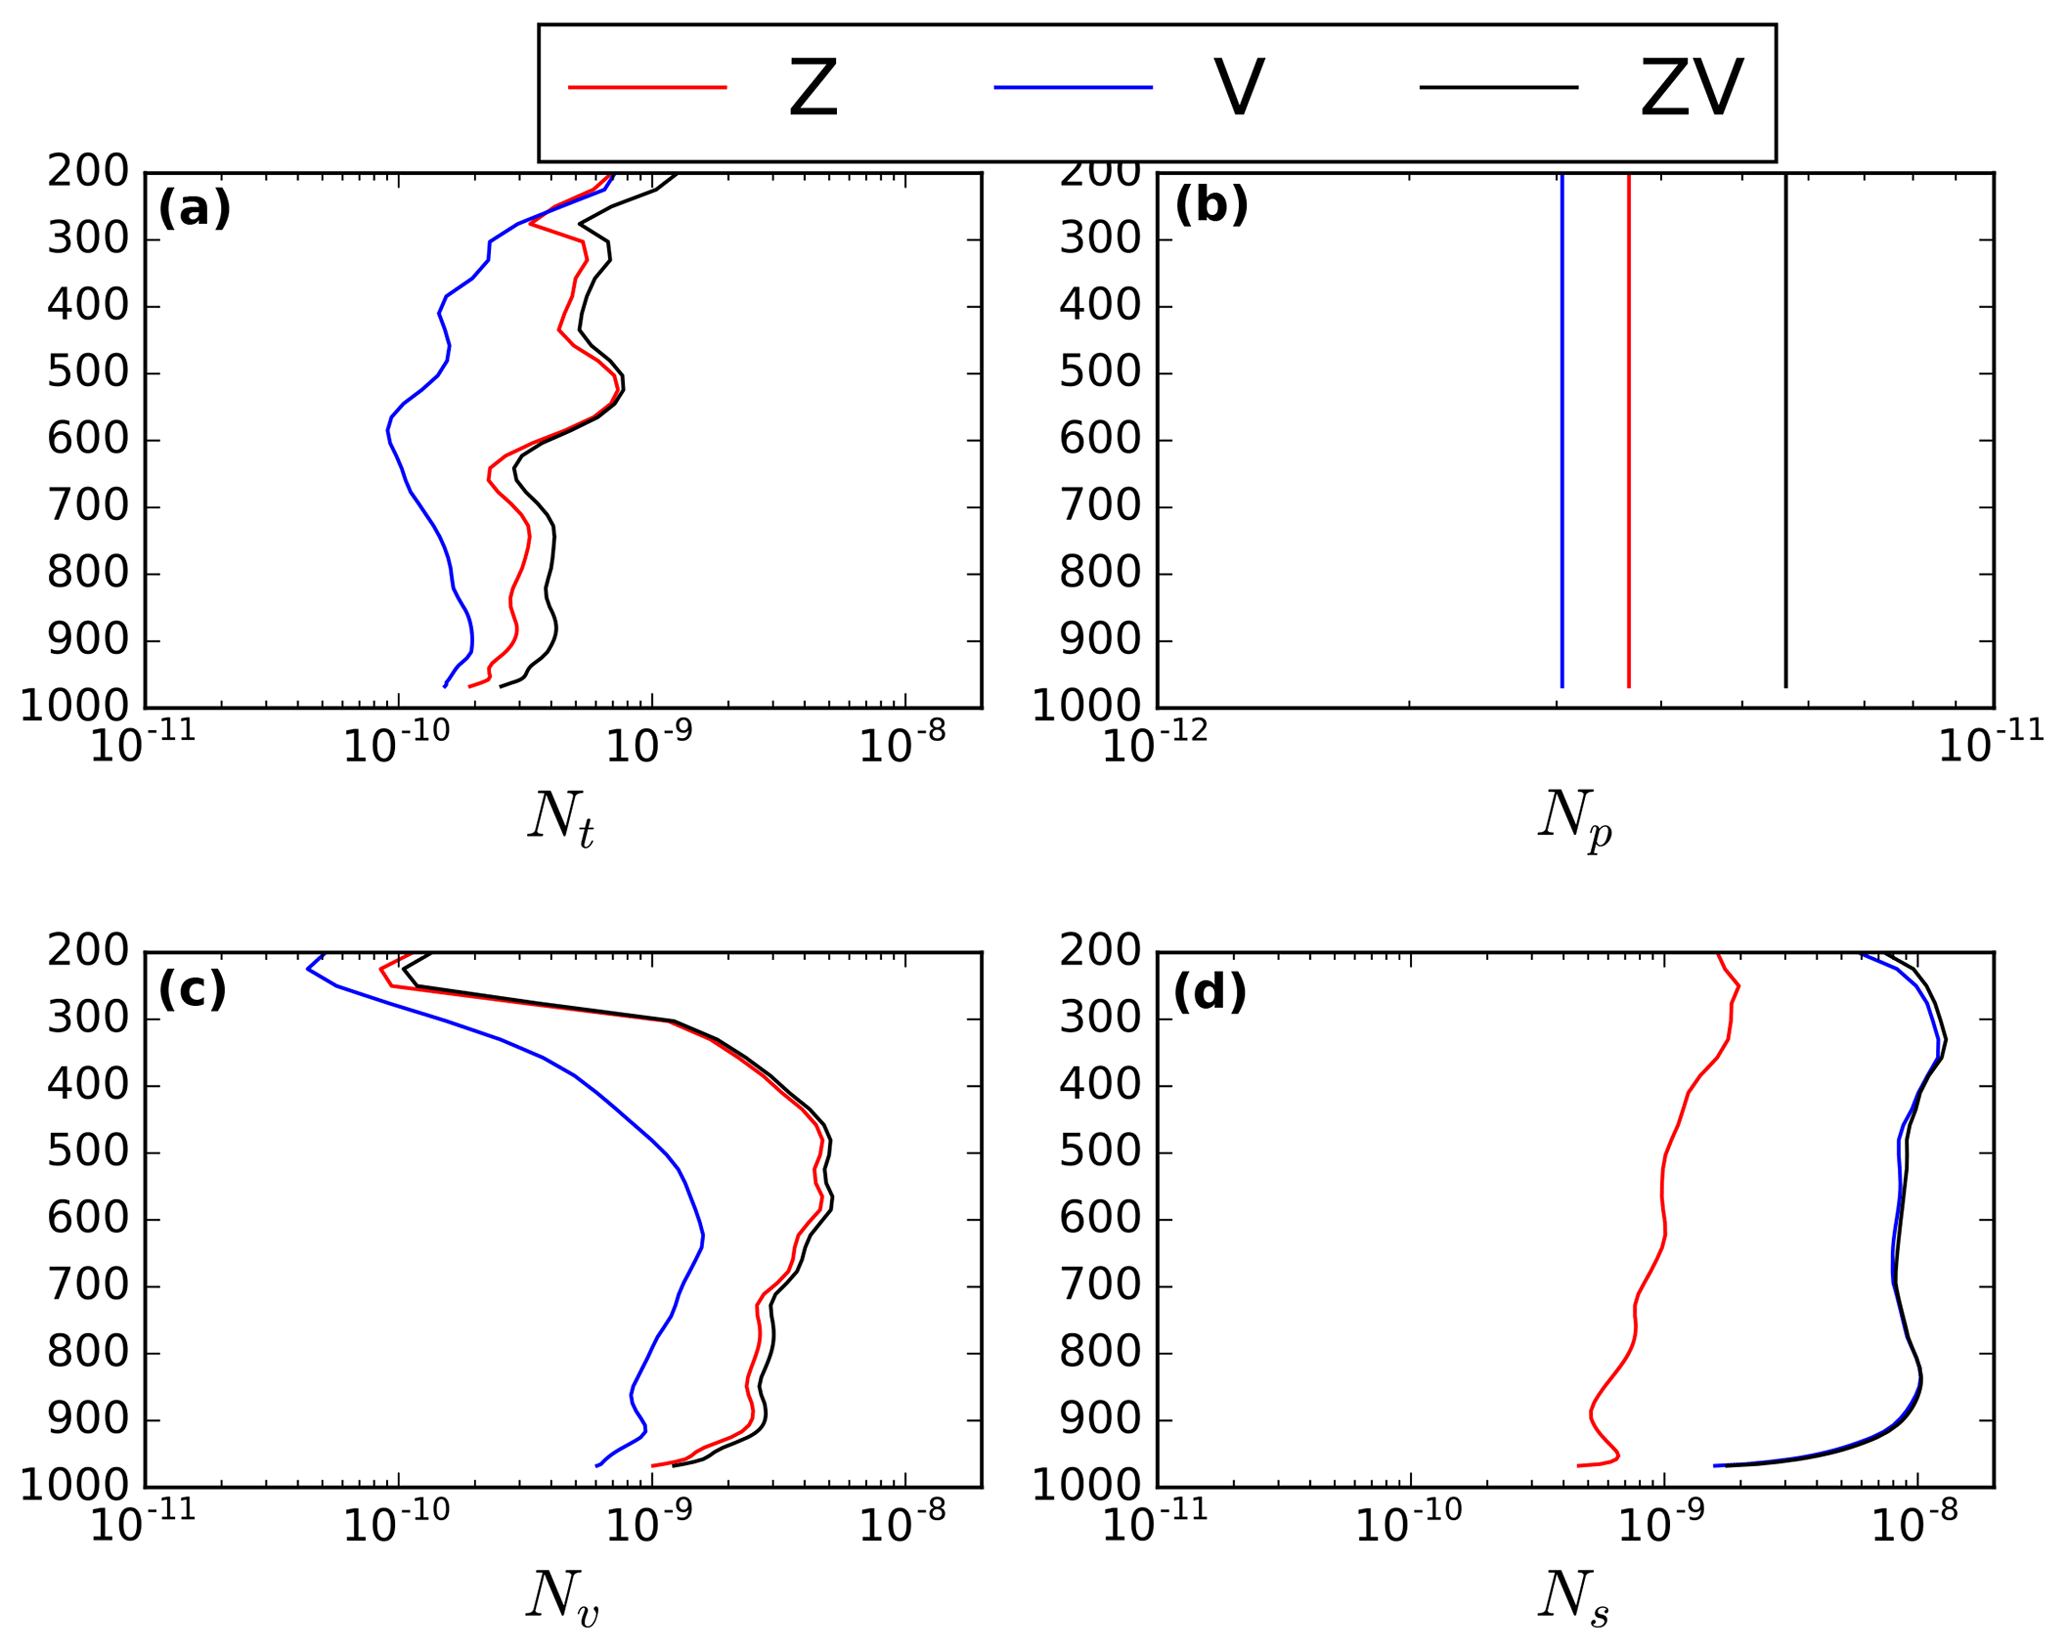
Figure 9Temperature NT (a), surface pressure Np (b), humidity Nv (c) and kinetic Ns (d) contribution terms of the exergy distance as a function of the altitude for the ZSOP1 (red curve), VSOP1 (blue curve) and ZVSOP1 (black curve) analyses.
As shown in Figs. 6a and 7a, the number of RH pseudo-observations which have been assimilated is larger than the number of RASTA wind data. Indeed, contrary to RASTA wind data, the reflectivity is also assimilated in the case of clear sky. Besides, airborne Doppler velocity measurements are contaminated by the aircraft motion (roll/pitch/drift angles, ground speed, etc.). Therefore, because of the difficulty to have high-quality measurements (Bosart et al., 2002), RASTA wind data have been more frequently rejected (cf. between 06:42 and 06:50 UTC in Fig. 7). In addition, contrary to the W-band reflectivity measurements, RASTA horizontal wind components are obtained through a retrieval, which might also explain the smaller number of assimilated horizontal wind data. Finally, since RH pseudo-observations are assimilated in the same way as radiosonde observations are (cf. Sect. 4), they are rejected above an altitude of approximately 9 km because the values are very small.
Compared to the RH pseudo-observations in Fig. 6, RH is overestimated in the CTRLIOP7 and in the VIOP7 analyses. Except at approximately 8 km of altitude, the RH profiles are much more similar to the RH pseudo-observations in the ZIOP7 and ZVIOP7 analyses. Conversely, in Fig. 7, the VIOP7 and ZVIOP7 analyses are in much better agreement with RASTA wind observations compared to the CTRLIOP7 and the ZIOP7 analyses. Figure 6 shows that the VIOP7 analysis is very similar to the CTRLIOP7 one in terms of humidity. Similarly, in Fig. 7, the ZIOP7 analysis is very similar to the CTRLIOP7 one in terms of wind speed. Therefore, the assimilation of RASTA wind data (respectively RH pseudo-observations) does not impact the humidity (respectively wind) field in the analysis, probably because wind and humidity are not highly correlated in the assimilation process through the background error covariances. However, the joint assimilation of the RH pseudo-observations with RASTA wind data (ZVIOP7 experiment) results in a positive impact in terms of both the wind and the humidity fields.
5.3 Impact on rainfall forecasts
Figure 8 shows the 12 h accumulated rainfall between 06:00 and 18:00 UTC 26 September 2012 (IOP7a) for radar observations, the CTRLIOP7, the ZIOP7, the VIOP7 and the ZVIOP7 experiments.
First, the predicted rainfall pattern is well reproduced in the four different experiments. As shown by Borderies et al. (2019), the maximum rainfall accumulation is overestimated in the CTRLIOP7 experiment (≈142 mm versus 93 mm in the radar observations), but is better reproduced in the ZIOP7 experiment (130 mm). In addition, the assimilation of RH pseudo-observations jointly with RASTA wind data in the ZVIOP7 experiment also results in a decrease (133.5 mm) of the predicted maximum rainfall accumulation. Finally, the experiment in which RASTA wind data are assimilated alone in the VIOP7 leads to the better agreement with the radar observations. Indeed, the maximum rainfall forecast accumulation has been reduced to only 118 mm.
The impact of the assimilation of RASTA data is now assessed over the 32 cases in which RASTA data were assimilated during the HyMeX-SOP1. In order to use the same background fields, we use the ZSOP1 , VSOP1 and ZVSOP1 experiments, which are not cycled. An exergy-distance-based approach (Marquet et al., 2019) is first employed to measure the relative impact of the assimilation of RASTA observations on the analysis and forecast fields. Then, the added value of the assimilation of RASTA data on the analyses is evidenced by using independent humidity measurements. Finally, the subsequent forecasts are validated against rain-gauge measurements.

Figure 10Kinetic (Ns; c and d) and humidity (Nv; a and b) contribution terms of the exergy distances as a function of the forecast term over land (a, c) and over sea (b, d) for the ZSOP1 (red curve), VSOP1 (blue curve) and ZVSOP1 (black curve) experiments.
6.1 Impact study using an exergy-distance-based approach
The moist-air available-enthalpy (exergy) distance (Marquet et al., 2019) is first briefly described, and then calculated to measure the relative impact of the assimilation of RASTA data on analyses and short-term forecasts.
6.1.1 The moist-air available-enthalpy (exergy) distance
Traditionally, the impact of the assimilation of a new observation type and its synergistic effect with other observations are assessed through verification scores of a long data-denial assimilation experiment (Storto and Randriamampianina, 2010). These approaches are very expensive from a numerical point of view. The new type of observation needs to be assimilated in a large number of analysis cases, which is not affordable for airborne radar measurements since the availability of the new observations depends on the aircraft flights. By contrast, energy-based approaches (Ehrendorfer et al., 1999; Marquet et al., 2019) are cost-effective methods for evaluating the impact of the assimilation of a new observing system in a NWP model. The idea is to combine thermodynamic variables of the atmosphere into a model space-based measure (Storto and Randriamampianina, 2010), which avoids the use of long data-denial experiments and adjoint-based methods that rely on strong linearity assumptions which are not valid at the convective scale. These approaches provide a measure of the relative impact of the observations on the analysis and forecast fields. For example, Storto and Randriamampianina (2010) employed the moist total energy norm (MTEN; Ehrendorfer et al., 1999) to evaluate the loss of quality in the forecasts when an observation type is not assimilated. A similar methodology was employed by Fabry and Sun (2010) to characterize model errors in winds, temperature, humidity and precipitation.
Based on results of Marquet (1993), Marquet et al. (2019) defined a moist-air available-enthalpy (exergy) distance, which provides a more general and comprehensive metric between a perturbed thermodynamic state (here the RASTA experiments) and a reference one (here the CTRL experiment). It is defined by the integration over the 2-D domain of the sum of four quadratic terms in horizontal wind components U,V (Ns), temperature T (NT), surface pressure ps (Np) and water vapour mixing ratio rv (Nv). The four contribution terms of the exergy distance are then given by
where the superscript i denotes the RASTA experiments (ZSOP1, VSOP1 or ZVSOP1), is the specific heat of dry air, Rd is the dry air constant, Rv is the water vapour gas constant and Tr is the reference temperature (taken to be 300 K). The total exergy distance is then given by the sum of the four quadratic terms NT, Np, Nv and Ns.
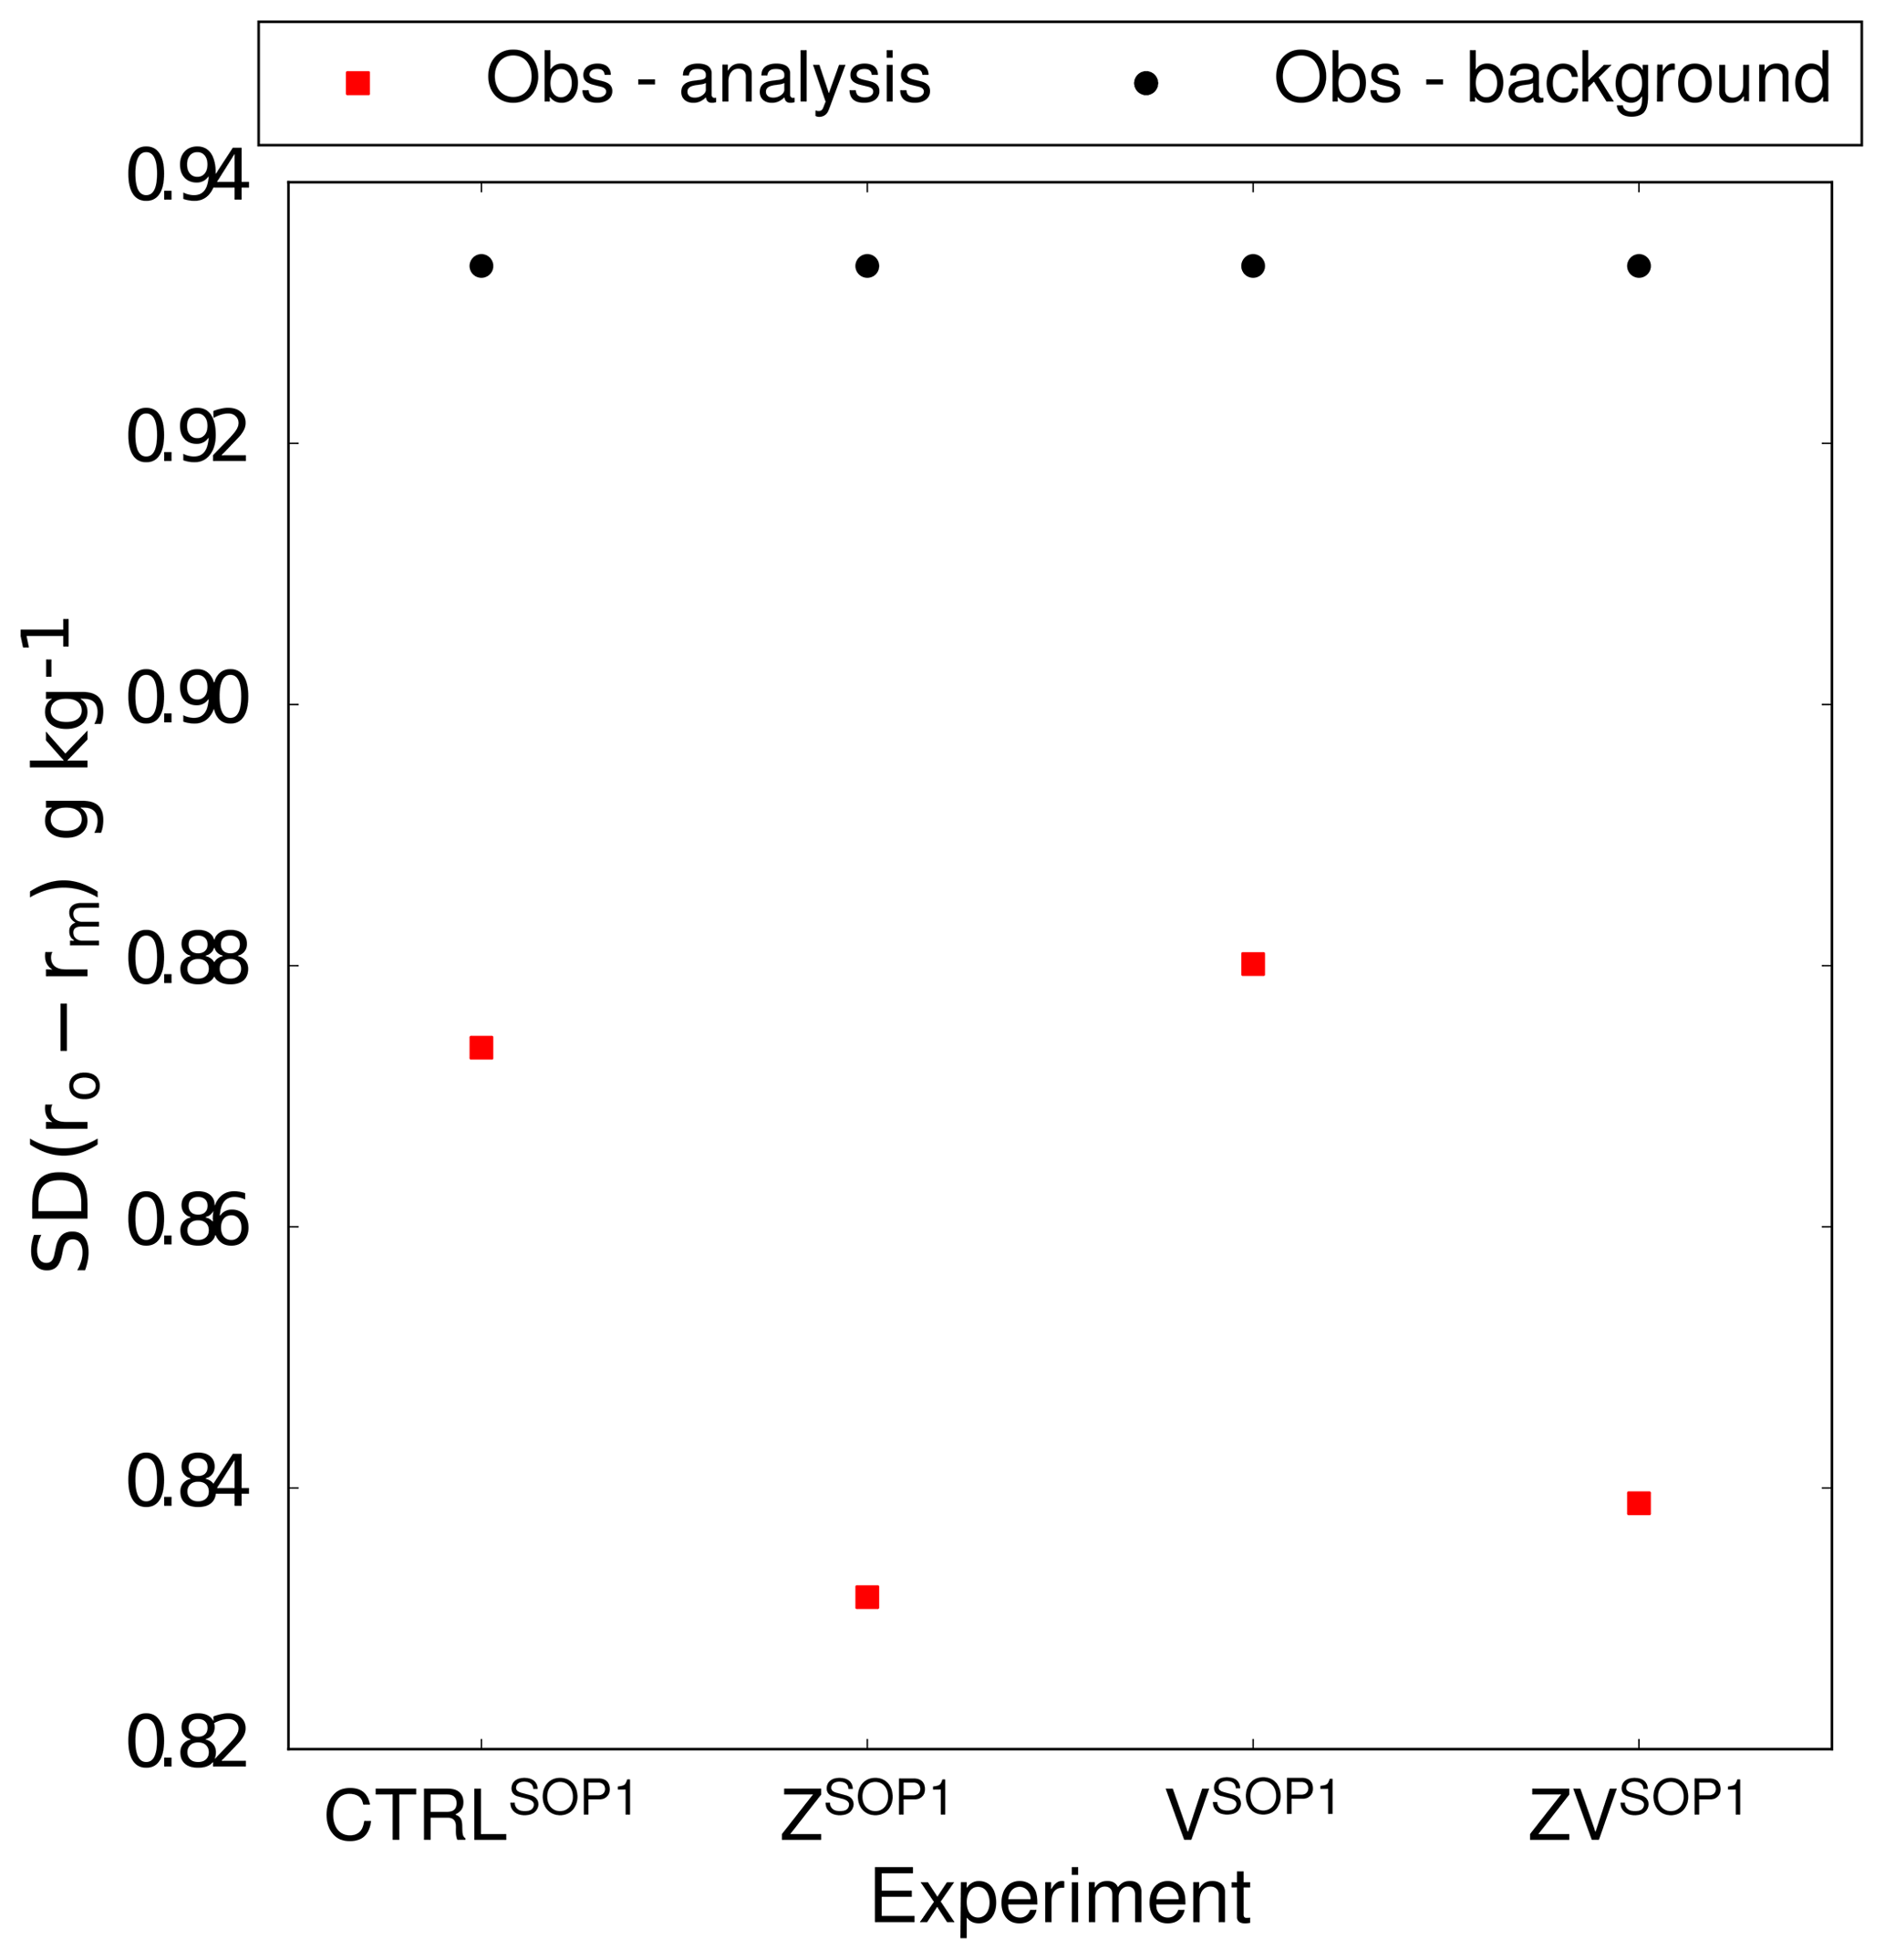
Figure 11Standard deviation (g kg−1) of the water vapour mixing ratio differences between in-flight humidity measurements ro and the analyses rm for the different experiments (CTRLSOP1, ZSOP1, VSOP1 and ZVSOP1) over the 24 analyses. The standard deviation differences between the measurements and the background state are also shown by the black data points (N=6307).
In Eqs. (4), (5) and (6), the contribution terms of the exergy distance are divided by the weighting factors , and , which correspond to the average values over the 2-D domain of TCTRL, and , respectively. Hence, as defined by Ehrendorfer et al. (1999), the weighting factors and are a function of the altitude, where an arbitrary factor “ϵ” was introduced but with unknown values between 0.1 and 10. This arbitrariness is removed by Marquet et al. (2019) where varies significantly with height, since the water vapour mixing ratio decreases by 3 orders of magnitude between the surface and the stratosphere. Therefore, moisture analysis and forecast impacts between the different atmospheric levels are fully taken into account through the use of these altitude-dependent weighting factors. Hence, the use of the exergy distance is expected to more fairly rank the different observing systems through the use of more balanced contributions between wind, temperature and water vapour.
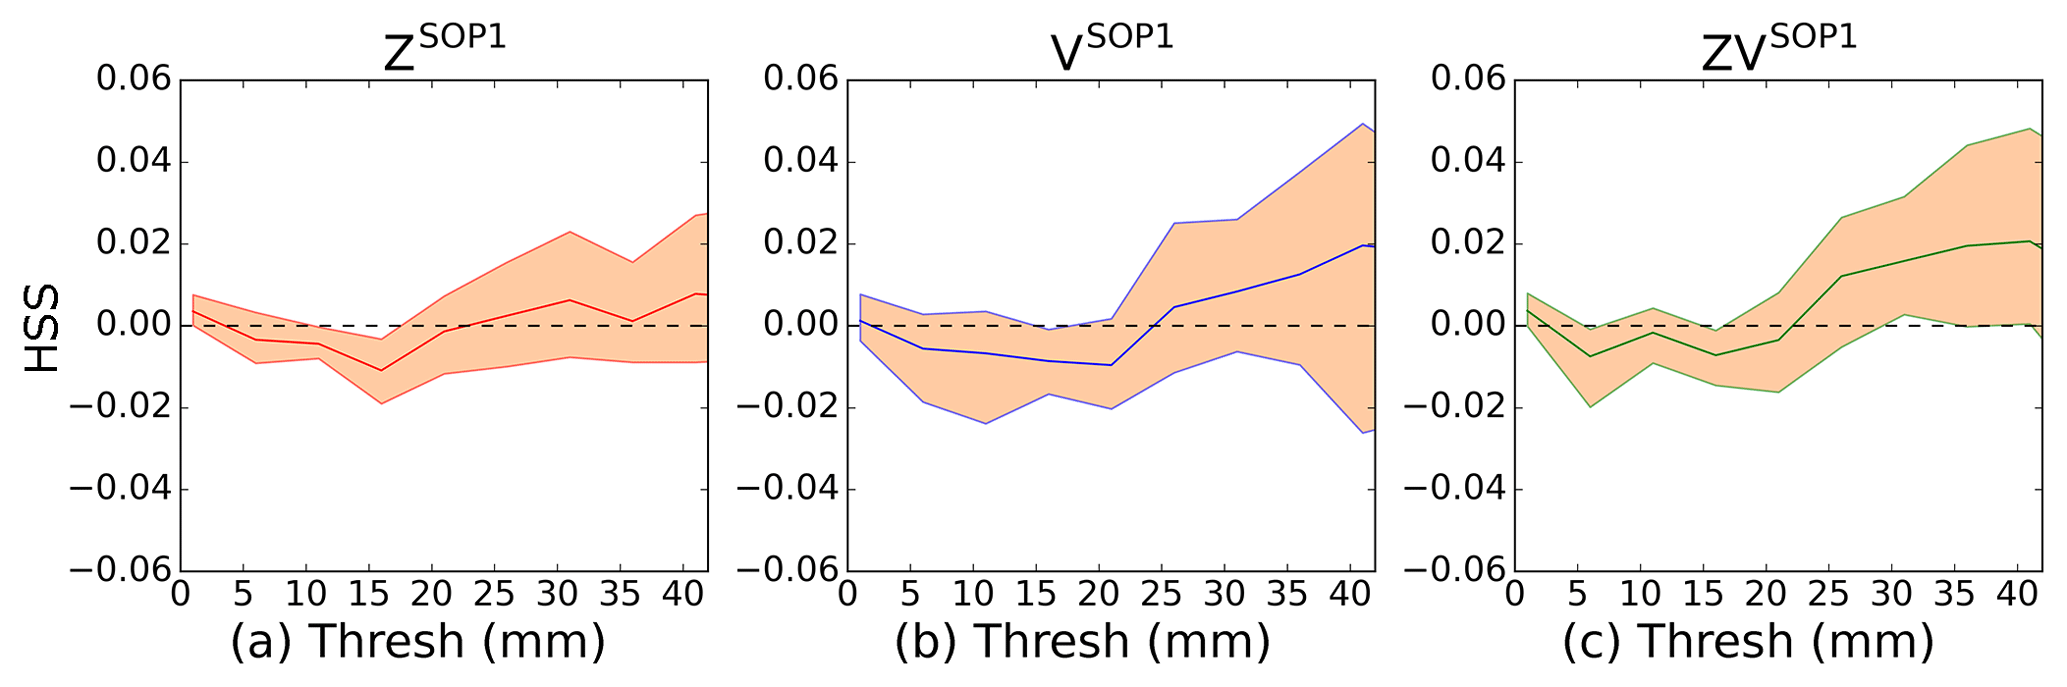
Figure 12Differences in the average Heidke skill score (HSS) of the 6 h cumulated precipitation forecasts versus rain gauge measurements, between the three RASTA experiments and the CTRLSOP1 experiment (a) ZSOP1, (b) VSOP1 and (c) ZVSOP1. Calculations were performed over the 32 runs in which RASTA data were assimilated. The error bars represent the 95 % bias-corrected and accelerated (BCa) bootstrap confidence intervals (see Efron and Tibshirani, 1994).
In this study, the four different contribution terms of the exergy distance will be studied independently in order to evaluate the respective impact of the assimilation of the RH pseudo-observations and/or RASTA wind components on temperature (Eq. 4), surface pressure (Eq. 5), water vapour mixing ratio (Eq. 6) and wind (Eq. 7) fields.
6.1.2 Impact on analyses
The temperature NT, surface pressure Np, humidity Nv and kinetic Ns contribution terms of the exergy distance are calculated over the domain defined by the black box in Fig. 1. Figure 9 represents NT (a), Np (b), Nv (c) and Ns (d) as a function of the altitude for the ZSOP1 (red curve), VSOP1 (blue curve) and ZVSOP1 (black curve) analyses. The different contribution terms are averaged over the 32 analyses in which RASTA data have been assimilated.
First, Fig. 9 demonstrates that the assimilation of RH pseudo-observations and/or RASTA wind data has a small impact on the temperature NT (a) and surface pressure Np (b) contribution terms of the exergy distance. Indeed, even though there is a correlation between the different variables through the background error covariance matrix (Fabry and Sun, 2010), there is a larger impact on the contribution terms (Nv and/or Ns) that are associated to the variables (wind and/or humidity) directly linked to the assimilated observations. On the analyses, the experiment which has the smallest impact on NT (a) and Np (b) is the VSOP1 experiment (blue curve), followed by the ZSOP1 experiment. However, this rank order is reversed after only 1 h forecast (not shown). The larger impact on NT and Np is obtained if RH pseudo-observations are assimilated jointly with RASTA wind data (ZVSOP1 experiment, black curve).
As expected, since RH pseudo-observations are linked to the humidity fields, the impact of the assimilation of RH pseudo-observations (ZSOP1) is larger on Nv than on the other contribution terms. Similarly, since RASTA wind observations are linked to the horizontal wind components, their assimilation (VSOP1) result in a larger impact on Ns. Next, the assimilation of RH pseudo-observations (respectively RASTA wind data) does not impact significantly Ns (respectively Nv). Therefore, humidity and horizontal wind data do not seem to be highly correlated with one another, which is consistent with the results of Sect. 5.2. A larger impact on both the Nv and Ns contribution terms is obtained if RH pseudo-observations and RASTA wind data are assimilated jointly (ZVSOP1, black curve), along with a larger impact on all the contribution terms. Consequently, this result indicates that the joint assimilation is required to have an impact on both the wind and humidity fields in the analyses.
6.1.3 Impact on short-term forecasts
Equations (4) and (6) are now integrated over the two-dimensional domain and the vertical levels for different forecast terms. Results are only shown for the kinetic (Ns) and humidity (Nv) contribution terms of the exergy distances because the major differences have mainly been evidenced on these two terms (see Fig. 9). Figure 10 represents Ns (c and d) and Nv (a and b) as a function of the forecast term over land (a and c) and over sea (b and d) for the ZSOP1 (red curve), VSOP1 (blue curve) and ZVSOP1 (black curve) experiments.
Generally, Fig. 10 shows that the impact is larger over sea (10b and d) than over land (10a and c). Indeed, ground-based precipitation radar data (reflectivity and Doppler velocity) are also assimilated over land. Therefore, there is a lack of wind and humidity observations over sea, which is partly compensated by the assimilation of RASTA data. This is particularly evidenced for the humidity contribution term Nv of the exergy distance (a and b panels). However, after 2 h forecast term, the impact of the VSOP1 and ZVSOP1 experiments on Ns is of the same order of magnitude over land and over sea.
Except at the analysis time on the humidity contribution term Nv, the impact of the assimilation of RH pseudo-observations (ZSOP1 experiment) is always smaller than the impact of RASTA wind data (VSOP1 experiment). This can be attributed to the fact that the forecast system seems to have a short memory of RH pseudo-observations, which is consistent with the findings of Storto and Tveter (2009). The impact of the assimilation of RASTA wind data has a larger impact on the humidity forecasts, probably by adjusting large structures, and by modifying in return the frontal and/or convective features. In addition, the impact is always larger when RH pseudo-observations are assimilated jointly with RASTA wind data (ZVSOP1 experiment, black curve). This result was expected because the number of assimilated observations has been increased in the ZVSOP1 experiment. Besides, the ZVSOP1 experiment seems to take the benefits (or disadvantages) of both the ZSOP1 and the VSOP1 experiments. The small impact of the ZSOP1 experiment seems to indicate that it is pointless to assimilate RH pseudo-observations without modifying the wind field in a consistent way. Finally, the ZVSOP1 experiment leads to a larger impact on the kinetic contribution term Ns than on the humidity contribution term Nv. This is can be explained by the fact that the VSOP1 experiment has more impact on Ns than the ZSOP1 experiment has on Nv.
To conclude, the relative impact of the assimilation of RASTA data on the analysis and forecasts fields has been evidenced using the exergy distance. This impact study highlighted that RH pseudo-observations have a modest impact on the analyses on the humidity field, which vanishes soon as the forecast term increases compared to the experiment in which RASTA wind data are assimilated alone. The impact on the subsequent forecasts is more important if both data are assimilated jointly. The benefit brought by this impact will be evaluated in the next sections.
6.2 Analyses evaluation: comparisons against in situ measurements
The aim of this section is to assess the added value of the assimilation of RASTA data on the analyses. The evaluation is not shown against other conventional assimilated observations, because, as expected, the fit to observations is always better in CTRLSOP1 than in the RASTA experimental analyses. However, in-flight humidity measurements at flight level are not assimilated in any of the experiments, and are used as independent observations to assess the impact of the assimilation of RASTA data on the humidity analyses. As explained in Sect. 3.3, poor quality measurements are removed for the comparisons. Hence, after the manual quality control, only 24 analysis cases remain. Figure 11 shows the standard deviation between humidity mixing ratio measurements and the analysed ones for the different experiments (ZSOP1, VSOP1 and ZVSOP1) during the 24 analysis cases. The standard deviation between the measurements and the water vapour mixing ratios from the background state is also represented by the black data points, which is a constant value because the same background states are used in all the different experiments.
First, it should be noted that the analysed water vapour mixing ratios are always in better agreement with the observations compared to the background field, which is quite reassuring. Next, the standard deviation is slightly larger for the VSOP1 than for the CTRLSOP1 experiment. Hence, the assimilation of RASTA wind data alone (VSOP1) does not improve the analysis in terms of humidity, which was expected because RASTA wind data are only slightly related to humidity, so it is likely that the humidity analysis field moves away from humidity observations. The experiment that reduces the standard deviation the most is the ZSOP1 experiment, which indicates that the assimilation of RH pseudo-observations alone positively impacts the analysis in terms of humidity.
Even though slightly less pronounced, the joint assimilation of RH pseudo-observations with RASTA wind data (ZVSOP1 experiment) also leads to an improvement of the analysed humidity field. The respective impacts of the ZSOP1 and VSOP1 experiments are both present in the ZVSOP1 experiment. Therefore, since the standard deviation is slightly larger for the VSOP1 experiment, it seems logical that the standard deviation in Fig. 11 is larger for the ZVSOP1 experiment than for ZSOP1. In addition, it has been demonstrated in Fig. 9 that the humidity field in the analysis is more impacted by the assimilation of RH pseudo-observations (ZSOP1) than RASTA wind data (VSOP1). Consequently, the ZVSOP1 experiment inherits more from the benefits of the ZSOP1 experiment than from the disadvantages of the VSOP1 experiment in the humidity analysis.
6.3 Rainfall forecast evaluation
Forecast scores are now validated using the rain-gauges, whose locations are indicated by the blue markers in Fig. 1. For the comparisons, model outputs are interpolated to the rain-gauge station locations using a linear interpolation. Heidke skill score (HSS) is calculated for the 6 h accumulated rainfall forecasts for the CTRLSOP1 and the three RASTA experiments (ZSOP1, VSOP1 and ZVSOP1). HSS is calculated for the 32 assimilation cases in which RASTA data have been assimilated. Figure 12 represents the mean HSS differences in the 6 h accumulated rainfall forecasts between the RASTA and the CTRLSOP1 experiment as a function of the rainfall accumulation threshold (millimetres). The bootstrap confidence intervals are also shown for each threshold. They are quite large because HSS has only been calculated over 32 cases. The impact of the assimilation of RASTA wind data is positive if the differences are above 0.
Figure 12 indicates that the benefit of the RH pseudo-observations (ZSOP1) is neutral to slightly positive above the threshold of approximately 25 mm. Besides, the impact of the assimilation of wind vertical profiles (VSOP1) is larger than that of RH pseudo-observations (ZSOP1), especially for the larger rainfall accumulation thresholds. This is consistent with the fact that the impact of the RH pseudo-observations is less pronounced than the impact of RASTA wind data as the forecast term increases (see Sect. 6). Similar results were also obtained in prior studies (Pu et al., 2009; Zhao and Jin, 2008; Zhang et al., 2012). Finally, the best results are obtained for the ZVSOP1 experiment, which suggests that the accumulated rainfall forecasts benefit more from the assimilation of the W-band reflectivity jointly with RASTA wind data. Similar results were also obtained with other categorical scores (FAR and POD), and for the 9 and 12 h rainfall accumulation forecasts.
The primary objective of this article was to assess the impact of the assimilation of W-band radar reflectivity in a kilometre-scale NWP model, and specifically to improve analyses and short-term forecasts of heavy precipitation events in the Mediterranean area. The W-band reflectivity measurements collected by the RASTA airborne Doppler W-band radar during the HyMeX-SOP1 were assimilated into the 3 h 3DVar assimilation system of the NWP model AROME. To complement this study, the benefit brought by consistent thermodynamic and dynamic cloud conditions has also been investigated by assimilating separately and jointly the horizontal wind measurements retrieved by RASTA. Results of this study will provide guidance for future observing systems by assessing whether it is more relevant to improve the current technology for cloud radars measuring horizontal wind profiles or only reflectivity profiles. The data assimilation experiments were first conducted for one of the most significant heavy precipitation events of the HyMeX-SOP1 (IOP7a). Then, to cover a larger number of meteorological situations, the different experiments have been run for the 32 cases in which RASTA data were available during the HyMeX SOP1.
The 1D+3DVar assimilation method, operationally employed to assimilate ground-based precipitation radar data in AROME, has been adapted to assimilate the W-band reflectivity. Vertical profiles of relative humidity are first derived via a 1-D Bayesian retrieval, and then used as pseudo-observations in the 3DVar assimilation system of AROME. In order to fully take advantage of the W-band reflectivity in cloudy areas, a bias correction scheme was applied. The error standard deviation σo was estimated by minimizing the standard deviation between the retrieved humidity fields and independent in situ humidity measurements. Results indicate that the best estimate of the error standard deviation is close to 2 dB. The comparison with in situ humidity measurements highlighted the ability of the 1-D Bayesian method to retrieve the humidity field, which are in better agreement with completely independent humidity measurements.
After validating the first step of the 1D+3DVar assimilation method, the exergy distance was calculated for each experiment to measure the relative impact of the assimilation of RASTA data on the analyses and the subsequent forecasts. This method allows one to independently assess the impact of the new observation type on the temperature, surface pressure, wind and humidity fields, independently. In particular, this impact study demonstrated that RH pseudo-observations have a larger impact on the humidity, temperature and pressure variables on the analyses, compared to the assimilation of RASTA wind data alone. However, after 1 h forecast, this rank order is reversed, probably because the forecast system has a short memory of the changes made by the RH pseudo-observations on the humidity in the analysis. This result is consistent with the findings of Storto and Tveter (2009), who employed a similar method to assimilate CPR data on-board the CloudSat satellite in the ALADIN NWP model. The impact on the analyses and forecasts is always larger if the W-band reflectivity is jointly assimilated with RASTA wind data, probably because the two observations complement each other and lead to a more consistent thermodynamic and dynamic cloud or frontal conditions in the initial state. In addition, it has been demonstrated that the impact of the assimilation of RH pseudo-observations and/or RASTA wind data is more important over sea than over land, probably because these areas are poorly covered by the conventional network.
To evaluate the benefits brought by these impacts on the analyses, all assimilation experiments have been compared by calculating the standard deviation between the humidity analysis fields and in situ humidity measurements. The comparisons demonstrated that the experiment in which RH pseudo-observations are assimilated alone improves the analyses in terms of humidity the most, slightly followed by the experiment in which RASTA wind data are also assimilated jointly.
Generally, results of this study indicate that the W-band reflectivity leads to a slight positive improvement in the rainfall precipitation forecasts. Nonetheless, the impact is even more positive if RASTA wind data are assimilated alone. Finally, the best scores are reached if the W-band reflectivity is jointly assimilated with RASTA wind data. Even though for precipitation Doppler radars and for cyclone studies, similar results were also obtained in prior studies (Zhao and Jin, 2008; Pu et al., 2009; Zhang et al., 2012; Dong and Xue, 2012). Consequently, the results suggest that the joint assimilation of the two observations leads to a slight improvement of both moisture initial conditions and precipitation forecasts.
In the future, the impact of the assimilation of the W-band reflectivity will also be investigated for other meteorological situations, such as fog. Indeed, since W-band radar are very sensitive to cloud liquid water, their assimilation in kilometre-scale NWP model should improve fog forecasts. In particular, the lower-cost W-band radar BASTA (Delanoë et al., 2016) will be employed during dedicated field campaigns.
The current 1D+3DVar assimilation method requires us to define the error standard deviation for the retrieved RH pseudo-observations. One perspective might be to prescribe observation errors that vary in space. In addition, it is possible that the limited impact of RH pseudo-observations as the forecast term increases is due to the fact that hydrometeors are not initialized: the condensation consumes the moisture which has just been injected in the analysis. In a near future, it will be possible to add the hydrometeor-specific contents in the control variables with a flow-dependent component in the background-error covariances. Indeed, an EnVar data assimilation system is currently being developed for the AROME model (Montmerle et al., 2018). The direct assimilation of the W-band reflectivity should be favoured by this future implementation.
RASTA data and aircraft in situ data are all available from the HyMeX database (https://doi.org/10.17616/R3M34X). Rain-gauge data are also available from the HyMeX database (https://doi.org/10.6096/MISTRALS-HyMeX.904, (Nuret, 2013)). The simulation data that support the findings of this study are available from the corresponding author on reasonable request.
This work was carried out by MB as part of her PhD thesis under the supervision of VD and OC. JD processed and provided RASTA data. NF provided the files and setup that are necessary to run the different assimilation experiments with AROME-WMED. PM provided the formulation of the exergy distance and helped use it in the impact study. All co-authors collaborated, interpreted the results, wrote the paper and replied to the comments from the reviewers.
The authors declare that they have no conflict of interest.
This article is part of the special issue “Hydrological cycle in the Mediterranean (ACP/AMT/GMD/HESS/NHESS/OS inter-journal SI)”. It is not associated with a conference.
This work is a contribution to the HyMeX programme supported by MISTRALS, ANR IODA-MED grant ANR-11-BS56-0005 and ANR MUSIC grant ANR-14-CE01-0014. This work was supported by the French national programme LEFE/INSU. The authors acknowledge the DGA (Direction Générale de l'Armement), a part of the French Ministry of Defense, for its contribution to Mary Borderies's PhD. The authors thank SAFIRE for operating the French Falcon 20 research aircraft during HyMeX-SOP1. Pierre Brousseau, Thibaut Montmerle and Philippe Chambon are also acknowledged for their technical support and scientific advise. The authors would also like to thank the two anonymous reviewers for their comments, which significantly improved the paper.
This paper was edited by Eric Martin and reviewed by two anonymous referees.
Aonashi, K. and Eito, H.: Displaced Ensemble Variational Assimilation Method to Incorporate Microwave Imager Brightness Temperatures into a Cloud-resolving Model, J. Meteorol. Soc. Jpn., 89, 175–194, https://doi.org/10.2151/jmsj.2011-301, 2011. a
Bachmann, K., Keil, C., and Weissmann, M.: Impact of radar data assimilation and orography on predictability of deep convection, Q. J. Roy. Meteor. Soc., 145, 117–130, https://doi.org/10.1002/qj.3412, 2018. a
Bloom, S. C., Takacs, L. L., da Silva, A. M., and Ledvina, D.: Data Assimilation Using Incremental Analysis Updates, Mon. Weather Rev., 124, 1256–1271, https://doi.org/10.1175/1520-0493(1996)124<1256:DAUIAU>2.0.CO;2, 1996. a
Borderies, M., Caumont, O., Augros, C., Bresson, É., Delanoë, J., Ducrocq, V., Fourrié, N., Le Bastard, T., and Nuret, M.: Simulation of W-band radar reflectivity for model validation and data assimilation, Q. J. Roy. Meteor. Soc., 144, 391–403, https://doi.org/10.1002/qj.3210, 2018. a, b, c, d, e, f
Borderies, M., Caumont, O., Delanoë, J., Ducrocq, V., and Fourrié, N.: Assimilation of wind data from airborne Doppler cloud-profiling radar in a kilometre-scale NWP system, Nat. Hazards Earth Syst. Sci. Discuss., https://doi.org/10.5194/nhess-2018-246, in review, 2018. a, b, c, d, e
Bosart, B. L., Lee, W.-C., and Wakimoto, R. M.: Procedures to improve the accuracy of airborne Doppler radar data, J. Atmos. Ocean. Tech., 19, 322–339, https://doi.org/10.1175/1520-0426-19.3.322, 2002. a, b
Bouniol, D., Protat, A., Plana-Fattori, A., Giraud, M., Vinson, J.-P., and Grand, N.: Comparison of Airborne and Spaceborne 95-GHz Radar Reflectivities and Evaluation of Multiple Scattering Effects in Spaceborne Measurements, J. Atmos. Ocean. Tech., 25, 1983–1995, https://doi.org/10.1175/2008jtecha1011.1, 2008. a
Bousquet, O., Delanoë, J., and Bielli, S.: Evaluation of 3D wind observations inferred from the analysis of airborne and ground-based radars during HyMeX SOP-1, Q. J. Roy. Meteor. Soc., 142, 86–94, https://doi.org/10.1002/qj.2710, 2016. a, b
Brousseau, P.: Propagation de l'information observée dans le système d'assimilation et le modèle atmosphérique AROME (Propagation of observed information into the AROME data assimilation and atmospheric model), PhD thesis, University of Toulouse III, 2012. a
Brousseau, P., Berre, L., Bouttier, F., and Desroziers, G.: Background-error covariances for a convective-scale data-assimilation system: AROME-France 3D-Var, Q. J. Roy. Meteor. Soc., 137, 409–422, https://doi.org/10.1002/qj.750, 2011. a
Brousseau, P., Desroziers, G., Bouttier, F., and Chapnik, B.: A posteriori diagnostics of the impact of observations on the AROME-France convective-scale data assimilation system, Q. J. Roy. Meteor. Soc., 140, 982–994, https://doi.org/10.1002/qj.2179, 2014. a
Caumont, O., Ducrocq, V., Wattrelot, É., Jaubert, G., and Pradier-Vabre, S.: 1D+3DVar assimilation of radar reflectivity data: a proof of concept, Tellus A, 62, 173–187, https://doi.org/10.1111/j.1600-0870.2009.00430.x, 2010. a, b, c
Chahat, N., Sauder, J., Hodges, R., Thomson, M., Samii, Y. R., and Peral, E.: Ka-band high-gain mesh deployable reflector antenna enabling the first radar in a CubeSat: RainCube, in: 2016 10th European Conference on Antennas and Propagation (EuCAP), 1–4, https://doi.org/10.1109/EuCAP.2016.7481692, 2016. a
Delanoë, J., Protat, A., Jourdan, O., Pelon, J., Papazzoni, M., Dupuy, R., Gayet, J.-F., and Jouan, C.: Comparison of Airborne In Situ, Airborne Radar-Lidar, and Spaceborne Radar-Lidar Retrievals of Polar Ice Cloud Properties Sampled during the POLARCAT Campaign, J. Atmos. Ocean. Tech., 30, 57–73, https://doi.org/10.1175/JTECH-D-11-00200.1, 2013. a, b, c
Delanoë, J., Protat, A., Vinson, J.-P., Brett, W., Caudoux, C., Bertrand, F., Parent du Chatelet, J., Hallali, R., Barthes, L., Haeffelin, M., and Dupont, J.-C.: BASTA: A 95-GHz FMCW Doppler Radar for Cloud and Fog Studies, J. Atmos. Ocean. Tech., 33, 1023–1038, https://doi.org/10.1175/jtech-d-15-0104.1, 2016. a, b, c
Di Michele, S., Ahlgrimm, M., Forbes, R., Kulie, M., Bennartz, R., Janisková, M., and Bauer, P.: Interpreting an evaluation of the ECMWF global model with CloudSat observations: ambiguities due to radar reflectivity forward operator uncertainties, Q. J. Roy. Meteor. Soc., 138, 2047–2065, https://doi.org/10.1002/qj.1936, 2012. a, b
Dong, J. and Xue, M.: Assimilation of radial velocity and reflectivity data from coastal WSR-88D radars using an ensemble Kalman filter for the analysis and forecast of landfalling hurricane Ike (2008), Q. J. Roy. Meteor. Soc., 139, 467–487, https://doi.org/10.1002/qj.1970, 2012. a
Ducrocq, V., Braud, I., Davolio, S., Ferretti, R., Flamant, C., Jansa, A., Kalthoff, N., Richard, E., Taupier-Letage, I., Ayral, P.-A., Belamari, S., Berne, A., Borga, M., Boudevillain, B., Bock, O., Boichard, J.-L., Bouin, M.-N., Bousquet, O., Bouvier, C., Chiggiato, J., Cimini, D., Corsmeier, U., Coppola, L., Cocquerez, P., Defer, E., Delanoë, J., Di Girolamo, P., Doerenbecher, A., Drobinski, P., Dufournet, Y., Fourrié, N., Gourley, J. J., Labatut, L., Lambert, D., Le Coz, J., Marzano, F. S., Molinié, G., Montani, A., Nord, G., Nuret, M., Ramage, K., Rison, W., Roussot, O., Saïd, F., Schwarzenboeck, A., Testor, P., Van Baelen, J., Vincendon, B., Aran, M., and Tamayo, J.: HyMeX-SOP1: The field campaign dedicated to heavy precipitation and flash flooding in the northwestern Mediterranean, B. Am. Meteorol. Soc., 95, 1083–1100, 2014. a, b
Duffourg, F., Nuissier, O., Ducrocq, V., Flamant, C., Chazette, P., Delanoë, J., Doerenbecher, A., Fourrié, N., Di Girolamo, P., Lac, C., Legain, D., Martinet, M., Saïd, F., and Bock, O.: Offshore deep convection initiation and maintenance during the HyMeX IOP 16a heavy precipitation event, Q. J. Roy. Meteor. Soc., 142, 259–274, https://doi.org/10.1002/qj.2725, 2016. a
Efron, B. and Tibshirani, R. J.: An Introduction to the Bootstrap, Chapman & Hall/CRC Press: Boca Raton, FL, 1994. a
Ehrendorfer, M., Errico, R. M., and Raeder, K. D.: Singular-Vector Perturbation Growth in a Primitive Equation Model with Moist Physics, J. Atmos. Sci., 56, 1627–1648, https://doi.org/10.1175/1520-0469(1999)056<1627:SVPGIA>2.0.CO;2, 1999. a, b, c
Fabry, F. and Sun, J.: For How Long Should What Data Be Assimilated for the Mesoscale Forecasting of Convection and Why? Part I: On the Propagation of Initial Condition Errors and Their Implications for Data Assimilation, Mon. Weather Rev., 138, 242–255, https://doi.org/10.1175/2009mwr2883.1, 2010. a, b, c
Fischer, C., Montmerle, T., Berre, L., Auger, L., and Ştefănescu, S. E.: An overview of the variational assimilation in the ALADIN/France numerical weather-prediction system, Q. J. Roy. Meteor. Soc., 131, 3477–3492, https://doi.org/10.1256/qj.05.115, 2005. a, b
Fourrié, N., Bresson, É., Nuret, M., Jany, C., Brousseau, P., Doerenbecher, A., Kreitz, M., Nuissier, O., Sevault, E., Bénichou, H., Amodei, M., and Pouponneau, F.: AROME-WMED, a real-time mesoscale model designed for the HyMeX special observation periods, Geosci. Model Dev., 8, 1919–1941, https://doi.org/10.5194/gmd-8-1919-2015, 2015. a, b, c
Gustafsson, N., Janjić, T., Schraff, C., Leuenberger, D., Weissmann, M., Reich, H., Brousseau, P., Montmerle, T., Wattrelot, E., Bučánek, A., Mile, M., Hamdi, R., Lindskog, M., Barkmeijer, J., Dahlbom, M., Macpherson, B., Ballard, S., Inverarity, G., Carley, J., Alexander, C., Dowell, D., Liu, S., Ikuta, Y., and Fujita, T.: Survey of data assimilation methods for convective-scale numerical weather prediction at operational centres, Q. J. Roy. Meteor. Soc., 144, 1218–1256, https://doi.org/10.1002/qj.3179, 2018. a, b
Hally, A., Richard, E., and Ducrocq, V.: An ensemble study of HyMeX IOP6 and IOP7a: sensitivity to physical and initial and boundary condition uncertainties, Nat. Hazards Earth Syst. Sci., 14, 1071–1084, https://doi.org/10.5194/nhess-14-1071-2014, 2014. a, b
Hashino, T., Satoh, M., Hagihara, Y., Kubota, T., Matsui, T., Nasuno, T., and Okamoto, H.: Evaluating cloud microphysics from NICAM against CloudSat and CALIPSO, J. Geophys. Res.-Atmos., 118, 7273–7292, https://doi.org/10.1002/jgrd.50564, 2013. a
Hou, A. Y., Kakar, R. K., Neeck, S., Azarbarzin, A. A., Kummerow, C. D., Kojima, M., Oki, R., Nakamura, K., and Iguchi, T.: The global precipitation measurement mission, B. Am. Meteorol. Soc., 95, 701–722, https://doi.org/10.1175/BAMS-D-13-00164.1, 2014. a
Iguchi, T., Nakajima, T., Khain, A. P., Saito, K., Takemura, T., Okamoto, H., Nishizawa, T., and Tao, W.-K.: Evaluation of Cloud Microphysics in JMA-NHM Simulations Using Bin or Bulk Microphysical Schemes through Comparison with Cloud Radar Observations, J. Atmos. Sci., 69, 2566–2586, https://doi.org/10.1175/jas-d-11-0213.1, 2012. a
Ikuta, Y.: Data assimilation using GPM/DPR at JMA, CAS/JSC WGNE Res. Activ. Atmos. Oceanic Modell, 46, 01–11, 2016. a
Illingworth, A. J., Barker, H. W., Beljaars, A., Ceccaldi, M., Chepfer, H., Clerbaux, N., Cole, J., Delanoë, J., Domenech, C., Donovan, D. P., Fukuda, S., Hirakata, M., Hogan, R. J., Huenerbein, A., Kollias, P., Kubota, T., Nakajima, T., Nakajima, T. Y., Nishizawa, T., Ohno, Y., Okamoto, H., Oki, R., Sato, K., Satoh, M., Shephard, M. W., Velázquez-Blázquez, A., Wandinger, U., Wehr, T., and van Zadelhoff, G.: The EarthCARE Satellite: The Next Step Forward in Global Measurements of Clouds, Aerosols, Precipitation, and Radiation, B. Am. Meteorol. Soc., 96, 1311–1332, https://doi.org/10.1175/bams-d-12-00227.1, 2015. a
Jacques, D. and Zawadzki, I.: The Impacts of Representing the Correlation of Errors in Radar Data Assimilation, Part I: Experiments with Simulated Background and Observation Estimates, Mon. Weather Rev., 142, 3998–4016, https://doi.org/10.1175/MWR-D-14-00104.1, 2014. a
Janisková, M.: Assimilation of cloud information from space-borne radar and lidar: experimental study using a 1D+4D-Var technique, Q. J. Roy. Meteor. Soc., 141, 2708–2725, https://doi.org/10.1002/qj.2558, 2015. a, b, c, d, e, f, g
Janiskovà, M., Lopez, P., and Bauer, P.: Experimental 1D+4D-Var assimilation of CloudSat observations, Q. J. Roy. Meteor. Soc., 138, 1196–1220, https://doi.org/10.1002/qj.988, 2012. a, b
Kollias, P., Clothiaux, E. E., Miller, M. A., Albrecht, B. A., Stephens, G. L., and Ackerman, T. P.: Millimeter-Wavelength Radars: New Frontier in Atmospheric Cloud and Precipitation Research, B. Am. Meteorol. Soc., 88, 1608–1624, https://doi.org/10.1175/BAMS-88-10-1608, 2007. a, b
Liu, Z.-Q. and Rabier, F.: The interaction between model resolution, observation resolution and observation density in data assimilation: A one-dimensional study, Q. J. Roy. Meteor. Soc., 128, 1367–1386, https://doi.org/10.1256/003590002320373337, 2002. a
Marquet, P.: Exergy in meteorology: Definition and properties of moist available enthalpy, Q. J. Roy. Meteor. Soc., 119, 567–590, https://doi.org/10.1002/qj.49711951112, 1993. a
Marquet, P., Mahfouf, J.-F., and Holdaway, D.: Definition of the moist-air available enthalpy (exergy) norm: a comparison with existing “moist energy norms”, Mon. Weather Rev., https://arxiv.org/abs/1807.06240, submitted, 2019. a, b, c, d, e
Martinet, M., Nuissier, O., Duffourg, F., Ducrocq, V., and Ricard, D.: Fine-scale numerical analysis of the sensitivity of the HyMeX IOP16a heavy precipitating event to the turbulent mixing-length parametrization, Q. J. Roy. Meteor. Soc., 143, 3122–3135, https://doi.org/10.1002/qj.3167, 2017. a
Mishchenko, M. I., Travis, L. D., and Mackowski, D. W.: T-matrix computations of light scattering by nonspherical particles: A review, J. Quant. Spectrosc. Ra., 55, 535–575, https://doi.org/10.1016/0022-4073(96)00002-7, 1996. a
Montmerle, T., Michel, Y., Arbogast, E., Ménétrier, B., and Brousseau, P.: A 3D Ensemble Variational Data Assimilation Scheme for the limited area AROME model: formulation and preliminary results, Q. J. Roy. Meteor. Soc., 144, 2196–2215, https://doi.org/10.1002/qj.3334, 2018. a
Nuret, M.: HyMeX domain precipitation amount, SEDOO OMP, doi:10.6096/mistrals-hymex.904, 2013. a
Okamoto, K., Aonashi, K., Kubota, T., and Tashima, T.: Experimental Assimilation of the GPM Core Observatory DPR Reflectivity Profiles for Typhoon Halong (2014), Mon. Weather Rev., 144, 2307–2326, https://doi.org/10.1175/mwr-d-15-0399.1, 2016. a, b, c
Pinty, J. and Jabouille, P.: A mixed-phase cloud parameterization for use in mesoscale non-hydrostatic model: simulations of a squall line and of orographic precipitations, in: Conf. on Cloud Physics, Amer. Meteor. Soc Everett, WA, 217–220, 1998. a
Protat, A., Bouniol, D., Delanoë, J., O'Connor, E., May, P., Plana-Fattori, A., Hasson, A., Görsdorf, U., and Heymsfield, A.: Assessment of CloudSat reflectivity measurements and ice cloud properties using ground-based and airborne cloud radar observations, J. Atmos. Ocean. Tech., 26, 1717–1741, https://doi.org/10.1175/2009JTECHA1246.1, 2009. a
Pu, Z., Li, X., and Sun, J.: Impact of airborne Doppler radar data assimilation on the numerical simulation of intensity changes of Hurricane Dennis near a landfall, J. Atmos. Sci., 66, 3351–3365, 2009. a, b
Rohn, M., Kelly, G., and Saunders, R. W.: Impact of a New Cloud Motion Wind Product from Meteosat on NWP Analyses and Forecasts, Mon. Weather Rev., 129, 2392–2403, https://doi.org/10.1175/1520-0493(2001)129<2.0.co;2, 2001. a
Seity, Y., Brousseau, P., Malardel, S., Hello, G., Bénard, P., Bouttier, F., Lac, C., and Masson, V.: The AROME-France Convective-Scale Operational Model, Mon. Weather Rev., 139, 976–991, https://doi.org/10.1175/2010mwr3425.1, 2011. a, b
Stephens, G. L.: Cloud Feedbacks in the Climate System: A Critical Review, J. Climate, 18, 237–273, https://doi.org/10.1175/jcli-3243.1, 2005. a
Storto, A. and Randriamampianina, R.: The relative impact of meteorological observations in the Norwegian regional model as determined using an energy norm-based approach, Atmos. Sci. Lett., 11, 51–58, https://doi.org/10.1002/asl.257, 2010. a, b, c
Storto, A. and Tveter, T. F.: Assimilating humidity pseudo-observations derived from the cloud profiling radar aboard CloudSat in ALADIN 3D-Var, Meteorol. Appl., 16, 461–479, https://doi.org/10.1002/met.144, 2009. a, b, c, d, e, f
Taufour, M., Vié, B., Augros, C., Boudevillain, B., Delanoë, J., Delautier, G., Ducrocq, V., Lac, C., Pinty, J.-P., and Schwarzenböck, A.: Evaluation of the two-moment scheme LIMA based on microphysical observations from the HyMeX campaign, Q. J. Roy. Meteor. Soc., 144, 1398–1414, https://doi.org/10.1002/qj.3283, 2018. a
Wattrelot, E., Caumont, O., and Mahfouf, J.-F.: Operational Implementation of the 1D+3D-Var Assimilation Method of Radar Reflectivity Data in the AROME Model, Mon. Weather Rev., 142, 1852–1873, https://doi.org/10.1175/mwr-d-13-00230.1, 2014. a, b
Wolde, M. and Pazmany, A.: NRC Dual-Frequency Airborne Radar for Atmospheric Research, in: 32nd International Conference on Radar Meteorology, International Conference on Radar Meteorology, Albuquerque, New Mexico, 2005. a
Zhang, L., Pu, Z., Lee, W.-C., and Zhao, Q.: The influence of airborne Doppler radar data quality on numerical simulations of a tropical cyclone, Weather Forecast., 27, 231–239, https://doi.org/10.1175/waf-d-11-00028.1, 2012. a, b
Zhao, Q. and Jin, Y.: High-resolution radar data assimilation for Hurricane Isabel (2003) at landfall, B. Am. Meteorol. Soc., 89, 1355–1372, https://doi.org/10.1175/2008BAMS2562.1, 2008. a, b
- Abstract
- Introduction
- NWP model and radar data
- Assimilation method
- Data assimilation experiments
- Impact on the IOP7a case study
- Results on the HyMeX SOP1
- Discussions and conclusions
- Data availability
- Author contributions
- Competing interests
- Special issue statement
- Acknowledgements
- Review statement
- References