the Creative Commons Attribution 4.0 License.
the Creative Commons Attribution 4.0 License.
 | 24 Apr 2019
Strategies for increasing tsunami shelter accessibility to enhance hazard risk adaptive capacity in coastal port cities: a study of Nagoya city, Japan
Weitao Zhang
Jiayu Wu
Yingxia Yun
Coastal areas face a significant risk of tsunami after a nearby heavy earthquake. Comprehensive coastal port cities often complicate and intensify this risk due to the high vulnerability of their communities and liabilities associated with secondary damage. Accessibility to tsunami shelters is a key measure of adaptive capacity in response to tsunami risks and should therefore be enhanced. This study integrates the hazards that create risk into two dimensions: hazard-product risk and hazard-affected risk. Specifically, the hazard-product risk measures the hazard occurrence probability, intensity, duration, and extension in a system. The hazard-affected risk measures the extent to which the system is affected by the hazard occurrence. This enables the study of specific strategies for responding to each kind of risk to enhance accessibility to tsunami shelters. Nagoya city in Japan served as the case study: the city is one of the most advanced tsunami-resilient port cities in the world. The spatial distribution of the hazard-product risk and hazard-affected risk was first visualized in 165 school district samples, covering 213 km2 using a hot spot analysis. The results suggest that the rules governing the distribution of these two-dimensional (2-D) risks are significantly different. By refining the tsunami evacuation time–space routes, traffic-location-related indicators, referring to three-scale traffic patterns with three-hierarchy traffic roads, are used as accessibility variables. Two-way multivariate analysis of variance (MANOVA) was used to analyse the differences in these accessibility variables to compare the 2-D risk. MANOVA was also used to assess the difference of accessibility between high-level risk and low-level risk in each risk dimension. The results show that tsunami shelter accessibility strategies, targeting hazard-product risk and hazard-affected risk, are significantly different in Nagoya. These different strategies are needed to adapt to the risk.


In coastal areas, a nearby maritime earthquake is typically followed by a chain of onshore waves. Some of these waves have the potential to become a heavy tsunami, significantly endangering the lives of the resident population. Comprehensive coastal port cities are places that have maintained leading positions in both global urban and port systems (Lee et al., 2008; Cerceau et al., 2014) and both complicate and intensify risks from tsunami in the following ways. First, socioeconomic elements are clustered in a dense, disproportionate, and interwoven land-use pattern (Daamen and Vries, 2013; Bottasso et al., 2014; Ng et al. 2014; Wang et al., 2015) along lowland and flat terrain (Mahendra et al., 2011). This leads to communities having a nonlinear sensitivity to tsunami due to the extreme diversity of hazard-affected environments. Second, port-industry land use and large disposal infrastructures are prone to fire, explosion, and chemical leakage in response to heavy surge waves. This exposes communities to large-scale secondary damage, especially where huge port-industry complexes penetrate into residential and service zones.
To reduce population loss during a tsunami, evacuation planning (Glavovic et al., 2010; Wegscheider et al., 2011) in comprehensive coastal port cities should be consistent and supported by an effective tsunami shelter layout (Dall'Osso and Dominey-Howes, 2010). Tsunami shelters are typically high-rises with many floors, a large volume, and a reinforced concrete structure. They are also generally antiseismic, fireproof, and explosion-proof (Scheer et al., 2012; Suppasri et al., 2013; Chocl and Butler, 2014). In most countries around the world, tsunami shelters are in public service buildings (Disaster Prevention Plan of Tokyo Port Area, 2016; Faruk et al., 2017). These buildings provide short-term emergency shelter and long-term shelter.
Tsunami shelters are also effective shelters that protect against other surge and wind hazards caused by meteorological factors that are intensified by climate change (Solecki et al., 2011), such as storm tides. The difference between these events is that the available time for tsunami evacuation is far shorter, generally ranging within 30 to 60 min after a heavy earthquake (Atwater et al., 2006). This makes on-site evacuation for tsunamis equally or more important than cross-regional evacuation. (Cross-regional evacuation is the major evacuation route for other surge and wind hazards.) However, it can also lead to congested and disordered evacuation traffic to tsunami shelters during an emergency. Therefore, maximizing accessibility from disaster areas to tsunami shelters is a key principle, especially when determining the effect of the tsunami shelter layout in the evacuation planning of coastal cities.
In general, studies on shelter accessibility have examined a broad array of factors, including traffic location assessment using simple qualitative research and quantitative evaluation (Thanvisitthpon, 2017; Rus et al., 2018; Faruk et al., 2018), facility location modeling (Ng et al., 2010; Kulshrestha et al., 2014; Mollah et al., 2018) and route optimization planning (Campos et al., 2012; Goerigk et al., 2014; Khalid et al., 2018) using complex overall planning modeling and computer simulations. The studies specific to tsunami shelter accessibility have mainly focused on two aspects: evacuation traffic system on a technical level and adaptive capacity with an environmental focus.
Evacuation traffic systems include traffic patterns, roadways, and possible traffic congestion on roadways. With respect to traffic patterns, diverse simulations using an agent-based model have assessed evacuations to tsunami shelters on foot, in vehicles, or using a combination of both (Mas et al., 2014). Traffic flow models (Johnstone and Lence, 2012) in a disaster scenario have also been done. These simulations are applied to predict the refuge-related preferences of the population or to recommend a tsunami evacuation traffic pattern. To guide or verify theoretical studies, social survey and questionnaire methods have been combined with statistical analyses using information from actual tsunamis that have occurred (Murakami et al., 2014).
With respect to tsunami evacuation roadways, qualitative studies have focused on roadway design, based on a city's actual road situation (Yang et al., 2010). Recommendations for modifying, enhancing, and extending city roads have also been proposed to maximize effective access to shelters across regions during tsunami evacuation (León and March, 2014). In contrast, quantitative studies are more complicated and apply overall planning models and computer techniques. These studies have focused on establishing an evacuation network model to identify the optimal roadways to shelters while minimizing evacuation time and traffic cost and maximizing the scale of evacuation (Shen et al., 2016). Furthermore, traffic congestion that extends evacuation time, including road damage and traffic accidents, has also been widely considered in evacuation network modeling and is consistently incorporated in roadway optimization planning (Chen et al., 2012; Stepanov and Smith, 2009).
In addition to tsunami shelter accessibility studies related to a specific evacuation traffic system, several studies have used tsunami shelter accessibility as a key measure to assess the vulnerability of coastal communities to tsunami events. Population-at-risk scales can be obtained by measuring the evacuation completion time, hazard zones, and levels (Wegscheider et al., 2011). Meanwhile, other studies have emphasized the importance of evacuation guidance, early warnings, and route planning to respond to tsunami risks (Goseberg et al., 2014). These studies have also quantified and explored evacuation modeling using computer techniques, such as geographic information system (GIS) analysis and multiagent simulations.
To summarize existing tsunami shelter accessibility studies, they closely connect integrated hazard risks from local to global scales. These studies are supported by multiple evacuation-space scales and multiple traffic patterns. However, although all-round traffic conditions are considered in tsunami shelter accessibility studies, few studies have correlated shelter accessibility and specific, disintegrated risk in an extended way.
However, studies on hazard risk (and its evaluation) are increasingly popular (Balica et al., 2012; Yoo et al., 2011; Huang et al., 2012). According to United Nations Office for Disaster Risk Reduction (UNISDR), hazard risk refers to the products of hazards, as well as the vulnerability of hazard-affected bodies (the system or monomer affected by hazards, such as residents, facilities, and assets) (Wamsler et al., 2013; Johnstone and Lence, 2012). Thus, hazard risk can be split into two dimensions: the hazard-product risk and the hazard-affected risk. The hazard-product risk dimension refers to the hydro-geographic system measurements of the hazard occurrence probability, intensity, duration, and extension factors (Preston et al., 2011; Goseberg et al., 2014). The hazard-affected risk dimension covers both the socioeconomic and political–administrative systems (Felsenstein and Lichter, 2014; Jabareen, 2013). This dimension is divided into exposure, sensitivity, and adaptive capacity factors in studies on coastal area (Saxena et al., 2013) and climate change (Frazier et al., 2010) (and its driven hazards) vulnerability assessments. Therefore, in a broad sense, the hazard-affected risk is an comprehensive concept. Within this concept, exposure and sensitivity are factors that are proportional to the hazard-affected risk and the final integrated hazard risk. In contrast, adaptive capacity refers to different measures taken by hazard-affected bodies to mitigate, prepare, prevent, and respond to disasters and to recover from them (León and March, 2014; Desouza and Flanery, 2013; Solecki et al., 2011). However, when focusing on the narrow sense of hazard-affected risk related to negative risk-related factors, adaptive capacity becomes the major research object and can be studied independently, outside of the hazard-affected risk dimension.
Consistently with the significantly different factors evaluated for hazard-product risk and hazard-affected risk, different spatial distributions between this two-dimensional (2-D) risk can be formed. Shelter accessibility can be used as a key measure of adaptive capacity in responding to hazard risk: this accessibility can be ensured and enhanced where the hazard-product risk is large and in the case when the hazard-affected risk is high in a different and separately targeted way.
In summary, the main purpose of this study was to explore the correlation between shelter accessibility and both hazard-product risk and hazard-affected risk. The extreme complexity of the tsunami hazard risk situation in comprehensive coastal port cities makes them interesting and valuable to explore. As such, this study used the case study of Nagoya in Japan, which is one of the most advanced tsunami-resilient port cities in the world. The goal was to investigate whether and how the tsunami shelter accessibility performance of Nagoya shows positive but different intracity adaptive capacities to hazard-product risk and hazard-affected risk. The tsunami evacuation time–space routes reveal evacuation directions, and route orders are sorted and refined. Based on this, three traffic patterns with three-hierarchy roadways (mainly focusing on traffic location in a road system) are assessed separately to analyze shelter accessibility.
The main goals and steps of this study were (1) to investigate the 2-D spatial differentiation of risks by estimating the spatial distribution of both hazard-product risk and hazard-affected risk, as well as of risk levels in each risk dimension; (2) to separately explore the different accessibility strategies that aim to enhance the adaptive capacity targeted at high hazard risk in two risk dimensions. This involves analyzing significant differences in tsunami shelter accessibility performance between hazard-product risk and hazard-affected risk, as well as between high-risk level and low-risk level in each risk dimension.

Nagoya is a central and industrial city in the Greater Nagoya metropolitan area facing the Ise Bay, where the Nagoya Port is located. The topography is generally flat, with gentle hills to the east that connect to distant mountains. Three main rivers are positioned to the east of the fertile Nobi Plains, facing Ise Bay to the south. The Shonai River flows from the northeast of the city to the southwest, encircling the central area where the Horikawa River flows (see Fig. 1). There are 16 administrative regions in Nagoya. The 12 western regions include offshore locations and estuaries, with a low and flat terrain. There is significant a water network and traffic network coverage. The port-driven land use and residential land use are mixed, with a high-density and diverse population distribution. In contrast, the four eastern regions are in a low-density and residential-development hilly area.

Figure 1The geological features of Nagoya. (Introduction of Outline Section of Planning for Nagoya, 2012. Accessed from the official website of Nagoya: http://www.city.nagoya.jp/jutakutoshi/page/0000045893.html, last access: April 2019.)
Nagoya has learned lessons from the 2011 Great East Japan Earthquake–Tsunami disaster. This learning has contributed to significant progress in developing a tsunami-resilient city. Nagoya's Disaster Prevention City Development Plan (DPCDP) was issued in 2015. It is based on the scenario of a future maximum-impact earthquake–tsunami in the Nankai Trough. This plan promoted the establishment of a safe city (Dai, 2015). One major component of this plan was improving the tsunami shelter layout to facilitate an easy evacuation in coastal high-impact hazard surroundings.
3.1 Sample and data collection
School districts served as the study's sample units. A “school district” is a technical term in Japan and is defined as the most basic disaster prevention community unit by the local government. This study investigated 165 school districts in the western 12 administrative regions of Nagoya city, which included 474 tsunami shelters (see Fig. 2). The total study area covers 213 km2. Table 1 lists the data sets used for this study.
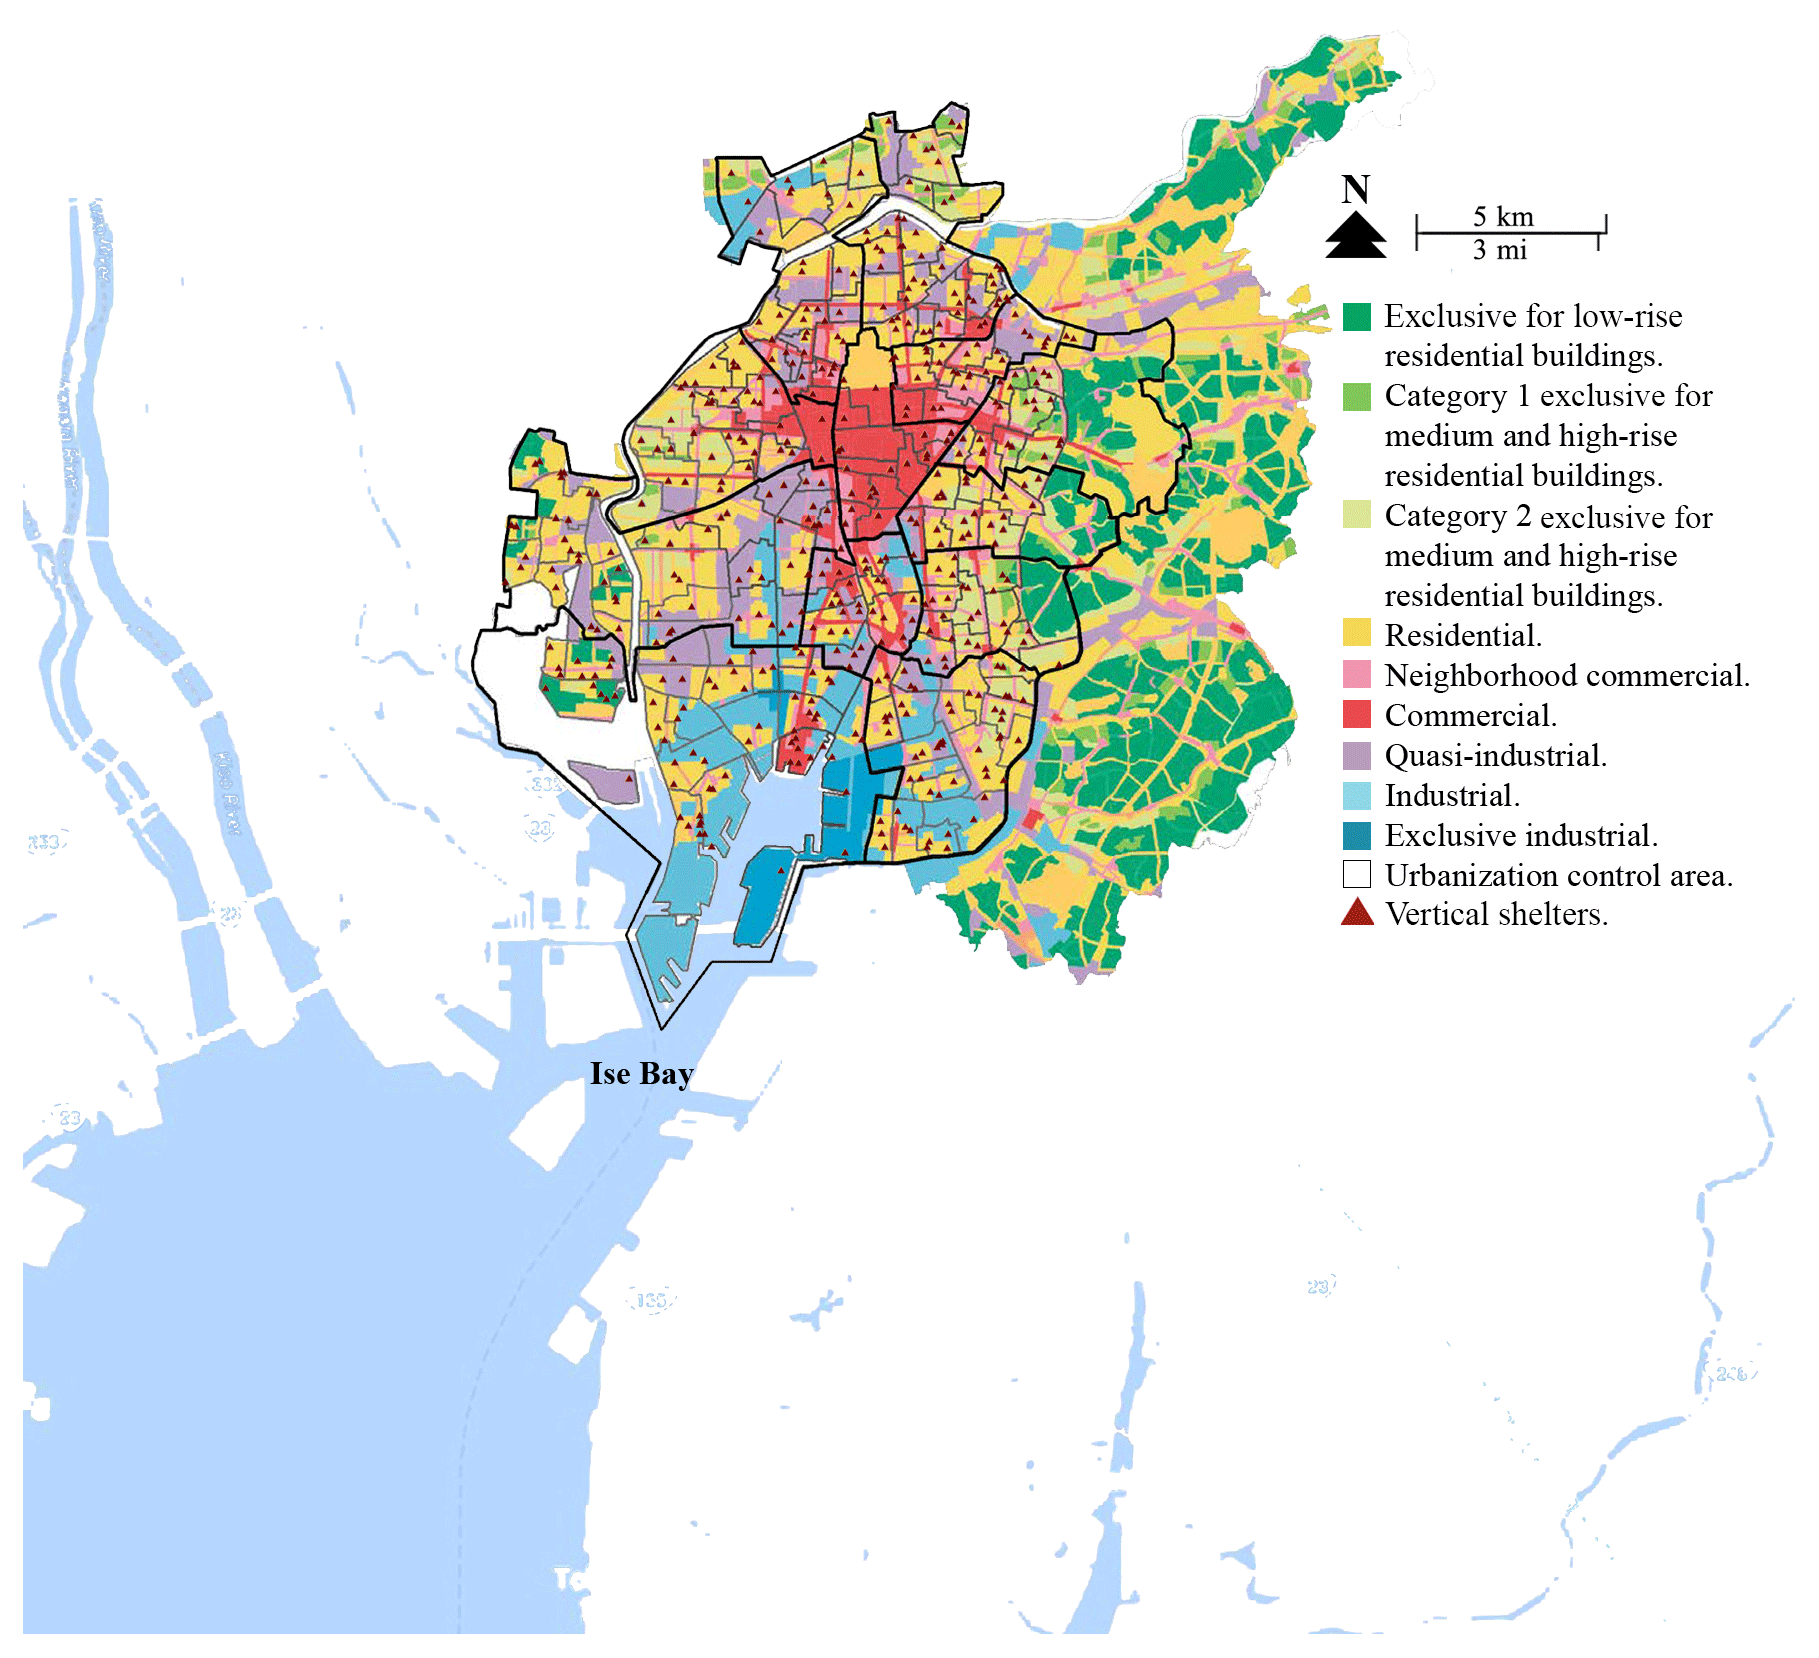
Figure 2The school districts and tsunami shelters of the studied administrative regions in Nagoya city. (The authors combined the Nagoya city land use map from Initiatives in Planning for Nagoya, 2012. Accessed from the official website of Nagoya: http://www.city.nagoya.jp/jutakutoshi/page/0000045893.html, last access: April 2019.)
3.2 Accessibility variables
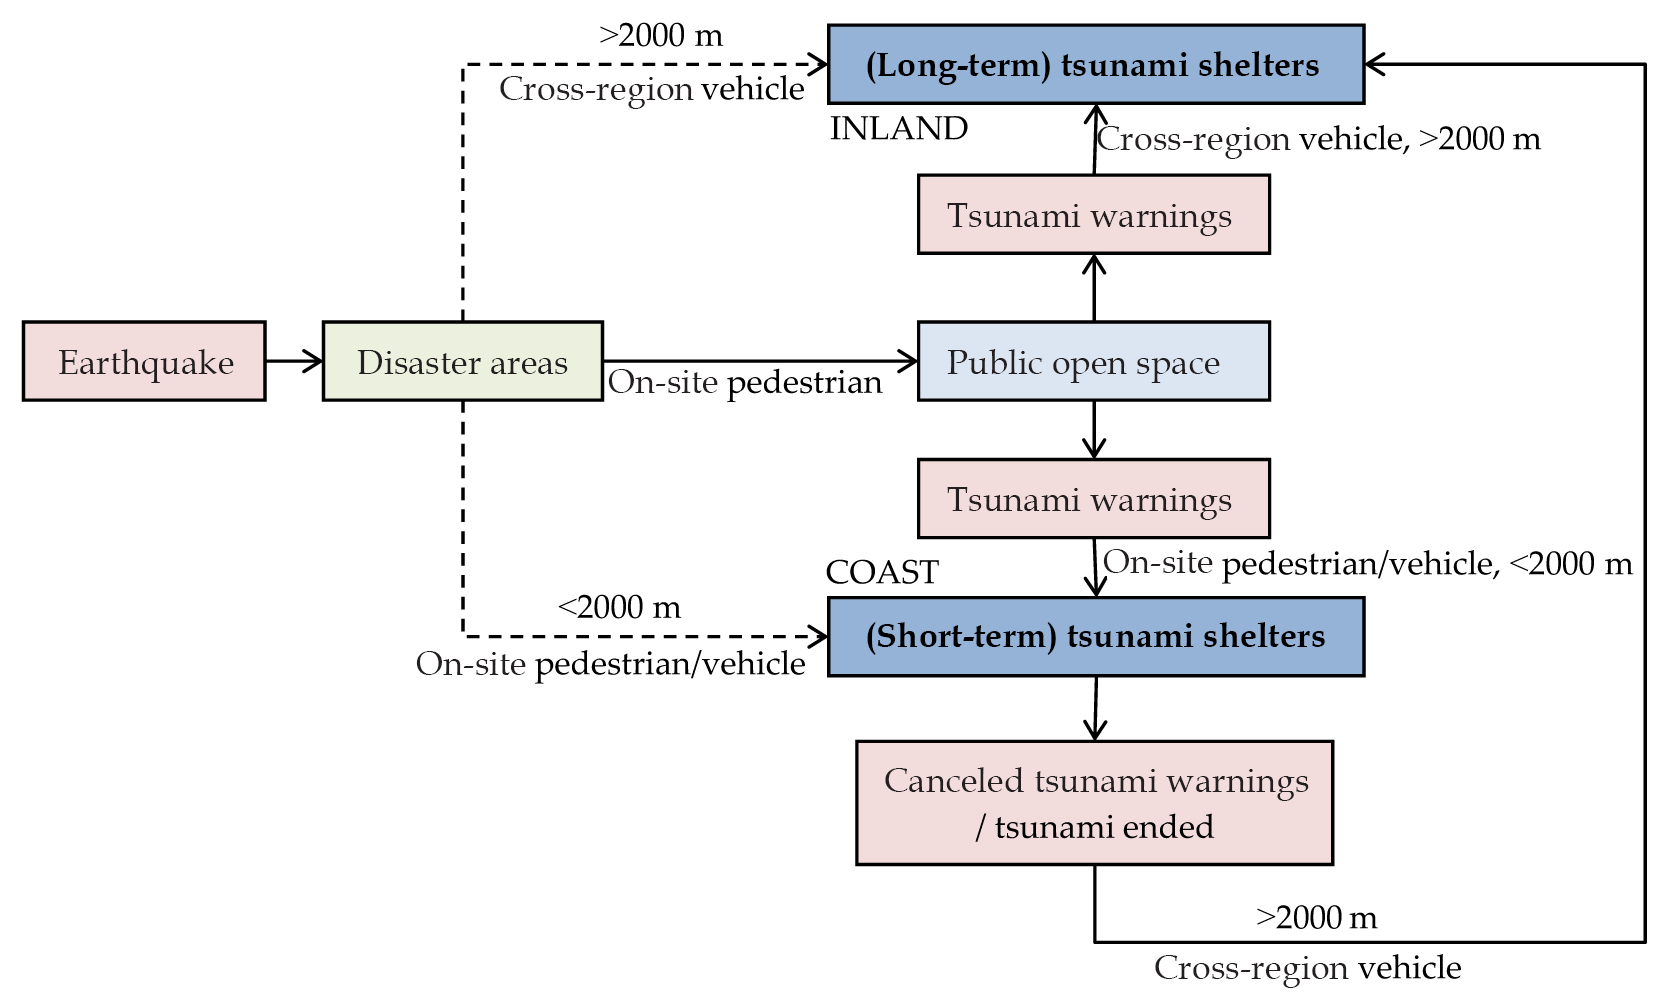
According to disaster prevention plan documents from Nagoya and other coastal cities in Japan, early during a heavy earthquake, most populations are encouraged to immediately evacuate to nearby seismic shelters (Dai, 2015). These seismic shelters are usually public open spaces that can protect evacuees from earthquakes and fires (Hossain, 2014; Islas and Alves, 2016; Jayakody et al., 2018). However, they do not protect evacuees from surge waves and flood damages. As such, populations evacuated to these seismic shelters should wait for tsunami warnings or evacuation orders.
According to Japan's coastal city disaster prevention document and the Great East Japan Earthquake experience (Disaster Prevention Plan of Tokyo Port Area, 2016; Tanaka, 2017), tsunami warnings are issued by administrative departments in 2 to 3 min after a heavy earthquake. And the tsunami will finally arrive in 30 to 60 min (Atwater et al., 2006). After receiving tsunami announcements, and based on the predicted available time for tsunami evacuation, the population will evacuate from these seismic shelters individually on foot to nearby tsunami shelters. They will also be organized by rescue authorities and sent by vehicles from the seismic shelters to nearby or remote tsunami shelters. Moving to the seismic shelter and then to tsunami shelters is the first transfer stage after an earthquake but before a tsunami arrives.
After the tsunami warning has been temporarily canceled or after a tsunami has happened, a second tsunami transfer stage is activated to prevent possible or secondary tsunami damage or to move people away from the damaged shelters. In general, only tsunami shelters in inland and high terrain can support long-term safe sheltering. In contrast, shelters in flooding-risk areas are appropriate for short-term emergency sheltering. Therefore, populations in these short-term shelters are organized in a way that allow them to be continuously transferred by vehicles to inland or higher terrain.
There are also populations who have assembled in seismic shelters and who have received tsunami warnings but who decide to return to their homes for different reasons, such as to contact family and protect private property (Murakami et al., 2014; Suppasri et al., 2013). Then, they may again decide to individually walk or drive to nearby tsunami shelters or drive to tsunami shelters in inland and high terrain. These evacuation activities are all ordered through an emergency plan by local governments. Based on these major evacuation activities, the multiple tsunami evacuation time–space routes were refined for this study (see Fig. 3).
Combined with a statistical research on evacuation traffic patterns from the Great East Japan Earthquake (Murakami et al., 2014), three evacuation traffic patterns can be sorted out in the multiple tsunami evacuation time–space routes: on-site pedestrian evacuation (100 % pedestrian evacuation in 2000 m), on-site vehicle evacuation (80 % vehicle evacuation in 2000 m), and cross-regional vehicle evacuation (20 % vehicle evacuation over 2000 m). Therefore, these three traffic patterns refer to tsunami shelter accessibility needs and are studied in this paper. They can be measured along with three-hierarchy roads and include a total of eight accessibility indicators. Each indicator is calculated based on the arithmetic mean of tsunami shelters in each school district sample (see Table 2).
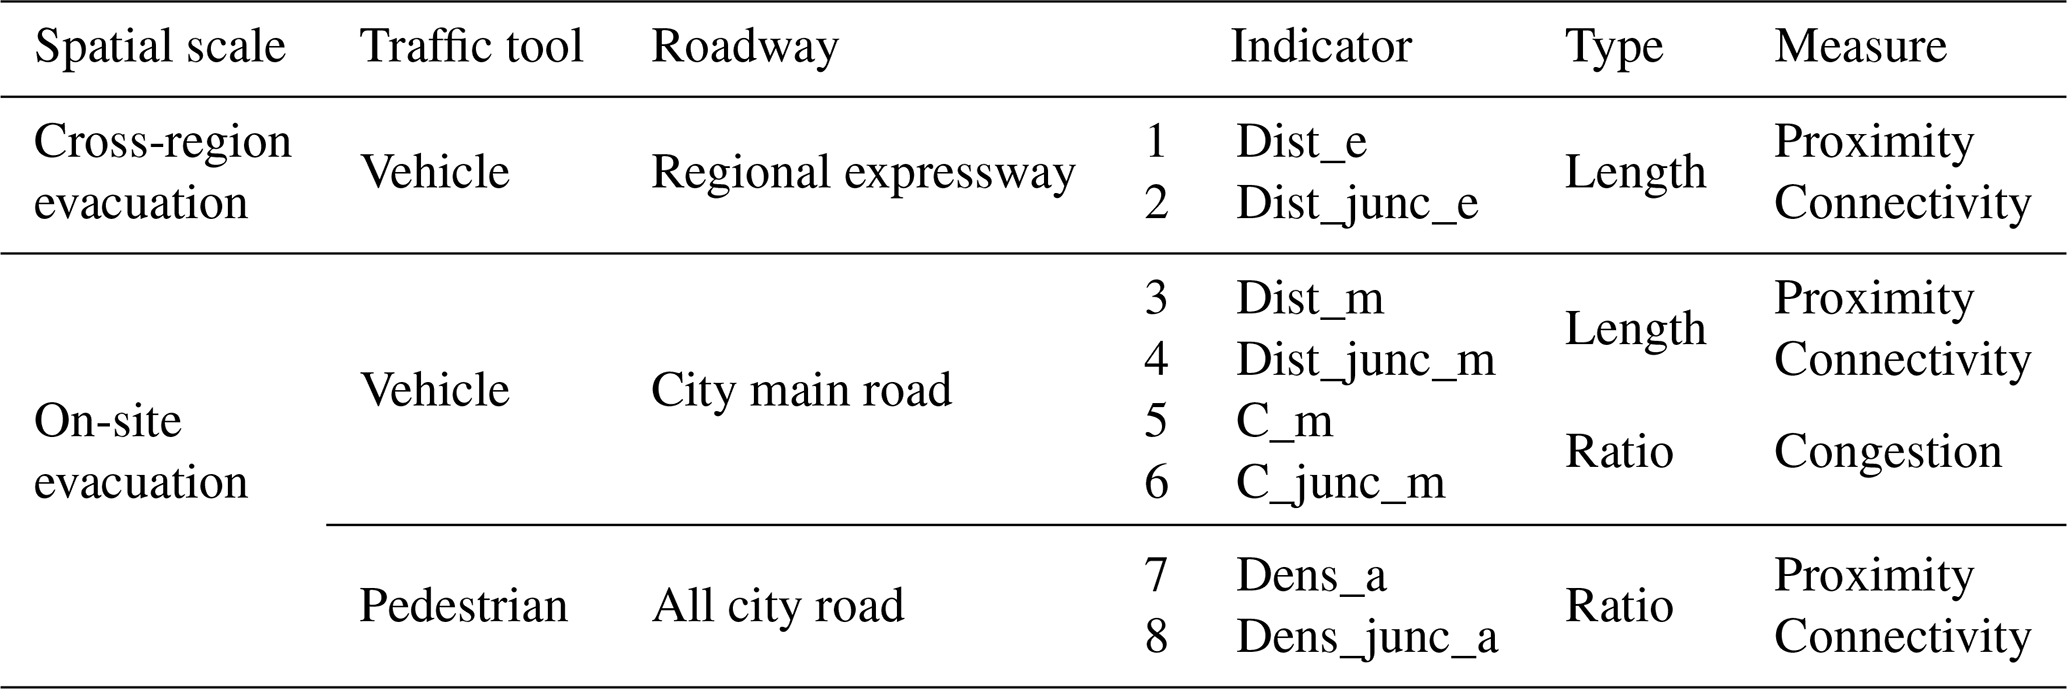
On-site vehicle evacuation occurs on the main roads of the city. Previous studies on evacuation practice have shown that population-heavy occupied shelters are close to main roads and their junctions after the disaster (Allan et al., 2013). Thus, two spatial indicators are studied: a shelter's shortest distance to a main road to estimate the proximity to transportation and a shelter's shortest distance to a junction of main roads to estimate the connectivity in a transportation network. Proximity provides a location advantage, ensuring the quick activation of traffic and fast and organized evacuation in a local area. Connectivity supports multidirection opportunities for local evacuations. Shelters with high connectivity may become a local evacuation hub.
Moreover, main roads in a local area are used for both vehicle and pedestrian evacuations, leading to traffic problems. Many studies have argued that the population cannot reach shelters in enough time, mostly due to road congestion (Chen et al., 2012; Campos et al., 2012). This results from flooding and destroyed roads, as well as chaos between people and vehicles, triggering traffic accidents. Thus, this study applied traffic congestion indicators: the ratio of population number to road length in each district sample and the ratio of population number to number of road junctions in each district sample. This approach is based on the critical cluster model created by Cova and Church (1997), wherein the possibility of congestion can be measured using the ratio of the number of people in a specific region to the overall capacity of exits across the region's boundaries. A higher ratio generally indicates traffic congestion, which triggers other traffic accidents on the road or junctions around tsunami shelters.
Cross-regional vehicle evacuation relies on regional expressways to ensure mass, fast, and well-organized transportation. Proximity and connectivity indicators are also important. Proximity supports efficient transfers in a single-direction to remote safe areas if the local area is damaged by inundation and secondary disasters. Proximity also supports the acceptance of regional evacuees from offshore areas with heavy flooding. Connectivity supports multiple-directed evacuation opportunities throughout a large region. Connectivity also allows shelters to provide the regional base with comprehensive disaster–response activities.
Many studies have found that on-site pedestrian evacuations involve all city roads (main roads and branch roads). Because of the extremely high-density grid-network branch roads in Nagoya, most tsunami shelters are located on the corners of city roads. As such, there is no need to measure the proximity from shelters to city roads or junctions. We used the density of all roads and the density of junctions of all roads in each district sample to estimate the walking traffic coverage and connectivity in the vicinity of tsunami shelters.
3.3 Hazard risk variables
This study evaluated hazard-product risk and hazard-affected risk in Nagoya separately. Four main hazards are associated with hazard-product risk in a tsunami scenario (see Table 3). The time–space impact of each hazard on the surrounding areas is very different. Before a tsunami, an earthquake has a relatively even impact on the local area, lowering its comparative risk (Chen et al., 2012). A tsunami results in different inundations due to complex bathymetric and topographic conditions (Xu et al., 2016), while the overall impact level decreases progressively from the open sea and riverways to inland. Explosions and fires are secondary hazards that occur with the earthquake and are generally intensified by the tsunami. Explosions have a concentrated point-shape impact around hazardous port-driven industry facilities, where the hazard effects decrease with increased distance from the focal point, threatening the nearby communities with sudden disruptions (Taveau, 2010; Christou et al., 2011). A fire hazard shows a planarly sprawling impact due to inflammable material storage and nonfireproof construction sources.
Table 3List of indicators computed in the hazard risk evaluation.
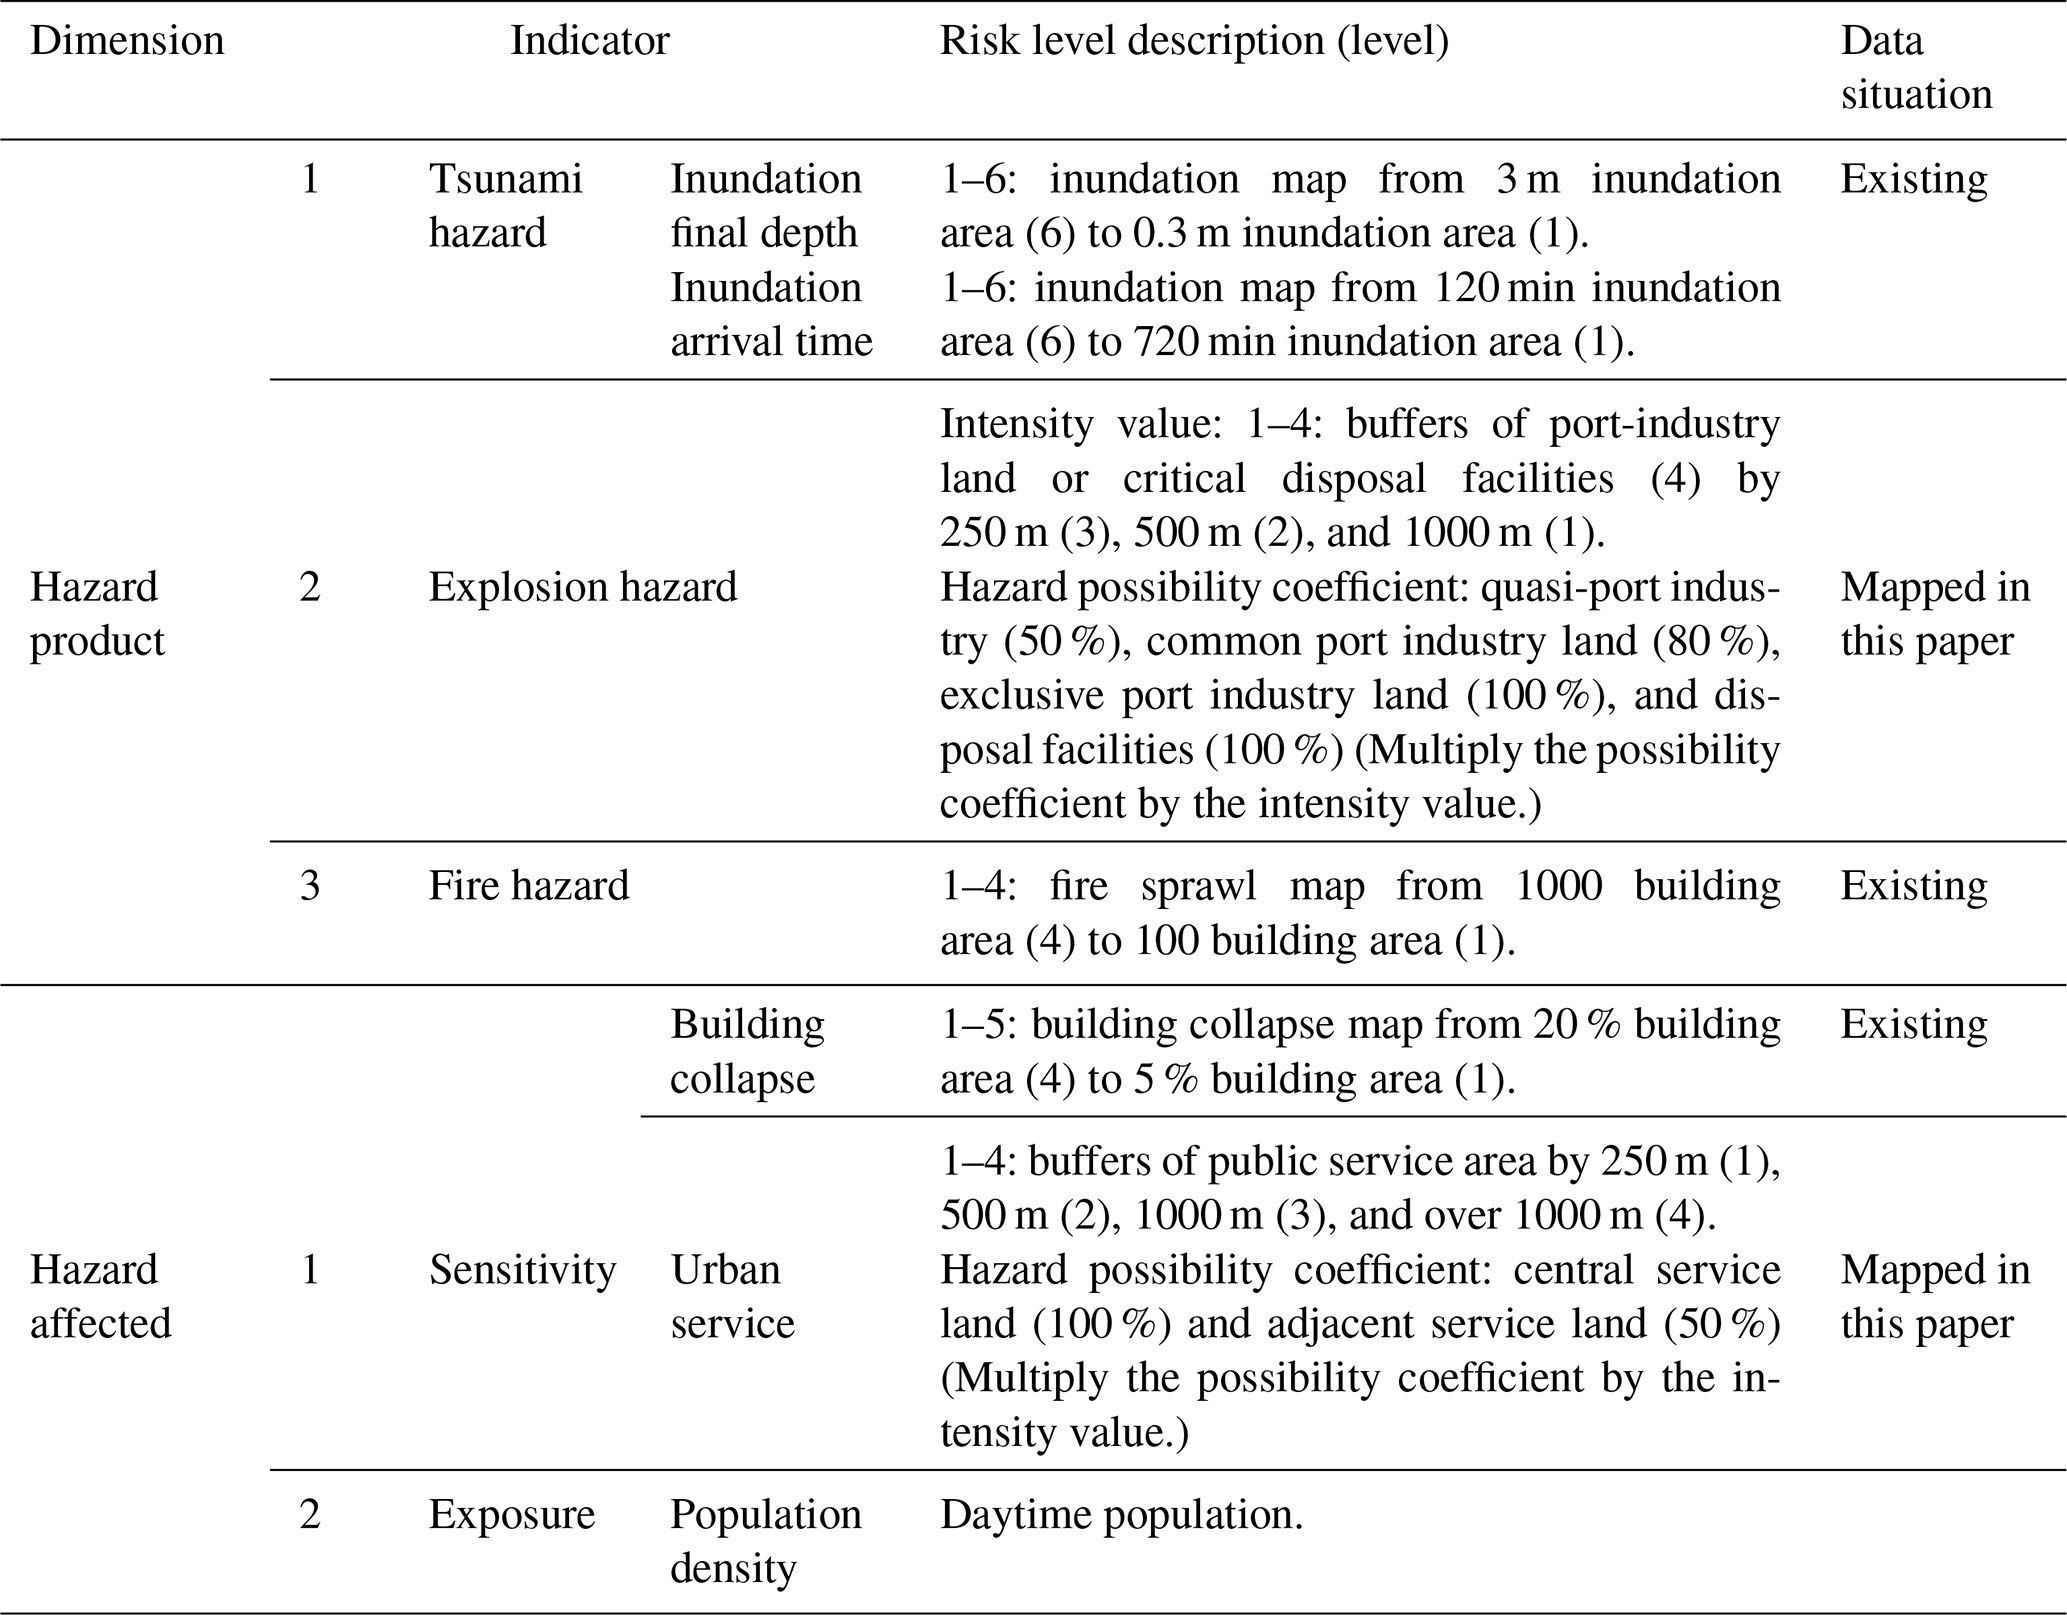
With respect to the hazard-affected risk (see Table 3), the exposure factor refers to the extent to which a system at risk is exposed to a hazard. Daytime population density was selected as the exposure indicator in this study, because population is the hazard-affected body in a shelter accessibility analysis. The sensitivity explains how the system is susceptible to the forces and negatively impacts in association with a hazard. We selected sensitivity indicators with environmental attributes that may impede or support population evacuation. Environmental attributes can also indicate the behavioral abilities of the distributed population. Therefore, we measured sensitivity using both a building collapse indicator and an urban service indicator. The building collapse indicator refers to a low-quality environment and old-standard construction. It also indicates the distribution of vulnerable populations, especially low-income people. It has been suggested that low-income people consistently have less ability to respond to hazards in an efficient and timely way due to less education, less available information, lack of personal traffic tools, and poor facilities for disaster prevention (Murakami et al., 2014). The urban service indicator can be used to represent the location of humanized facilities with a barrier-free design. That is because openness, fairness, and security are key factors in public service use. Furthermore, public service building complexes provide a high-density tsunami shelter area.
All study indicators were measured by summing the percentages of specific risk-effect areas (divided by the total area of each district sample), multiplied by the corresponding risk-level value of the risk map (Prasad, 2016). Using Eq. (1), we calculated both the hazard-product risk and the hazard-affected risk in each district sample by adding the standardized indicators (Yoo et al., 2011) that each contained.
In this expression, X represents the value from each indicator, Min represents the minimum value, and Max represents the maximum value of the data set.
Equations (2) and (3) assume that all indicators contributed evenly to the final risk value. This assumption provides significant flexibility with respect to the required input data and the practicability at a local level. An assumption of equal weight is preferred because of its easy comprehensively, replicability, and calculability (Prasad, 2016; Kontokosta and Malik, 2018). The tsunami hazard indicator was measured using the arithmetic mean of the inundation final depth indicator and inundation arrival time indicator. The sensitivity indicator was measured using the arithmetic mean of the building collapse indicator and urban service indicator.
3.4 Analytical techniques
First, we conducted a hot spot analysis (Getis-Ord Gi*) using ArcGis 10.2 to visualize the global spatial distribution rule of the hazard-product risk and the hazard-affected risk in Nagoya. A hot spot analysis is used to identify both high-value (hot point) and low-value (cold point) spatial clustering with statistical significance. The analysis outcome shows that high-value areas are surrounded by high values. The reverse is also true: low-value areas are surrounded by low values. Therefore, a hot spot analysis can also visualize the spatial distribution of the risk levels separately for the hazard-product risk and hazard-affected risk.
After generating the spatial differentiation of both hazard-product risk and hazard-affected risk, we applied a two-way multivariate analysis of variance (MANOVA), using SPSS 23 for the accessibility analysis. This analysis checked the significance of the effects of the two factors in a multivariate factorial experiment with a two-way layout (Zhang and Xian, 2012) and tested the null hypothesis of equal mean vectors across all considered groups (Todorov and Filzmoser, 2010). We used this to estimate the difference in tsunami shelter accessibility between 2-D hazard risks and the differences between different levels in each dimensional hazard risk.
The choice of statistical approach was based on variable measurements. First, we set eight continuous accessibility variables as dependent variables. We also converted two hazard risk variables into a single two-category variable (with a high-risk group and a low-risk group) by dividing the sample at the mean value as the independent variable. Second, we confirmed that the data for analysis satisfied the following main conditions: (1) the variance of eight dependent variables in each group should be homogeneous. If the variances are not homogeneous, a significant difference as a result of MANOVA cannot be confirmed as originating from the effect of the independent variable or from the self-different variance within each group. (2) A linear correlation should exist between dependent variables. (3) Neither univariate outliers nor multivariate outliers are found. (4) Dependent variables follow the normal distribution. (5) No multicollinearity exists between dependent variables.
4.1 Spatial differentiation of hazard-product risk and hazard-affected risk
Hot spot analysis results showed that hazard-product risk and hazard-affected risk exhibited considerably different spatial distributions in the 165 school district samples of Nagoya. The results show that hazard-product risk is distributed in a relatively bipartite structure: offshore it shows high risk and inland it shows low risk. Both these risks occur in a planarly extended way, with a smooth interface between the two risk areas (see Fig. 4a and c). The figures show that the hazard-affected risk distribution can also be simplified into a bipartite structure. The high risk is along the fringe river (the Shonai River and the Tempaku River); the risk diminishes in a direction from offshore to the inland. In contrast, the low risk is along the central river (the Horikawa River), increasing from inland to offshore. Both risk directions extend in an axial way, and the interface between these two risk areas is wedge-shaped (see Fig. 4b and c).
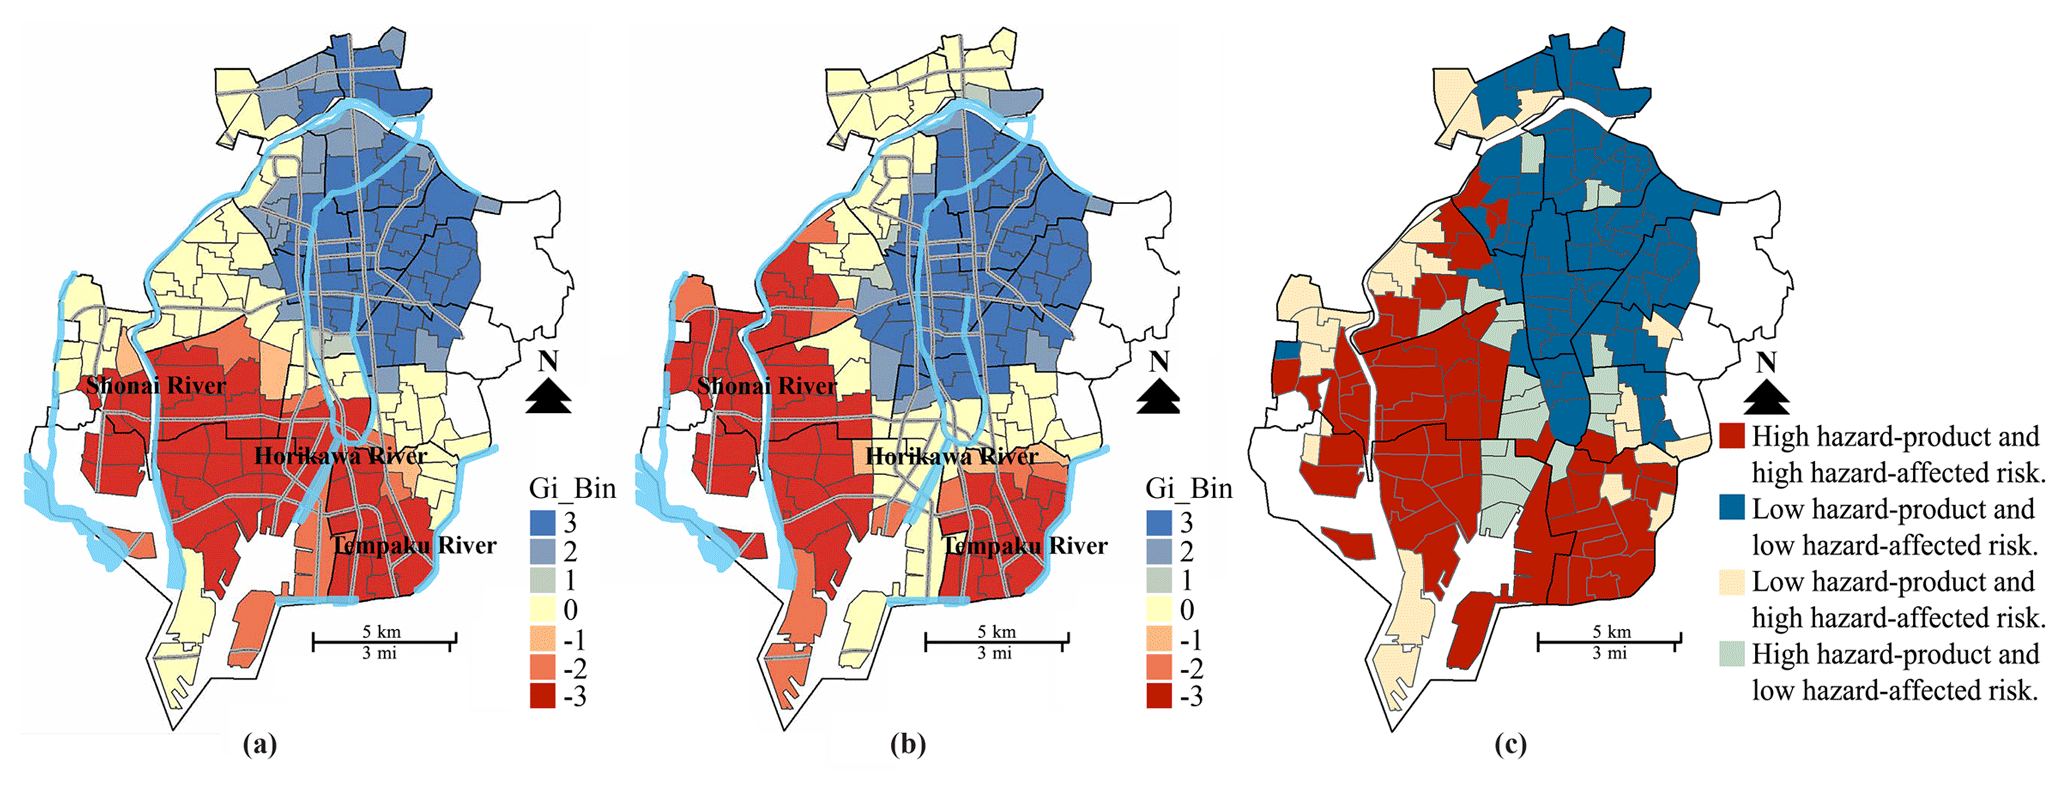
Figure 4Distribution of hazard risk: (a) hot spot analysis outcome of hazard-product risk; (b) hot spot analysis outcome of hazard-affected risk; (c) high hazard-product/hazard-affected risk and low hazard-product/hazard-affected risk are divided by the average of the hazard-product/hazard-affected value.
4.2 Tsunami shelter accessibility performance in hazard-product risk and hazard-affected risk
The multivariate test in MANOVA found that the reciprocal action between hazard-product risk and hazard-affected risk is statistically insignificant (see Table 4). This indicates that, in Nagoya, the shelter accessibility in a specific area with a specific hazard-affected risk will not significantly differ between high hazard-product risk and low hazard-product risk and vice versa. Moreover, this shows that accessibility indicators significantly differ between two groups of hazard-affected risk, but not for hazard-product risk. This, in turn, indicates that the tsunami shelter accessibility performance is significantly different due to the spatial differentiation between building and environment quality. It also significantly differs based on population characteristics and distribution, rather than based on the presence of tsunami, explosion, and fire hazard.
Table 4List of multivariate tests. Df stands for degrees of freedom.
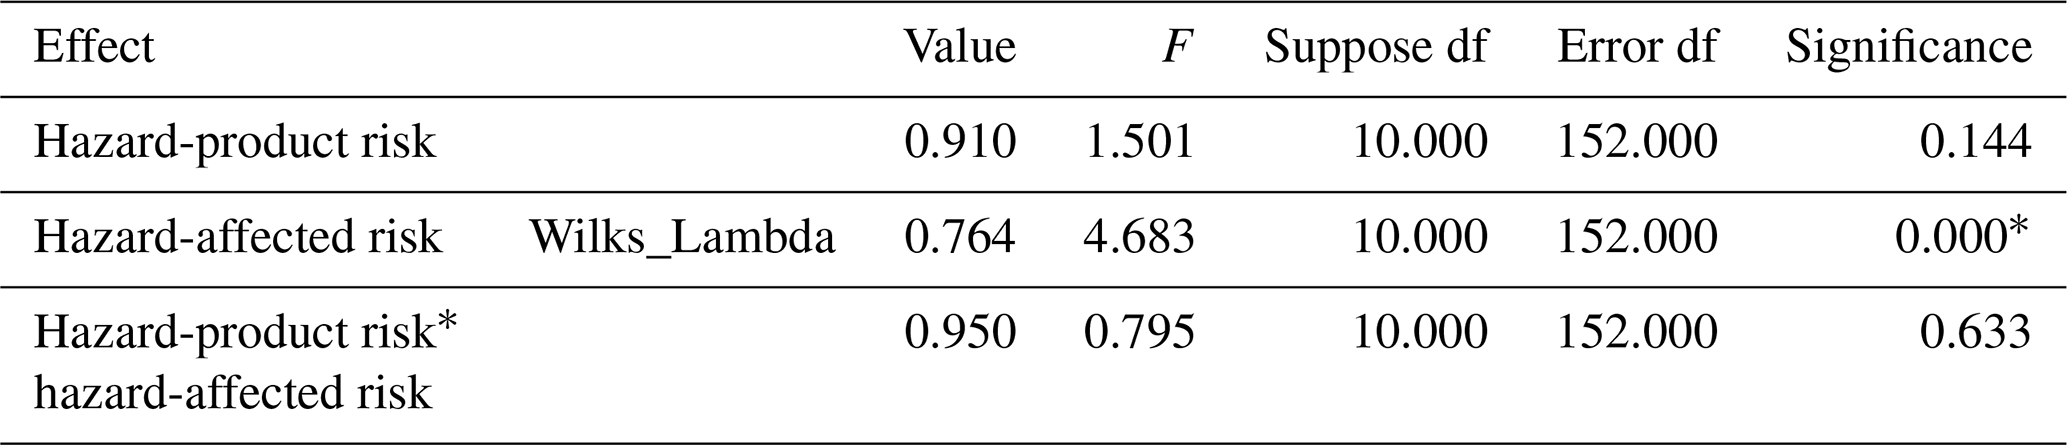
* The mean difference is significant at the 0.05 level.
The results of the intersubjectivity effect test indicate no significant reciprocal actions between hazard-product risk and hazard-affected risk for any of eight dependent variables. This allows us to directly analyze the main effect of each dimensional hazard-risk on the dependent variables (see Table 5). Under the hazard-product risk and for cross-region vehicle evacuations, results show that the distance from shelter to expressway is only significantly shorter in high-risk samples compared to low-risk samples. The differences in distance to the junction of an expressway are insignificant. This indicates that the accessibility that enables fast and mass transfers in a single-directed but not multiple-directed way is more advanced in high hazard-product risk areas. The insignificant difference between vehicle and pedestrian evacuation compared to on-site evacuations may indicate that on-site evacuation accessibility does not have a significant advantage in high hazard-product risk areas.
Table 5List of paired comparisons.
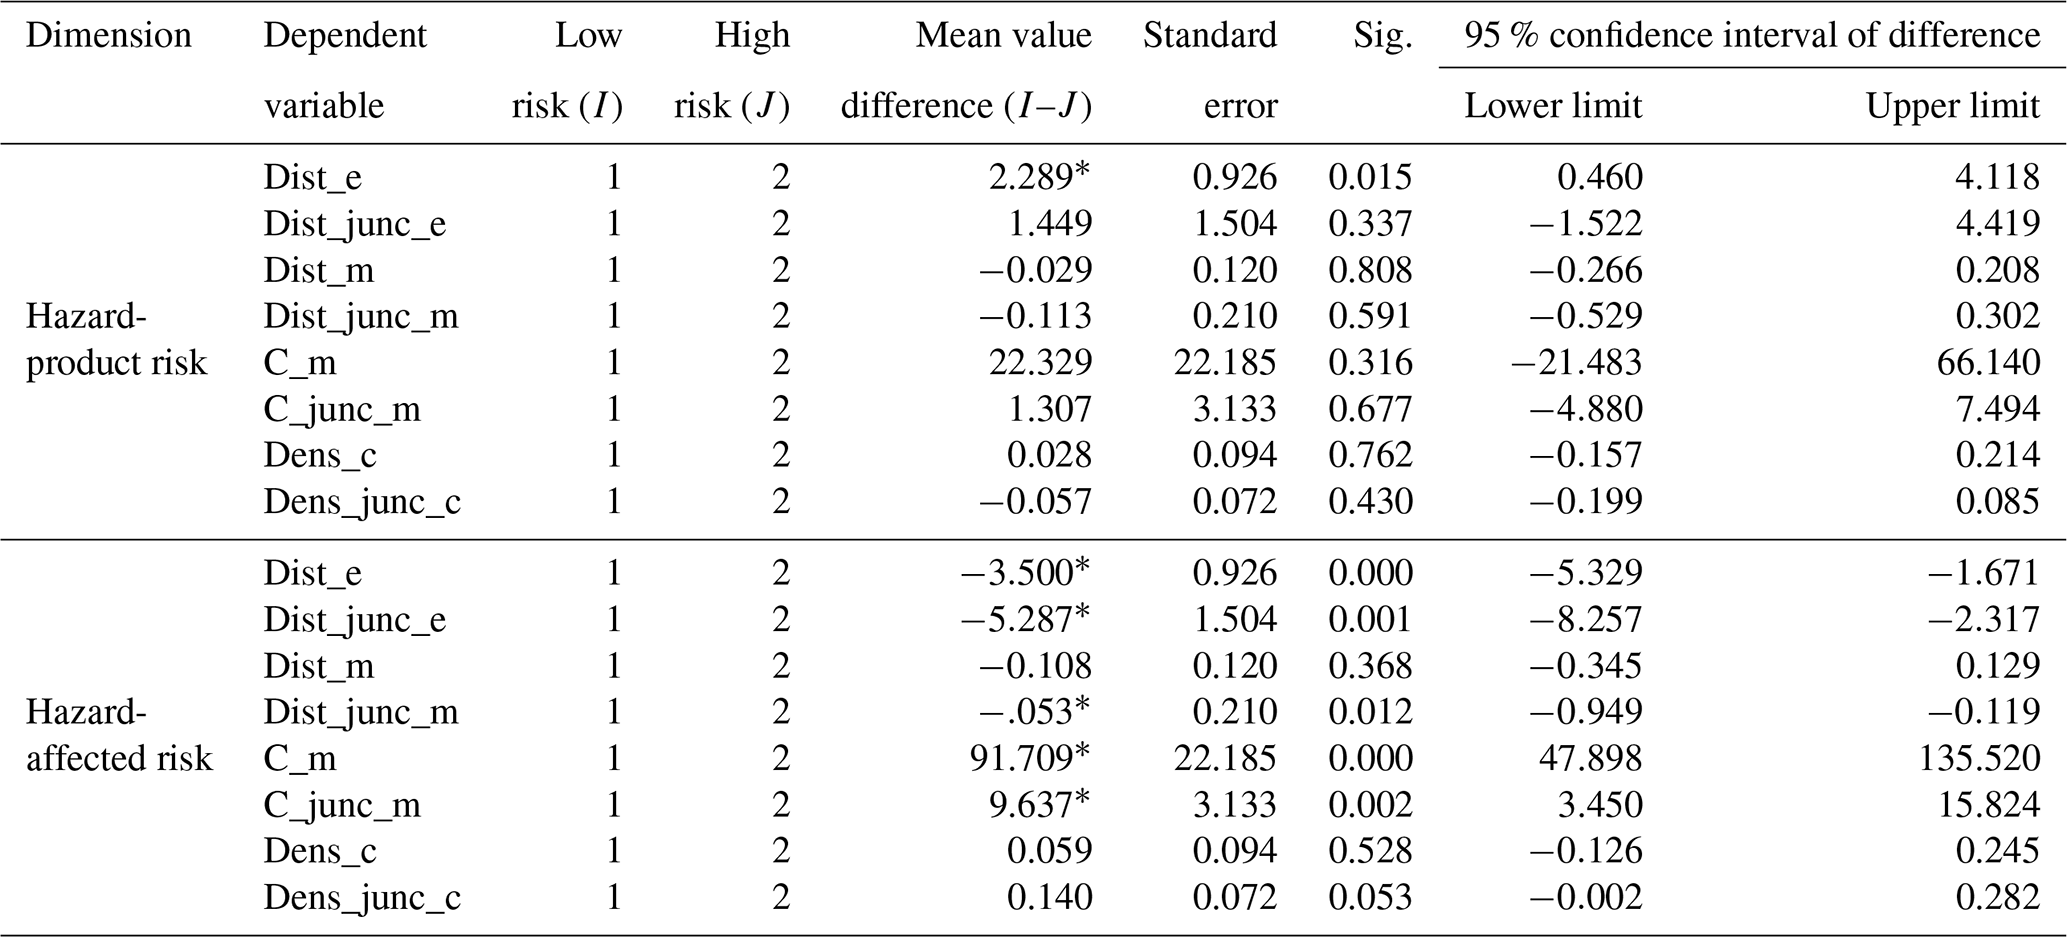
* The mean difference is significant at the 0.05 level.
Under the hazard-affected risk, with respect to cross-region vehicle evacuation, the distances from the shelter to the expressway and from the shelter to the junction of the expressway are both significantly longer in high-risk areas. This means there are fewer advanced traffic locations for shelters in cross-region evacuation. Similarly, in an on-site vehicle evacuation, the distance to the junction of a main road in high-risk areas is significantly longer. Furthermore, in on-site pedestrian evacuation, the road density and road-junction density are both similar when comparing high and low-risk samples. This indicates that all of the above aspects (including cross-region, on-site vehicle, and on-site pedestrian evacuation) provide a either a lower or equal advantage. However, both congestion indicators on the main-road scale are significantly lower in high-risk samples, as there is a lower possibility of congestion and other traffic accidents. This outcome indicates that on-site evacuations reduce traffic congestion in high hazard-affected risk areas.
5.1 The formulation of spatial differentiation of hazard-product risk and hazard-affected risk
This study of Nagoya suggests that, in a comprehensive coastal port city with the co-development of urbanization and industrialization, the distributions of hazard-product risk and hazard-affected risk exhibit significant differences.
For the hazard-product risk, the spatial bipartite structures with high risk offshore and low risk inland can be explained in three ways. First, high-risk areas are located offshore and in a large-scale area, because they lie in the sprawling tsunami inundation range. This is because most modern coastal port cities rely on accelerated seaward land reclamation (land that is only a few meters above sea level) to escape the spatial limitations of inland areas; however, this results in further and wider exposure to hydrologically disruptive events.
Second, the high risk extends inland, stemming from the highly developed port-driven industry along the shore of the city, broadly penetrating residential areas. Concentrated and specialized port-driven industries are consistently constructed in this area, creating imbalances in social and environmental systems. While this maximizes the advantages of harbors and low land prices, this move creates increased explosive hazards.
Third, the offshore area at the edge of the city, such as the southwest area of Nagoya, is a saturated delta alluvium deposit with a low bearing capacity. It can only be used as a natural foundation for low-rise and light-structure buildings. For example, wood construction, a traditional but popular construction approach in Japan, covers a large extent here, further intensifying the fire-risk exposure of this area.
In contrast, low hazard-product risk areas are distributed inland, removed from the coast. In these areas, living and service communities are mainly developed and are characterized by high elevations and solid soils.
For the hazard-affected risk, the spatial bipartite structure, with a high risk along a fringe river from offshore to inland and a low risk along the central river from inland to offshore mainly manifest risks with respect to environmental attributes. Rich water networks that fragment the land and flow seaward are very typical for coastal port cities. In general, waterfronts are resource-rich and socioeconomically diverse areas. However, port cities are the interface between metropolitan and industrial areas and accommodate a broad mix of different urban development phases (settlement, expansion, specialization, de-maritimization, redevelopment, and regionalization). This results in conflicting economic, social, and environmental values, leading to different management approaches and unbalanced resources. This conflict leads to very different practice construction conditions along rivers related to hazard-affected risk.
Therefore, the spatial bipartite structure of the hazard-affected risk can be explained in two ways. First, the areas along the fringe Shonai River and the Tempaku River from the Ise Bay to inland are older settlements, with lagging construction and neglected city renewal. This is because they lie in a soft and low alluvial plain, which experiences long-term erosion due to the river system and is located at the marginalization of urban growth. The area along the Horikawa River flowing across the city center to the professional port zone accumulates dense social capital and is constructed to high standards. This is because it forms the main axis of urban development, with location-specific river shipping and landscape advancements. These shipping and landscape advancements are accompanied by expressway and rail transits for city expansion and mass commuting/logistics.
5.2 The strategy of tsunami shelter accessibility in hazard-product risk and hazard-affected risk
Based on the spatial differences in hazard-product risk and hazard-affected risk in comprehensive coastal port cities, we recommend different strategies to improve tsunami shelter accessibility. These strategies would enhance the adaptive capacity of each dimensional hazard risk identified by this study of Nagoya.
In high hazard-product risk areas, and given the significant possibility of heavy inundation, dense explosion, and sprawl fire, tsunami shelter accessibility is enhanced through cross-region evacuation instead of through on-site evacuation. Specifically, the difference in distance between shelter and expressway is significant, while the difference in distance to the junctions of an expressway is not significant. This is because large populations in high hazard-product risk areas should evacuate immediately before tsunamis; they then should engage in secondary evacuations after hazards inland from the shoreline area, in a single and definite direction. This makes multiple-direction accessibility over long distances less important. This advanced accessibility performance in the cross-region evacuation of Nagoya is supported by the plan of using evacuation skeleton roads in response to a tsunami, as shown in the DPCDP (2015). These skeleton roads are either defined by existing expressways or by enhancing main roads and show a significant single-direction attribute.
In contrast, in high hazard-affected risk areas with poor-quality buildings, poor environmental conditions, vulnerable population aggregation, and the possibility of significant road damage, there is currently less capacity to develop fast and large-scale transfer mechanisms to more remote safe zones. There is a lower capacity to accommodate a massive number of evacuees from outer regions; however, we recommend increasing tsunami shelter accessibility through on-site evacuations instead of cross-region evacuation.
It is useful to further elaborate upon several details related to the accessibility performance of Nagoya, specifically in high hazard-affected risk areas. Firstly, the weak tsunami shelter accessibility, based on the distance to the expressway and its junctions, may result from lower requirements for cross-region evacuation. However, it can also be explained by the fact that expressways, which concentrate diverse socio-economic capital and enhance the vicinity's construction quality and urban function, are underrepresented in areas highly susceptible to hazards. Second, the significantly longer distance to the main road junctions in high-risk areas can also be explained by the lagging traffic: this is because main roads cannot form a perfect network. Third, the insignificant difference between road density and junction density may originate from the fact that many modern and old communities in Japan have been constructed using similarly scaled grid-network branch-road systems.
Above all, the lack of advantage in cross-regional and on-site evacuation in high hazard-affected risk areas originates from the reality-based situation in lagging areas of urban construction and development. They cannot be improved in the short term. However, the lower possibility of congestion and other traffic accidents can compensate for these disadvantages. This increases the adaptive capacity of tsunami shelters by reducing the traffic risk associated with vulnerable population activity. It also effectively limits roadblocks. This adds to the success of the land readjustment project in Nagoya. This project is designed to develop sound city areas out of undeveloped urban areas or areas scheduled for urbanization. This development is done by exchanging and transforming disorderly land into public roads and public service facilities. This project should be continued in the long term to improve the main road network and to extend to branch roads in high hazard-affected risk areas. This would improve tsunami shelter accessibility within safe traffic environments and walkable distances. This is particularly needed because of the low ability of the vulnerable population to evacuate over long distances during an emergency and in poor building environments.
5.3 Limitations and suggestions for future research
This study sorted and refined the population evacuation time–space routes for accessing tsunami shelters. It did not, however, study the rescue and logistical transportation provided by the governmental and public sectors. Future studies could explore multiple transportation activities involved in accessing tsunami shelters. This would provide recommendations related to accessibility that could be used by multiple stakeholders.
Moreover, the accessibility of the studied shelters is specific to the traffic location. This relates to both traffic tools and range. Future studies should apply both overall planning modeling and computer simulations to design shelter accessibility, using multi-object optimization separately for high hazard-product risk areas and high hazard-affected risk areas. Multiple objects could cover populations accommodated by the shelters, traffic costs, and evacuation time. These investigations could use the targeted accessibility strategies proposed in this study to as guidance.
Finally, the indicators that were used to evaluate the location-specific hazard risks in Nagoya form a simple evaluation system due to data shortages; however, the indicators used can still reflect the main aspects of hazard risk associated with evacuations in a tsunami scenario. Future studies could expand on these indicators to produce more detailed hazard-risk information in a multiple evaluation system with a reasonable weight assessment. This could include a sub-system of disaster process phases and disaster affected bodies to achieve a more accurate hazard risk evaluation. This exploration should be closely related to a specific evacuation or relief processes.
This Nagoya city case study shows that in comprehensive coastal port cities, the hazard-product risk and hazard-affected risk exhibit considerably different spatial distribution rules. Here, the hazard-product risk is distributed in a bipartite structure with high risk offshore and low risk inland. Both are manifested in a planarly extended way with a smooth interface. The hazard-affected risk is distributed in a different bipartite structure, with high risk along a fringe river from offshore to inland and low risk along a central river from inland to offshore. Both occur in an axially extended way and with a wedge-shaped interface.
Based on the spatial differentiation of 2-D hazard risk, we recommend different strategies for improving tsunami shelter accessibility, with the goal of enhancing adaptive capacity for each dimensional hazard risk. This Nagoya city case study shows that, in high hazard-product risk areas, tsunami shelter accessibility is enhanced by cross-region evacuations by increasing the proximity from shelters to regional expressways. This is a better alternative than requiring on-site evacuation. In contrast, in hazard-affected risk areas, it is recommended that tsunami shelter accessibility be increased through on-site evacuations while reducing the possibility of traffic congestion on city main roads and main road junctions. This is a better alternative than intensifying a cross-region evacuation. Tsunami shelter accessibility performance was positive with respect to the targeted adaptive capacity for different dimensional hazard risks in Nagoya. This may also provide indicators for other coastal port cities.
The research data in this manuscript are official, as are the public planning maps, current maps and related statistical data. Until now (April 2019) they can be accessed from the official website of Nagoya City, Japan. The list of research data sources are as follows:
-
Nagoya City government. The Nagoya City's Disaster Prevention City Development Plan, 2015. Accessed from the official website of Nagoya City, Japan: http://www.city.nagoya.jp/jutakutoshi/cmsfiles/contents/0000002/2717/honpen.pdf (last access: April 2019).
-
Nagoya City government. The Planning for Nagoya City, 2012, (including land use map). Accessed from the official website of Nagoya City, Japan: http://www.city.nagoya.jp/jutakutoshi/page/0000045893.html (last access: April 2019).
-
Nagoya City government. The statistical sketch of Nagoya City. Accessed from the official website of Nagoya City, Japan: http://www.city.nagoya.jp/shisei/category/67-5-0-0-0-0-0-0-0-0.html (last access: April 2019).
-
Nagoya City government. The Shelter Map, Accessed from the official website of Nagoya City, Japan: http://www.city.nagoya.jp/en/page/0000013879.html (last access: April 2019)
WZ and JW conceived the experiments. WZ designed the experiments, performed the experiments, analyzed the data, and wrote the paper. YY outlined the article structure.
The authors declare that they have no conflict of interest.
This study was funded by the Major Project of China National Social Science Fund (2013): Study on Comprehensive Disaster Prevention Measure and Safety Strategy of Coastal City Based on Intelligent Technology (13&ZD162). The authors thank the anonymous reviewers of this paper and the participants in the Study on Comprehensive Disaster Prevention Measure and Safety Strategy of Coastal City Based on Intelligent Technology for their ideas, input, and reviews.
This paper was edited by Maria Ana Baptista and reviewed by two anonymous referees.
Allan, P., Bryant, M., Wirsching, C., Garcia, D., and Teresarodriguez, M.: The influence of urban morphology on the resilience of cities following an earthquake, Journal of Urban Design, 18, 242–262, https://doi.org/10.1080/13574809.2013.772881, 2013.
Atwater, B. F., Musumi, S., Satake, K., Tsuji, Y., Ueda, K., and Yamaguchi, D. K.: The Orphan Tsunami of 1700: Japanese clues to a parent earthquake in North America, Environ. Hist., 11, 614–615, https://doi.org/10.1080/00207230600720134, 2006.
Balica, S. F., Wright, N. G., and Meulen, F. V.: A flood vulnerability index for coastal cities and its use in assessing climate change impacts, Nat. Hazards, 64, 73–105, https://doi.org/10.1007/s11069-012-0234-1, 2012.
Bottasso, A., Conti, M., Ferrari, C., and Tei, A.: Ports and Regional Development: A spatial analysis on a panel of European regions, Transport. Res. A-Pol., 65, 44–55, https://doi.org/10.1016/j.tra.2014.04.006, 2014.
Campos, V., Bandeira, R., and Bandeira, A.: A method for evacuation route planning in disaster situations, Procd. Soc. Behv., 54, 503–512, https://doi.org/10.1016/j.sbspro.2012.09.768, 2012.
Cerceau, J., Mat, N., Junqua, G., Lin, L., Laforest, V., and Gonzalez, C.: Implementing industrial ecology in port cities: International overview of case studies and cross-case analysis, J. Clean. Prod., 74, 1–16, https://doi.org/10.1016/j.jclepro.2014.03.050, 2014.
Chen, X., Kwan, M. P, Li, Q., and Chen, J.: A model for evacuation risk assessment with consideration of pre- and post-disaster factors, Comput. Environ. Urban., 36, 207–217, https://doi.org/10.1016/j.compenvurbsys.2011.11.002, 2012.
Chocl, G. and Butler, R.: Evacuation planning considerations of the city of Honolulu for a Great Aleutian Tsunami, Tenth U.S. National Conference on Earthquake Engineering Frontiers of Earthquake Engineering, Alaska, USA, July 2014, https://doi.org/10.4231/D3B56D51X, 2014.
Christou, M., Gyenes, Z., and Struckl, M.: Risk assessment in support to land-use planning in Europe: Towards more consistent decisions, J. Loss. Prevent. Proc., 24, 219–226, https://doi.org/10.1016/j.jlp.2010.10.001, 2011.
Cova, T. J. and Church, R. L.: Modeling community evacuation vulnerability using GIS, Int. J. Geogr. Inf. Sci., 11, 763–784, https://doi.org/10.1080/136588197242077, 1997.
Daamen, T. A. and Vries, I.: Governing the European port–city interface: Institutional impacts on spatial projects between city and port, J. Transp. Geogr., 27, 4–13, https://doi.org/10.1016/j.jtrangeo.2012.03.013, 2013.
Dai, S. Z.: Comprehensive urban disaster prevention planning, 2nd ed., Chapter 1, China Architecture and Building Press, Beijing, 2015.
Dall'Osso, F. and Dominey-Howes, D.: Public assessment of the usefulness of “draft” tsunami evacuation maps from Sydney, Australia – implications for the establishment of formal evacuation plans, Nat. Hazards Earth Syst. Sci., 10, 1739–1750, https://doi.org/10.5194/nhess-10-1739-2010, 2010.
Desouza, K. C. and Flanery, T. H.: Designing, planning, and managing resilient cities: A conceptual framework, Cities, 35, 89–99, https://doi.org/10.1016/j.cities.2013.06.003, 2013.
Disaster Prevention Plan of Tokyo Port Area 2016: http://www.city.minato.tokyo.jp/, last access: 1 January 2018.
Faruk, M., Ashraf, S. A., and Ferdaus, M.: An analysis of inclusiveness and accessibility of Cyclone Shelters, Bangladesh, 7th International Conference on Building Resilience: Using scientific knowledge to inform policy and practice in disaster risk reduction, Bangkok, Thailand, November 2017, https://doi.org/10.1016/j.proeng.2018.01.142, 2017.
Felsenstein, D. and Lichter, M.: Land use change and management of coastal areas: Retrospect and prospect, Ocean Coast. Manage., 101, 123–125, https://doi.org/10.1016/j.ocecoaman.2014.09.013, 2014.
Frazier, T. G., Wood, N., Yarnal, B., and Bauer, D. H.: Influence of potential sea level rise on societal vulnerability to hurricane storm-surge hazards, Sarasota County, Florida, Appl. Geogr., 30, 490–505, https://doi.org/10.1016/j.apgeog.2010.05.005, 2010.
Glavovic, B. C., Saunders, W. S. A., and Becker, J. S.: Land-use planning for natural hazards in New Zealand: The setting, barriers, “burning issues” and priority actions, Nat. Hazards, 54, 679–706, https://doi.org/10.1007/s11069-009-9494-9, 2010.
Goerigk, M., Deghdak, K., and Heßle, H.: A comprehensive evacuation planning model and genetic solution algorithm, Transport. Res. A-Pol., 71, 82–97, https://doi.org/10.1016/j.tre.2014.08.007, 2014.
Goseberg, N., Lammel, G., Taubenb, H., Setiadi, N., Birkmann, J., and Schlurmann, T.: Early warning for geological disasters, Advanced Technologies in Earth Sciences, Springer Publications, Berlin, Germany, 2014.
Hossain, N.: Street as accessible open space network in earthquake recovery planning in unplanned urban areas, Asian Journal of Humanities and Social Sciences, 2, 103–115, 2014.
Huang, Y. F., Li, F. Y., Bai, X. M., and Cui, S. H.: Comparing vulnerability of coastal communities to land use change: Analytical framework and a case study in China, Environ. Sci. Policy, 23, 133–143, https://doi.org/10.1016/j.envsci.2012.06.017, 2012.
Islas, P. V. and Alves, S.: Open space and their attributes, uses and restorative qualities in an earthquake emergency scenario: The case of Concepción, Chile, Urban For. Urban Gree., 19, 56–67, https://doi.org/10.1016/j.ufug.2016.06.017, 2016.
Jabareen, Y.: Planning the resilient city: Concepts and strategies for coping with climate change and environmental risk, Cities, 31, 220–229, https://doi.org/10.1016/j.cities.2013.06.001, 2013.
Jayakody, R. R. J. C., Amarathunga, D., and Haigh, R.: Integration of disaster management strategies with planning and designing public open spaces, Procedia Engineer., 212, 954–961, https://doi.org/10.1016/j.proeng.2018.01.123, 2018.
Johnstone, W. M. and Lence, B. J.: Use of flood, loss, and evacuation models to assess exposure and improve a community tsunami response plan: Vancouver Island, Nat. Hazards Rev., 5, 162–171, https://doi.org/10.1061/(ASCE)NH.1527-6996.0000056, 2012.
Khalid, M. N. A. and Yusof, U. K.: Dynamic crowd evacuation approach for the emergency route planning problem: Application to case studies, Safety Sci., 102, 263–274, https://doi.org/10.1016/j.ssci.2017.10.024, 2018.
Kontokosta, C. E. and Malik, A.: The Resilience to Emergencies and Disasters Index: Applying big data to benchmark and validate neighborhood resilience capacity, Sustain. Cities Soc., 36, 272–285, https://doi.org/10.1016/j.scs.2017.10.025, 2018.
Kulshrestha, A., Lou, Y., and Yin, Y.: Pick-up locations and bus allocation for transit-based evacuation planning with demand uncertainty, J. Adv. Transport., 48, 721–733, https://doi.org/10.1002/atr.1221, 2014.
Lee, S. W., Song, D. W., and Ducruet, C.: A tale of Asia's world Ports: The spatial evolution in global hub port cities, J. Geoforum, 39, 372–385, https://doi.org/10.1016/j.geoforum.2007.07.010, 2008.
León, J. and March, A.: Urban morphology as a tool for supporting tsunami rapid resilience: A case study of Talcahuano, Chile, Habitat Int., 43, 250–262, https://doi.org/10.1016/j.habitatint.2014.04.006, 2014.
Mahendra, R. S., Mothanty, P. C., and Bisoyi, H.: Assessment and management of coastal multi-hazard vulnerability along the Cuddaloree Villupuram, east coast of India using geospatial techniques, Ocean Coast. Manage., 54, 302–311, https://doi.org/10.1016/j.ocecoaman.2010.12.008, 2011.
Mas, E., Adriano, B., Koshimura, S., Imamura, F., Kuroiwa, J. H., Yamazaki, F., Zavala, C., and Estrada, M.: Identifying evacuees' demand of tsunami shelters using agent based simulation, in: Tsunami events and lessons learned: Environmental and societal significance, advances in natural and technological hazards research, edited by: Kontar, Y. A., 347–358, Springer Science Business Media, Dordrecht, https://doi.org/10.1007/978-94-007-7269-4_19, 2014.
Mollah, A. K., Sadhukhan, S., Das, P., and Anis, M. Z.: A cost optimization model and solutions for shelter allocation and relief distribution in flood scenario, Int. J. Disast. Risk Re., 31, 1187–1198, https://doi.org/10.1016/j.ijdrr.2017.11.018, 2018.
Murakami, H., Yanagihara, S., Goto, Y., Mikami, T., Sato, S., and Wakihama, T.: Study on casualty and tsunami evacuation behavior in Ishinomaki City: Questionnaire survey for the 2011 Great East Japan Earthquake, Tenth U.S. National Conference on Earthquake Engineering Frontiers of Earthquake Engineering, July 2014, Alaska, USA, 2014.
Ng, A. K. Y., Ducruet, C., Jacobs, W., Monios, J., Notteboom, T., Rodrigue, J. P., Slack, B., Tam, K., and Wilmsmeier, G.: Port geography at the crossroads with human geography: Between flows and spaces, J. Transp. Geogr., 41, 84–96, https://doi.org/10.1016/j.jtrangeo.2014.08.012, 2014.
Ng, M. W., Park, J., and Waller, T.: Hybrid Bilevel Model for the optimal shelter assignment in emergency evacuations, Comput.-Aided Civ. Inf., 25, 547–556, https://doi.org/10.1111/j.1467-8667.2010.00669.x, 2010.
Prasad, S.: Assessing the need for evacuation assistance in the 100 year floodplain of South Florida, Appl. Geogr., 67, 67–76, https://doi.org/10.1016/j.apgeog.2015.12.005, 2016.
Preston, B. L., Yuen, E. J., and Westaway, R. M.: Putting vulnerability to climate change on the map: A review of approaches, benefits, and risks, Sustain. Sci., 6, 177–202, https://doi.org/10.1007/s11625-011-0129-1, 2011.
Rus, K., Kilar, V., and Koren, D.: Resilience assessment of complex urban systems to natural disasters: Anew literature review, Int. J. Disast. Risk Re., 31, 311–330, https://doi.org/10.1016/j.ijdrr.2018.05.015, 2018.
Saxena, S., Geethalakshmi, V., and Lakshmanan, A.: Development of habitation vulnerability assessment framework for coastal hazards: Cuddalore coast in Tamil Nadu, India a case study, Weather and Climate Extremes, 2, 48–57, https://doi.org/10.1016/j.wace.2013.10.001, 2013.
Scheer, S., Varela, V., and Eftychidis, G.: A generic framework for tsunami evacuation planning, Phys. Chem. Earth, 49, 79–91, https://doi.org/10.1016/j.pce.2011.12.001, 2012.
Shen, H., Li, M. Y., and Wang, J.: Study on emergency evacuation method of storm and flood disaster: A case study of Yuhuan County, Zhejiang Province, Geography and Geo-Information Science, 1, 123–126, 2016.
Solecki, W., Leichenko, R., and Obrien, K.: Climate change adaptation strategies and disaster risk reduction in cities: Connections, contentions, and synergies, Curr. Opin. Env. Sust., 3, 135–141, https://doi.org/10.1016/j.cosust.2011.03.001, 2011.
Stepanov, A. and Smith, J. M.: Multi-objective evacuation routing in transportation networks, Eur. J. Oper. Res., 198, 435–446, https://doi.org/10.1016/j.ejor.2008.08.025, 2009.
Suppasri, A., Shuto, N., Imamura, F., Koshimura, S., Mas, E., and Yalciner, A. C.: Lessons learned from the 2011 Great East Japan Tsunami: Performance of tsunami countermeasures, coastal buildings, and tsunami evacuation in Japan, Pure Appl. Geophys., 137, 993–1018, https://doi.org/10.1007/s00024-012-0511-7, 2013.
Taveau, J.: Risk assessment and land-use planning regulations in France following the AZF disaster, J. Loss Prevent. Proc., 23, 813–823, https://doi.org/10.1016/j.jlp.2010.04.003, 2010.
Thanvisitthpon, N.: Impacts of repetitive floods and satisfaction with flood relief efforts: A case study of the flood-prone districts in Thailand's Ayutthaya province, Climate Risk Management, 18, 15–20, https://doi.org/10.1016/j.crm.2017.08.005, 2017.
Todorov, V. and Filzmoser, P.: Robust statistic for the one-way MANOVA, Comput. Stat. Data An., 54, 37–48, https://doi.org/10.1016/j.csda.2009.08.015, 2010.
Wang, C., Ducruet, C., and Wang, W.: Port integration in China: temporal pathways, spatial patterns and dynamics, Chinese Geogr. Sci., 25, 612–628, https://doi.org/10.1007/s11769-015-0752-3, 2015.
Wegscheider, S., Post, J., Zosseder, K., Mück, M., Strunz, G., Riedlinger, T., Muhari, A., and Anwar, H. Z.: Generating tsunami risk knowledge at community level as a base for planning and implementation of risk reduction strategies, Nat. Hazards Earth Syst. Sci., 11, 249–258, https://doi.org/10.5194/nhess-11-249-2011, 2011.
Wamsler, C., Brink, E., and Rivera, C.: Planning for climate change in urban areas: From theory to practice, J. Clean. Prod., 50, 68–81, https://doi.org/10.1016/j.jclepro.2012.12.008, 2013.
Xu, L., He, Y., Huang, W., and Cui, S.: A multi-dimensional integrated approach to assess flood risks on a coastal city, induced by sea-level rise and storm tides, Environ. Res. Lett., 11, 1–12, https://doi.org/10.1088/1748-9326/11/1/014001, 2016.
Yang, S., Yu, Y., Ran, Y., Song, S. Deng, W., and Liu, S.: Construction life shelter of city: Emergency, disaster prevention and evacuee shelter planning of Chongqing City, City Planning Review, 7, 92–96, https://doi.org/10.1016/j.tre.2006.04.004, 2010.
Yoo, G., Hwang, J. H., and Choi, C.: Development and application of a methodology for vulnerability assessment of climate change in coastal cities, Ocean Coast. Manage., 54, 524–534, https://doi.org/10.1016/j.ocecoaman.2011.04.001, 2011.
Zhang, J. and Xiao, S.: A note on the modified two-way MANOVA tests, Statistics and Probability Letters, 82, 519–527, https://doi.org/10.1016/j.spl.2011.12.005, 2012.