the Creative Commons Attribution 4.0 License.
the Creative Commons Attribution 4.0 License.
 | 03 May 2019
Loss assessment of building and contents damage from the potential earthquake risk in Seoul, South Korea
Wooil Choi
Jae-Woo Park
Jinhwan Kim
After the 2016 Gyeongju earthquake and the 2017 Pohang earthquake struck the Korean peninsula, securing financial stability regarding earthquake risks has become an important issue in South Korea. Many domestic researchers are currently studying potential earthquake risk. However, empirical analyses and statistical approaches are ambiguous in the case of South Korea because no major earthquake has ever occurred on the Korean peninsula since the Korean Meteorological Agency started monitoring earthquakes in 1978. This study focuses on evaluating possible losses due to earthquake risk in Seoul, the capital of South Korea, by using a catastrophe model methodology integrated with GIS (Geographic Information Systems). Building information, such as structure and location, is taken from the building registration database and the replacement cost for buildings is obtained from insurance information. As the seismic design code in the KBC (Korea Building Code) is similar to the seismic design code of the UBC (Uniform Building Code), the damage functions provided by HAZUS-Multi-hazard (HAZUS-MH) are used to assess the damage state of each building in event of an earthquake. A total of 12 earthquake scenarios are evaluated by considering the distribution and characteristics of active fault zones on the Korean peninsula and damages, with total loss amounts are calculated for each of the scenarios. The results of this study show that loss amounts due to potential earthquakes are significantly lower than those of previous studies. The challenge of this study is to implement an earthquake response spectrum and to reflect the actual asset value of buildings in Seoul.
- Article
(14310 KB) -
Supplement
(57 KB) - BibTeX
- EndNote


On 15 November 2017, an earthquake of M 5.4 on the Richter scale hit the northern region near Pohang, located in the southeastern part of the Korean peninsula. Aside from the M 5.8 Gyeongju earthquake in 2016, it was the second strongest recorded earthquake in South Korea since monitoring began in 1978 (Fig. 1).
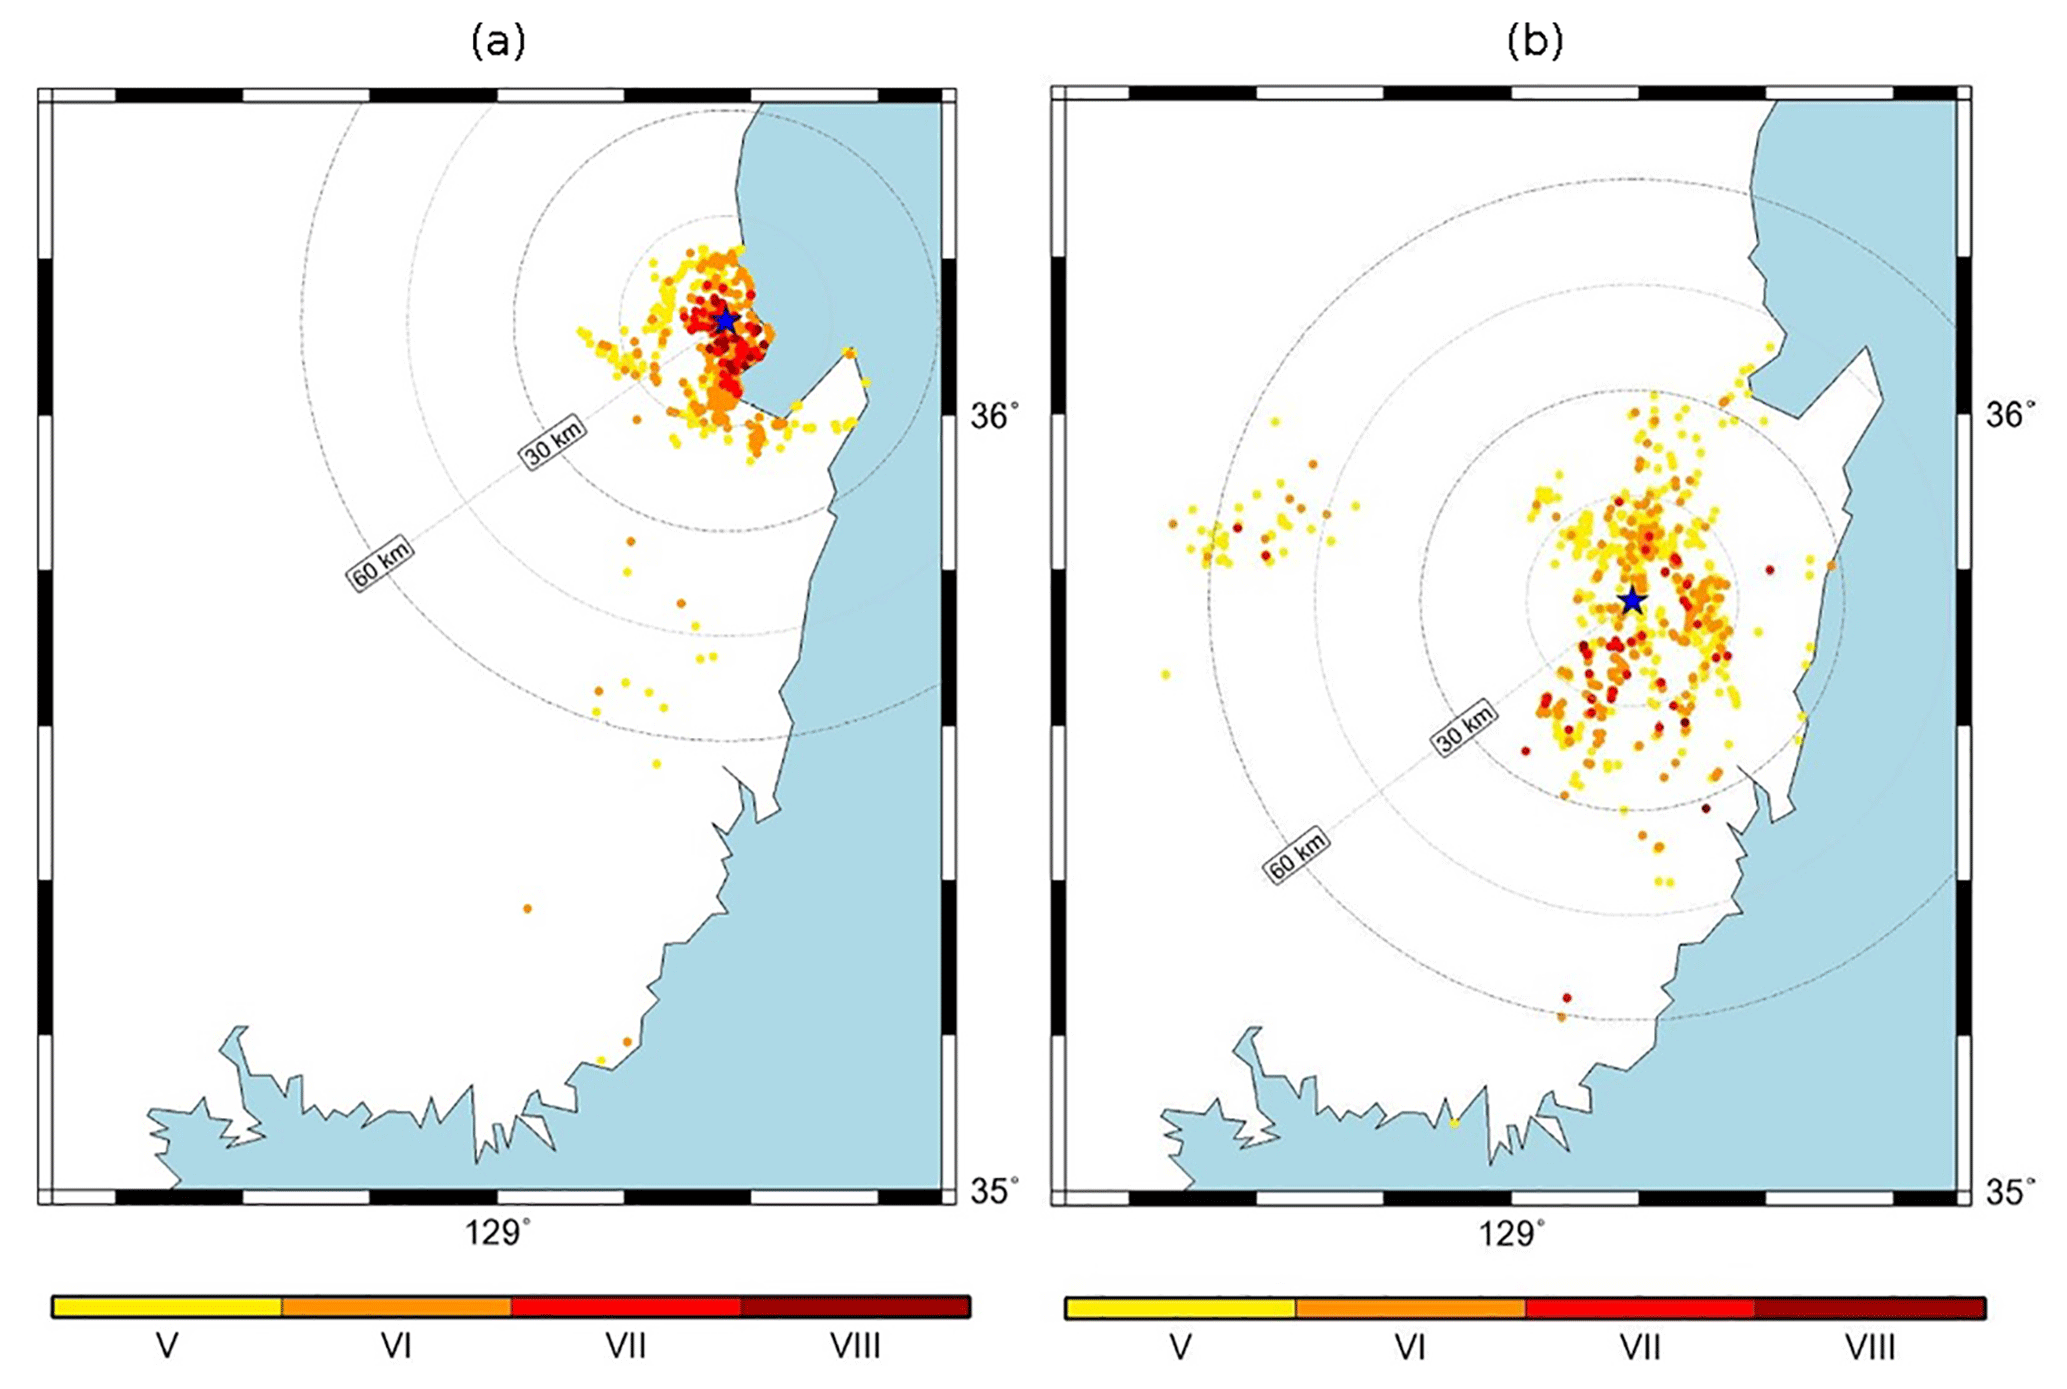
Figure 1Modified Mercalli Intensity (MMI) map of the Pohang earthquake (a) and Gyeongju earthquake (b). Source: Korean Meteorological Administration (2018).
The earthquakes that occurred in Gyeongju and Pohang were caused by the Yangsan fault zone, classified as an active fault, on the Korean Peninsula, which has the ability to generate earthquakes with a maximum intensity of M 7.0, according to Kyung (2010) and the South Korean Ministry of Public Safety and Security (MPSS, 2012). If an earthquake of M 6.0, similar to the Gyeongju and Pohang earthquakes, occurs in or near Seoul, where major industrial and commercial facilities are concentrated, huge losses, the likes of which have never been experienced in the past, may occur. The disaster risk financing industry, such as the insurance companies, could be subject to especially catastrophic damage. According to the Natural Disaster Reduction Project report prepared at the request of the South Korean Ministry of Public Safety and Security (2015), 2.76 million people may lose their lives, and USD 2848 billion of economic losses, including indirect loss such as business interruption, may occur if an earthquake of M 7.0 strikes Seoul (note that the losses in US dollars in this study are converted from the original Korean currency based on the exchange rate of USD 1≈ KRW 1200, as of 1 January 2016). However, as this report relies on the HAZUS-MH for most of the analysis data, such as the replacement cost of property and the seismic characteristics of the earthquake, the estimated result may differ from the actual damage loss amount in South Korea.
This study uses catastrophe model methodology to predict losses and damage to buildings and their contents from a potential earthquake that could occur in Seoul. This study differs from the previous studies in that it implements the actual building and insurance data and the observed seismic characteristics of South Korea. The detailed information of approximately 630 000 buildings across Seoul is acquired through the building registration database. The replacement cost of each building and its contents is statistically estimated by using an insurance database that is classified by occupancy to simulate the real situation in South Korea.
Predicting loss amount from a potential disaster using a catastrophe model differs from the actuarial approach model. While the actuarial technique estimates the loss based on empirical data, the catastrophe model generates disaster scenarios based on a scientific understanding of disasters and assesses the loss amount from an event scenario. For possible earthquakes in South Korea, it is appropriate to use the catastrophe model for predicting losses because empirical data from earthquakes on the Korean peninsula are too scarce to enable actuarial processing. The definition and procedure of the catastrophe model can marginally differ between researchers or suppliers, but the conventional procedure can be summarized as in Fig. 2.

As shown in Fig. 2, the catastrophe model has a four step process. (i) An information database of that property that may be exposed to disaster should be constructed. However, the exposure data sets in previous studies are typically available at relatively coarse resolutions because they are accompanied by difficulties related to limited resources or privacy issues, among others (Dell'Acqua et al., 2012; Figueiredo and Martina, 2016). In order to overcome these limitations, this study used the building registration database of South Korea to build an exposure data set. Detailed information of the building must be recorded, which is registered in the building registration database whenever the building is constructed or reconstructed according to the Building Act of South Korea. In this study, the detailed information needed to evaluate the vulnerability of all buildings in Seoul was extracted from the building registration database. The extracted data are classified into 36 structure types and 33 occupancies (the same as the building types of HAZUS-MH) and divided into three seismic codes estimated based on a comprehensive consideration of the construction year, total building area, and occupancy. The details of the classification of the 36 structure types and 33 occupancies are shown in Tables 1 and 2, respectively.
Table 1Model building types.
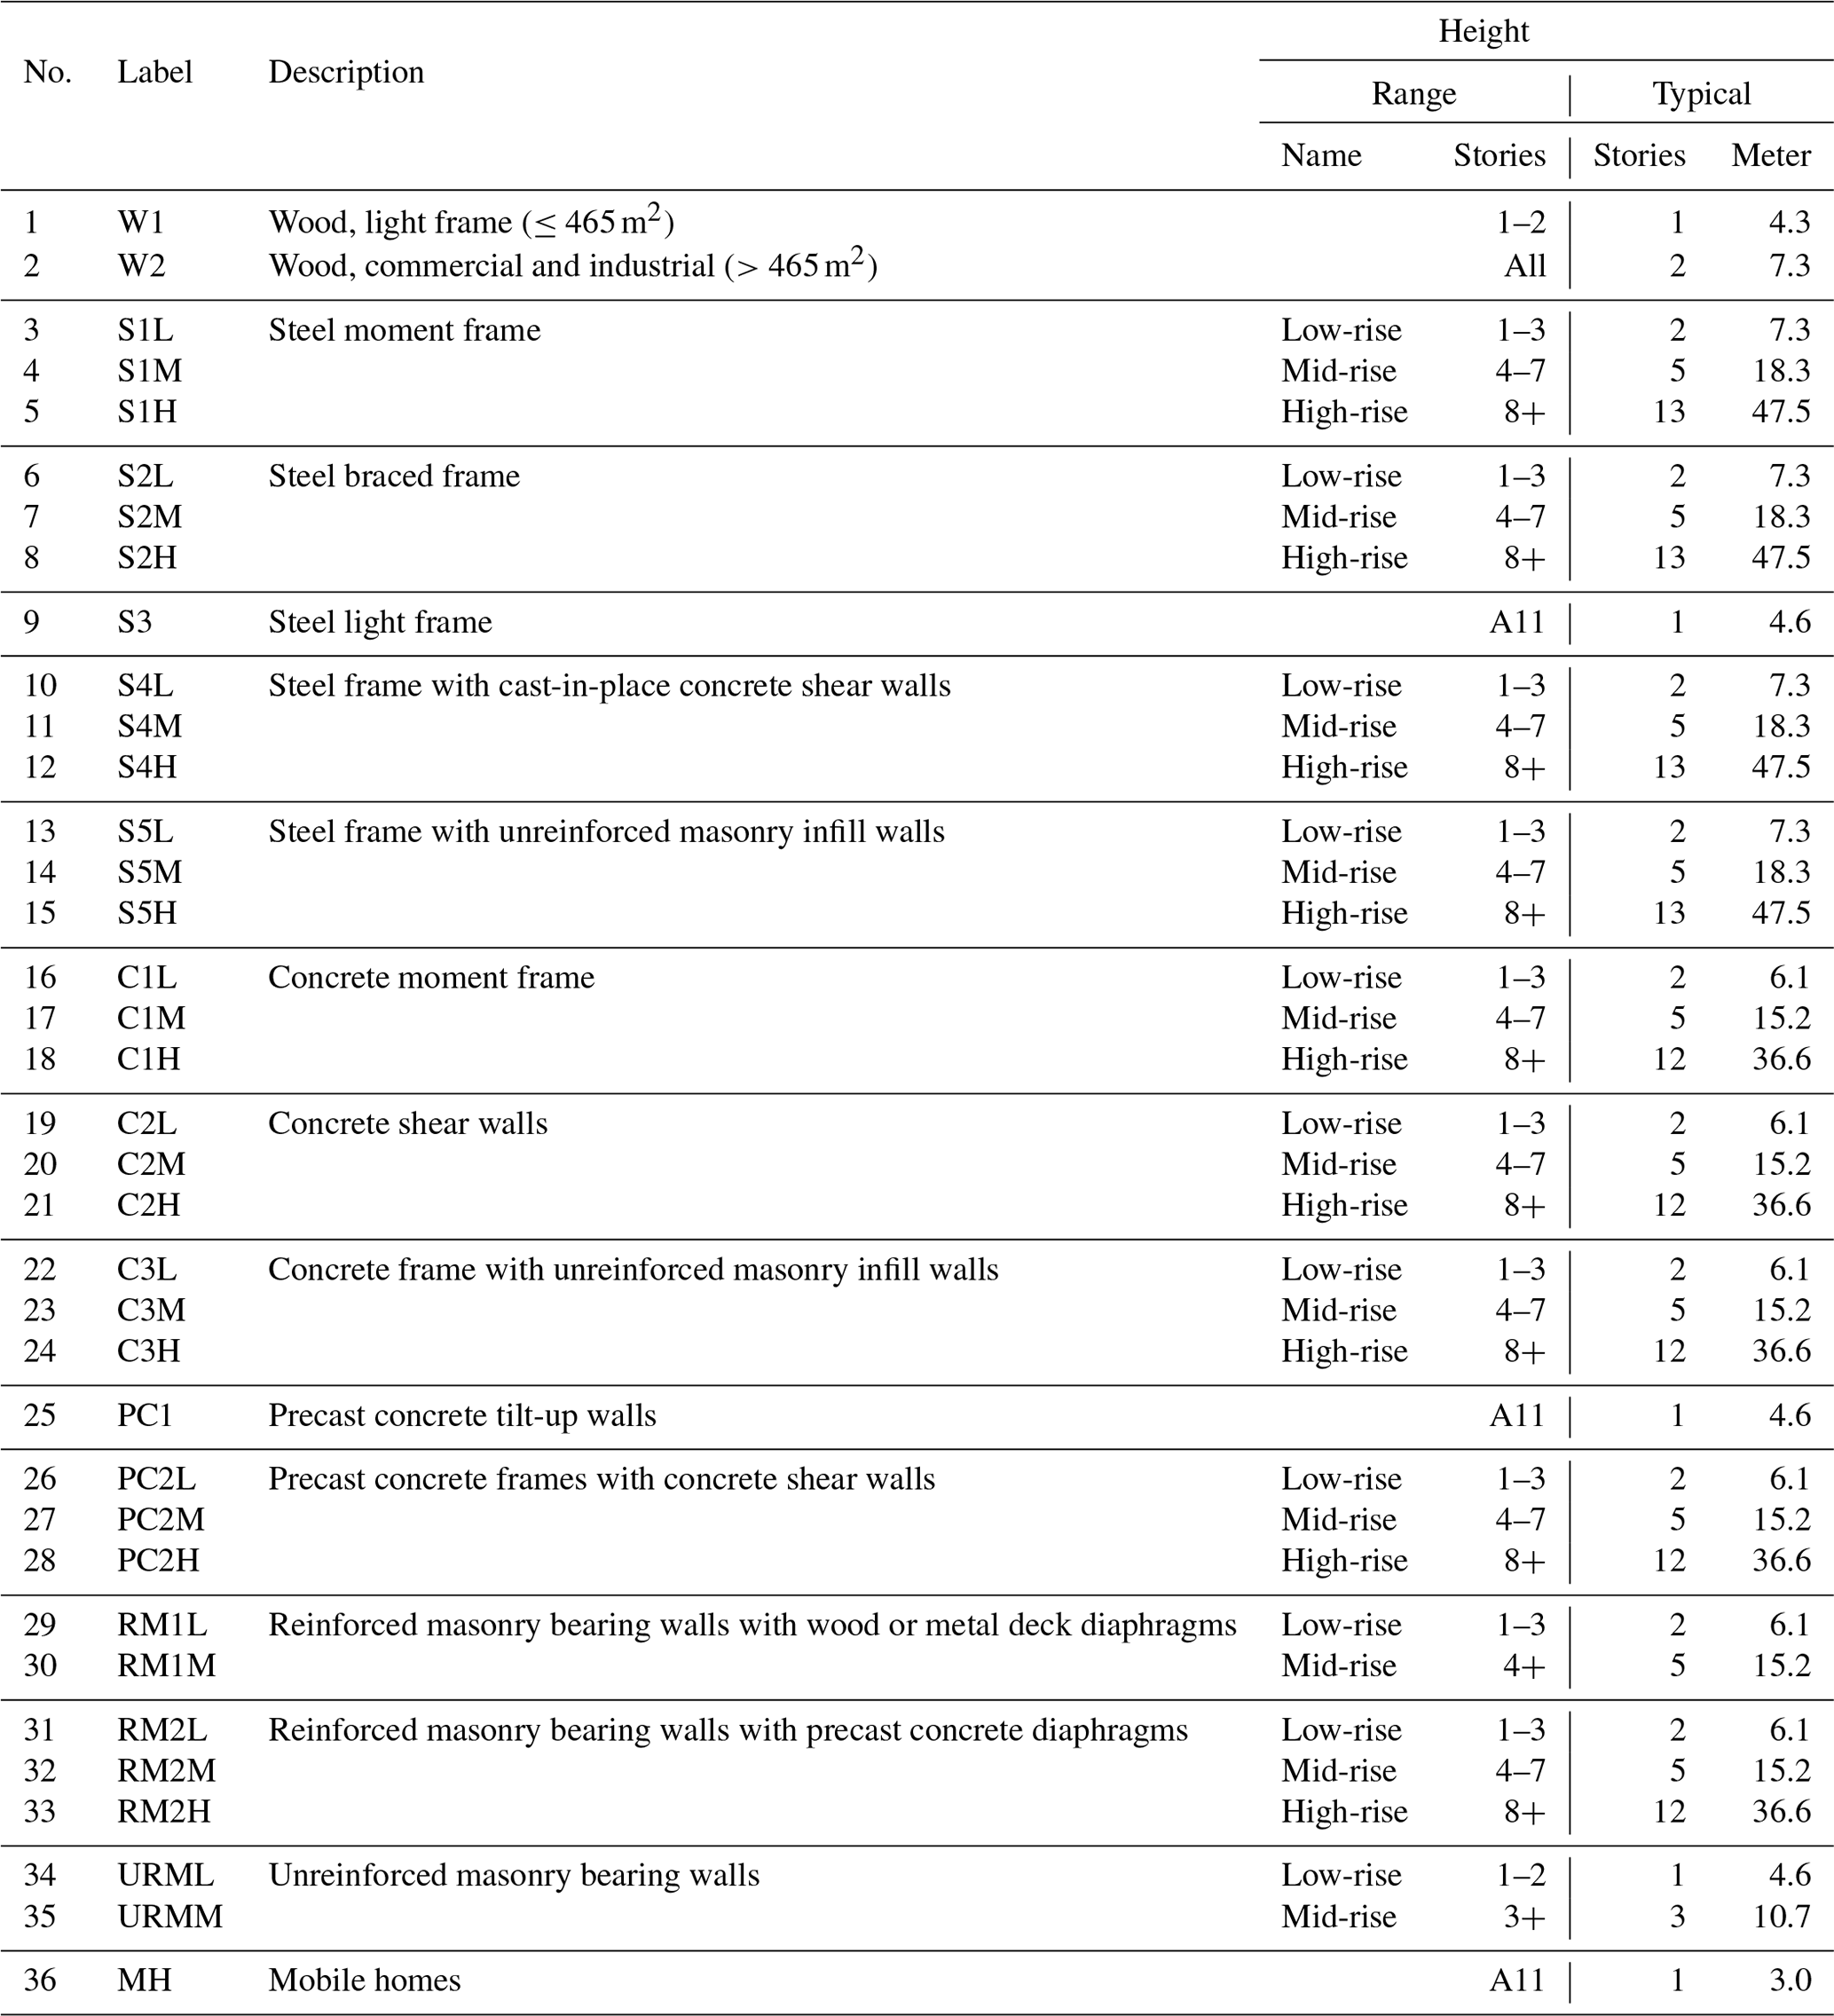
Source: Federal Emergency Management Agency (2013)
Table 2Building occupancy classes.
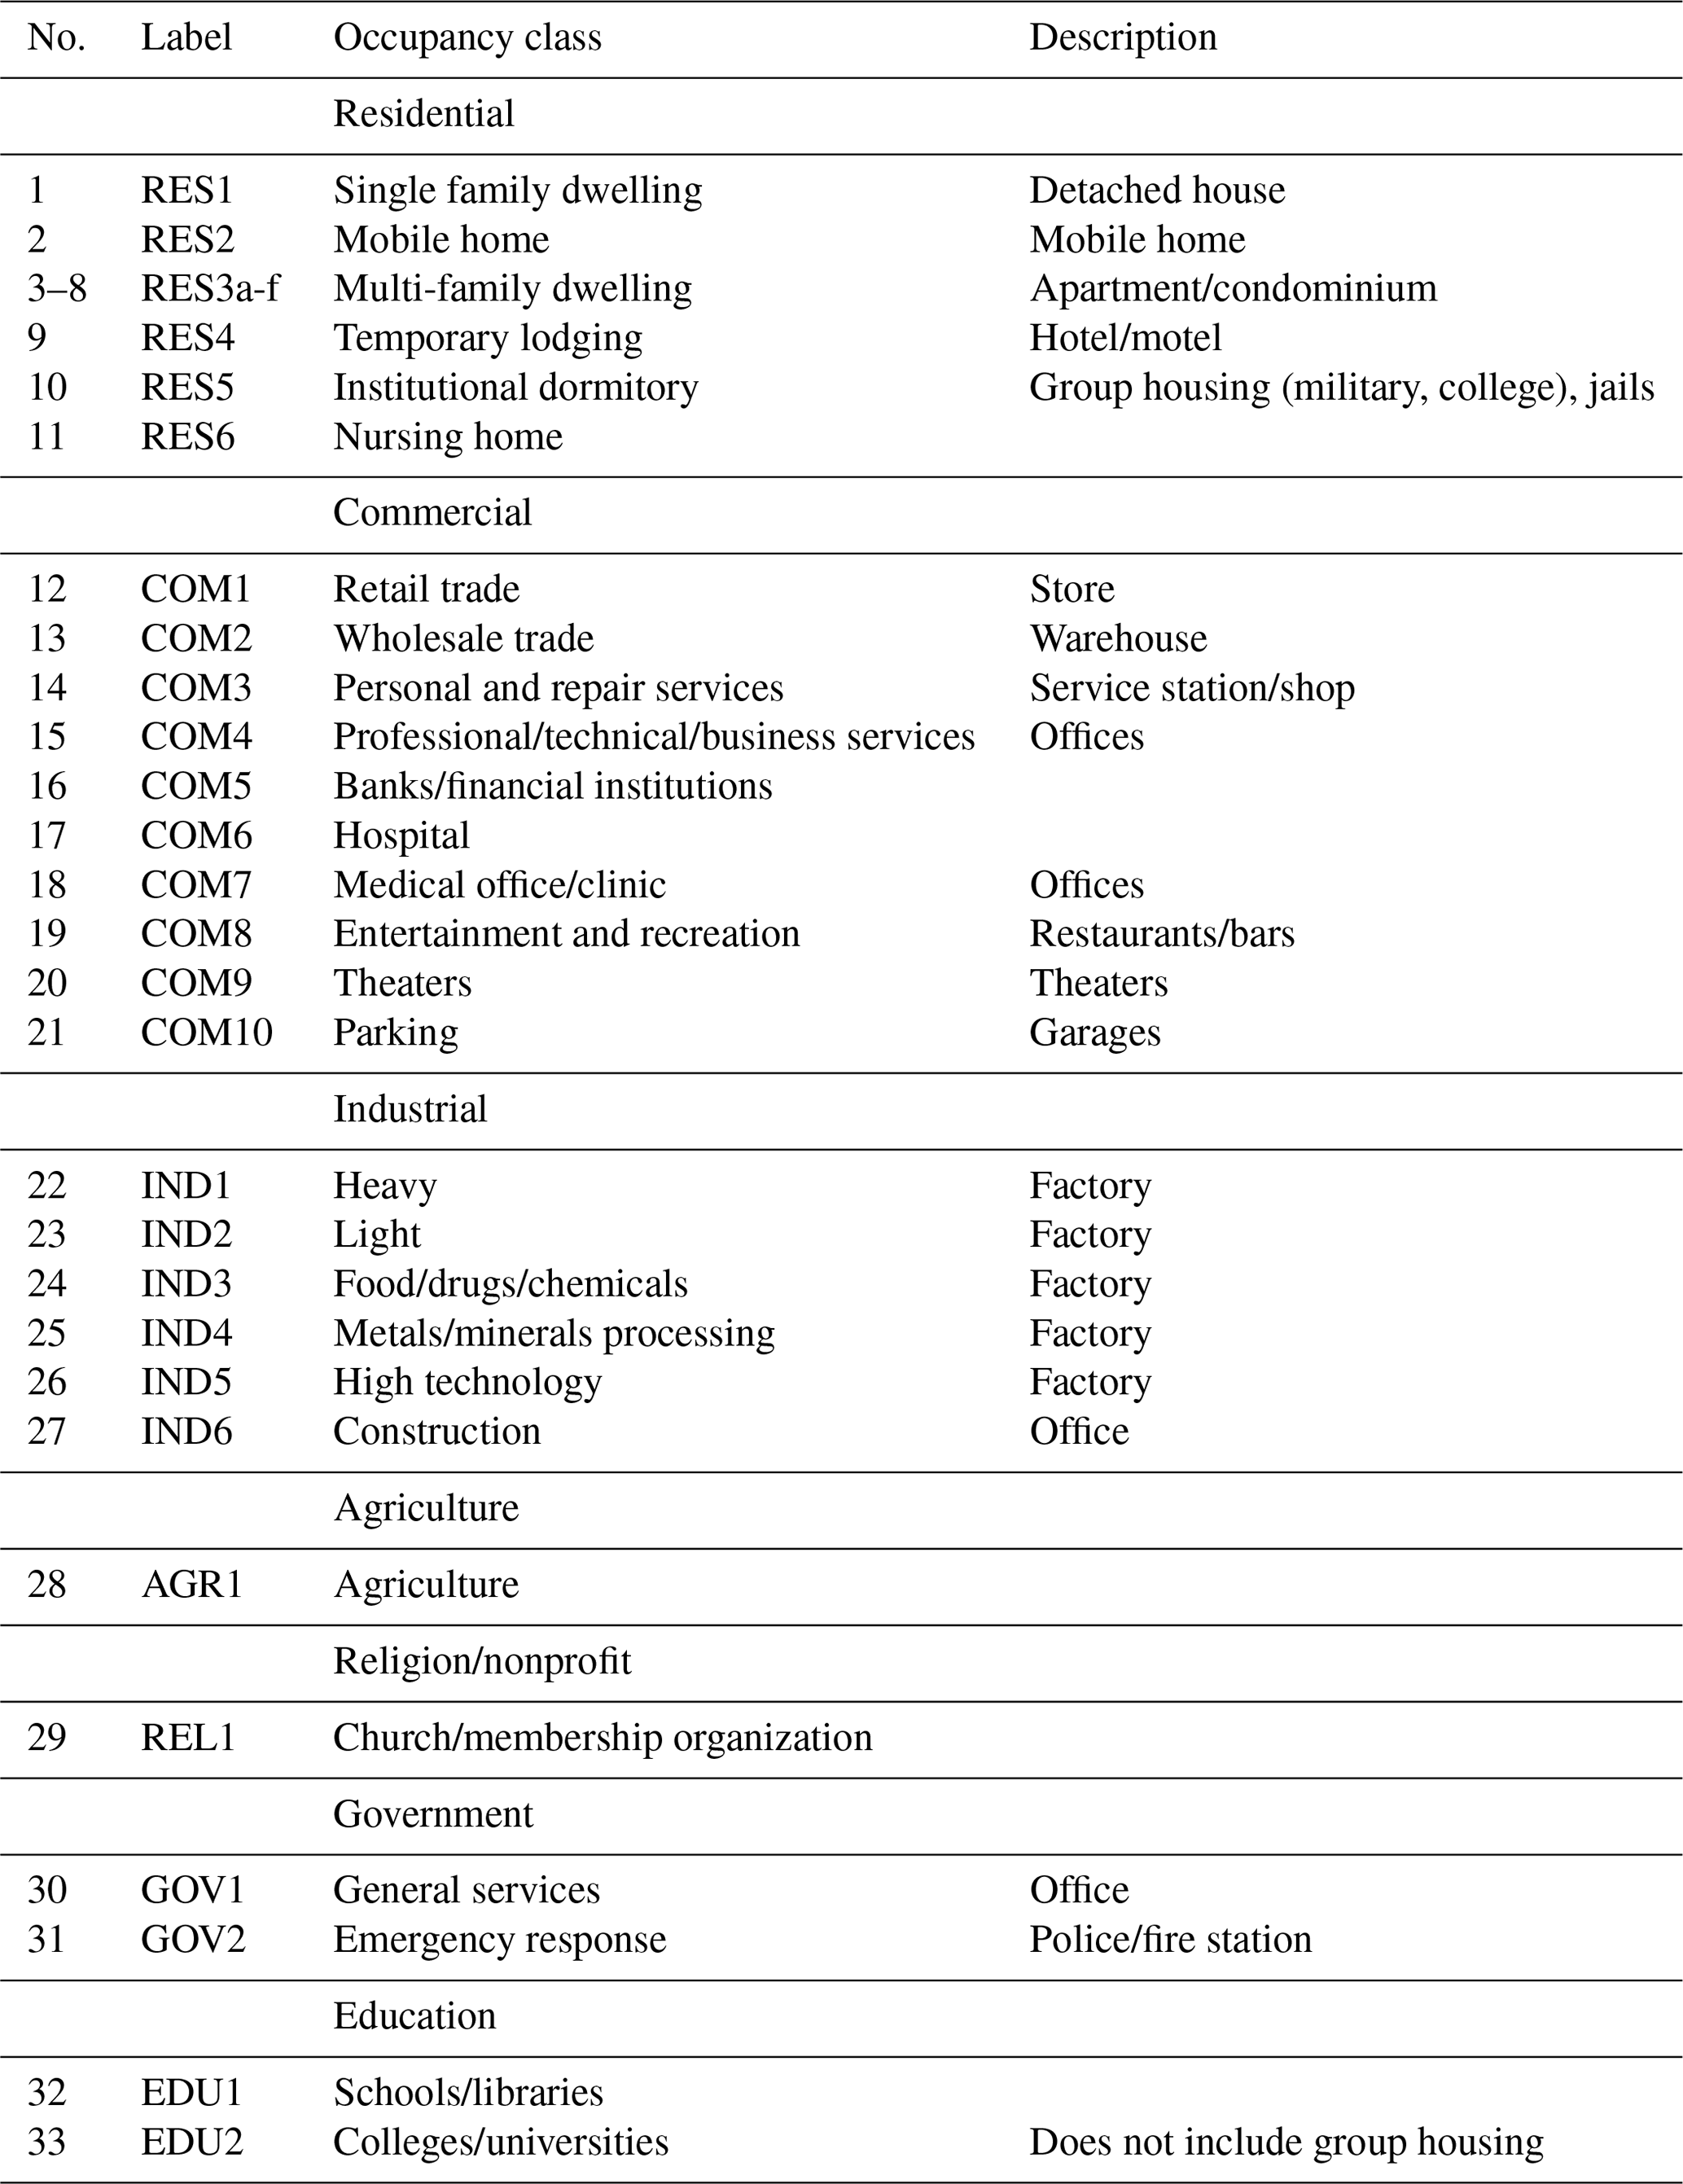
Source: Federal Emergency Management Agency (2013)
(ii) A hazard module for the generation of a physical hazard map from a simulated earthquake event should be developed. For example, the peak ground acceleration can be represented as hazard intensity in an earthquake hazard map. The seismic events are usually generated by stochastic methodologies, such as Monte Carlo simulation. However, it has been less than 40 years since earthquakes began to be monitored on the Korean Peninsula, and there was no large-scale earthquake in Seoul during the monitoring period. In this study, synthetic earthquakes were generated considering the activity of the active faults passing through Seoul, and the seismic-hazard map was prepared by selecting the attenuation relation that most closely resembles the Gyeongju earthquake and the Pohang earthquake from many attenuation relations that have been proposed by many Korean and international researchers.
(iii) A vulnerability module for assessing the damage state of individual properties should be prepared by combining the information of exposed property and hazard intensity. The probabilities of each damage state should be estimated from the spectral displacement of each building due to the seismic impact on the vulnerability module. The spectral displacement is determined by performance point, which is the intersection of the demand curve and the capacity spectrum.
(iv) The financial module is implemented to quantify the damage of individual buildings into a monetary loss to predict a total loss amount. In order to estimate the repair cost of a building due to a seismic impact, it is necessary to ascertain the replacement value or the current assets of the building calculated in cost mode. In this study, the values of building, contents, and inventories of the representative building in each category were estimated by statistical processing of the appraisal data for insuring property.
The detailed information of each building, such as location, structure, size, floor area, construction year, occupancy, and other minor considerations influencing the seismic response, is obtained from a computerized database of building registration records. There are presently about 630 000 buildings within Seoul city as of 2016, according to building registration records. These buildings are classified as residential (76 %), commercial (20.3 %), industrial (0.5 %), and other (3.2 %), which includes government and educational institution buildings. The residential category is dominated by masonry structures of fewer than five stories and concrete structures are dominant in the commercial category. A total of 82 % of the buildings in Seoul were built before 1988 when the seismic building code began being implemented. Table 3 summarizes the statistical characteristics of buildings in Seoul.
Table 3A summary of the statistical characteristics of buildings in Seoul.

The replacement costs for each building damaged by the earthquake and their contents are estimated based on statistical processing of 1500 records of asset evaluation data for property insurance and a construction cost table (Korea Appraisal Board, 2016). After processing, the total replacement cost of buildings and contents is estimated to be about USD 900 billion in Seoul, and approximately 72 % of buildings in Seoul were estimated to have a replacement cost of USD 0.1–1 million. The indirect costs and losses attributed to land, intangible assets, and business interruption are not considered in this study.
4.1 Scenario selection
In the circum-Pacific seismic zone, South Korea is considered safer and less prone to earthquakes compared to neighboring areas, such as Japan, China, and Taiwan. However, many domestic researchers insist that there are two representative active faults in South Korea. One of these, the Yangsan Fault, caused the Gyeongju earthquake. The second fault, Chugaryeong Fault, is centrally located on the Korean peninsula (Choi et al., 2012; South Korean Ministry of Public Safety and Security, 2012; Chung et al., 2014). The Chugaryeong Fault crosses the eastern side of Seoul and is believed to have caused the 2010 earthquake, with an intensity of M 3.0, in Seoul.
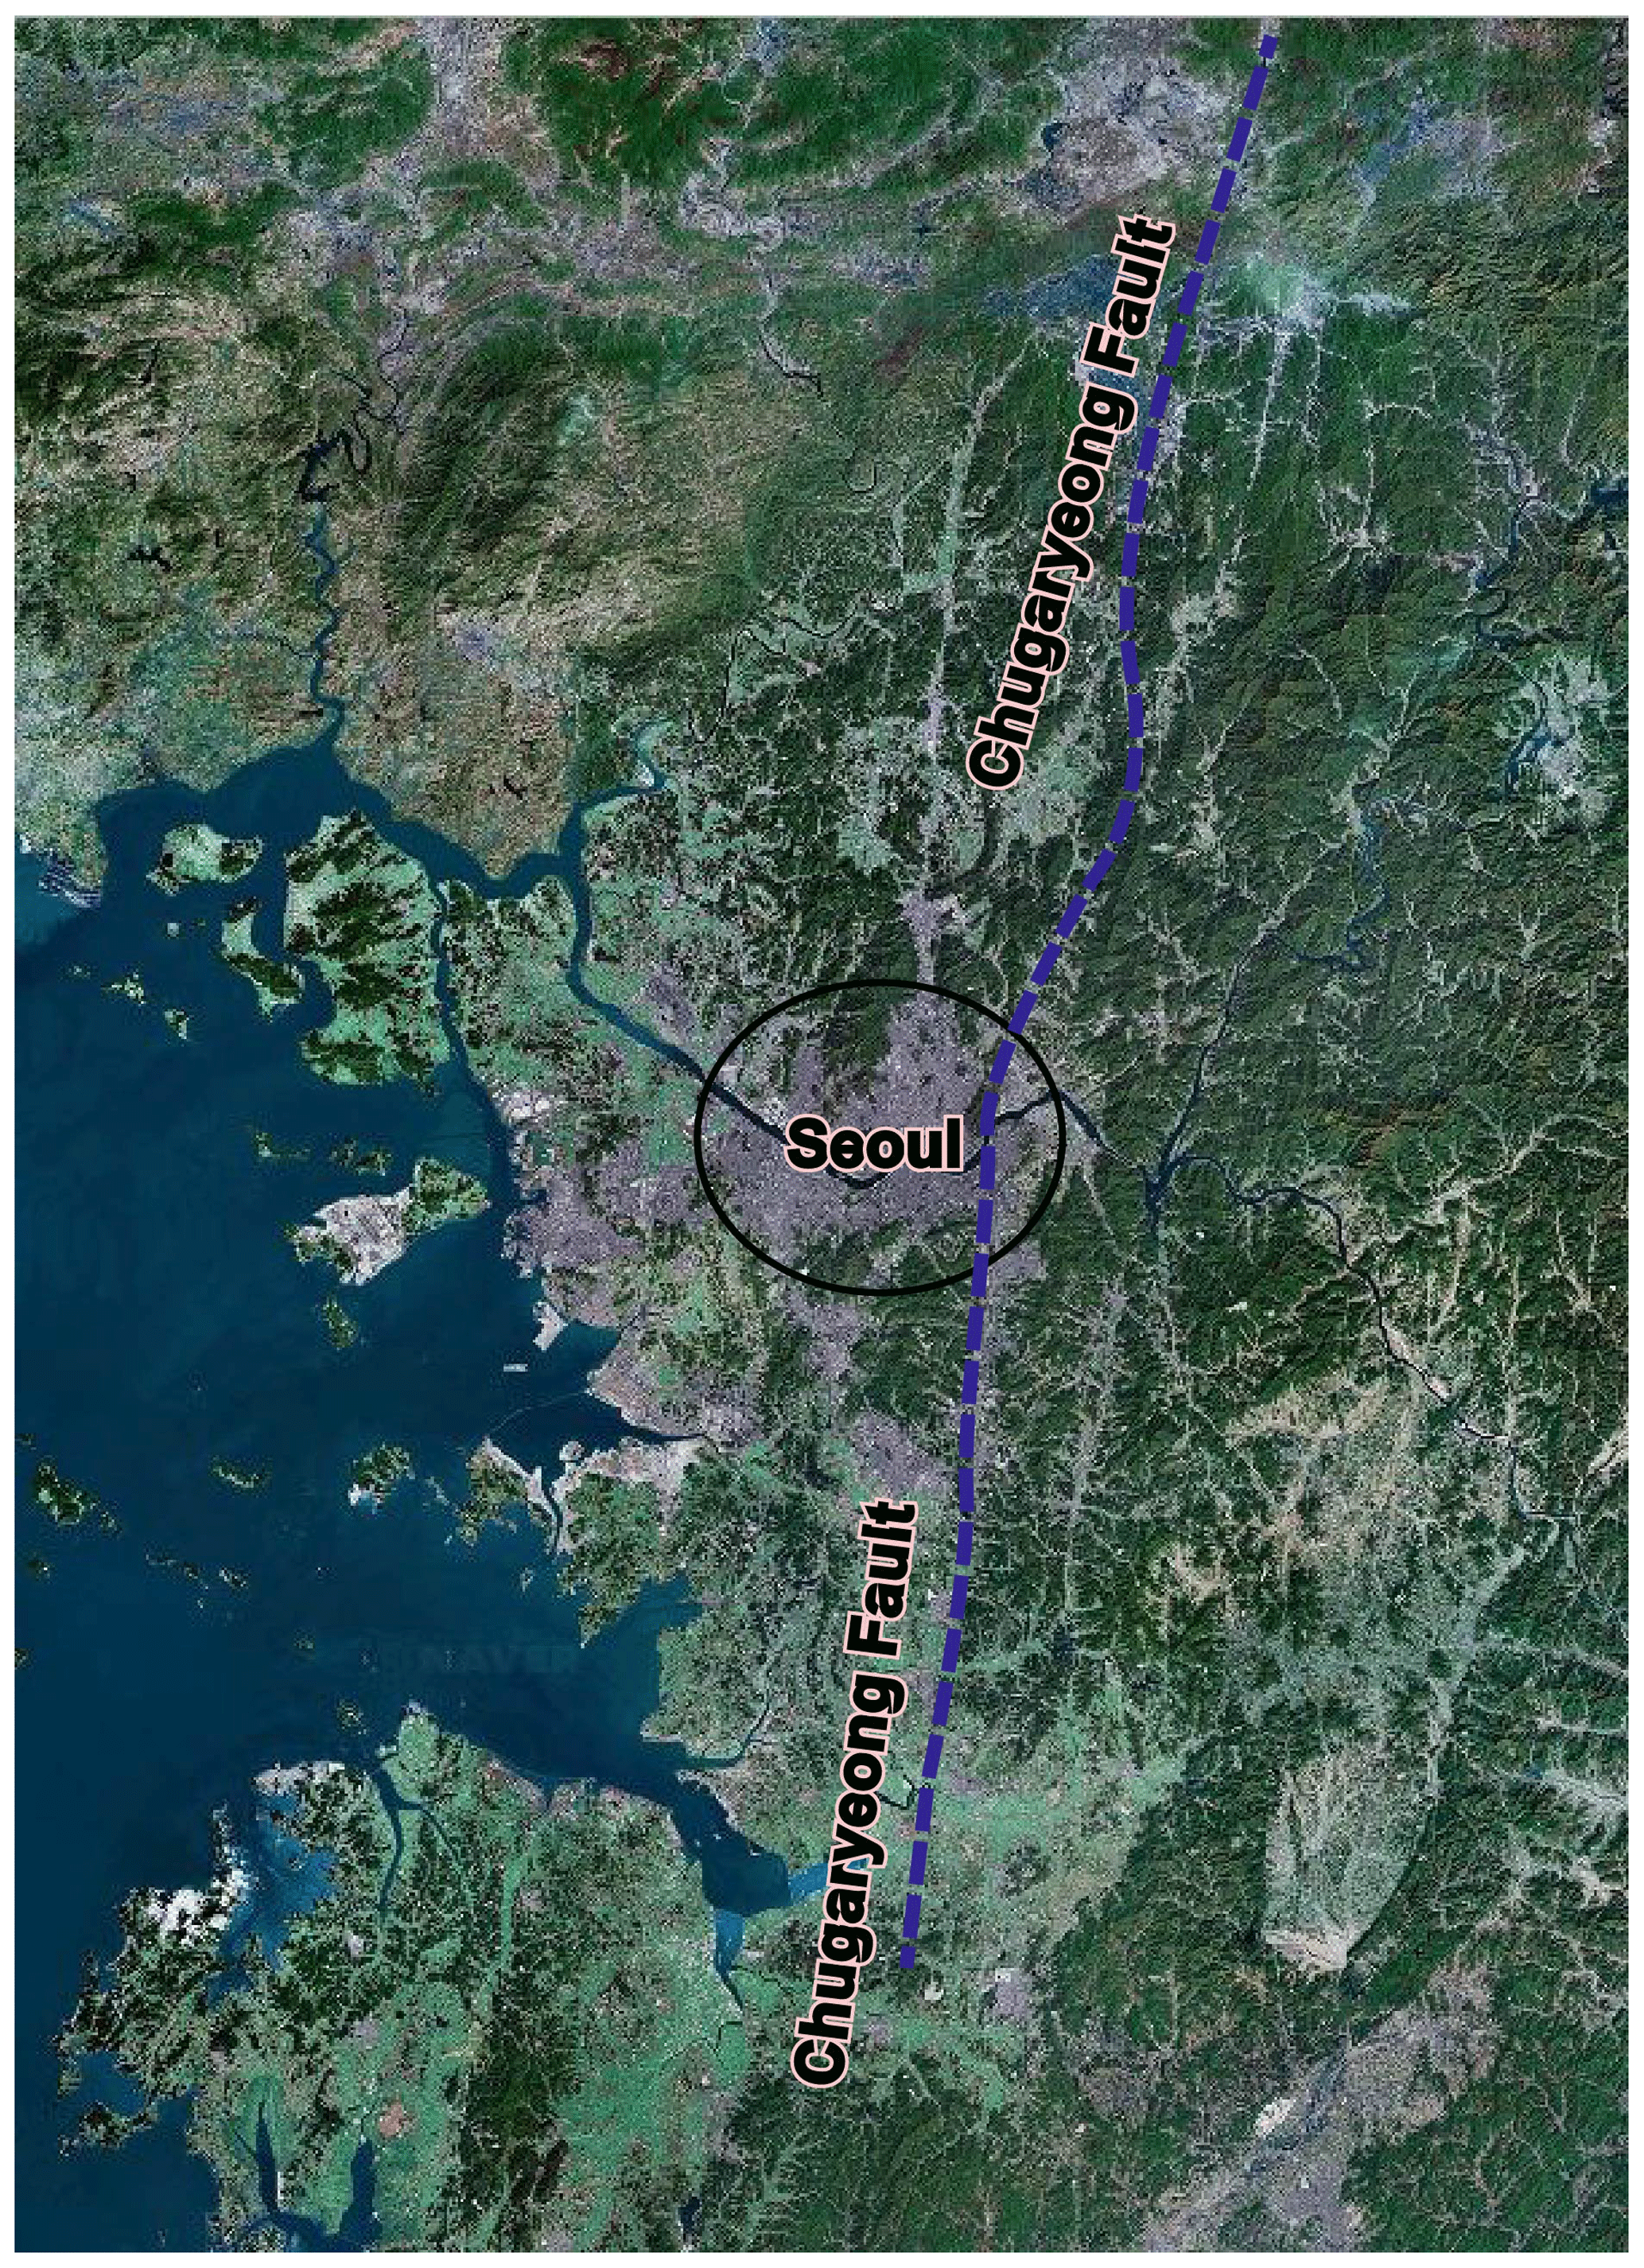
Figure 3Chugaryeong fault zone in the middle of the Korean peninsula. Source: Modified from Chung et al. (2014).
The Chugaryeong Fault has similar activity to Yangsan Fault, which has the capacity to cause an earthquake of M 7.0. Most earthquakes in South Korea occur, or are likely to occur, at a focal depth of about 10 km (Lee, 2010; South Korean Ministry of Public Safety and Security, 2012). Based on this, earthquakes of M 4.0 to 7.0 occurring at focal depths of 10 to 20 km to the southeast of Seoul, due to activity of the Chugaryeong Fault are selected as event scenarios for this study. The Richter magnitude scale (ML) is a unit based on logarithms calculated from the largest amplitude observed on the seismometer, but it is difficult to measure the amplitude accurately. In this study, the moment magnitude scale (Mw) is used, which was suggested by the United States Geological Survey (USGS) to calculate and report magnitudes for large earthquakes.
4.2 Construction of hazard map and response spectrum
To construct each hazard map from each earthquake event scenario, it is important to understand the attenuation relationship of ground motions from epicentral distance. The ground motion can be characterized by peak ground acceleration (PGA) and spectral responses based on a response spectrum shape.
A lot of experimental attenuation formulas for estimating PGA have been developed by means of regression analysis (Atkinson and Boore, 1997; Toro et al., 1997; Atkinson and Silva, 2000; Lee and Kim, 2002; South Korean Ministry of Public Safety and Security, 2012). However, in choosing the attenuation formula, a careful approach is needed since the impact of the formula on the estimated amount of earthquake loss is very large. The South Korean Ministry of Public Safety and Security (2012) proposed three attenuation formulas for the Korean Peninsula, which are expressed following Eq. (1). The attenuation equation (Eq. 1) proposed by the South Korean Ministry of Public Safety and Security (2012) is used in this study. The attenuation formula of the MPSS requires four coefficients (or fitting parameters). In this study, the four coefficients in Eq. (1) of C0=5.0244, C1=0.5442, .0020, and C3=0 are assumed in the analysis to be the combination of the coefficients that resulted in the least error in the prediction of maximum ground acceleration.
where S is PGA, Mw is the moment magnitude of earthquake and R is the epicentral distance.
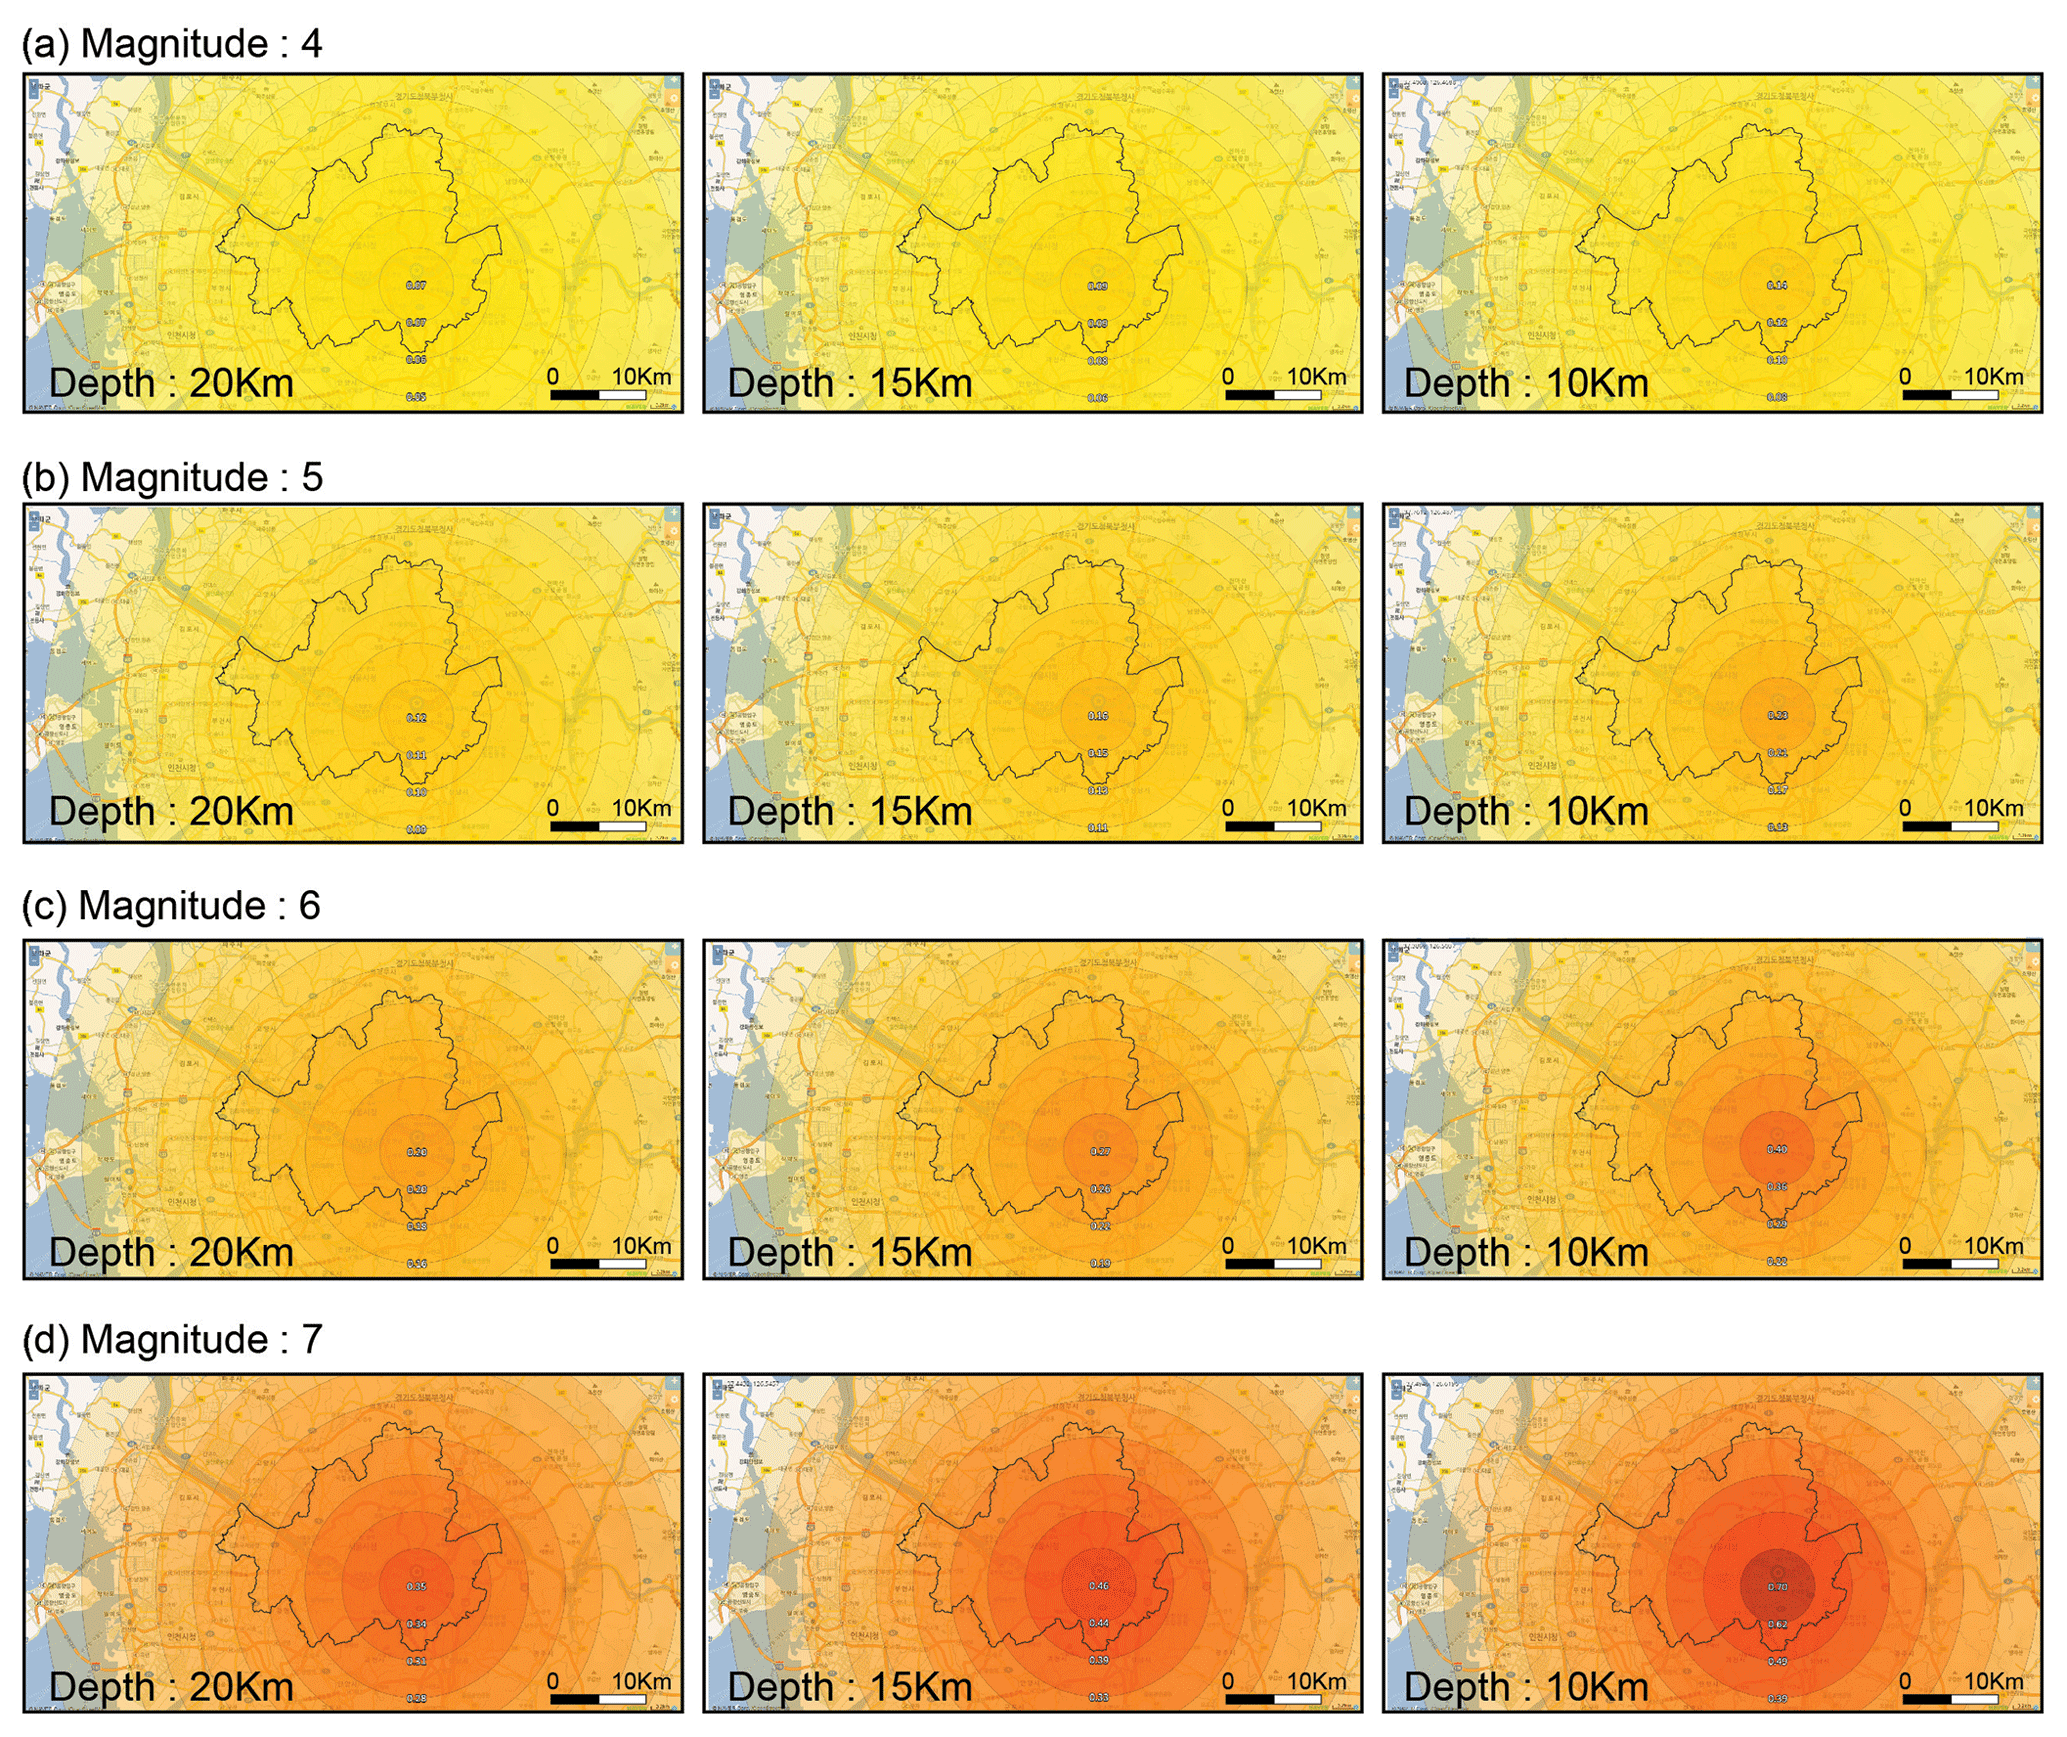
The influence of the seismic attenuation equation on the seismic-hazard map is great, but the reliability of the attenuation equations presented so far remains controversial. In this study, we tried to utilize the results of domestic studies reflecting the seismic characteristics in South Korea, and the attenuation equation of Eq. (1), which is considered to be the most conservative formula because its attenuation of the seismic wave is the lowest of the formulas proposed by the South Korean Ministry of Public Safety and Security (2012), is chosen for building the earthquake hazard map from the event scenario. The hazard maps, according to the each scenario, are shown in Fig. 4. PGA in Seoul ranges from 0.06 to 0.7 g in these scenarios, in which earthquakes of Mw 4.0 to 7.0 occurred at focal depths of 10 to 20 km.
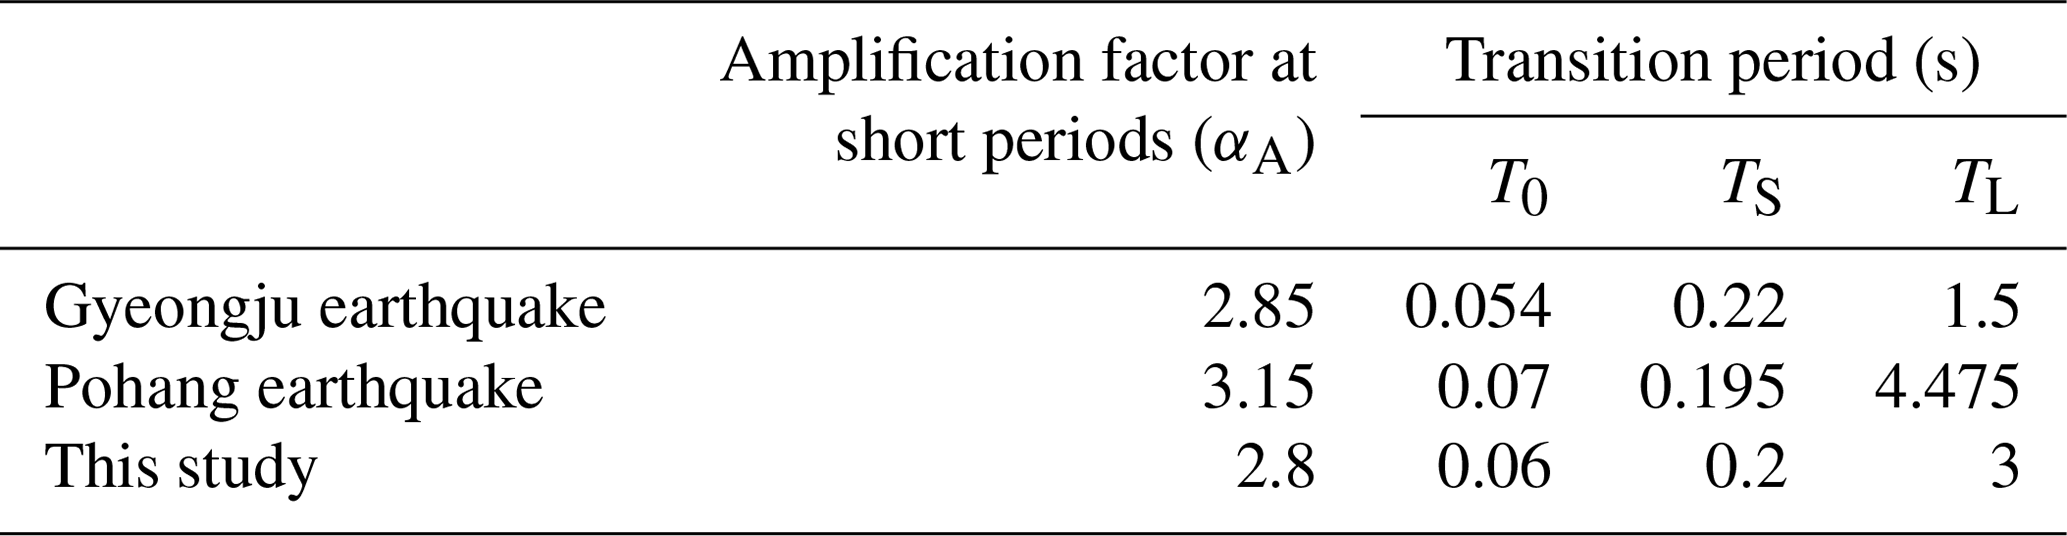
The severity of the vibratory response of buildings to an earthquake impact depends on the relationship between the characteristics of ground motion, described as the response spectrum (which has a different shape according to ground conditions) and structural characteristics of the building. But since the design response spectrum currently used in South Korea is based on a high-seismicity region like California, a lot of domestic researchers insist that the spectrum is different due to the characteristics of earthquakes on the Korean peninsula (Kim et al., 1998; Han, 2003; Hwang et al., 2015; Lee and Ju, 2017). In general, the ground conditions of South Korea, including Seoul, are characterized by shallow bedrock, and the earthquakes that have occurred in South Korea have a duration of strong motion that is shorter than those in high-seismicity regions. In the case of the Gyeongju earthquake, strong motion with a short duration of 0.1–0.2 s was also observed. As shown in Fig. 5, the shape of the standard response spectrum is described by four transition points. S is peak ground acceleration (PGA) and αA is the amplification factor in the short period. Heo et al. (2018) calculated the shapes and transition periods of the response spectrums through regression analysis of the acceleration and spectral displacement of the Gyeongju and the Pohang earthquakes and found that the standard response spectrum that had been used previously for seismic design in South Korea was overly conservative over long periods. The factors adapted to the spectrum in this study are set as shown in Table 4 after comparing the spectra of the earthquakes in Gyeongju and Pohang.

Table 4Factors of the standard response spectrum in this study.
5.1 The status of seismic design code in South Korea
In 1988, when an earthquake occurred in Mexico, the seismic design code in South Korea was first mandated for buildings with six and more stories or floor areas of 100 000 m2 or more, and it was gradually expanded to all buildings with three or more stories or floor areas of more than 500 m2 through the revision of the KBC in 2015. Nevertheless, 93.2 % of all buildings in South Korea do not comply with the seismic code and are more vulnerable to earthquakes (Seoul Metropolitan Government, 2012; Choi, 2016).
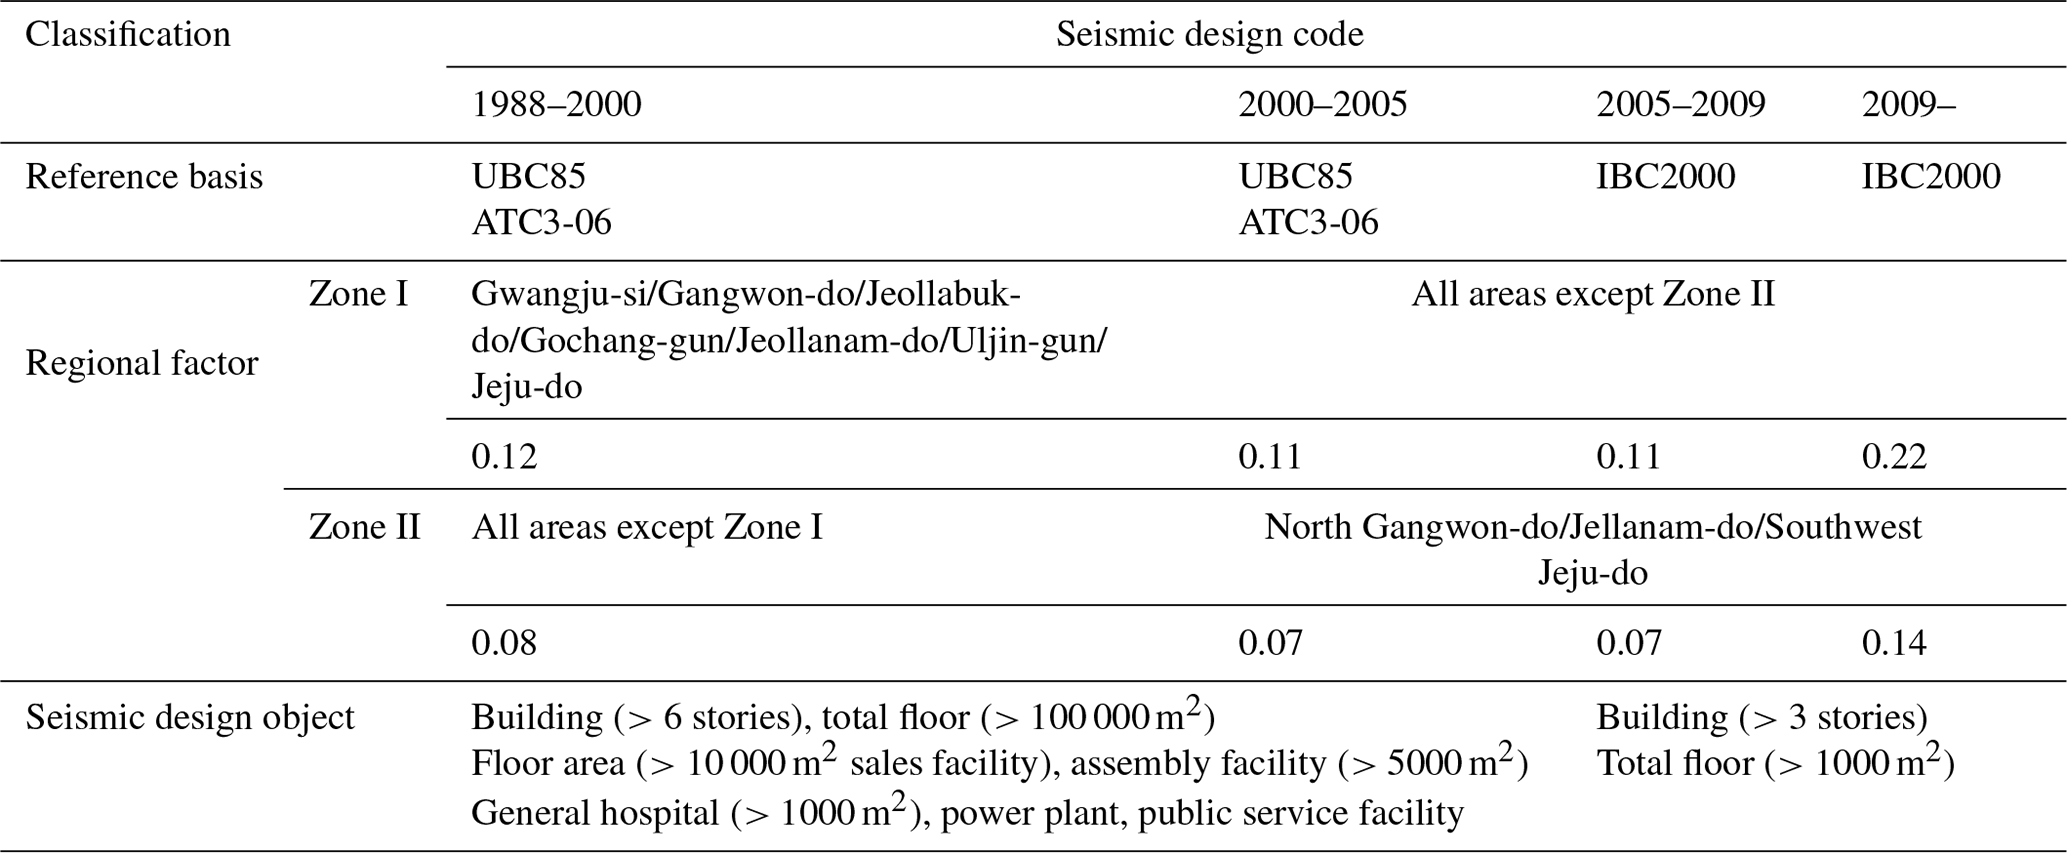
The seismic design codes in the KBC were established based on the Uniform Building Code (UBC), the Applied Technology Council (ATC), and the International Building Code (IBC) (Seoul Metropolitan Government, 2012; Lee, 2015). While the seismic zone in the UBC is divided into six zones that each have a regional factor, which is defined as the peak ground acceleration (PGA). The zone in KBC is divided into two zones: Zone I, which includes the Seoul area, and Zone II. The regional factor of Zone I was 0.11 before 2009 but strengthened to 0.22 after that, and the seismic design code of buildings built in Seoul before 2009 is similar to Zone 2A of the UBC and the code of buildings built after 2009 is similar to Zone 2B of the UBC.
5.2 Application of damage function
As mentioned above, since the seismic design code of South Korea is similar to the UBC and the ATC code, the damage functions proposed by HAZUS-MH can be applied to estimate building damage due to seismic impact. The damage function for each building type in HAZUS-MH includes two types of damage curves: capacity curve and fragility curve. The capacity curve is used to determine the peak building response from the capacity spectrum method. This method is a schematic procedure for comparing the capacity curve obtained by pushover analysis with the demand spectrum of ground motion on the Acceleration Displacement Response Spectrum (ADRS). Thus, the response spectrum has to be converted to the demand spectrum for representing the relationship between spectral displacement and spectral acceleration. Equation (2), proposed by HAZUS-MH, can relate spectral acceleration with spectral displacement for a given period value (Federal Emergency Management Agency, 2013).
where Sd is spectral displacement (m) and Sa is spectral acceleration (g) in a given period (T, s)
The intersection of the capacity curve and the demand spectrum is a performance point, which can evaluate the associated damage state for the structure and compare that damage state for different earthquakes (Fig. 6).
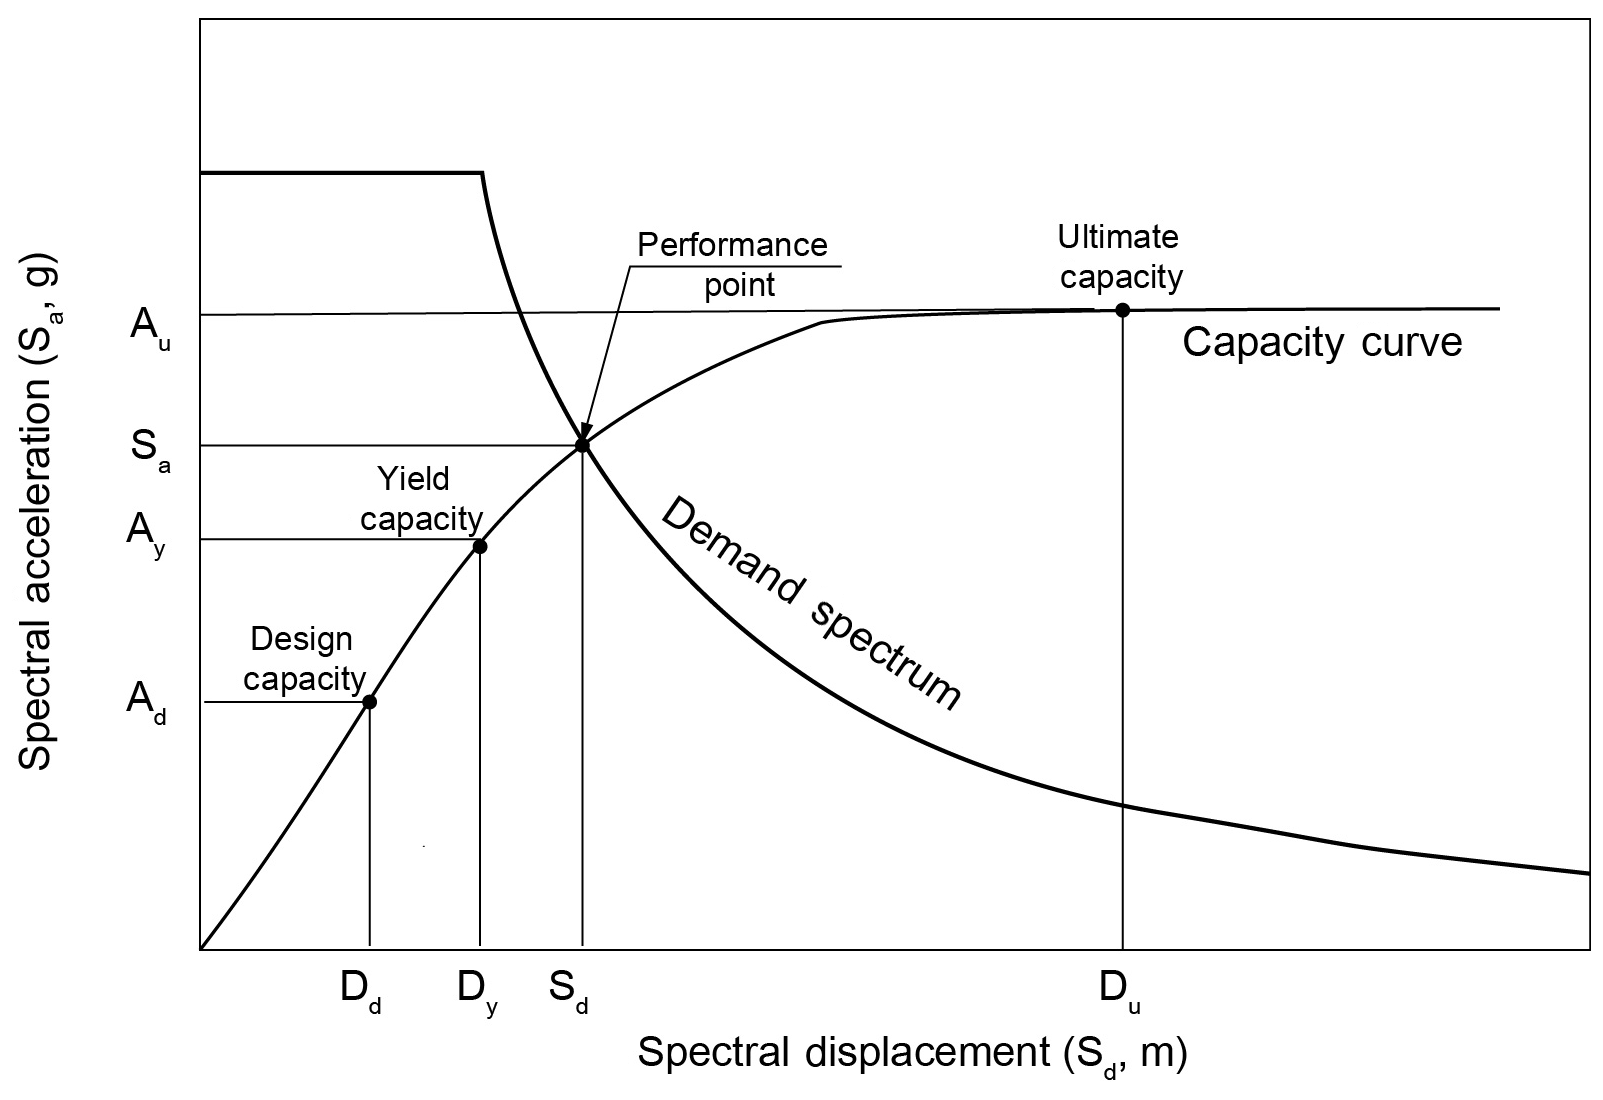
Figure 6Performance points according to the intersection of the capacity curve and demand spectrum.
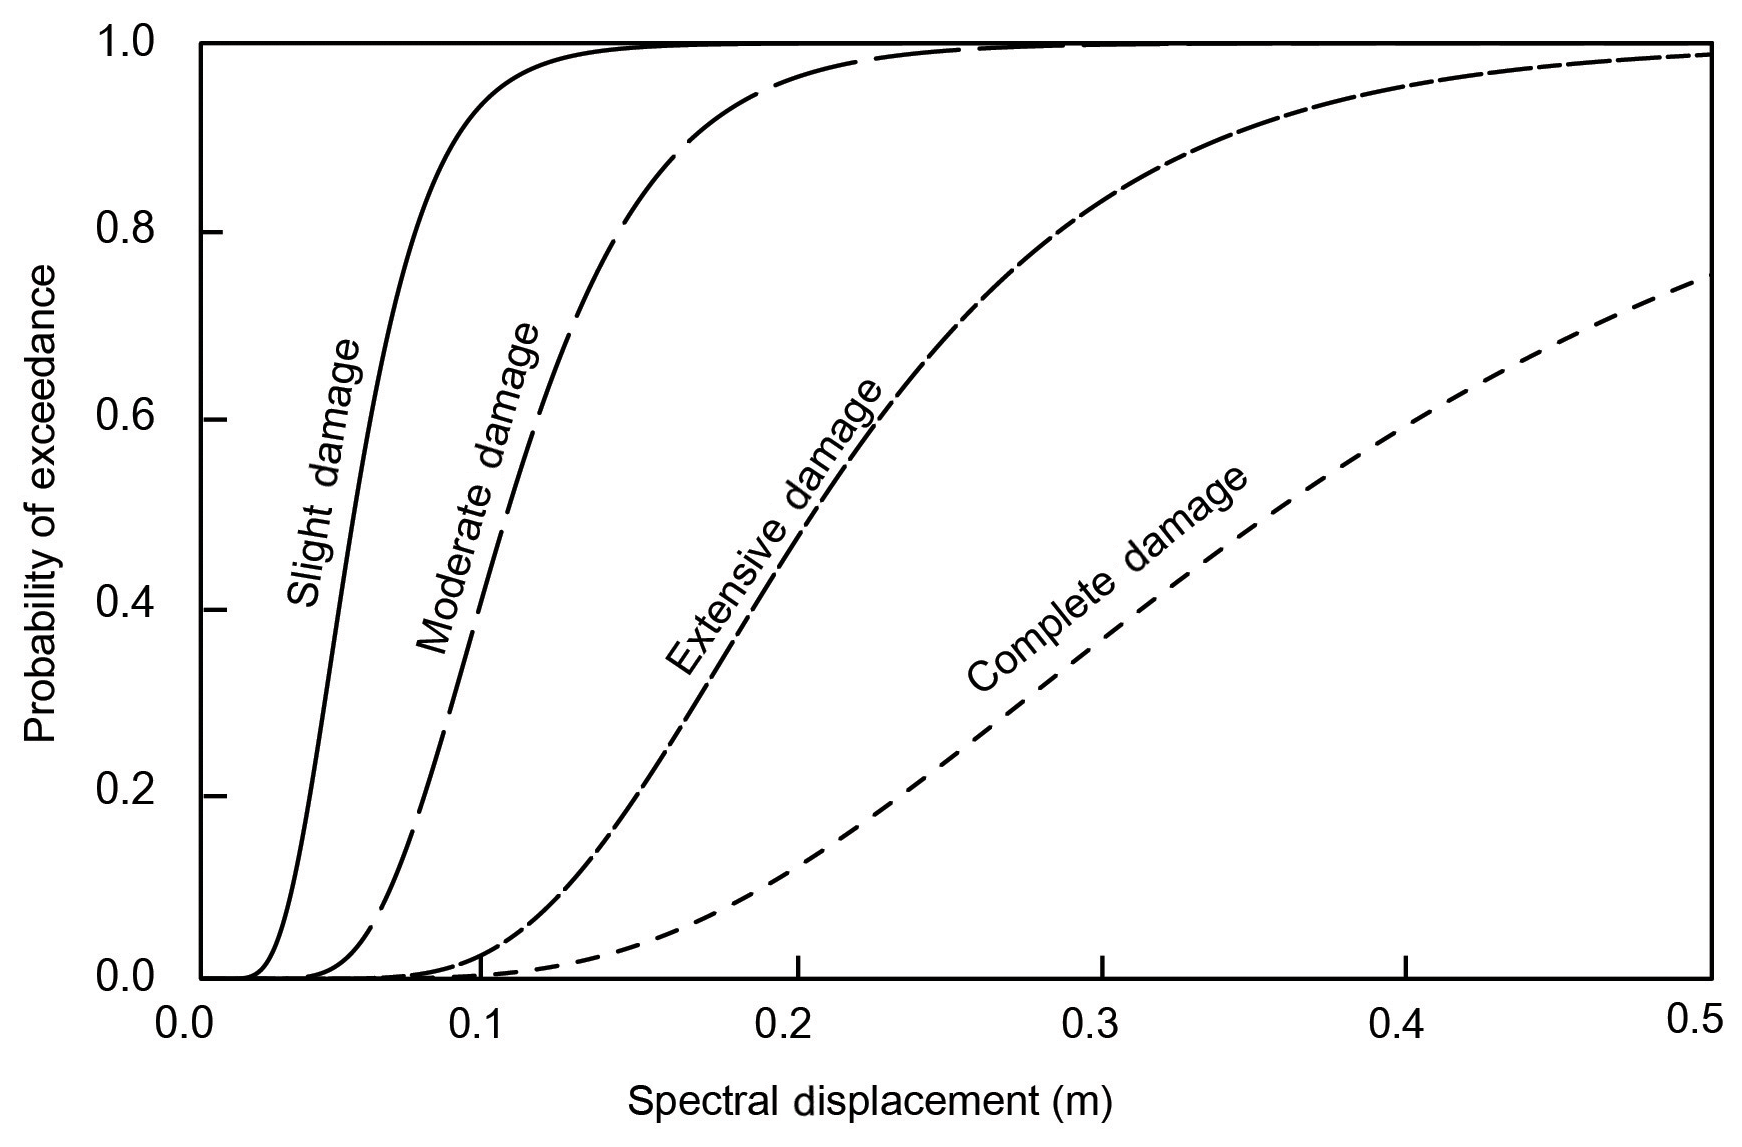
The fragility curves estimate the probability of exceeding different damage states given peak building response, which is represented as spectral displacement or spectral acceleration at the performance point. The damage state is divided into four states: slight, moderate, extensive, and complete. Each fragility curve is expressed as a lognormal function defined by a median value of peak building response, corresponding to the mean threshold of associated damage state by a logarithmic standard deviation (β). The fragility curve for structural component of the building uses spectral displacement (Sd) as the peak building response and defines the functions of Eq. (3) and Fig. 7.
where Φ(⋅) is the standard normal distribution function and is the median value of spectral displacement at which the building reaches the threshold of damage state.
The nonstructural components of the building are divided into drift-sensitive components and acceleration-sensitive components. In general, while architectural components such as interior or exterior walls are more drift-sensitive, the mechanical and electrical components of the building are acceleration-sensitive. Therefore, the function of inter-story drift is used to estimate the damage state of drift-sensitive components and the function of floor acceleration is used to estimate the damage state of acceleration sensitive components or contents in the building.
The capacity curve and the fragility curve in the HAZUS-MH are classified into high-code, moderate-code, low-code and precode buildings as per seismic design codes (Federal Emergency Management Agency, 2013). When all buildings in Seoul are classified by comparing the seismic design code of the HAZUS-MH, it is estimated to be approximately 91.7 % precode, 5.4 % low-code and 2.9 % moderate-code buildings.
Table 6Estimated mean loss ratio of building based on occupancy type.
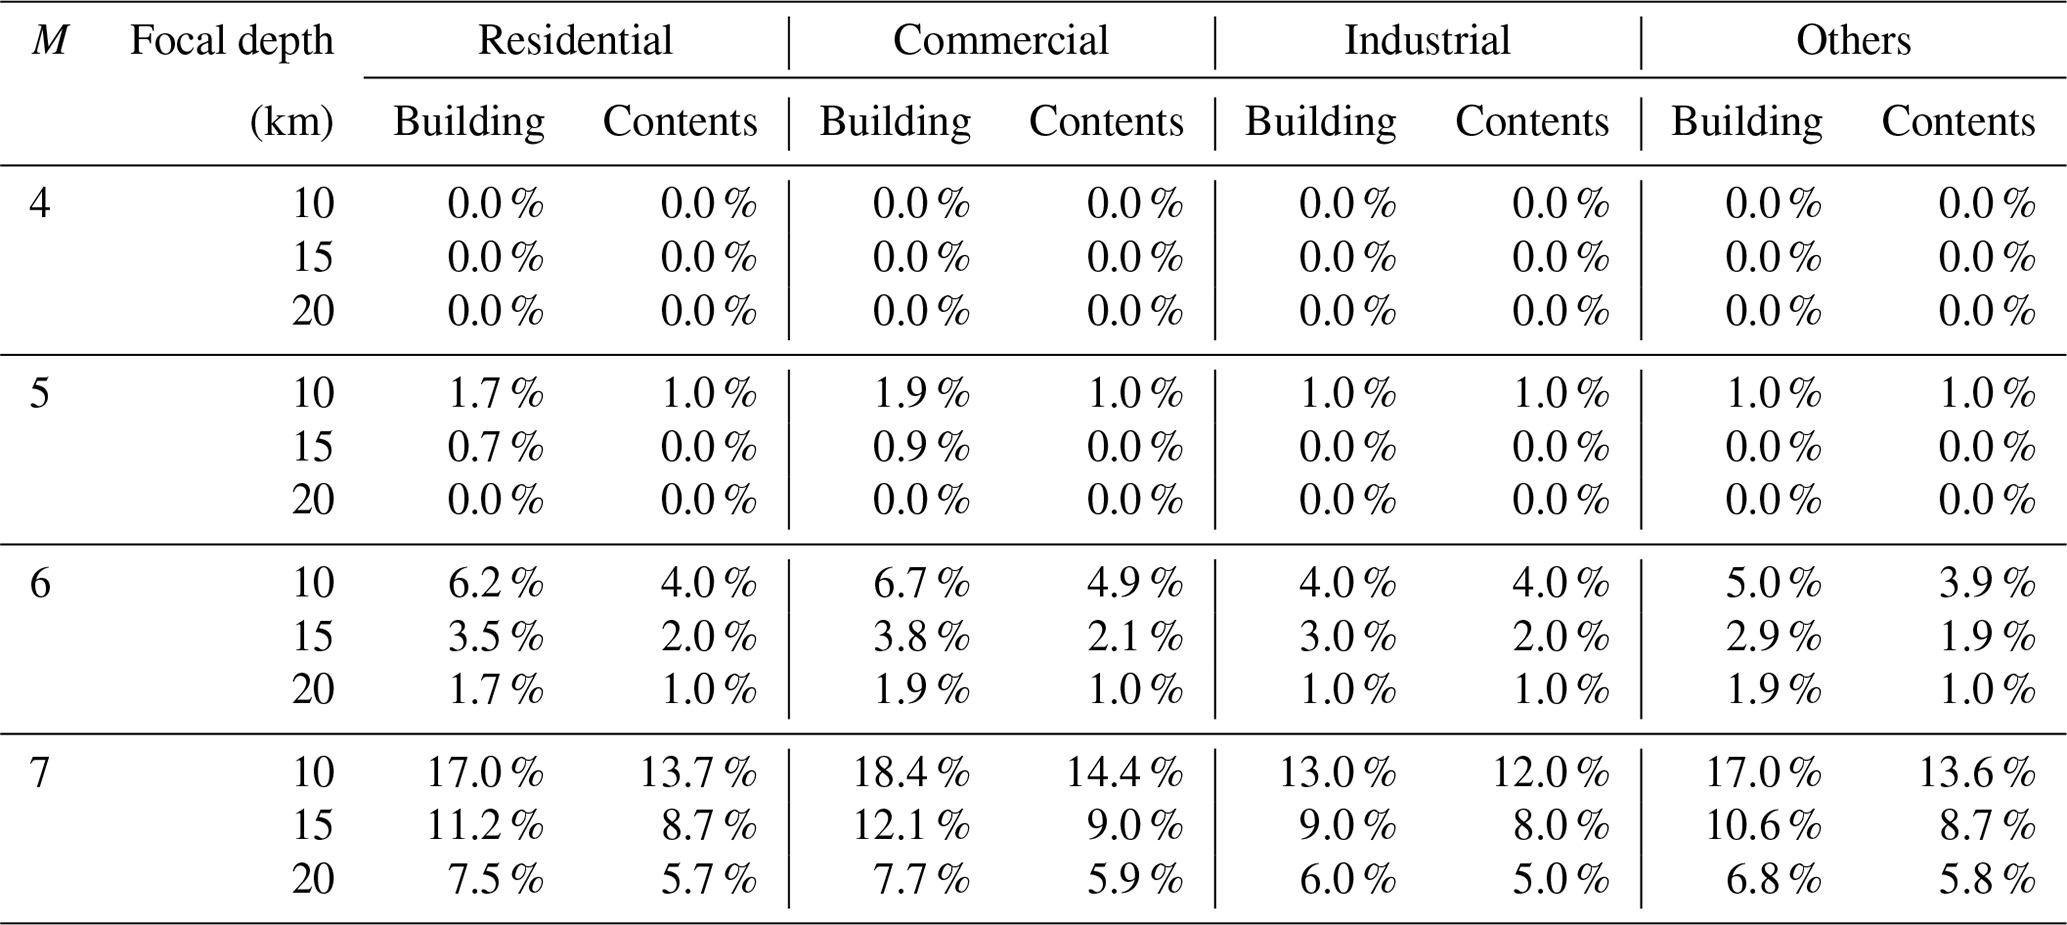
Table 7Estimated mean loss ratio of building based on structure type.
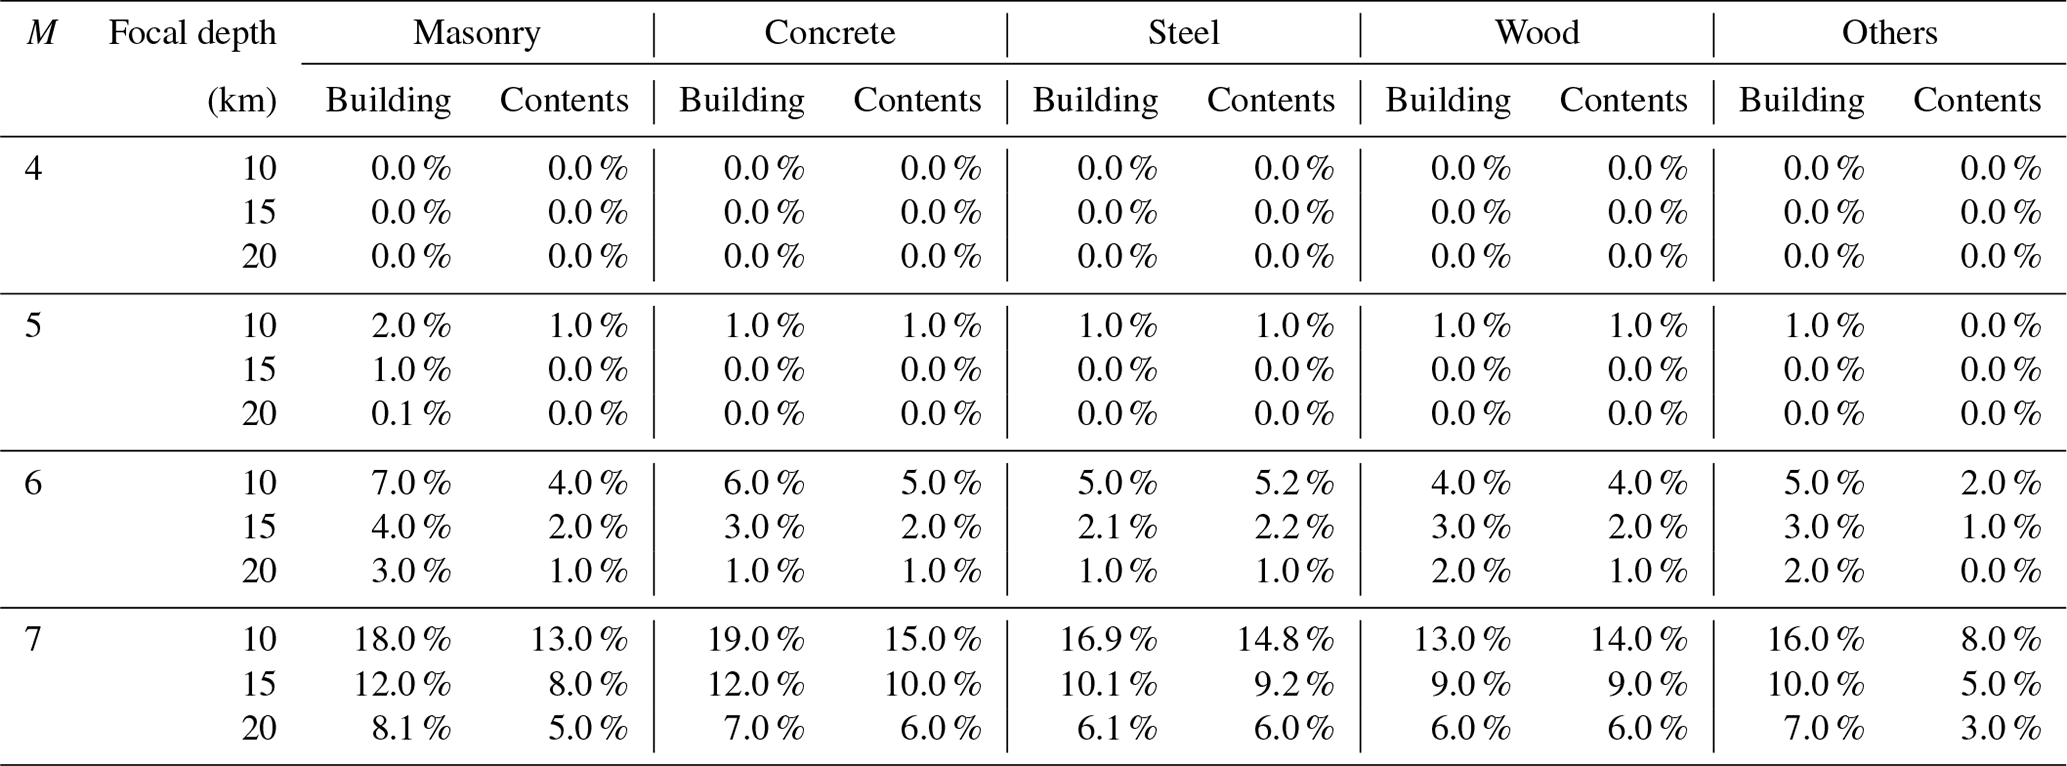
5.3 Calculation of loss ratio
Using estimates that include the structural and nonstructural repair costs caused by building damage and the associated loss of building contents and business inventory, provided by HAZUS-MH, the probability of exceeding different damage states for the each component can be converted to the loss ratio of replacement cost for the purpose of evaluation of direct economic loss. Tables 6 and 7 summarize the estimated mean loss ratio of buildings, which includes structural and nonstructural components, and contents, depending on occupancy and structure type. It is a common pattern that the majority of damage is inflicted on low-rise residential buildings made of masonry in South Korea, where earthquakes are characterized by strong short-period components are dominant. However, this common pattern is not clearly shown in the result of this study and there are two main reasons for that result.
The first reason is that although the number of low-rise residential buildings made of masonry is much larger, the total asset value is much lower than high-rise residential buildings made of reinforced concrete, such as apartments, which are generally classified as a luxury residence, while low-rise masonry houses are classified as a low-priced residence in Seoul. The second reason is that the nonstructural elements, such as mechanical and electrical components that are more vulnerable to ground shaking than structural components, are of a higher proportion in the buildings made of concrete and steel than in masonry.
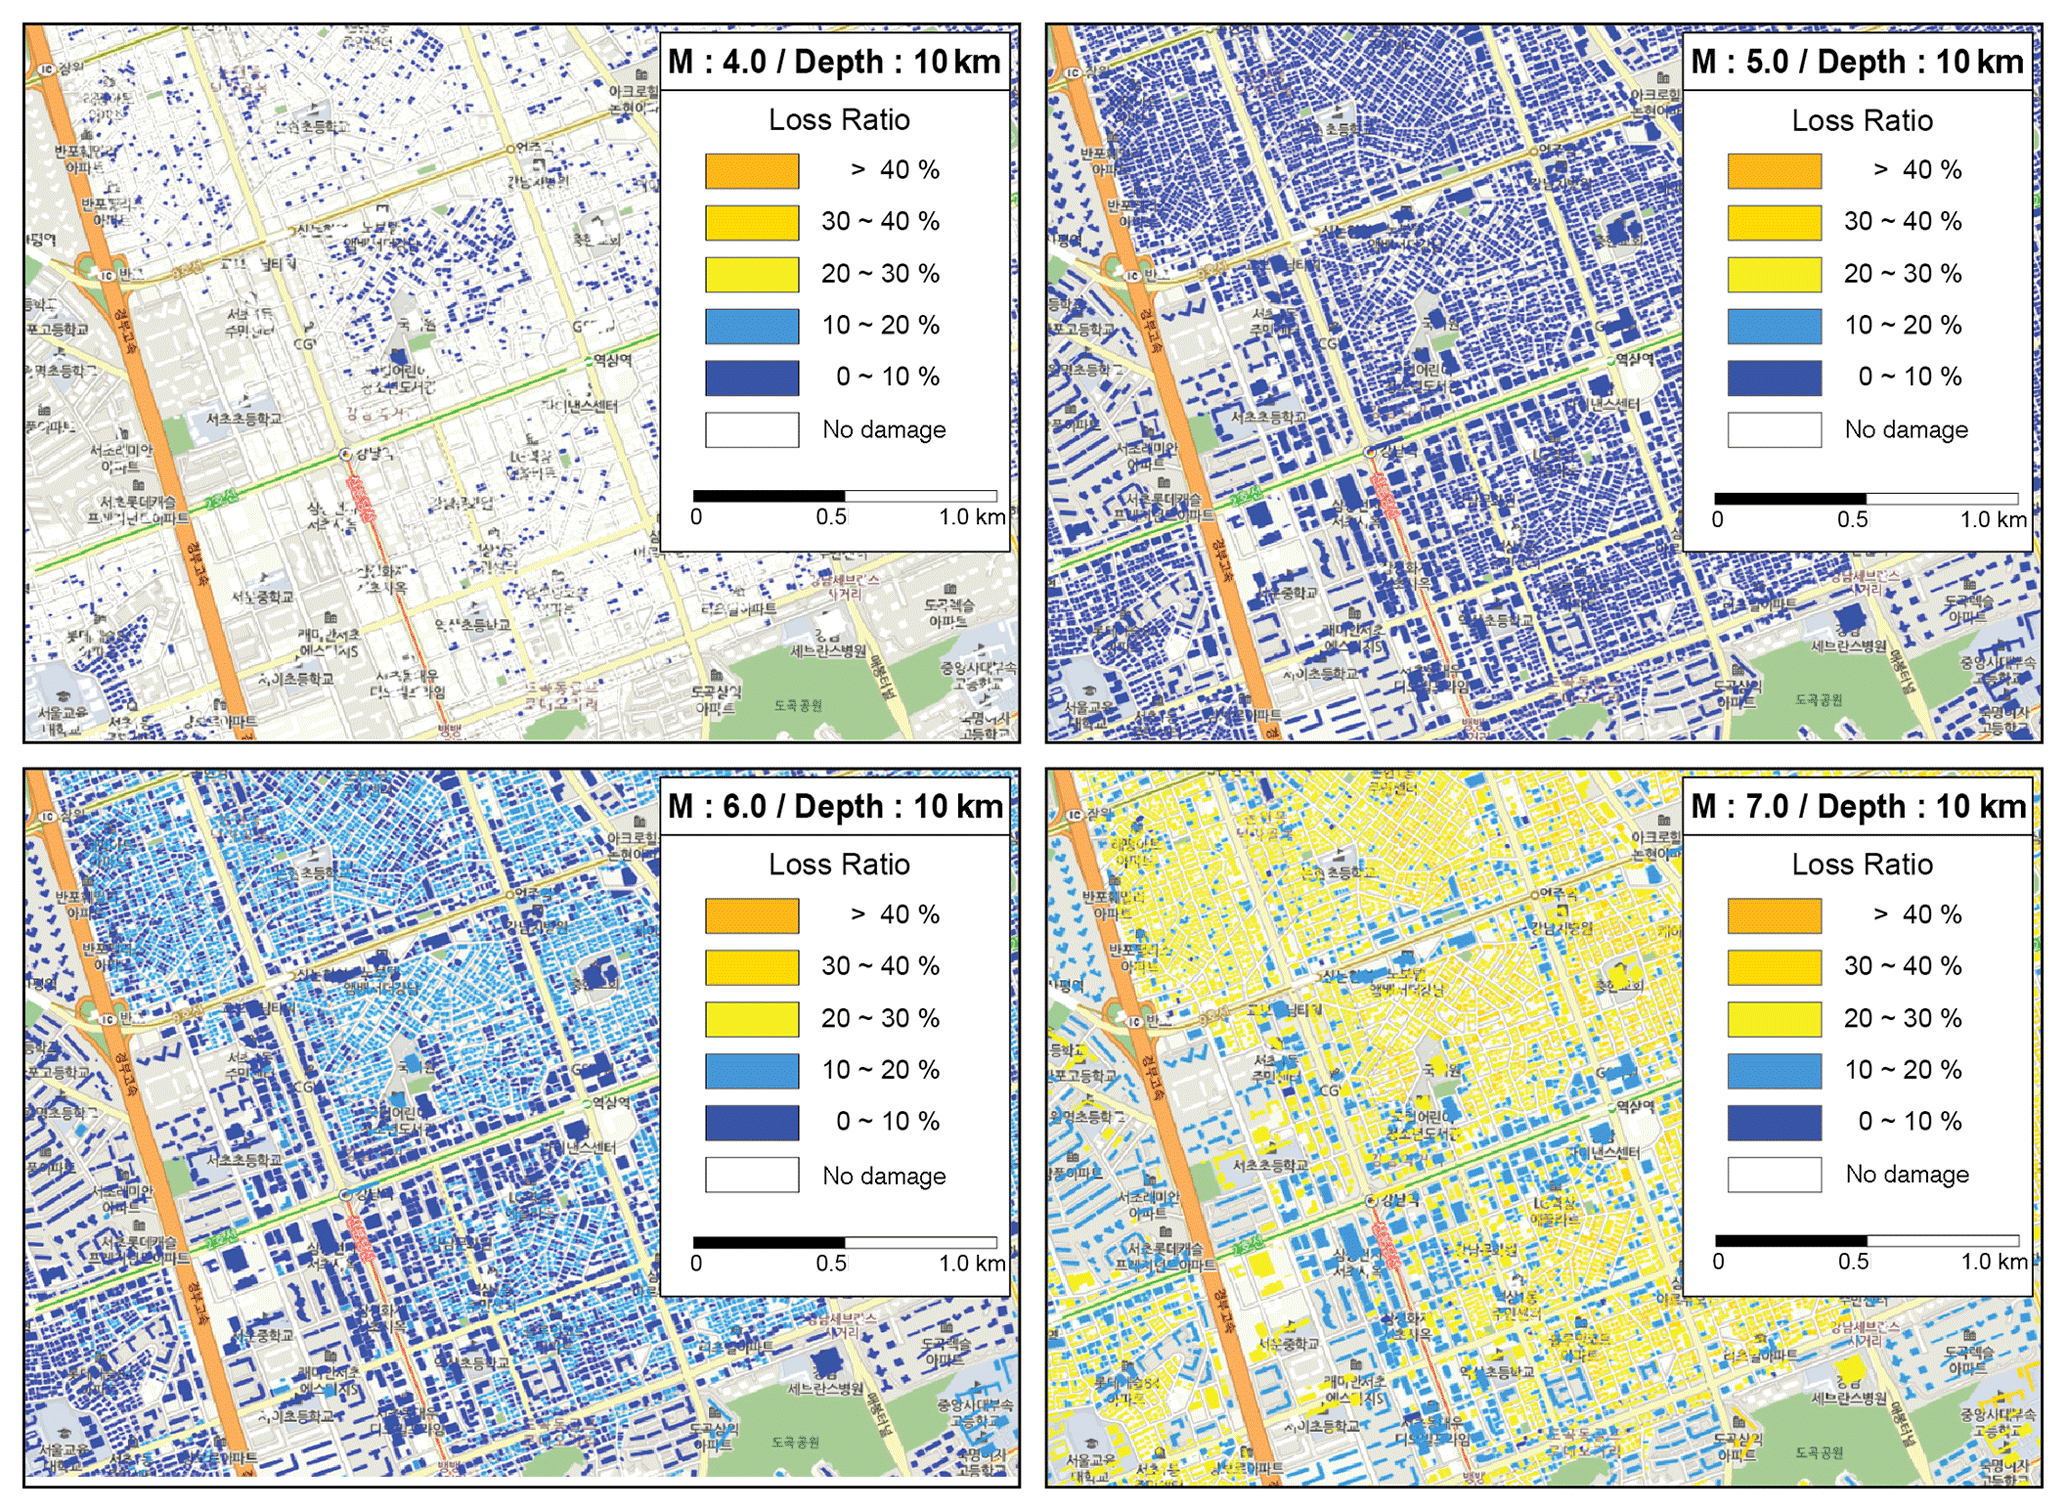
Figure 8 is a map that shows the loss ratio of each building in the Gangnam district, located 3 km from the epicenter, with an intensity of Mw 4.0–7.0 and a focal depth of 10 km. According to the results, if an earthquake of Mw 4.0 strikes the southeastern part of Seoul, damage to the residential buildings that are precode starts to occur and an earthquake of Mw 5.0 can damage almost all buildings, due to ground shaking. If an earthquake of Mw 6.0 occurs, office buildings of low code begin to be damaged by seismic impact, and an earthquake of Mw 7.0 is estimated to cause an average of 14.8 % and 14.9 % of the total replacement cost of all buildings and their contents in Seoul, respectively.
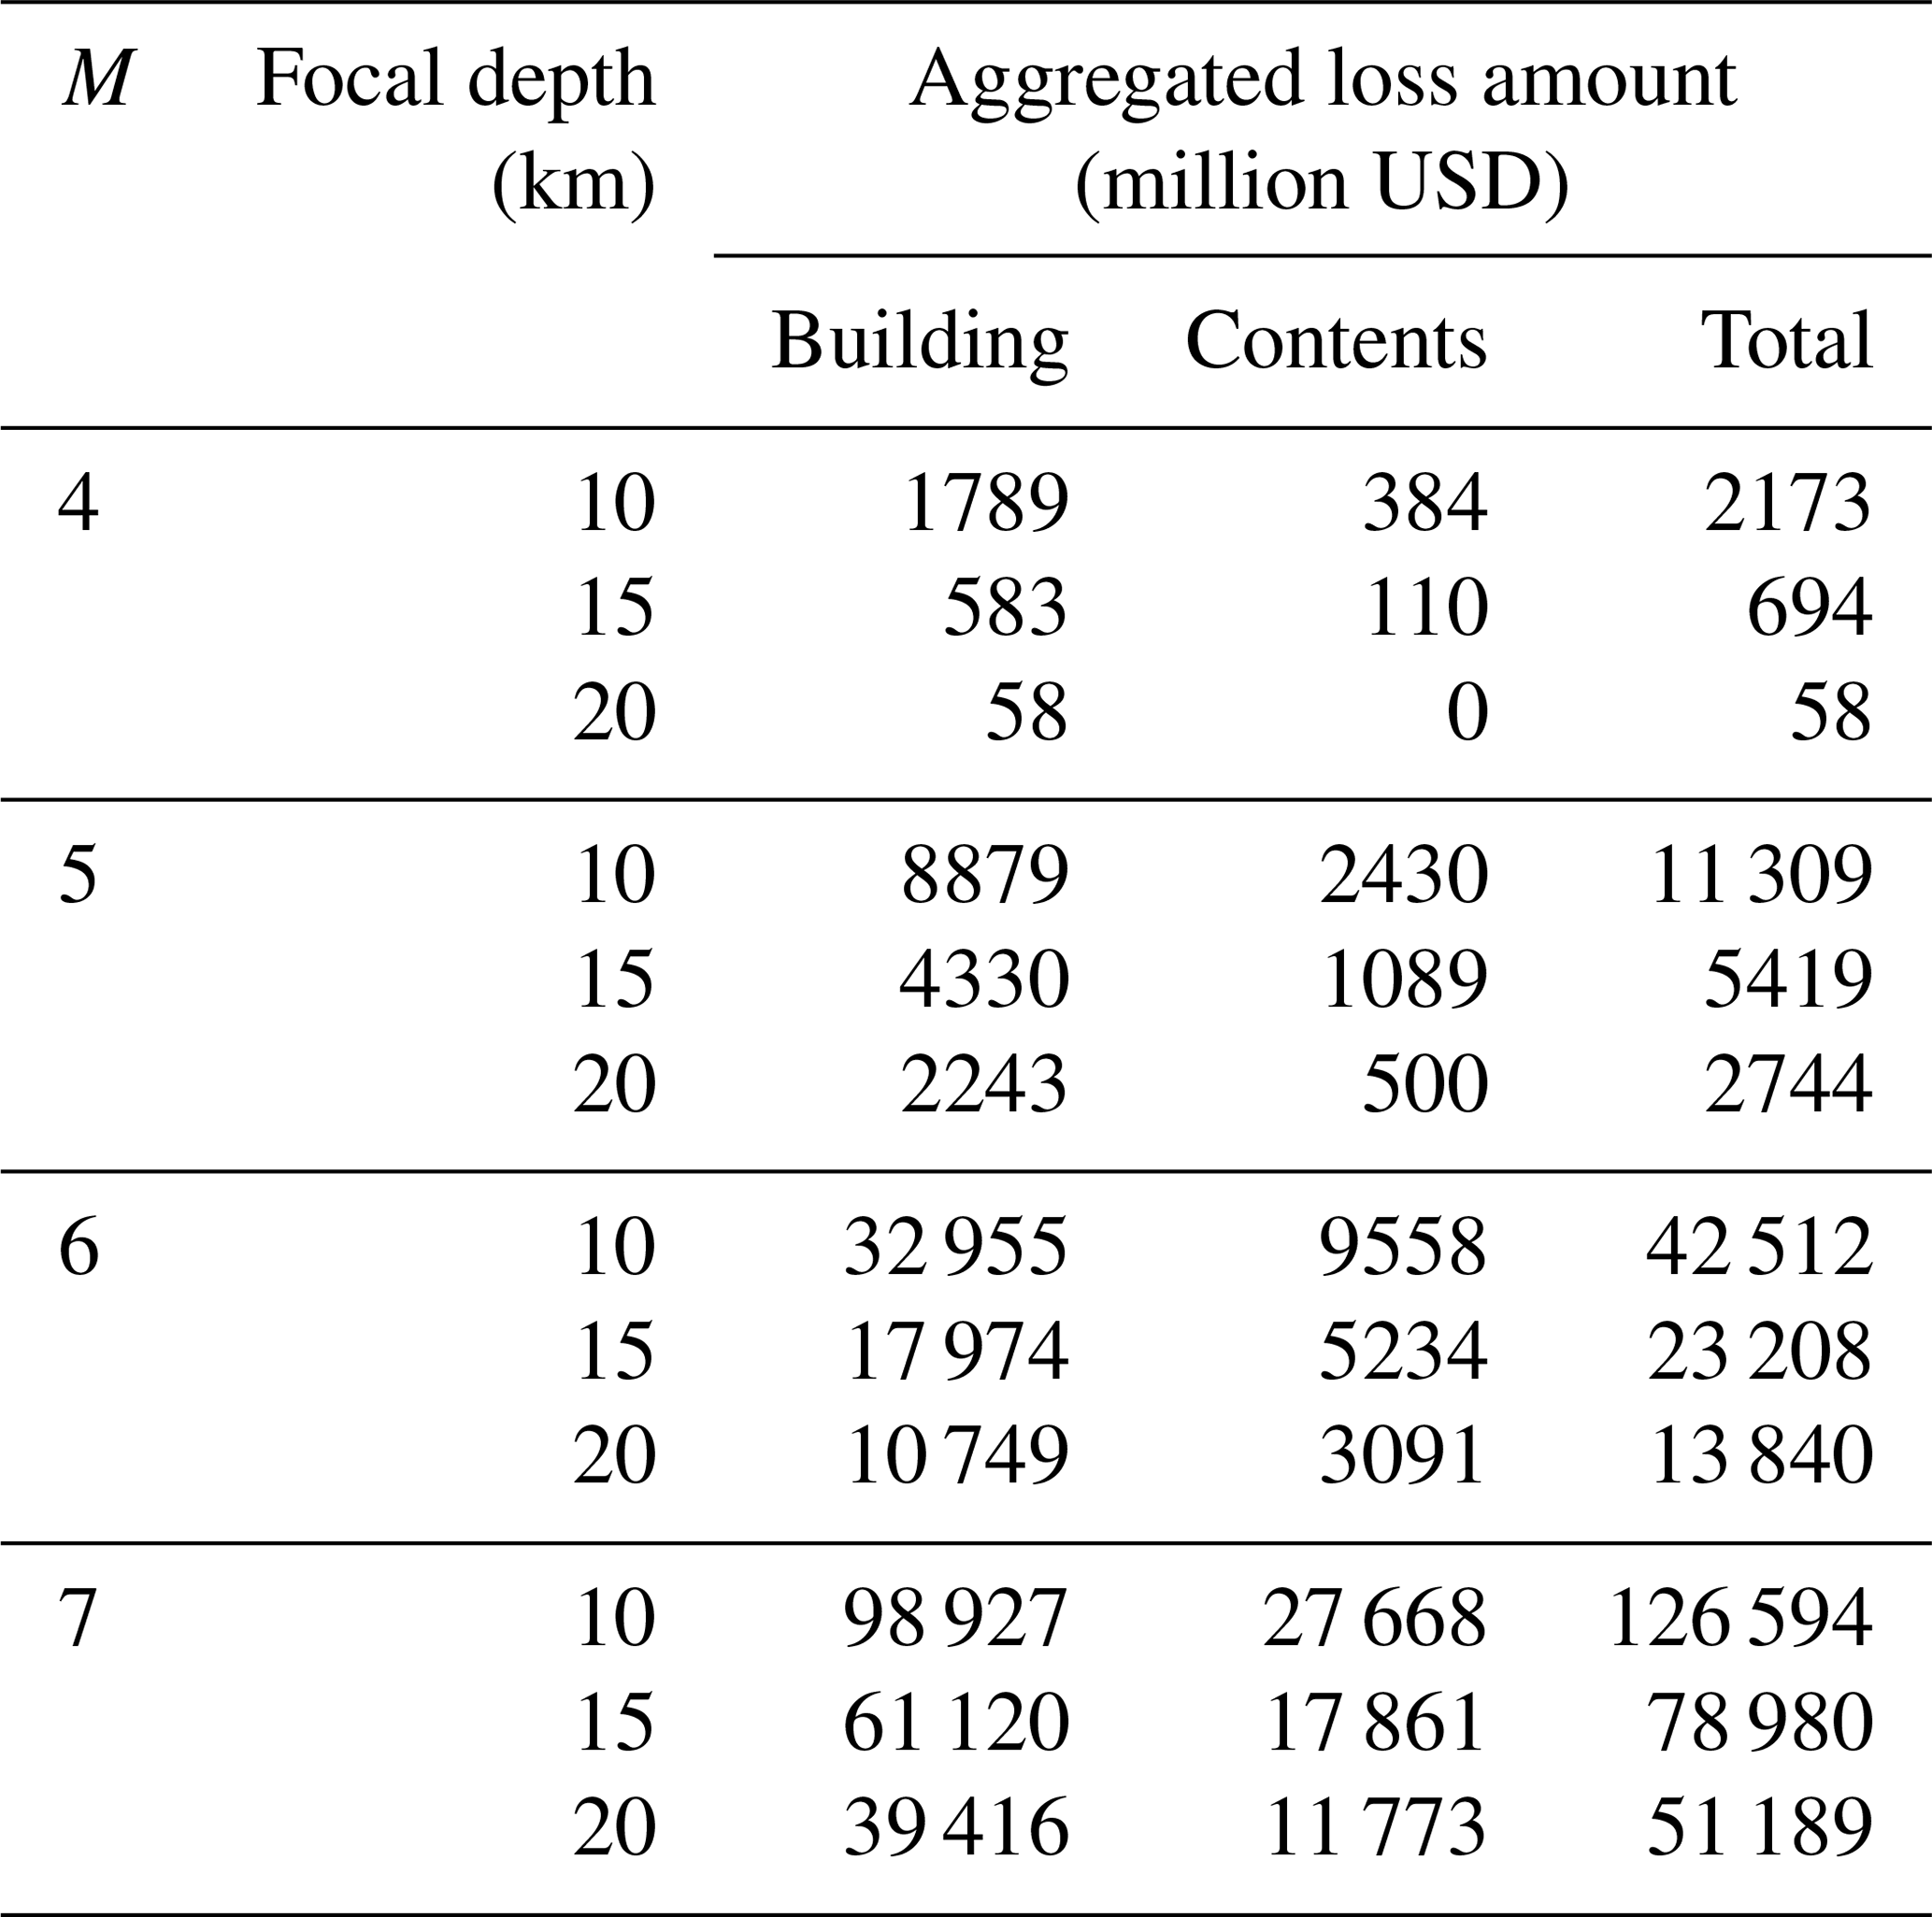
The total loss amount for each scenario can be simulated by replacement cost, seismic intensity, damage function, and other factors mentioned above. But since systematic data issues or biases across a portfolio can result in losses being consistently under- or over-simulated (Lloyd's Market Association, 2017), the results need to be corrected by comparing empirical data. The Linear Scaling Method (LSM), which is one of the common methods of correcting systematic errors, can be used to calibrate pre-simulated loss amount. The LSM reflects the difference between pre-simulated results and observed results in the simulated results as shown by Eq. (4).
where i is Mw of the earthquake and j is the focal depth. is the corrected loss, is the observed loss, and is the pre-simulated loss. There has not been an earthquake of Mw 4.0 or more in or near Seoul since earthquake monitoring began in 1978. Therefore, all pre-simulated results were inevitably corrected using empirical data of the earthquake of Mw 3.0 that occurred near Seoul in 2010. The calibrated loss amounts for each scenario are summarized in Table 8. The total loss in the case of an earthquake of Mw 4.0 is estimated at USD 2.2 billion. However, if the Mw of the earthquake increases to 7, the total loss is estimated to increase 58 times that of Mw 4.0, reaching USD 126.6 billion, which is close to 15 % of total replacement cost for all buildings in Seoul. Nonetheless, the loss from the Mw 7.0 earthquake is only 4 % compared to the loss resulting from the South Korean Ministry of Public Safety and Security (2015) predictions. The main reasons for the difference in loss are as follows: (1) the duration of strong motion is applied as 0.6 s in the standard response spectrum of the previous study; however, in this study, the duration of 0.2 s is implemented to reflect the characteristics of the recent earthquakes that occurred on the Korean peninsula. (2) The replacement costs of buildings are reflected in the analysis using statistics of the actual insured data, but previous studies used the replacement cost published in square foot costs (RSMeans, 2002) in the USA. (3) This study did not consider indirect loss, such as relocation expenses, income loss, and rental income loss.
The existence of active fault zones on the Korean peninsula and the recent earthquakes that affected Gyeongju and Pohang have made experts question whether current overall practices would still be adequate if a similar earthquake were to occur in Seoul. The concentration of major industrial and commercial facilities carries a significant inherent risk of causing catastrophic loss of life and economic damage and poses a significant administrative challenge for disaster management in South Korea. The disaster management is divided into four phases: (1) mitigation, (2) preparedness, (3) response, and (4) recovery. At each phase, which each have particular needs and problems, different strategies and support are required to force social resilience against each natural disaster. It is also important that the activities at each phase generate a virtuous cycle of practices and assist in making each phase stronger.
The development of the insurance industry could be used as a good example for explaining virtuous cycles in disaster management. The insurance industry as disaster risk financing commonly plays a major role in securing financial stability for a smooth recovery from natural disasters. However, it also helps these activities to perform more effectively during the other phases such as mitigation, preparedness, and response. The Sichuan earthquake of 2008 is in stark contrast with the New Zealand earthquake of 2010 in terms of disaster management efficiency, due to limited insurance coverage. The Sichuan, China, earthquake of M 8.0, where insurance penetration is relatively low, caused approximately 70 000 deaths, more than 370 000 injuries, and USD 127 billion of economic losses. However, the insured loss was under 3 % of the economic loss. On the other hand, the earthquake of M 7.1 that occurred in New Zealand, where insurance coverage is very high, caused only two injuries and USD 2.7 billion of economic loss, which is more than 50 % of the economic loss that was covered from various insurance programs, such as direct insurance, reinsurance, and the international financing market (World Economic Forum, 2011).
Most domestic insurers believe that it is impossible to predict loss amount from potential earthquakes and that it is difficult to quantify the earthquake risk in South Korea. This belief of insurers is a major obstacle to the development of earthquake insurance programs. However, as mentioned above, various studies required for the catastrophe model methodology have either been completed or are in progress by various domestic researchers and a lot of databases related to potential earthquake risk in South Korea is being accumulated. Compared to other studies, this study is different in that real insurance information and building registration databases are used to predict the loss amount from a potential earthquake. It not only helps advance the prediction process but also serves the insurer to better understand and estimate the earthquake risk. This study shows that risks due to potential earthquakes in South Korea are significant and that the insurance industry can support more detailed studies for a better understanding of insurance risk and the expanding scope of current insurance practices for earthquake risks. Because of this, insurance companies have an opportunity to further explore currently underused areas of business in property insurance.
Access to the Seoul building and asset data used for the analysis are restricted as they are the property of a private company. Part of the calculation coding used for data analysis can be found in the Supplement.
The supplement related to this article is available online at: https://doi.org/10.5194/nhess-19-985-2019-supplement.
WC conceived and wrote the entire paper. JWP and JK analyzed the results and revised the paper.
The authors declare that they have no conflict of interest.
This work was supported by the National Research Council of Science and Technology (NST) grant by the South Korean government (MSIP) (no. CRC-16-02-KICT).
This paper was edited by Maria Ana Baptista and reviewed by two anonymous referees.
Atkinson, G. M. and Boore, D. M.: Some comparisons between recent ground-motion relations, Seismol. Res. Lett., 68, 24–40, https://doi.org/10.1785/gssrl.68.1.24, 1997.
Atkinson, G. M. and Silva, W.: Stochastic modeling of California ground motions, B. Seismol. Soc. Am., 90, 255–274, https://doi.org/10.1785/0119990064, 2000.
Choi, S. J., Chwae, U., Lee, H. K., Song, Y., and Kang, I. M.: Review on the Chugaryeong fault, Economic and Environmental Geology, 45, 441–446, https://doi.org/10.9719/EEG.2012.45.4.441, 2012 (in Korean).
Choi, W. I.: Earthquake risk and seismic insurance needs on Korean peninsula, Monthly Report of General Insurance Association of Korea, 576, 16–27, 2016 (in Korean).
Chung, D., Song, Y., Park, C., Kang, I. M., Choi, S. J., and Khulganakhuu, C.: Reactivated timings of some major faults in the Chugaryeong fault zone since the Cretaceous period, Economic and Environmental Geology, 47, 29–38, https://doi.org/10.9719/EEG.2014.47.1.29, 2014 (in Korean with English abstract).
Dell'Acqua, F., Gamba, P., and Jaiswal, K.: Spatial aspects of building and population exposure data and their implications for global earthquake exposure modeling, Nat. Hazards, 68, 1291–1309, https://doi.org/10.1007/s11069-012-0241-2, 2012.
Federal Emergency Management Agency (FEMA): Multi-hazard loss estimation methodology, Earthquake model, HAZUS-MH 2.1, Technical manual, 718 pp., 2013.
Figueiredo, R. and Martina, M.: Using open building data in the development of exposure data sets for catastrophe risk modelling, Nat. Hazards Earth Syst. Sci., 16, 417–429, https://doi.org/10.5194/nhess-16-417-2016, 2016.
Han, S. H.: Effect of different sets of earthquake ground motion records on seismic demands, Journal of Architectural Institute of Korea, 19, 25–32, 2003 (in Korean with English abstract).
Heo, T. M., Kim, J. H., Lee, J. H., and Kim, J. K.: Response spectra of 2017 Pohang earthquake and comparison with Korean standard design spectra, Journal of the Earthquake Engineering Society of Korea, 22, 129–137, https://doi.org/10.5000/EESK.2018.22.3.129, 2018 (in Korean with English abstract).
Hwang, K. R., Lee, H. S., and Kim, S. J.: Evaluation of seismic load level in Korea based on global recorded earthquake ground motions, Journal of the Earthquake Engineering Society of Korea, 19, 247–256, https://doi.org/10.5000/EESK.2015.19.5.247, 2015 (in Korean with English abstract).
Kim, M. H., Hong, W. K., and Kim, S. D.: Inelastic Design Spectra of Weak and Moderate Earthquakes, Journal of Architectural institute of Korea, 14, 11–20, 1998 (in Korean).
Korea Appraisal Board (KAB): Construction Cost Table, ISBN 9791186928073, 2016 (in Korean).
Korea Meteorological Administration (KMA): Seismological Annual Report of 2017, 301 pp., 2018 (in Korean).
Kyung, J. B.: Paleoseismological study and evaluation of maximum earthquake magnitude along the Yangsan and Ulsan fault zones in the southeastern part of Korea, Geophysics and Geophysical Exploration, 13, 187–197, 2010 (in Korean with English abstract).
Lee, H. S.: Seismic design implications for low-to-moderate seismicity regions from earthquake simulation tests on RC building structures in Korea, The 2015 World Congress on Advances in Structural Engineering and Mechanics (ASEM 15), Incheon, 25–29 August, 1–45, 2015.
Lee, K.: Comments on seismicity and crustal structure of the Korean peninsula, Geophysics and Geophysical Exploration, 13, 256–267, 2010 (in Korean).
Lee, K. and Kim, J. K.: Intensity attenuation in the Sino-Korean craton, B. Seismol. Soc. Am., 92, 783–793, https://doi.org/10.1785/0119990161, 2002.
Lee, Y. J. and Ju, Y. K.: Evaluation of design response spectrum in low-to-moderate seismicity region ground motion, 2017 Conference of Architectural institute of Korea, Jeju, 26–29 April, 37, 633–634, 2017 (in Korean with English abstract).
Lloyd's Market Association (LMA): Understanding uncertainty in catastrophe modelling for non-catastrophe modelers, 16 pp., available at: https://www.lmalloyds.com/LMA/News/Releases/PR_2017/lmaaimstoclarify_040117.aspx (last access: 23 April 2019), 2017.
South Korean Ministry of Public Safety and Security (MPSS): Active fault map and seismic hazard map, 899 pp., available at: http://www.ndsl.kr/ndsl/search/detail/report/reportSearchResultDetail.do?cn=TRKO201600010825 (last access: 23 April 2019), 2012 (in Korean).
Ministry of Public Safety and Security in Korea (MPSS): Development of socio-economic seismic loss prediction models, 463 pp., available at: http://www.ndsl.kr/ndsl/search/detail/report/reportSearchResultDetail.do?cn=TRKO201500012772 (last access: 23 April 2019), 2015 (in Korean).
Parodi, P.: Pricing in general insurance, CRC Press, 535 pp., https://doi.org/10.1201/b17525, 2014.
RSMeans: Square Foot Costs, Kingston, MA, R.S. Means Co., ISBN 0876296851 9780876296851, 2002.
Seoul Metropolitan Government (SMG): Improving method of building seismic performance in Seoul, 388 pp., available at: https://opengov.seoul.go.kr/research/6411500 (last access: 23 April 2019), 2012 (in Korean).
Toro, G. R., Abrahamson, N. A., and Schneider, J. F.: Model of strong ground motions from earthquakes in central and eastern North America: Best estimates and uncertainties, Seismol. Res. Lett., 68, 41–57, https://doi.org/10.1785/gssrl.68.1.41, 1997.
World Economic Forum (WEF): A vision for managing natural disaster risk, Proposals for public/private stakeholder solutions, 126 pp., available at: https://www.weforum.org/reports/vision-managing-natural-disaster-risk (last access: 23 April 2019), 2011.