the Creative Commons Attribution 4.0 License.
the Creative Commons Attribution 4.0 License.
 | 02 Jan 2020
From examination of natural events to a proposal for risk mitigation of lahars by a cellular-automata methodology: a case study for Vascún valley, Ecuador
Valeria Lupiano
Francesco Chidichimo
Guillermo Machado
Paolo Catelan
Lorena Molina
Claudia R. Calidonna
Salvatore Straface
Gino M. Crisci
Salvatore Di Gregorio
Lahars are erosive floods, mixtures of water and pyroclastic detritus, known for being the biggest environmental disaster and causing a large number of fatalities in volcanic areas. Safety measures have been recently adopted in the threatened territories by constructing retaining dams and embankments in key positions. More disastrous events could be generated by the difficulty of maintaining these works in efficiency and for the changed risk conditions originating from their presence and the effects of their functioning. LLUNPIY/3r, a version of the cellular-automaton model LLUNPIY for lahar simulations, is presented. The growing frequency of lahars in the Vascún valley of Tungurahua volcano (Ecuador), probably due to the effects of the climatic change, has recently produced smaller and less dangerous events, sometimes favored by the collapse of ponds generated by small landslides. An investigation is performed here in order to reproduce such situations in a controlled way by the use of LLUNPIY/3r simulations. Using precise field data, points are individuated where dams by backfill, which are easy to collapse, can produce the formation of ponds; LLUNPIY/3r simulations permit projecting the triggering of small lahars by minor rainfall events or projecting, in the case of more rainfall, the anticipation of lahar detachment, avoiding simultaneous and dangerous confluence with other lahars.


1.1 The problem of the lahars
Lahars are one of the most devastating phenomena in terms of the number of fatalities they cause in volcanic areas (Neall, 1976; Waythomas, 2014). They are flows other than the common stream flow and consist of pyroclastic deposits mixed with water. Their physical properties (density, viscosity, and consistency) are very similar to wet concrete that has not yet hardened (Vallance, 2000). This fluid, under steep-slope conditions, is capable of reaching speeds up to 100 km h−1 and distances up to 300 km, and it becomes solid when water is gradually released in flat areas (Manville et al., 2013).
Lahars may be of a primary type (or syneruptive) if directly related to volcanic eruptions; usually when glaciers and/or snow are melted by pyroclastic or lava flows, they develop from mixing pyroclastic material with water, as in the tremendous 1985 Colombian event of Nevado del Ruiz (Pierson et al., 1990). Another case could occur when a large quantity of water is available from the breakout of a natural lake because of eruption (Manville, 2010).
Secondary lahars are produced when a large water quantity is available directly by extreme meteorological events or indirectly by the overflow of superficial water bodies. Pyroclastic deposits of previous eruptive activities are mobilized, e.g., the pyroclastic flows of Mt. Pinatubo in 1991 in the Philippines (Rodolfo et al., 1996).
Soil erosion with water inclusion along streams increases the volume of both primary and secondary lahars.
Two main triggering mechanisms are possible.
- a.
The mobilization process is related to pyroclastic sediments sometimes mixed with some exotic material (tephra): if the superficial water amount exceeds a water height threshold, related to features of pyroclastic stratum and soil slope, then the percolation can cause a detachment in the unconsolidated stratum.
- b.
The erosion process mainly depends on the redistribution of volcanic sediment along the slopes (Leavesley et al., 1989; Major et al., 2000): unconsolidated tephra, swept away by flows, mixes with water and gradually enlarges its volume because of the contribution of both sediments and water (Barclay et al., 2007).
Different approaches were considered in literature for lahar modeling: empirical models (e.g., Schilling, 1998; Muñoz-Salinas et al., 2009) were developed, accounting mainly for some macro-observable phenomena, simplified hydrological and rheological models were developed that reduce the lahar behavior to a Newton-like behavior (e.g., O'brien, 1993; Costa, 1997), numerical methods were developed for approximating partial differential equations (PDEs; e.g., Pitman et al., 2003), and the cellular-automata (CA) alternative methodology was developed for lahar modeling, which will be shown later.
In many issues regarding complex systems, research was able to progress thanks to computer simulations, which allowed for developing multidisciplinary and transdisciplinary approaches, linked in part to the emergence of alternative computing paradigms, such as CA (Toffoli, 1984; Chopard and Droz, 1998; Iovine et al., 2007).
1.2 Multicomponent or macroscopic cellular automata
CA is both a parallel computational paradigm and an archetype for modeling “complex dynamical systems”, which are extended into space and can be described on the basis of local interactions of their constituent parts. A homogeneous CA can be seen as a d-dimensional space, partitioned in cells of uniform size, each one embedding an identical input–output computing device (a finite-state automaton). Input for each cell is given by the states of the neighboring cells, where the neighborhood conditions are determined by a time- and space-invariant pattern. At the time t=0, cells are in arbitrary states (initial conditions) and the CA evolves by changing them simultaneously at discrete times (CA step), according to the transition function σ: Sm→S, where S is the finite set of the states and m is the number of the neighboring cells (Di Gregorio and Serra, 1999).
A short exemplification is given by the CA majority: a two-dimensional space is divided into square cells so that the neighborhood of one square is given by the single element itself together with the eight surrounding it. Their states are blue (0) and red (1) and are added together within the neighborhood by the transition function. If the sum is more than 4 (the majority of neighbors are red), the next state of the cell will be red; otherwise it will be blue. Sometimes the system evolves from an initial distribution of reds and blues in a complex way, causing expansions of red and blue colors from some areas (Toffoli, 1984).
When complex macroscopic dynamical systems, like “surface flow” phenomena (lahars, debris flows, snow avalanche, lava flows, and pyroclastic flows), are modeled, the previous definitions are insufficient, and the following extensions were adopted for the multicomponent or macroscopic CA (MCA).
The abstract CA must be related univocally to the real phenomenon in its dynamics, and each cell has to correspond to a portion of the space or surface (of the territory T) where the phenomenon evolves; thus the time corresponding to a step of the transition function has to be set, and the size of the cell has to be specified, e.g., by the length of its edge. These constant values in time and space are called global parameters. P is the set of global parameters, and it includes both physical and empirical parameters. The choice of some parameters is imposed, where possible, by the precision that must be achieved in the simulation, e.g., cell dimension. The value of some other parameters is deduced instead by the physical features of the phenomenon, e.g., the parameter related to energy dissipation by turbulence. In these cases, the initial physically sounding value considered at the beginning of validation is corrected by attempts in the phase of model validation on the base of the simulation quality, depending on the comparison between the real event and simulation results. A methodology based on genetic algorithms was usually used for calibrating the parameters of our CA models of surface flows (Iovine et al., 2005).
Each characteristic, relevant to the evolution of the system and relative to the spatial portion corresponding to the cell, is individuated as a substate. The finite set Q of the states is given by the Cartesian product of the substates: . Examples of a lahar model substates related to the part of territory corresponding to a cell are the average altitude (substate altitude), the thickness of the lahar (substate lahar thickness), and the depth of the erodible (unconsolidated) pyroclastic stratum (substate pyroclastic stratum depth). The dynamics of the phenomenon is expressed by the variation in the substate values in the successive steps of simulations for each cell. Considering that the features related to the third dimension may be expressed in terms of substates, it is possible to develop two-dimensional models operating three-dimensionally in reality (Avolio et al., 2012).
MCA has to account for phenomena whose dynamics involves more interacting processes, sometimes of different nature, e.g., loss of lahar energy because of erosion of the unconsolidated pyroclastic stratum of the “cell” and loss of energy of the lahar in the cell caused by its turbulence. These interacting processes compose the transition function and are called “elementary” processes of the CA. They are computed sequentially, involving the update of the MCA substates.
The last extension of MCA is the “external influences”, which account for input from the “external world” that does not depend on local interactions (that cannot be reduced to local interactions) occurring at some cells of the CA; e.g., the external influence “lava alimentation at the vents” is applied, at each step, only to those cells corresponding to the locations where the vents actually are. The value of the substate “lava quantity” is updated by adding the amount that is considered to be discharged (in the case of simulation of a real event) or that is supposed to be discharged (in the case of simulation of a conjectured event) in the cell during the time step (Di Gregorio and Serra, 1999).
Simulations of flow-like landslides have been performed by several versions of the MCA model SCIDDICA since 1987 for both subaerial and subaqueous debris, granular, and mudflows (e.g., Barca et al., 1987; Avolio et al., 2008, 2013; Mazzanti et al., 2010; Lupiano et al., 2014, 2015a, b, c, 2017). Simulations of primary and secondary lahars were performed by the MCA model LLUNPIY (Machado et al., 2014, 2015a, b; Chidichimo et al., 2016).
LLUNPIY, SCIDDICA-SS3, and SCIDDICA-SS2 are our most advanced models (in the sense that they include the features of the previous models plus other new ones) for simulating flow-like landslides and lahars. Unlike other models, which were used in lahar simulations (LAHARZ – e.g., Schilling, 1998; Muñoz-Salinas et al., 2009; TITAN2D – e.g., Sheridan et al., 2005; Williams et al., 2008; Córdoba et al., 2015), they allow the implementation of the erosion process.
1.3 Strategies of risk mitigation for lahars
Reliable simulation tools are very important in order to develop risk mitigation strategies and to test them in different conditions. Such instruments have to be used with extreme caution because the complex problem of the lahar hazard must be studied with an interdisciplinary approach (Lane et al., 2003; Leung et al., 2003); e.g., mitigation measures which involve engineered protection structures could modify hazard conditions in time and could increase the disaster risk, as better specified below.
Besides tools of early warning, which could work only partially, and aside from temporary or definitive land evacuation, which could involve a strong social impact and economic destitution, security measures have been adopted in volcanic territory by constructing retaining dams, embankments, walls, dykes, levees, and reservoirs in key positions for containing and deviating possible lahars (Scott, 1989; Verstappen, 1992; Aguilera et al., 2004; Künzler et al., 2012; Carey et al., 2012). This solution could involve a strong environmental impact: it is difficult to guarantee the constant efficiency of these works, and their presence, together with the effects of their functioning, could severely change the risk conditions (Janda et al., 1981, 1996; Scott, 1989; Procter et al., 2010; Shreve and Kelman, 2014; Wisner et al., 2012). A short paper of Kelman (2007) underlines the following:
Despite decades of evidence from research and practice demonstrating that reliance on structural approaches increases disaster risk over the long-term, structural approaches are frequently preferred without properly considering complementary or alternative measures. Examples of structural approaches are walls, dams, dykes, levees, and reservoirs. While they do provide some benefits, decisions to implement them and nothing else are usually made by emphasizing the short-term benefits and discounting the long-term costs.
The growing frequency of lahars in the area of the Vascún valley of the Tungurahua volcano, Ecuador, has recently produced smaller (shorter accumulation periods) and therefore less dangerous events (Mothes and Vallance, 2015). Moreover, small landslides, forming natural dams with temporary ponds, could easily trigger lahars by collapsing because of rainfall. This sometimes happens; e.g., the IGEPN (Instituto Geofísico Escuela Politécnica Nacional, Quito, Ecuador) reported such a case on 23 August 2008 (IGEPN, 2008a, b). These extraordinary combinations of events resulted in the idea of using the overabundant pyroclastic material, available on-site, to create easy-to-collapse artificial dams. The dam breakdown is obtained through the appropriate sizing of the cross section of the structure which is designed to fail at the achievement of a specified water level. This goal is reached through the implementation of an ad hoc numerical model, based on the finite element method (FEM), for the stability analysis of the dam slopes.
For such points, minor rainfall events can produce small lahars, and major events will anticipate the lahar detachment, avoiding simultaneous confluence with other lahars. The control of the dams collapse could permit, in various situations, many combinations for a controlled triggering of lahars in order to mitigate the risk.
The next chapter is devoted to the geological description of the Vascún valley, and the third chapter introduces LLUNPIY/3r, the MCA model for simulating primary and secondary lahars, together with its validation in simulating some significant lahars of Vascún valley. In the fourth chapter, if the building of dams that are easy to collapse is considered, then their favorable locations are hypothesized for a controlled triggering of lahars, the effects of which are simulated for possible events. At the end of the paper are conclusions and comments.
Tungurahua is one of the most active and dangerous volcanoes in the Ecuadorian Andes (Cordillera Oriental) on the inside of Sangay National Park; its summit, at 5023 m a.s.l., is positioned at 01∘28′ S latitude and 78∘27′ W longitude. It is a stratovolcano, whose evolution has involved the succession of three major volcanic edifices (Tungurahua I, Tungurahua II, and Tungurahua III) since the Middle Pleistocene over a basement of metamorphic rocks. Historical eruptions have all originated from the summit crater. The main events of eruptive activity occurred during the following years: 1640–1641, 1773–1777, 1886–1888, 1916–1918, and from 1999 to the present (Hall et al., 1999; Mothes et al., 2015; Biggs et al., 2010). The average frequency of eruptions in the last 2000 years is once per century, according to the detailed studies of Le Pennec et al. (2008). They have been accompanied by strong explosions and sometimes by pyroclastic flows and lava flows that reached populated areas at the volcano's base. The formation of rain-induced lahars is also a cause of danger. Approximately 32 000 people live within the higher-risk areas, mainly in rural villages and in the touristic (thermal springs) town of Baños de Agua Santa (Mothes and Vallance, 2015). Baños de Agua Santa (1800 m a.s.l.) is only 8 km from the summit; 30 km to the NW, 30 km to the SW and 140 km to the N are the distances to the summit, respectively, from the towns of Ambato and Riobamba and from the capital Quito.
The small glacier of Tungurahua volcano is reduced both by the global warming phenomenon and by the intensification of the volcanic activity after 1999; therefore today's snow cover is completely negligible in terms of primary lahar generation. Lahar triggering, with significant frequency and magnitude, is hence subordinate to both to the intensity and duration of the rainfall and the available quantity of fresh material (cumulated unconsolidated pyroclastic material from volcanic eruption) along the slopes and within the principal canyons (Quebradas of the Vascún River, Juive Grade – La Pampa valley, and Achupashal Quebrada) and, to a lesser extent, to other factors. Almost all the lahars are confined to the canyons and converge into the Pastaza River (Mothes and Vallance, 2015).
The eruptive activity of Tungurahua volcano, during the last years, has generated a greater availability of pyroclastic debris that is periodically remobilized from atmospheric phenomena, often not particularly violent but prolonged for several days. Between 2000 and 2011, around 900 rain-induced lahars were triggered (Mothes and Vallance, 2015).
Generally, lahar magnitude is small and, consequently, causes limited damage. Precious data were supplied by the IGEPN, Quito, Ecuador, and its survey stations around the country (https://www.igepn.edu.ec/, last access: 2 December 2019); it is the ultimate authority for various volcanic hazards and earthquakes. IGEPN and its Acoustic Flow Monitor (AFM) station detect the passage of the majority of secondary lahars (e.g.: IGEPN, 2005, 2008a, b), while many others are traced by the Observatory of the Volcano Tungurahua (OVT), which is situated 13 km to the north–northwest of the crater, also with the observation contribution of local volunteers (vigias).
The 2005 and 2008 secondary lahars of Vascún valley
Vascún River gave its name to the valley on the NE flank of Tungurahua volcano; it flows into the Pastaza River (Fig. 1). The valley slopes exceed 35–40∘ in the first (steepest) 3 km, while they range from 20 to 6∘ in the last (less steep) 2–3 km. Furthermore, the path of Vascún River is extremely sinuous in the upper 1–2 km, where the river is characterized by a succession of tight 90∘ bends.
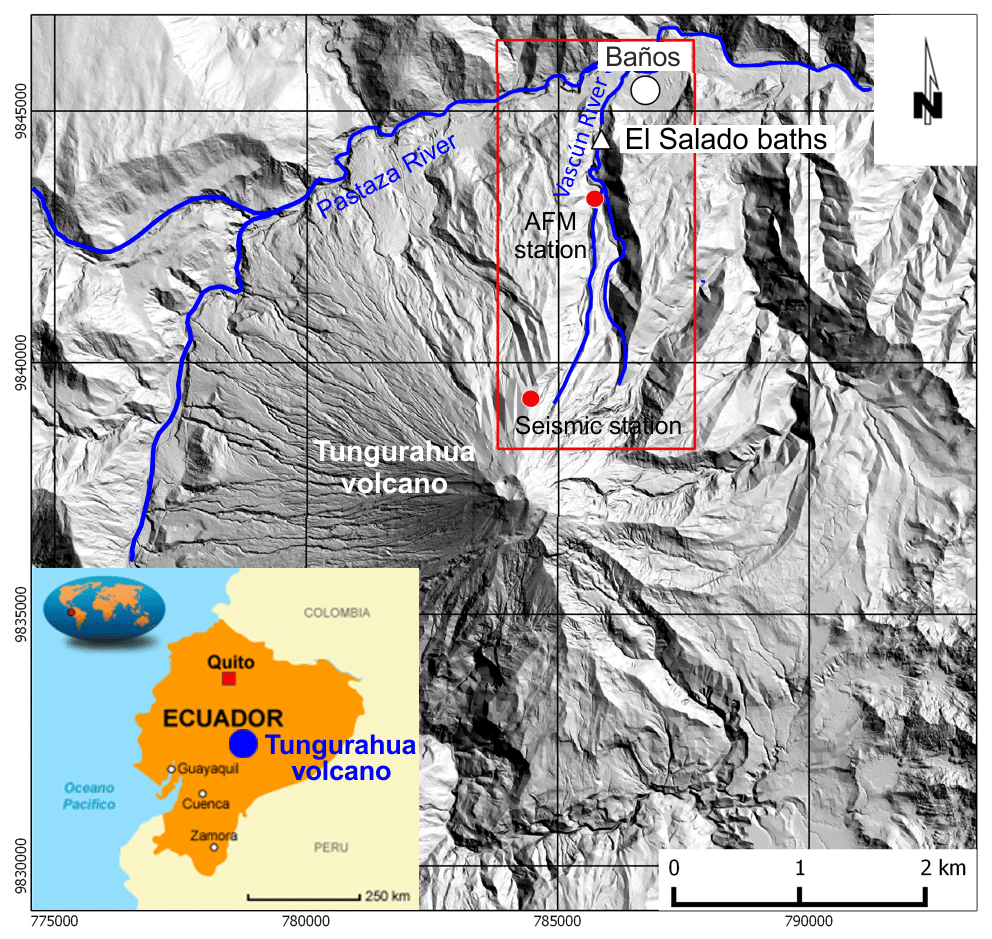
Figure 1Tungurahua volcano. The Vascún valley is inside the red box.
The Vascún valley is highly susceptible to lahar flows that threaten the nearby populated areas which were inundated several times in the past years: the town of Baños, which extends into part of the depositional area, was affected several times; the thermal structure “El Salado”, which is located along the river banks, had been repeatedly damaged by passage of lahars (Fig. 2b).
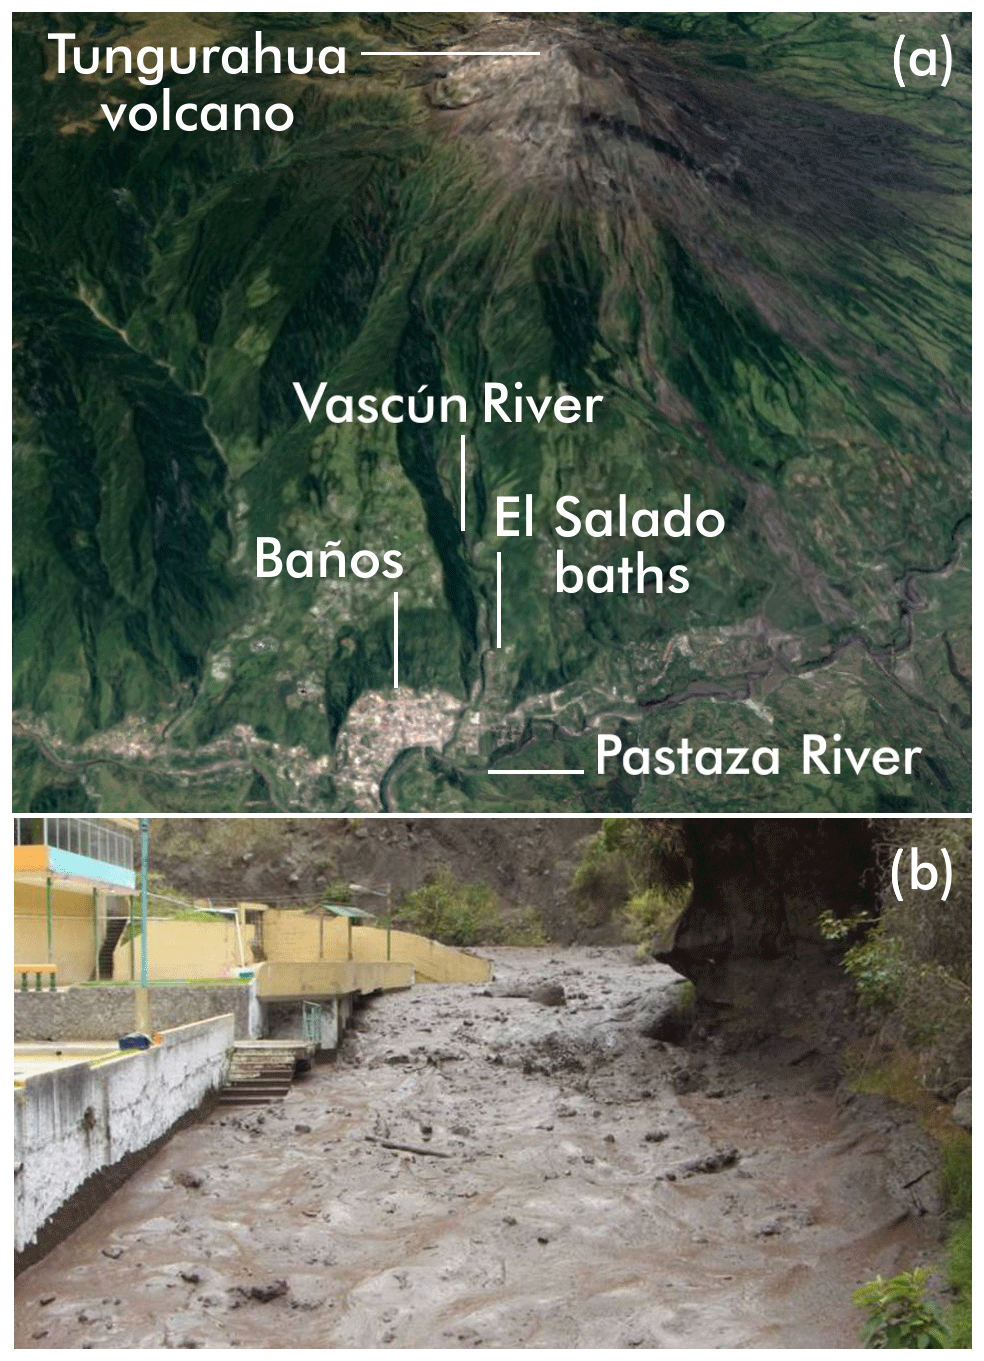
Figure 2(a) © Google Earth view of Tungurahua volcano with indication of main localities of the study area; (b) 2005 lahar at thermal structure “El Salado”.
For LLUNPIY/3r calibration and validation, two events were taken into consideration, which took place, respectively, in 2005 and 2008. The dynamic of the events is briefly described below.
On 12 February 2005, heavy rainfall caused the remobilization of ash fall deposits, generating lahars in the Vascún River valley. The mean velocity, estimated on the base of data recorded by the alert instrumentation, varied between 3 and 7 m s−1 (Williams et al., 2008) according to the morphological characteristics of valley that crossed the sector. The lahar volume, measured by the staff of the AFM station, was estimated at approximately 70 000 m3, while a subsequent investigation, carried out by IGEPN (2005), estimated it to be 55 000 m3. The lahar crossed the valley for about 10 km, flooding the El Salado baths during the passage, and then reached the Pastaza River. The chronicle of the event is taken from the work of Williams et al. (2008), and we refer to their data and simulations for comparison with our simulation.
The 2008 lahar had a different dynamic. On August 13, a small landslide produced a natural dam along Vascún River at an elevation of about 2200 m a.s.l. The dam originated a pond with a length of 100 m, a depth of 3 m, and a width of 20 m. After heavy rains on 22 August, the dam collapsed and generated a lahar. The flow velocity was estimated in 15 m s−1, with a flow rate of 1120 m3 s−1 and an average height of 4 m (IGEPN, 2008a, b); this flow rate is 10 times greater than that recorded in the 2005 event (IGEPN, 2005; Williams et al., 2008). The lahar reached El Salado in 5 min and devastated the pools of the thermal spa; afterwards it destroyed some houses in Las Ilusiones (a village in the Baños district) further downstream.
LLUNPIY (Lahar modelling by Local rules based on an UNderlying PIck of Yoked processes; llunp'iy means flood in the Quechua language) is a model for simulating secondary and primary lahars according to MCA methodology applied to a complex system, whose evolution may be mainly specified in terms of local interaction. MCA features of SCIDDICA-SS3 (Avolio et al., 2013) and SCIDDICA-SS2 (Avolio et al., 2008; Lupiano et al., 2016, 2017) are inherited by LLUNPIY; LLUNPIY for secondary lahars is extensively defined in Machado et al. (2015b). Here only the features of the model, which were applied in the study cases, are reported (reduced version LLUNPIY/3r from SCIDDICA-SS2). No external influences were considered. The LLUNPIY/3r simulation starts considering data related to the altitude (value of the “altitude” substate; see Sect. 1.2), to the depth of the erodible pyroclastic stratum (value of the “soil of the cell” substate; see Sect. 1.2), and to the lahar thickness (value of the “thickness of the lahar” substate; see Sect. 1.2) for each cell.
A reliable reconstruction of the first phase of a real event of a lahar permits setting an “initial” moment, where it is possible to deduce the thickness of lahar in the territory; these data constitute the values of the substate thickness of the lahar in the first step of the simulation. In the case of the simulation of a lahar produced by the collapse of a dam holding a given water volume, the thickness of lahar is deduced by the mixing of pond water with the dam material and part of the unconsolidated pyroclastic stratum below. Note that the simulated lahar events, which occurred in the Vascún valley, do not involve the very first phase of water percolation and detachment subsequent to water inclusion (Machado, 2015), since the collapse of the temporary pond is abrupt. In the cases of past events, data permitted simulation of the phenomenon just in the phase of lahar. Furthermore, in the simulation of real and hypothesized events, all the lahars end in the Pastaza River, so the last phase of lahar deposition is omitted and the viscosity of the lahar may be considered constant for these particular cases.
3.1 Introduction to the LLUNPIY/3r version
The following quintuple defines the two-dimensional (with hexagonal cells) MCA model LLUNPIY/3r:
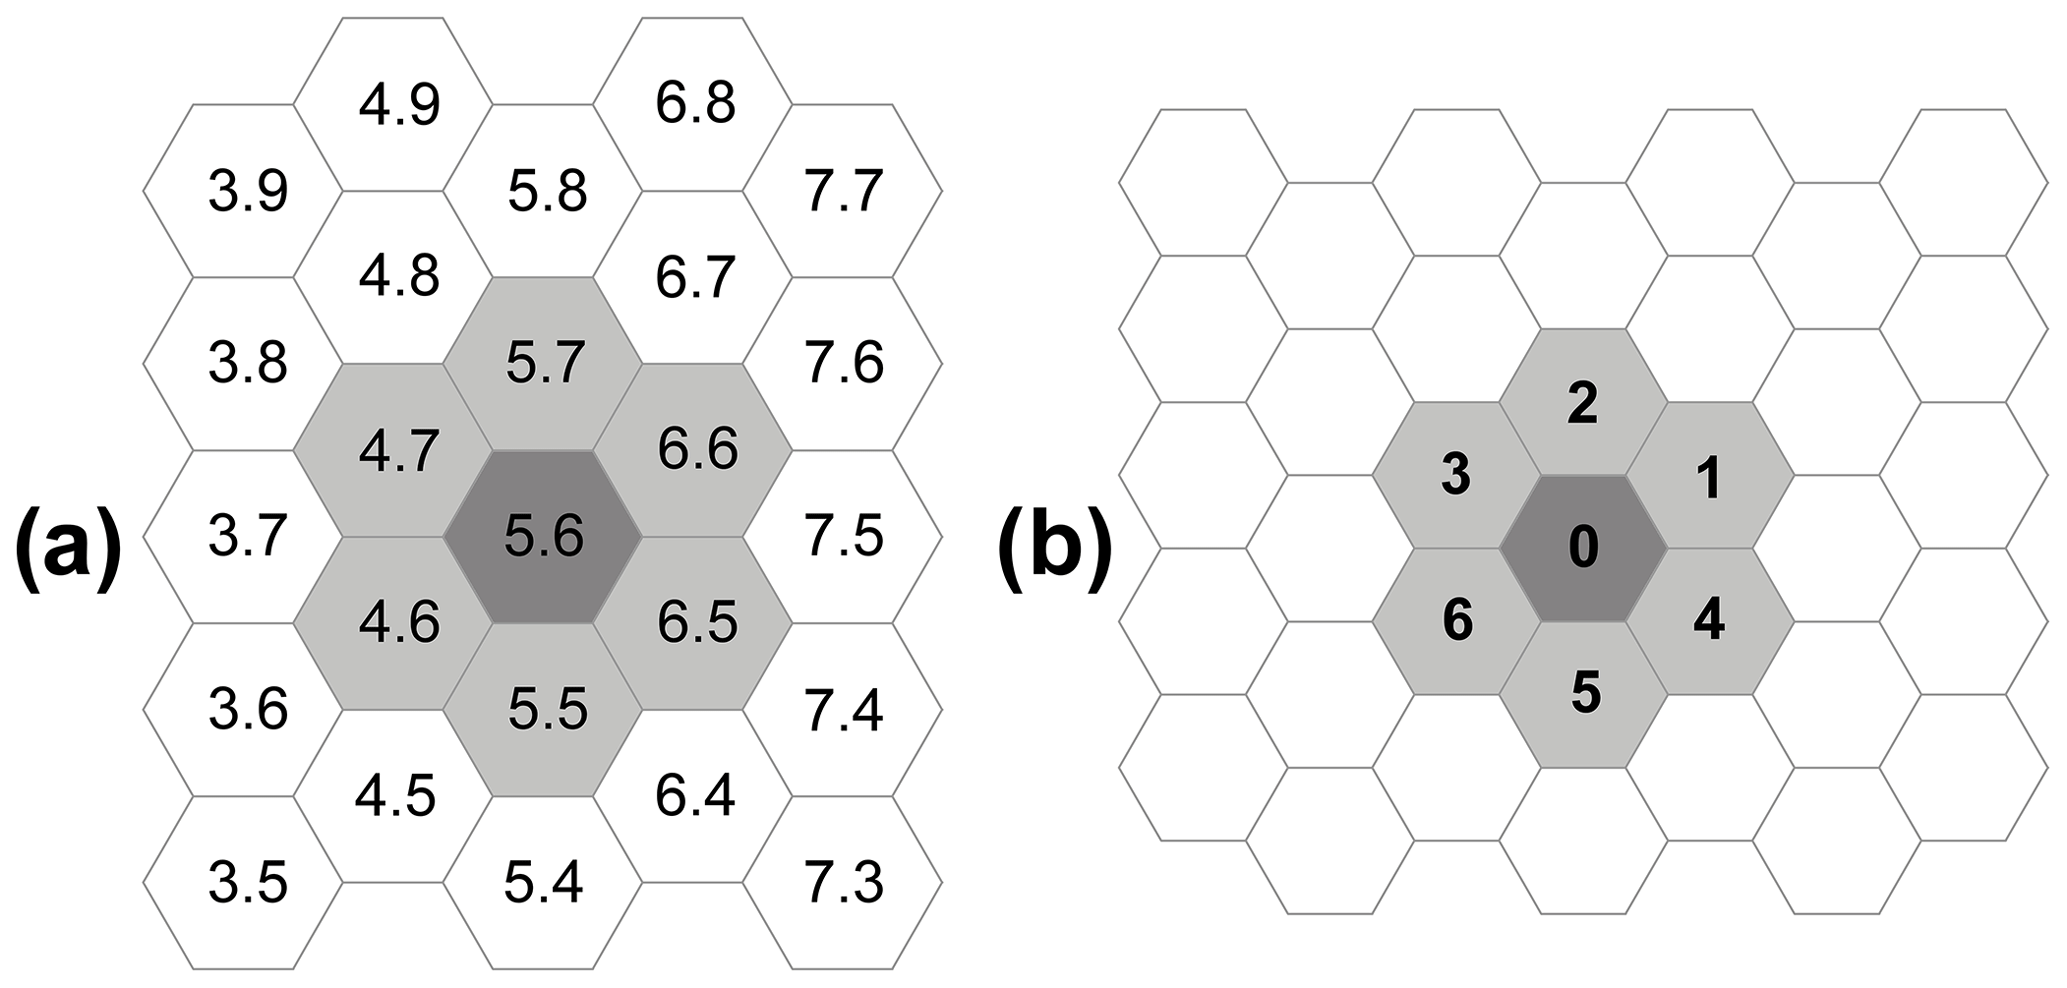
where , , is the set of hexagonal cells which tessellate the territory where the phenomenon evolves; the cells are individuated by the points with integer coordinates (Fig. 3, left) of their centers. ℕ is the set of the natural numbers.
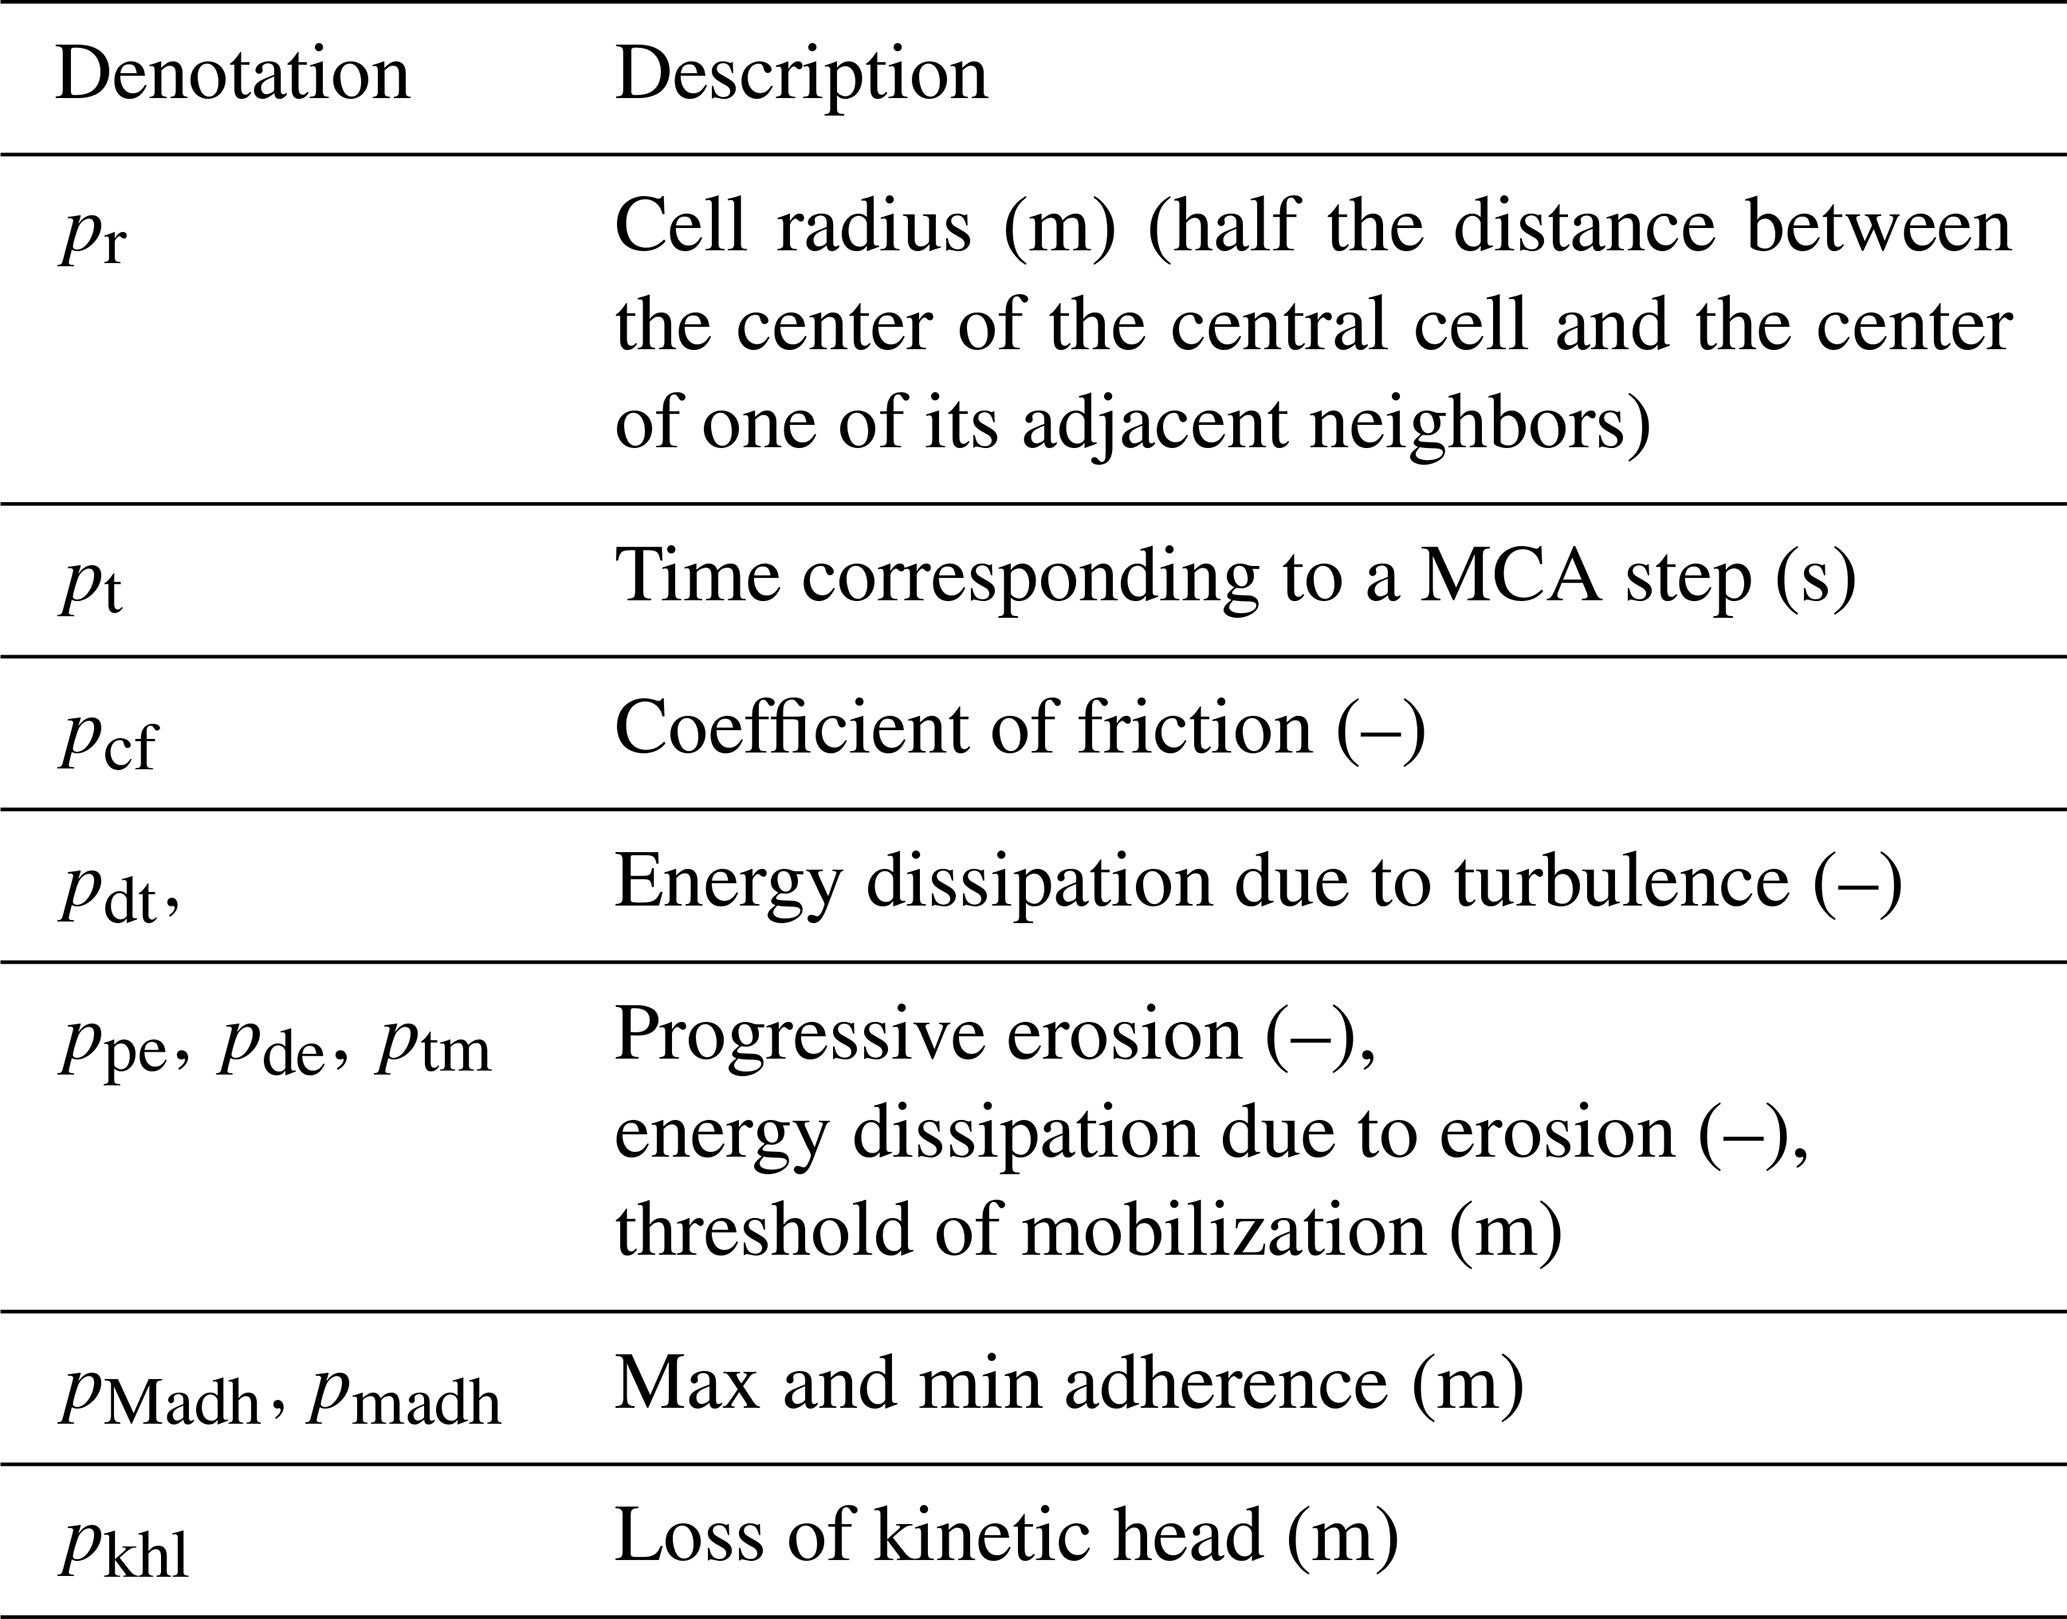
P is the set of both the empirical and physical global parameters. They are related to the global common features of the phenomenon (Table 1):
, , , , (0,1), (1,0), , the neighborhood, identifies the geometrical pattern of cells (Fig. 3a), which influences the state change of the “central” cell. Index 0 is assigned to the central cell, and indices are assigned to the six adjacent cells (Fig. 3b). N=7; the sum of indices of opposite directions is always 7.
Q is the finite set of states of the finite-state automaton incorporated into the cell; it is specified, in terms of substates, as their Cartesian product (Table 2).

σ: Q#N→Q is the deterministic transition function for each cell in T. The following elementary processes compose σ, and they account for the overall dynamics of the phenomenon:
-
τmob – effects of mobilization,
-
τlo – lahar outflows,
-
τte – effect of turbulence,
-
τfc – composition of flows.
Physical parameters concern physical quantities that are used in equations of the transition function and correspond to values adopted in the implementation of the model (e.g., cell apothem pa that depends on several factors, data precision, and insuperable approximation limits related to specific features of the phenomenon) or values as the temporal correspondence of a CA step pt, which must account for the fact that , where vmx is the maximum possible velocity of flows during the development of the phenomenon. In other words the shift of a flow in a CA step may not exceed the neighborhood value. All the parameters, except pa and pt, are empirically set in the phase of model validation by the simulation quality, and initial values of parameters were deduced by the physical features of the phenomenon; e.g., a very slow lahar would emerge unbelievably in a simulation by the largest values of pcf, the coefficient of friction, and pdt, the energy dissipation due to turbulence.
3.2 The elementary processes of LLUNPIY/3r
In the following, an outline of the transition function, with a description of the elementary processes updating the substates, will be provided. The complete execution of all the elementary processes accomplishes a step of the LLUNPIY/3r. The neighborhood index in square brackets, following substate specification, indicates the corresponding cell of the neighborhood. ΔQS indicates variation in the substate QS. indicates the new value of the substate QS, . In the case of external and internal flows, the cell to which the flow is directed is specified in the substate, inserting a subscript which precedes it, e.g., 2QE[1], or the external flow of the neighbor with index 1 toward its neighbor with index 2.
3.2.1 Pyroclastic cover mobilization
Soil features together with the quantity of water content determine a value ptm of the mobilization threshold to be compared with the kinetic head QKH associated to lahar debris QLT; when QKH>ptm, the pyroclastic cover QD is eroded, and the lahar thickness QLT augments and altitude QA diminishes according to the following empirical formula that turned out to be valid in different models of debris flow (e.g., Avolio et al., 2008), snow avalanches (Avolio et al., 2017), and primary and secondary lahars (e.g., Machado, 2015):
There is, correspondingly, a dissipation of energy proportional to the depth of erosion; it is specified by a decrease in kinetic head QKH according to the following formula:
3.2.2 Effect of turbulence
A loss of kinetic head occurs by turbulence at each LLUNPIY/3r step according to the following equation:
where pdt is an empirical parameter that accounts for the turbulence kinetic energy (Launder and Spalding, 1983). Such a parameter is referred to in LLUNPIY/3r as the substate QKH, which is directly related to the kinetic energy.
3.2.3 Lahar outflows
The variables f[i], , specify the outflows from the central cell toward the adjacent cell i; f[0] is the part remaining in the central cell. They are computed in two steps: application of the algorithm for the minimization of differences (AMD; Avolio et al., 2012; Di Gregorio and Serra, 1999) to the “heights” in the neighborhood of the central cell and calculation of the shift of f[i], (Avolio et al., 2013).
AMD application computes the outflows f[i], , which minimize the height differences in the neighborhood (Eq. 7). An alteration of height values is introduced in the central cell for taking into account the outflow run-up; furthermore the viscosity is modeled by an adherence “adh” term, the lahar quantity, which cannot leave the central cell. It varies between the two extreme values adh1 and adh2, which depend on the composition of the pyroclastic debris at the maximum and minimum water content (Machado, 2015).
This adherence method was initially used for modeling lava flows by CA in order to manage the continuous variation in viscosity by cooling of lava (e.g., Avolio et al., 2006). The approximation to account for viscosity in a CA context can be intuitively explained as follows. Without bringing a system into play in which innumerable fluid layers flow over one another, at most two layers are considered. The first layer, whose maximum thickness (adh) is determined by the coefficient of viscosity, cannot move if the thickness of fluid th exceeds adh, and a second layer with thickness th-adh is considered to slide onto the first one with a friction coefficient related to viscosity:
Each moving quantity f[i] (where in the following equation) may be considered to be a “cylinder”, at first entirely inside the cell, having a center of mass with coordinates QX[0] and QY[0] and with the maximum possible radius.
The shift “sh[i]” of f[i] is calculated according to the following formulae, where the movement of the mass center is specified as the mass movement on a constant slope with a constant coefficient of friction pcf. The movement of f[i] is directed towards the center of cell i with coordinates QX[i] and QY[i], considering the slope angle θ[i] (Fig. 4):
with “g” being the acceleration of gravity and “v” being the initial velocity,
There are three possible outcomes: if the shifted cylinder is completely inside (outside) the central cell, there is only an internal (external) outflow. Otherwise two cylinders form, with the mass center corresponding to the mass center of the internal outflow and that of the external outflow. The new positions (iQEX[0] and iQEY[0] and iQIX[0] and iQIY[0]) of external and internal outflow iQE[0] and iQI[0] account also for the variations in kinetic head iQKHE[0] and iQKHI[0].
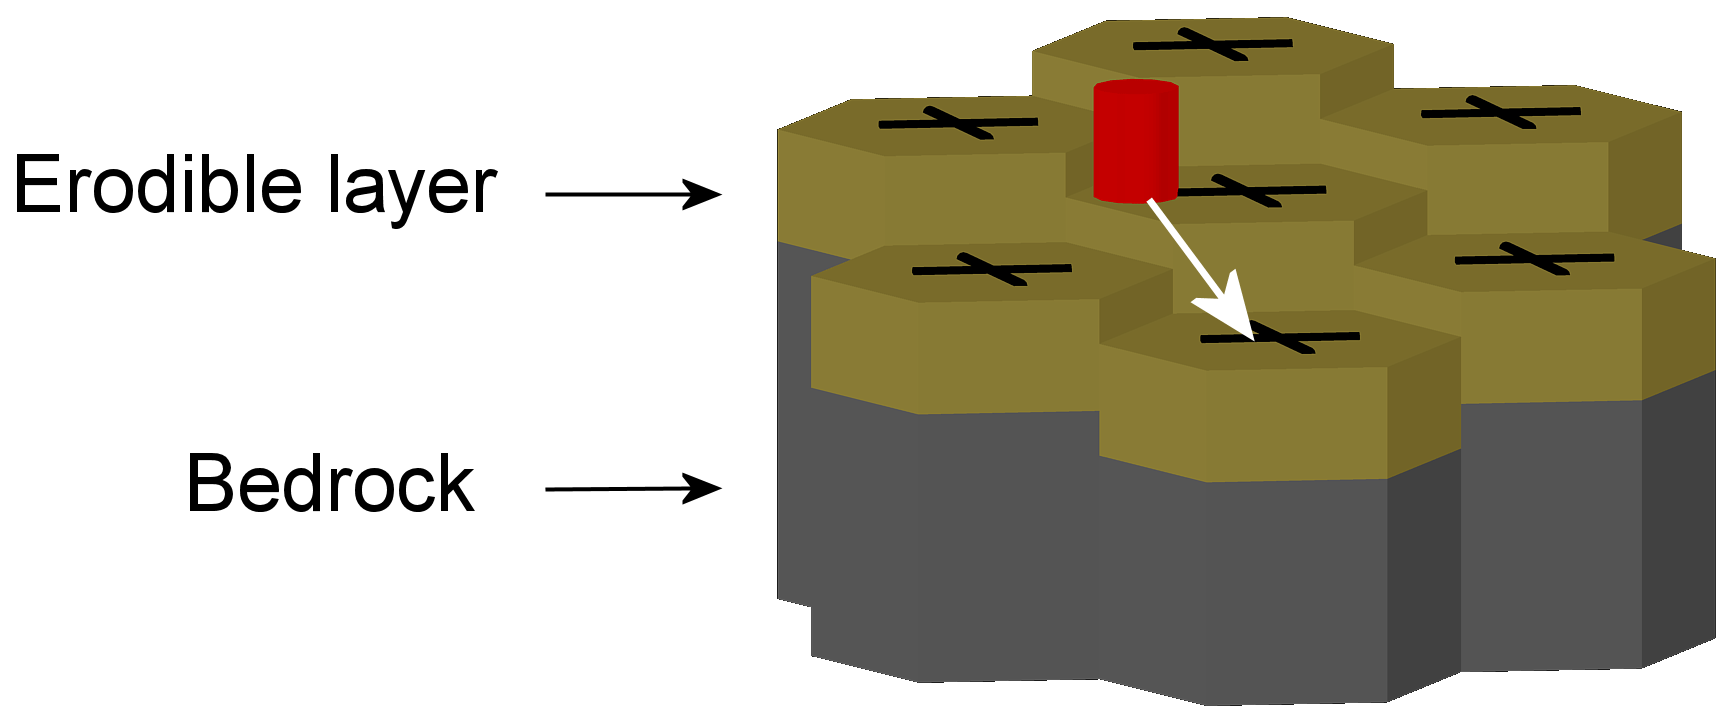
Figure 4Outflow direction from central cell to the center of an adjacent cell in three dimensions.
3.2.4 Flow composition
Execution of the elementary process “lahar outflows” involves an updating of substates QLT, QKH, QX, and QY by the elementary process “flow composition”. It accounts for the variation in the lahar content of the cell, i.e., variation in QLT and corresponding variation in QKH, QX, and QY that is determined by the external outflows QE; these represent inflows for the cells to which they are directed. Internal outflows QI determine just a shift inside the cell, with variations in the substates QKH, QX, and QY (Machado et al., 2015a, b).
The value of the substate QLT at the next step is given by its previous value minus the losses determined by the outflows iQE[0] from the cell (normalized to a thickness) plus the contributions determined by the inflows 7−iQE[i] from the neighbors:
The other substates change correspondingly, considering a weighted average
The shifts, both of the external flows and internal flows, have to be considered for the new values of coordinate substates:
3.3 LLUNPIY calibration and validation
We selected the 2005 and 2008 lahars of Vascún valley for LLUNPIY/3r version calibration and validation, respectively. Available data, although incomplete, of the flood phase (Machado et al., 2015b) seemed promising in obtaining reliable simulations. In fact, data of different sources were carefully compared and analyzed (Williams et al., 2008; IGEPN, 2008a, b) in order to reconstruct the two events as accurately as possible (Machado et al., 2015a, b).
The use of simulation tools (from the cellular-automata model LLUNPIY) requires detailed field data: the digital elevation model (DEM) and depth of erodible pyroclastic stratum. This implies accurate geological investigations, including subsoil tomography. Geophysical surveys allow individuating points where dams by backfill, which are easy to collapse, can enable the formation of ponds, whose breakdown can trigger a lahar (Machado, 2015; Chidichimo et al., 2016).
The simulation of the 2005 event is based on a DEM with a 1 m cell size (supplied to us by Gustavo Cordoba), while the 2008 lahar was performed with a DEM with a 5 m cell size (supplied by IGEPN). In both cases a uniform thickness of 5 m was imposed for detrital cover because detailed surveys were not available. This introduces a series of approximations that negatively influence the results of simulations. Such approximations can be reduced by an opportune survey of field data, e.g., by soil tomography, multichannel analysis of surface waves (MASW), coring, etc.
The same set of LLUNPIY/3r parameters was used in the two cases except for the parameter of progressive erosion (ppe) because of different percentages of water in the soil. The 2005 event was triggered in a higher and very steep zone of Vascún River, when the water concentration in the soil reached critical values due to rainfall. The 2008 event was dissimilar because the breaking of a temporary pond suddenly released a larger water quantity (in comparison with 2005 case) with strong turbulence, whose effects correspond to a higher value of the parameter of progressive erosion (Machado et al., 2015b).
The results of the simulations of the 2008 event (Machado et al., 2015b) are extensively reported in this study, since this event, as previously mentioned, was caused by the same type of phenomenon whose development we want to forecast. The reliability of the simulation results, in comparison with the real event, led us to confide in the goodness of the method. The new simulations were performed with the same data precision and the same values of parameters.
Simulations of the 2005 event were limited by the partial data field and digital terrain model (DTM) information: a stretch of about 2.3 km, from an elevation of 2150 m a.s.l. (about 850 m upstream of El Salado baths) to an elevation of 1900 m a.s.l. (in correspondence of Pastaza River), was considered. The area where the simulation starts does not concern the detachment phase that occurs 8 km upriver. A kind of detachment where an initial velocity of 7 m s−1 was imposed to lahar was considered in order to express the first arrival of lahar flows. An equivalent fluid approach was adopted because precise data about water flows are not available. Therefore, bulking must account not only for the erodible layer but also for water inclusion. The total mass is inclusive of the water mass. This generates a discrepancy between the lahar volume, measured on the deposit, and the “fluid” lahar volume including water to be lost in the last part of the event.
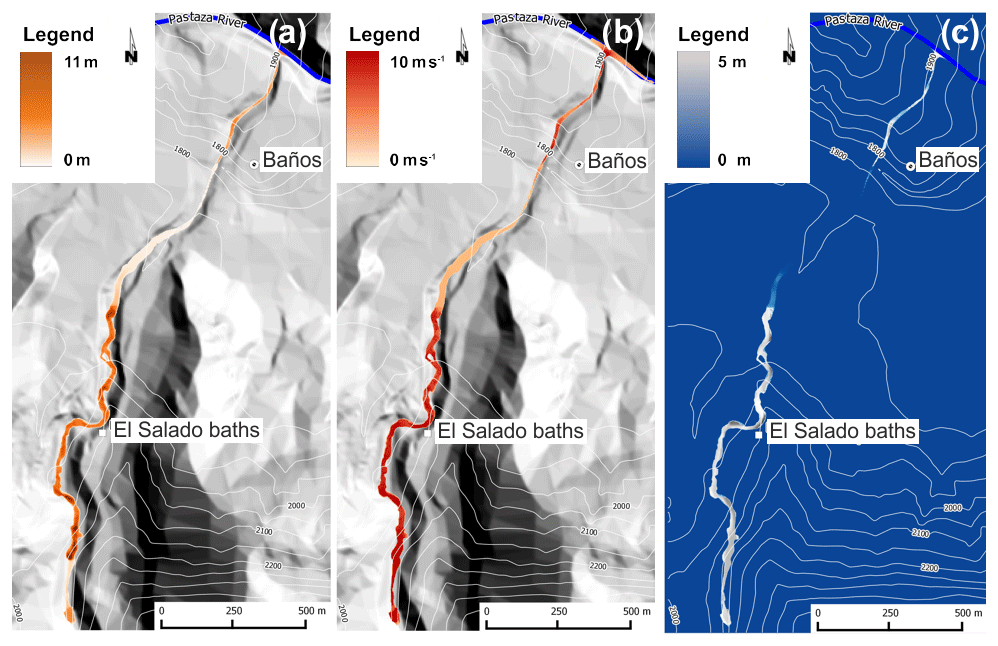
Figure 5(a) Maximum thickness, (b) maximum velocity, and (c) erosion depth, in 2005 simulated event.
Table 3Comparison among field data and TITAN2D and LLUNPIY simulation data.
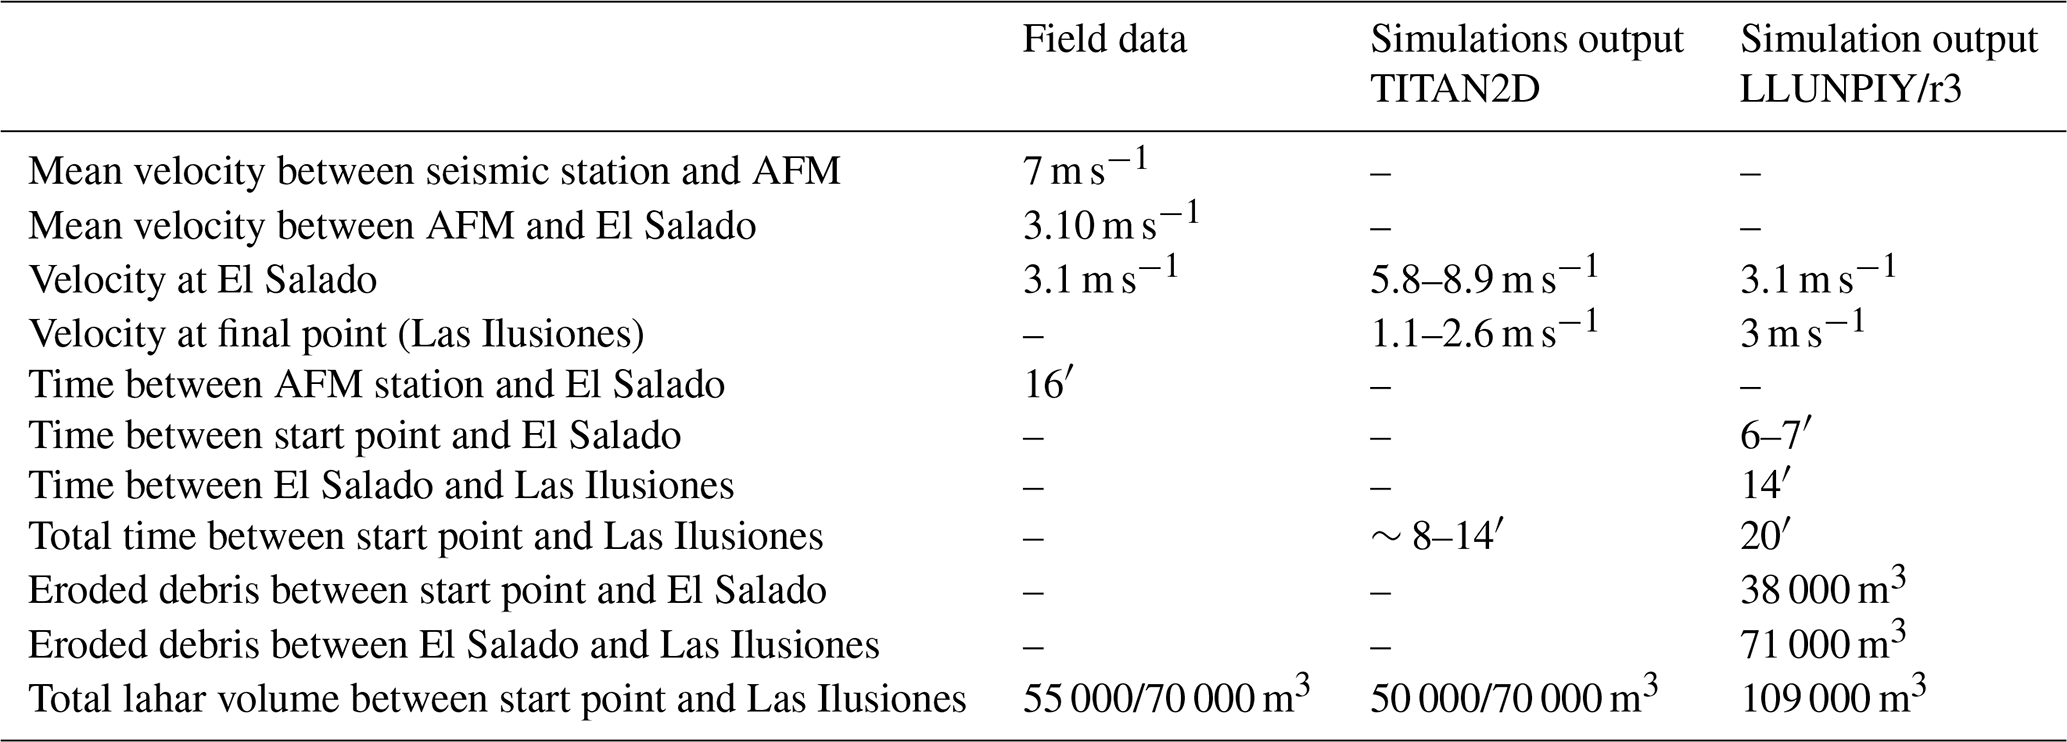
Figure 5 shows the simulation developed with LLUNPIY in the considered sector. In particular, the maximum debris thickness values, which were reached by the lahar in simulation, are reported in Fig. 5a. Maximum velocities, reached by simulated flows (Fig. 5b), are high in steeper areas (the expected result) and gradually decrease at the downstream outlet. A velocity increase occurs south of Baños, probably because of the higher gradient of the river bed. Erosion has a trend similar to that of velocity (Fig. 5c). Table 3 synthesizes values of Fig. 5 and compares such data with IGEPN field data, reported in IGEPN 2005, and with simulation performed by TITAN2D (Williams et al., 2008). Such field data are obviously a part of the complete development of catastrophic phenomenon but extremely precious for the comparison with our simulations. Observation data are not sufficient for a precise comparison with the simulation paths. Furthermore, the lahar starts with null velocity in the simulation of (Williams et al., 2008), while LLUNPIY simulations start with 7 m s−1 velocities. The difference for total eroded mass rises from the lost water volume that was not possible to be considered in measurements.
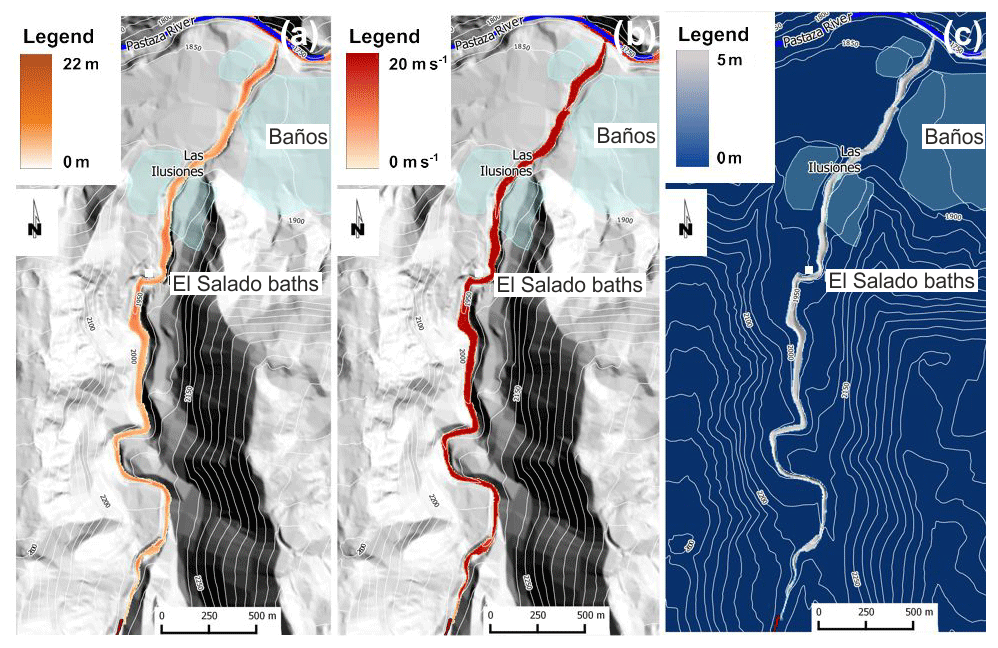
Figure 6The 2008 simulated event. (a) Maximum thickness, (b) maximum velocity, and (c) erosion depth.
The simulation of the 2008 lahar is shown in Fig. 6: the flow speed reached values up to 20 m s−1 in many areas of the valley, and the eroded material resulted in a volume of about 970 000 m3. The maximum height obtained in the simulated flow (Fig. 6a), in some sectors where the valley is particularly narrow, is 22 m, while the estimated average value by IGEPN (2008a, b) is 4 m.
Table 4 compares some data of the simulation by LLUNPIY with corresponding field data of IGEPN (2008a, b). It is possible to note that the data derived from the simulations are not very different from the known measured ones. The flow velocity of 15 m s−1 represents an estimated value and not a measured one. These results demonstrate that LLUNPIY/3r is a reliable model given that the simulations are based on incomplete and sometime very approximate data concerning the pre-event and post-event. Furthermore the inevitable errors, in the records related to this event, have to be considered. Therefore an extension of LLUNPIY/3r is promising in order to introduce secondary features of the phenomenon to be tested. Simulations reproduce satisfactorily the overall dynamics of the events: there is good matching between the real and simulated lahar path and the velocity and height of detrital flow. Note that different approaches always obtain excellent results about the path because the lahar is canalized by steep faces.
4.1 Building rudimental dams that are easy to collapse
Ponds form along watercourses in volcanic areas, when landslides of volcanic deposits, which are originated by pyroclastic flows and lahars, act as a dam by obstructing the stream bed. The most frequent cause of a breakout of such natural ponds is the overflow of water across the newly formed dam during violent rainfall and subsequent erosion and rapid cutting down into the loose rock debris. The classification of the Glossary of Meteorology of the American Meteorological Society for rainfall intensity (Glickman, 2000) is here adopted according to the rate of precipitation Rp (measured in mm h−1):
-
light rain – Rp<2.5 mm h−1,
-
moderate rain – 2.5 mm h mm h−1,
-
heavy rain – 10 mm h mm h−1,
-
violent rain – Rp>50 mm h−1.
Dam collapse occurs when instable conditions arise on the downstream slope. By eroding the obstruction and flowing downstream along the river bed, the initial surge of water will incorporate a dangerous volume of sediments. This can easily produce lahars, with possible devastating effects for settlements in their path (Leung et al., 2003).
Temporary dams with a similar (but controlled) behavior can be designed and built at low cost by local backfill in order to allow the outflow of streams produced by regular rainfall events. This result is achieved by properly dimensioning the embankment according to a stability analysis. This is made by comparing the forces tending to cause movement of the mass of pyroclastic material (force of water) with those tending to resist the movement (soil strength; Lambe and Whitman, 1979). The aforementioned approach is traditionally adopted to prevent dams failure, but it will be used, in this case, to ensure their collapse at a specific water level. During rainfall events, in fact, the barred canal section fills up rather quickly, so the hypothesis behind the simulations is that the dam reaches the instability conditions for the achievement of a given hydraulic head rather than for other processes (e.g., erosion), since the first destabilizing condition is reached faster than the others which require longer times to be effective.
The FEM was applied to perform the downstream slope stability analysis. The shear strength reduction (SSR) approach, which is one of the most popular techniques to perform FEM slope analysis, was adopted (Griffiths and Lane, 1999). The SSR is simple in theory: it systematically reduces the shear strength envelope of material by a factor of safety (FS) and computes FEM models of the slope until deformations are unacceptably large or solutions do not converge. In classical soil mechanics, the factor of safety is the ratio of the shear strength at the plane of potential failure τf and the shear stress acting in the same plane τ, namely
For the Mohr–Coulomb criterion, the previous equation reads
where c is the cohesion and ϕ is the friction angle of the material; sn denotes the total normal stress and u the pore pressure. For the Mohr–Coulomb model, a “reduced” set of material parameters c∗ and ϕ∗ is computed:
The problem is then solved using this set of reduced material parameters while keeping all other parameters unchanged. If convergence is obtained, the FSn value is increased and the problem is solved again. The lowest FSn producing non-convergence is reported as the “factor of safety” of the problem. If the resulting FS is greater than 1, for a given water level stressing the upstream slope of the dam, the structure is stable. If the iterative procedure gives back a unitary FS value, the limit equilibrium conditions have been reached. This means that the coupling of both the dam geometrical configuration and the water level situation are going to produce the collapse of the structure. This last condition is the one that must be reached for the study purposes. The pore pressure distribution inside the dam body is fundamental input for the strength reduction analysis. Such distribution is obtained as a function of the hydraulic head stressing the upstream slope of the embankment. The filtration process, implemented in the finite element model, is based on the solution of the Laplace equation (Straface et al., 2010, 2011; Molinari et al., 2014; Chidichimo et al., 2015, 2018):
where h(x,y) represents the hydraulic head distribution within the dam body, which is a function of the hydraulic conductivity of the dam material. Such dependence is defined by Darcy's law:
where q is Darcy's velocity, K is the hydraulic conductivity, ρ is the water density, u is the pore pressure, and z is the elevation above sea level. Several simulations were performed by taking the parameters for the numerical model from the literature. Studies performed on the geotechnical properties of the volcaniclastic formation that is found in the Andes of Ecuador and Colombia, known as Cangahua, reported that the dry unit weight of the material was found to range around 14 kN m−3 (Bommer et al., 2002). The strength parameters of volcanic sediments produced by recent eruptions were investigated by Orense et al. (2006), who found a value for the friction angle (ϕ) of these materials of about 40∘, while the cohesion (c) is close to zero. The hydraulic conductivity (K) of pyroclastic beds was discovered to range between 10−4 and 10−5 m s−1 (Burgisser, 2012). A middle-range value was adopted to implement the numerical models. The relatively high permeability of the pyroclastic material ensures the water outflow during the regular rainfall regimen. In case of extreme rainfall events (violent rains, typhoons, etc.), the volcanic material is no longer able to drain the water inflow, producing the water level rise which will undermine the structural stability. The dams were thought to reach a height of 3 m and to hold up to a maximum water level of 2.6 m. Assuming the aforementioned features, the first step started from the design of a stable dam configuration (Fig. 7a). This outcome was obtained by trying different dimensioning solutions in order to avoid the early collapse of the structure due, for example, to its own weight. Figure 7b shows the water velocity field in the dam cross section, while Fig. 7c shows the breaking surface causing the failure of the downstream slope, which is generated by a factor of safety of 1.28.

Figure 7(a) Cross-sectional sketch of a stable dam with the main elements dimension, (b) water velocity field moving in the dam body and associated phreatic surface, and (c) breaking surface generated by a factor of safety of 1.28.
Once a stable dam was obtained for the chosen working conditions, the second step was to repeat the strength reduction analysis several times by slowly increasing the inclination of the downstream slope until a unitary FS was reached. The inclination was increased using the corner between the downstream slope and the dam crest as a pivot point. This resulted in a gradual increase in the θ angle and a consequent reduction of the dam base. Figure 8 shows the analysis final result, with the sizing specifications for an easy-to-collapse dam built in volcaniclastic material. To ensure a greater control over the natural dam collapse timing, a discharge channel can be arranged at the dam base. The degree of openness of this channel can be adjusted according to the flow rate values observed during the extreme rainfall events recorded over time in the area in order to delay the achievement of the triggering hydraulic head. This ploy may be necessary to avoid the undesired simultaneous collapse of different dams; the hazard could increase when different lahars are triggered at short time intervals and reach the confluence points almost at the same time.

Figure 8(a) Cross-sectional sketch of an instable dam with the main elements dimension, (b) water velocity field moving in the dam body and associated phreatic surface, and (c) breaking surface generated by a unitary factor of safety.
4.2 Preliminary hypotheses and results of simulations
LLUNPIY was calibrated and validated for secondary lahars by simulating the two events of 12 February 2005 and 22 August 2008, which occurred in the Vascún valley of Tungurahua volcano in Ecuador (Machado et al., 2014, 2015b). In particular, the 2008 event is very important in order to confirm the value of the model parameters, tuned in the simulation even where the cause of the lahar was the breakdown of a temporary pond, generated by a small landslide. Those successful simulations permitted having confidence in the scenarios which could be realized by new simulations. Of course, a very accurate update of geological data (DEM or DTM, detrital cover depth, etc.) and sufficient geophysical surveys are indispensable for applications aimed at lahar risk mitigation.
An initial study on the potentiality of applying mitigation measures in the Vascún valley was performed by triggering lahars of a planned size (the lahar level is here considered to be the relevant datum) through the controlled collapse of rudimentary ponds.
A preliminary analysis of the principal canyons of the Vascún valley was carried out in order to individuate favorable points for positioning embankments as dams. Three points were chosen for building temporary dams: one located in Vascún River (point 1 in Figs. 9, 10, 11, and 12), the second located in one of its tributary to the right (point 2 in Figs. 9, 10, 11, and 12), and the third located in a tributary to the left (point 3 in Figs. 9, 10, 11, and 12). Vascún River in turn is a tributary of the much broader Pastaza River, where lahars of Vascún valley disperse. Simulations concern the lahars generated in the points 1, 2, and 3 (Figs. 9, 10, 11, and 12), in short, lahar 1, 2, and 3. The same initial volume of the 2008 event was selected for all the simulations except the last one. Three initial points permit the analysis of an almost-exhaustive set of possible conditions; we performed a sequence of simulations by LLUNPIY/3r, of course, with the same parameters values of the successful simulation of the 29 August 2008 event. We present here some selected simulations that appear to be interesting for many considerations, which may be deduced by their analysis.
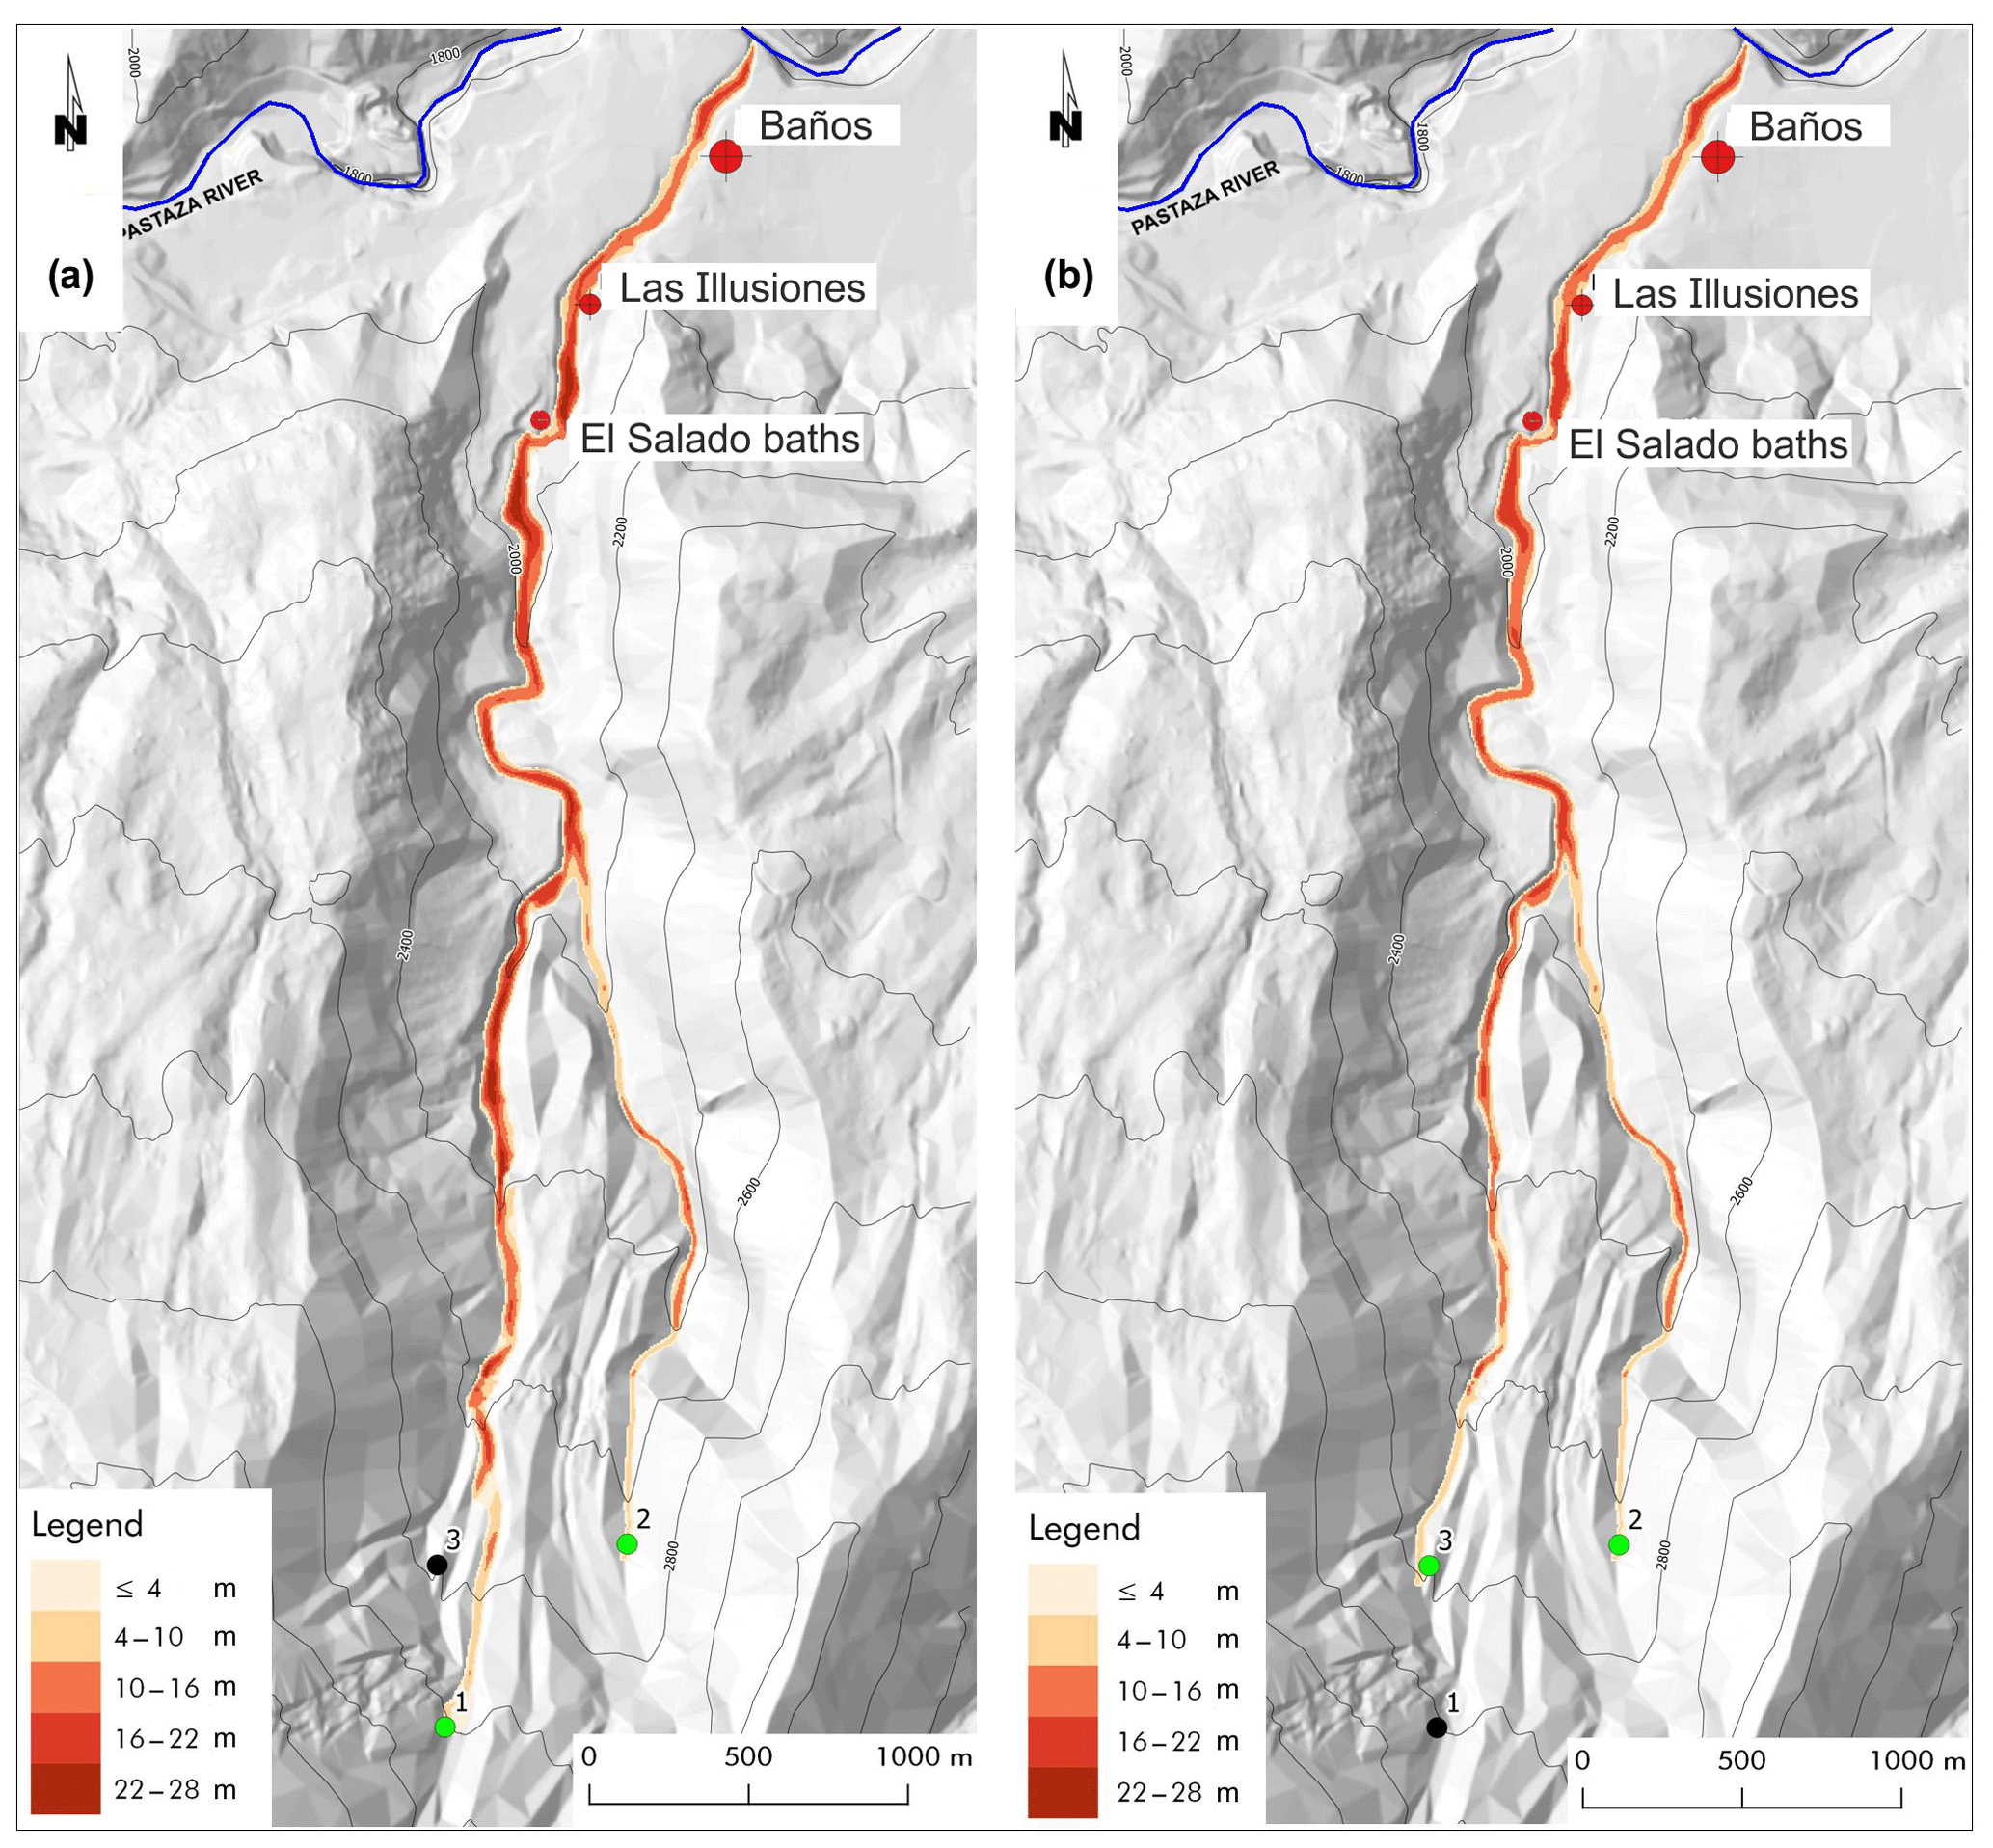
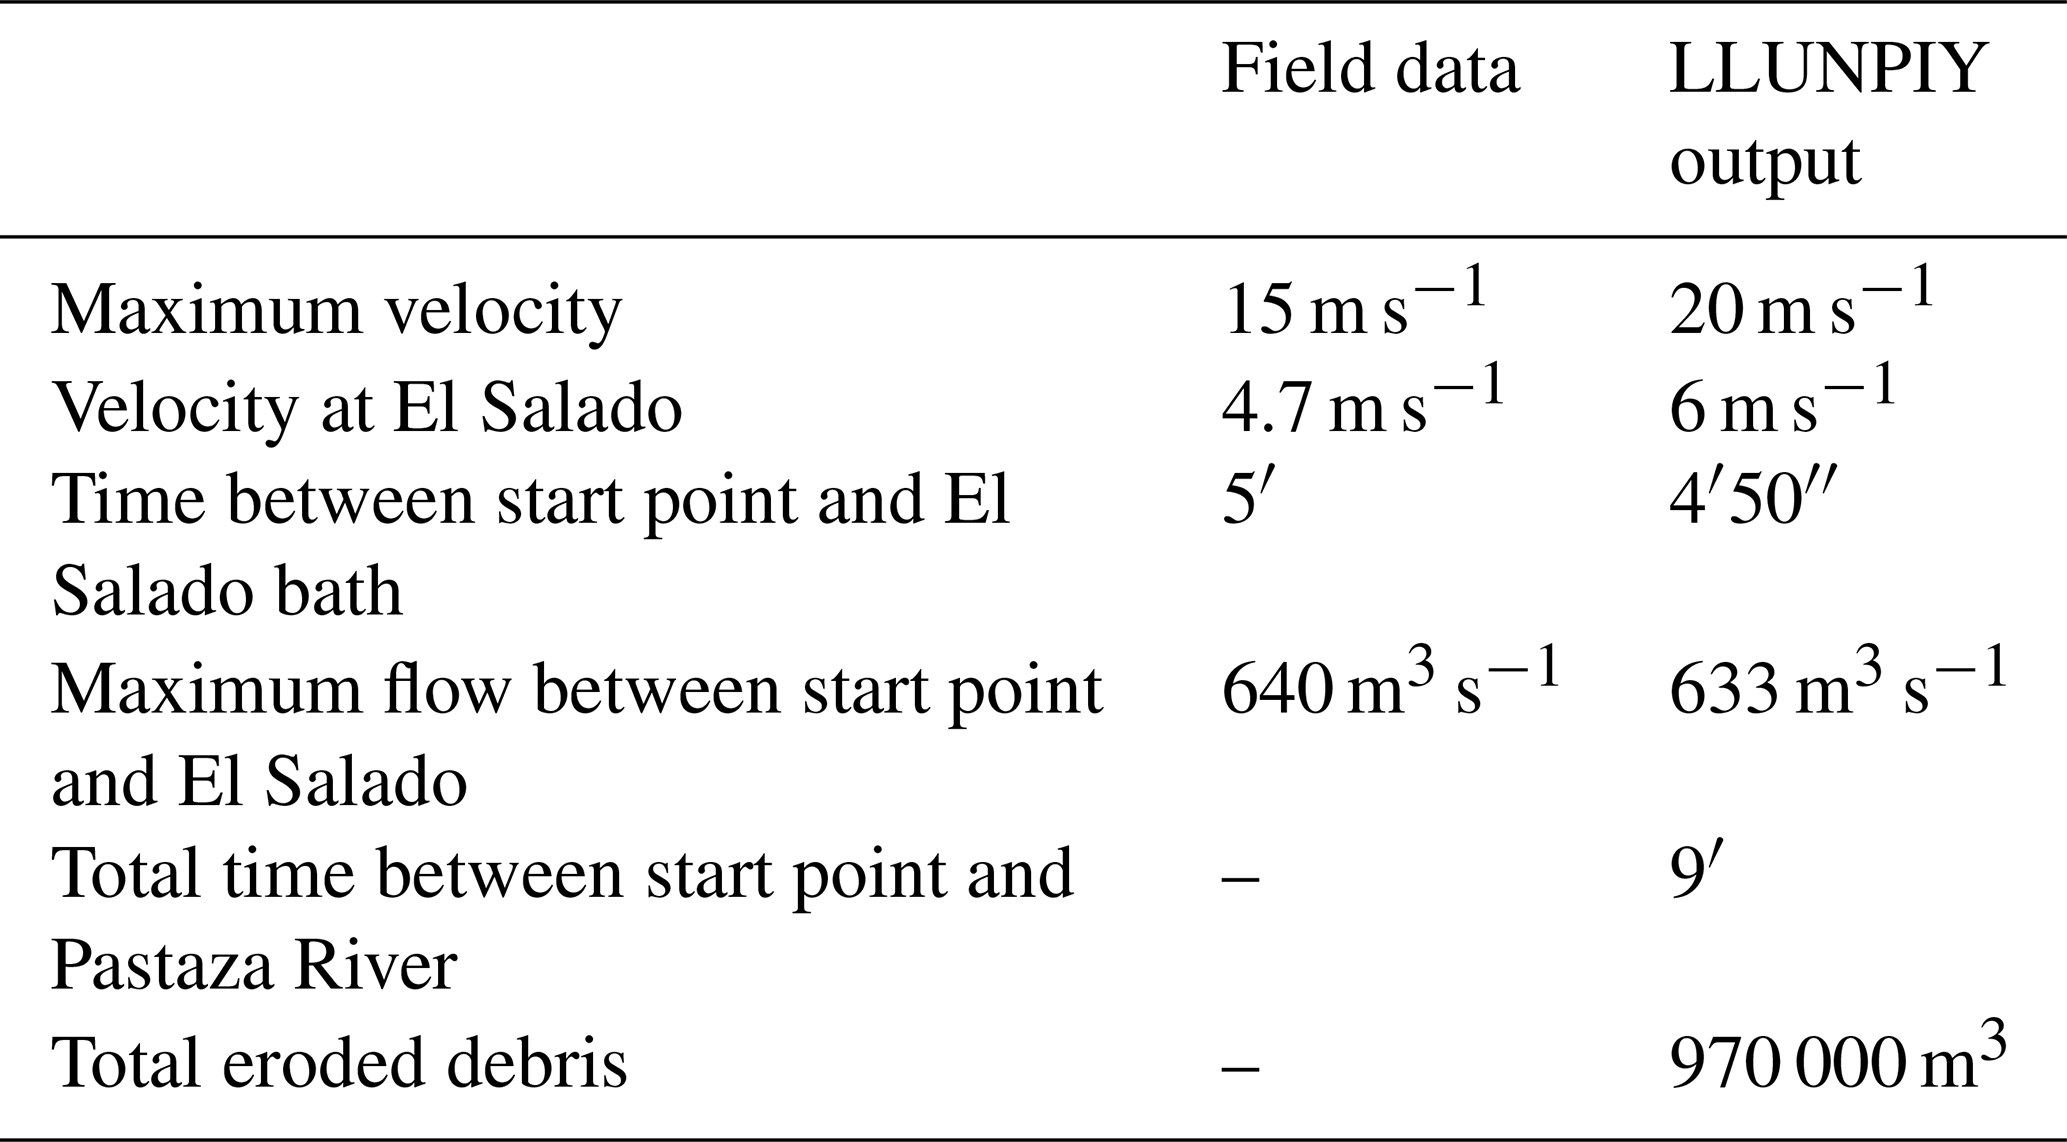
Figure 9Simultaneous triggering of lahars from points 1 and 2 (a) and from points 2 and 3 (b). The maximum thickness of the lahar during the conjectured events is reported in meters according the legend.
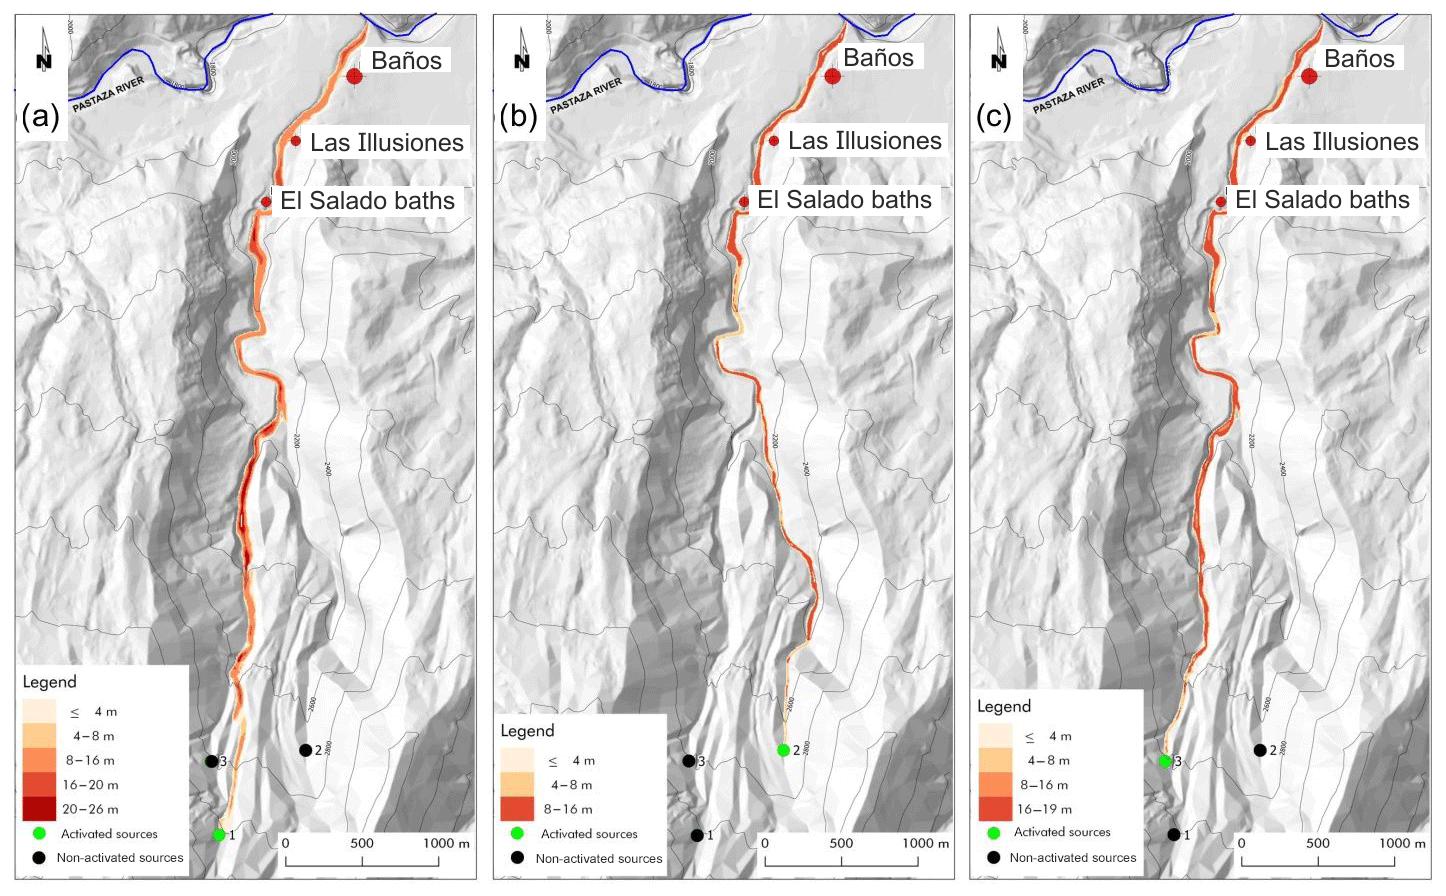
Figure 10Single triggering events: lahar generated in point 1 (a), in point 2 (b), and in point 3 (c). The legend specifies the maximum thickness of the lahar reached during the conjectured events for each point (cell).
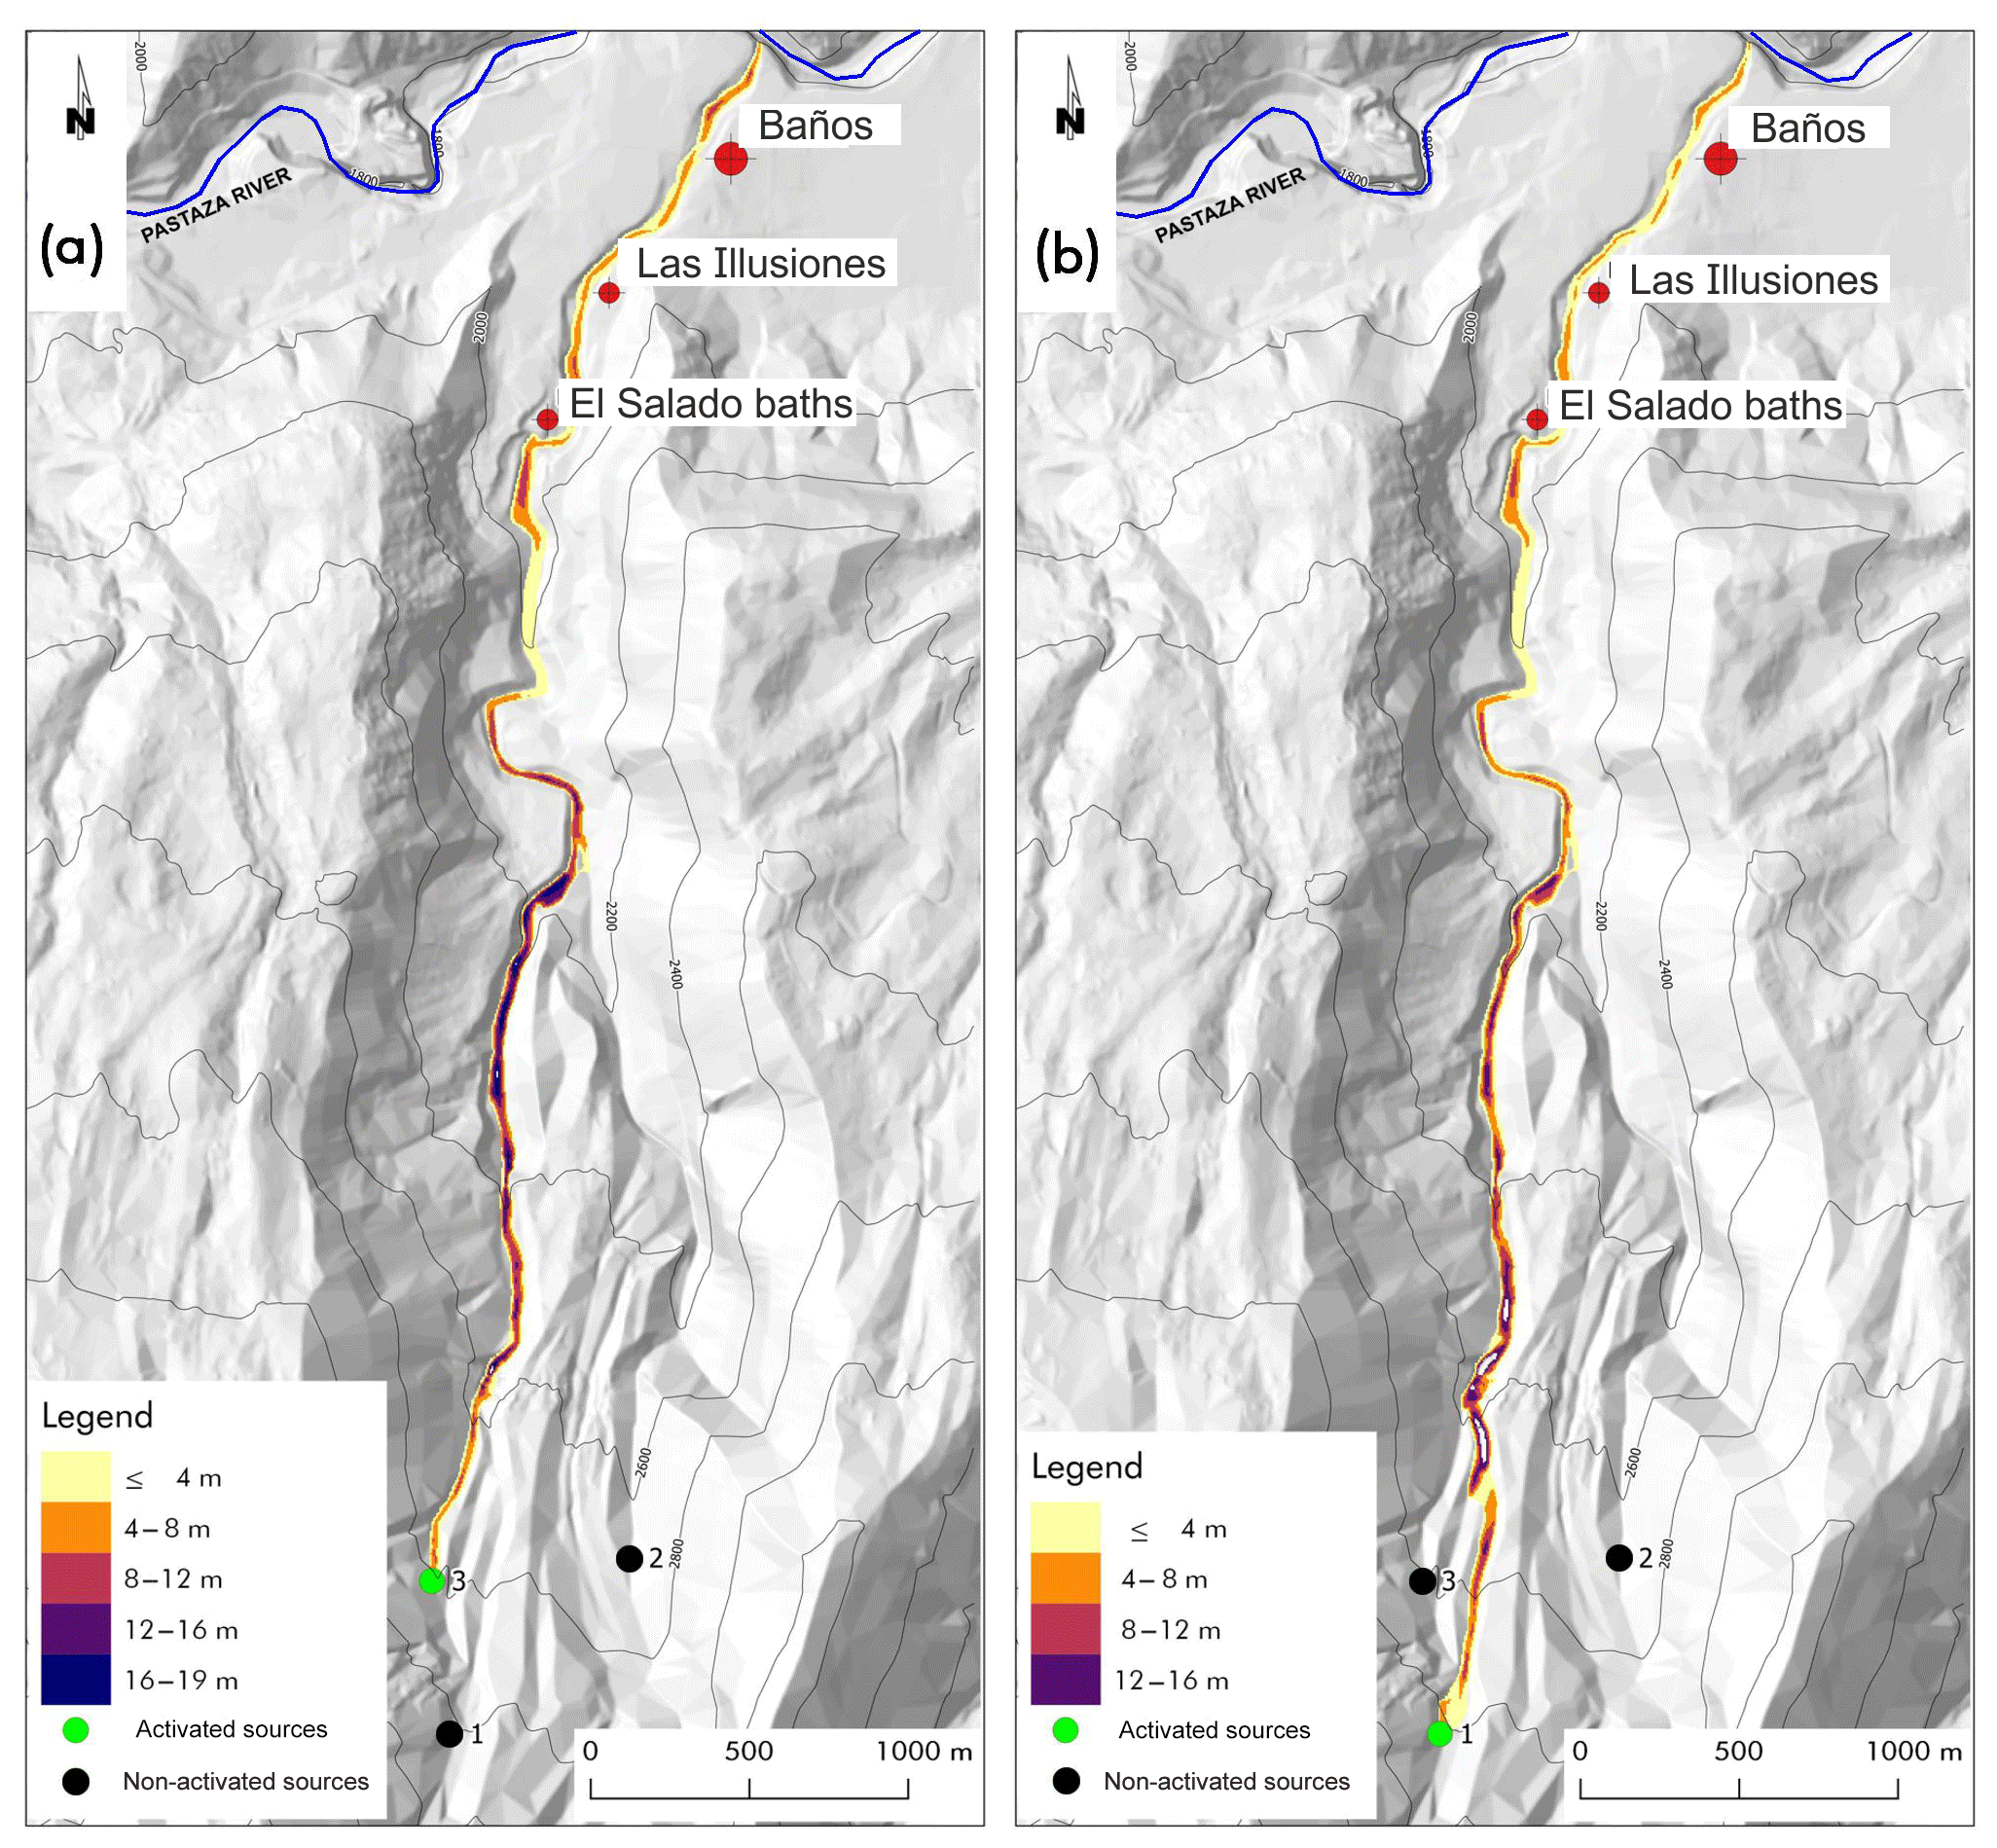
Figure 11Simulations of deferred triggering of lahars generated in point 3 (a) and 1 (b). The legend specifies the maximum thickness of the lahar reached during the conjectured events for each point (cell).
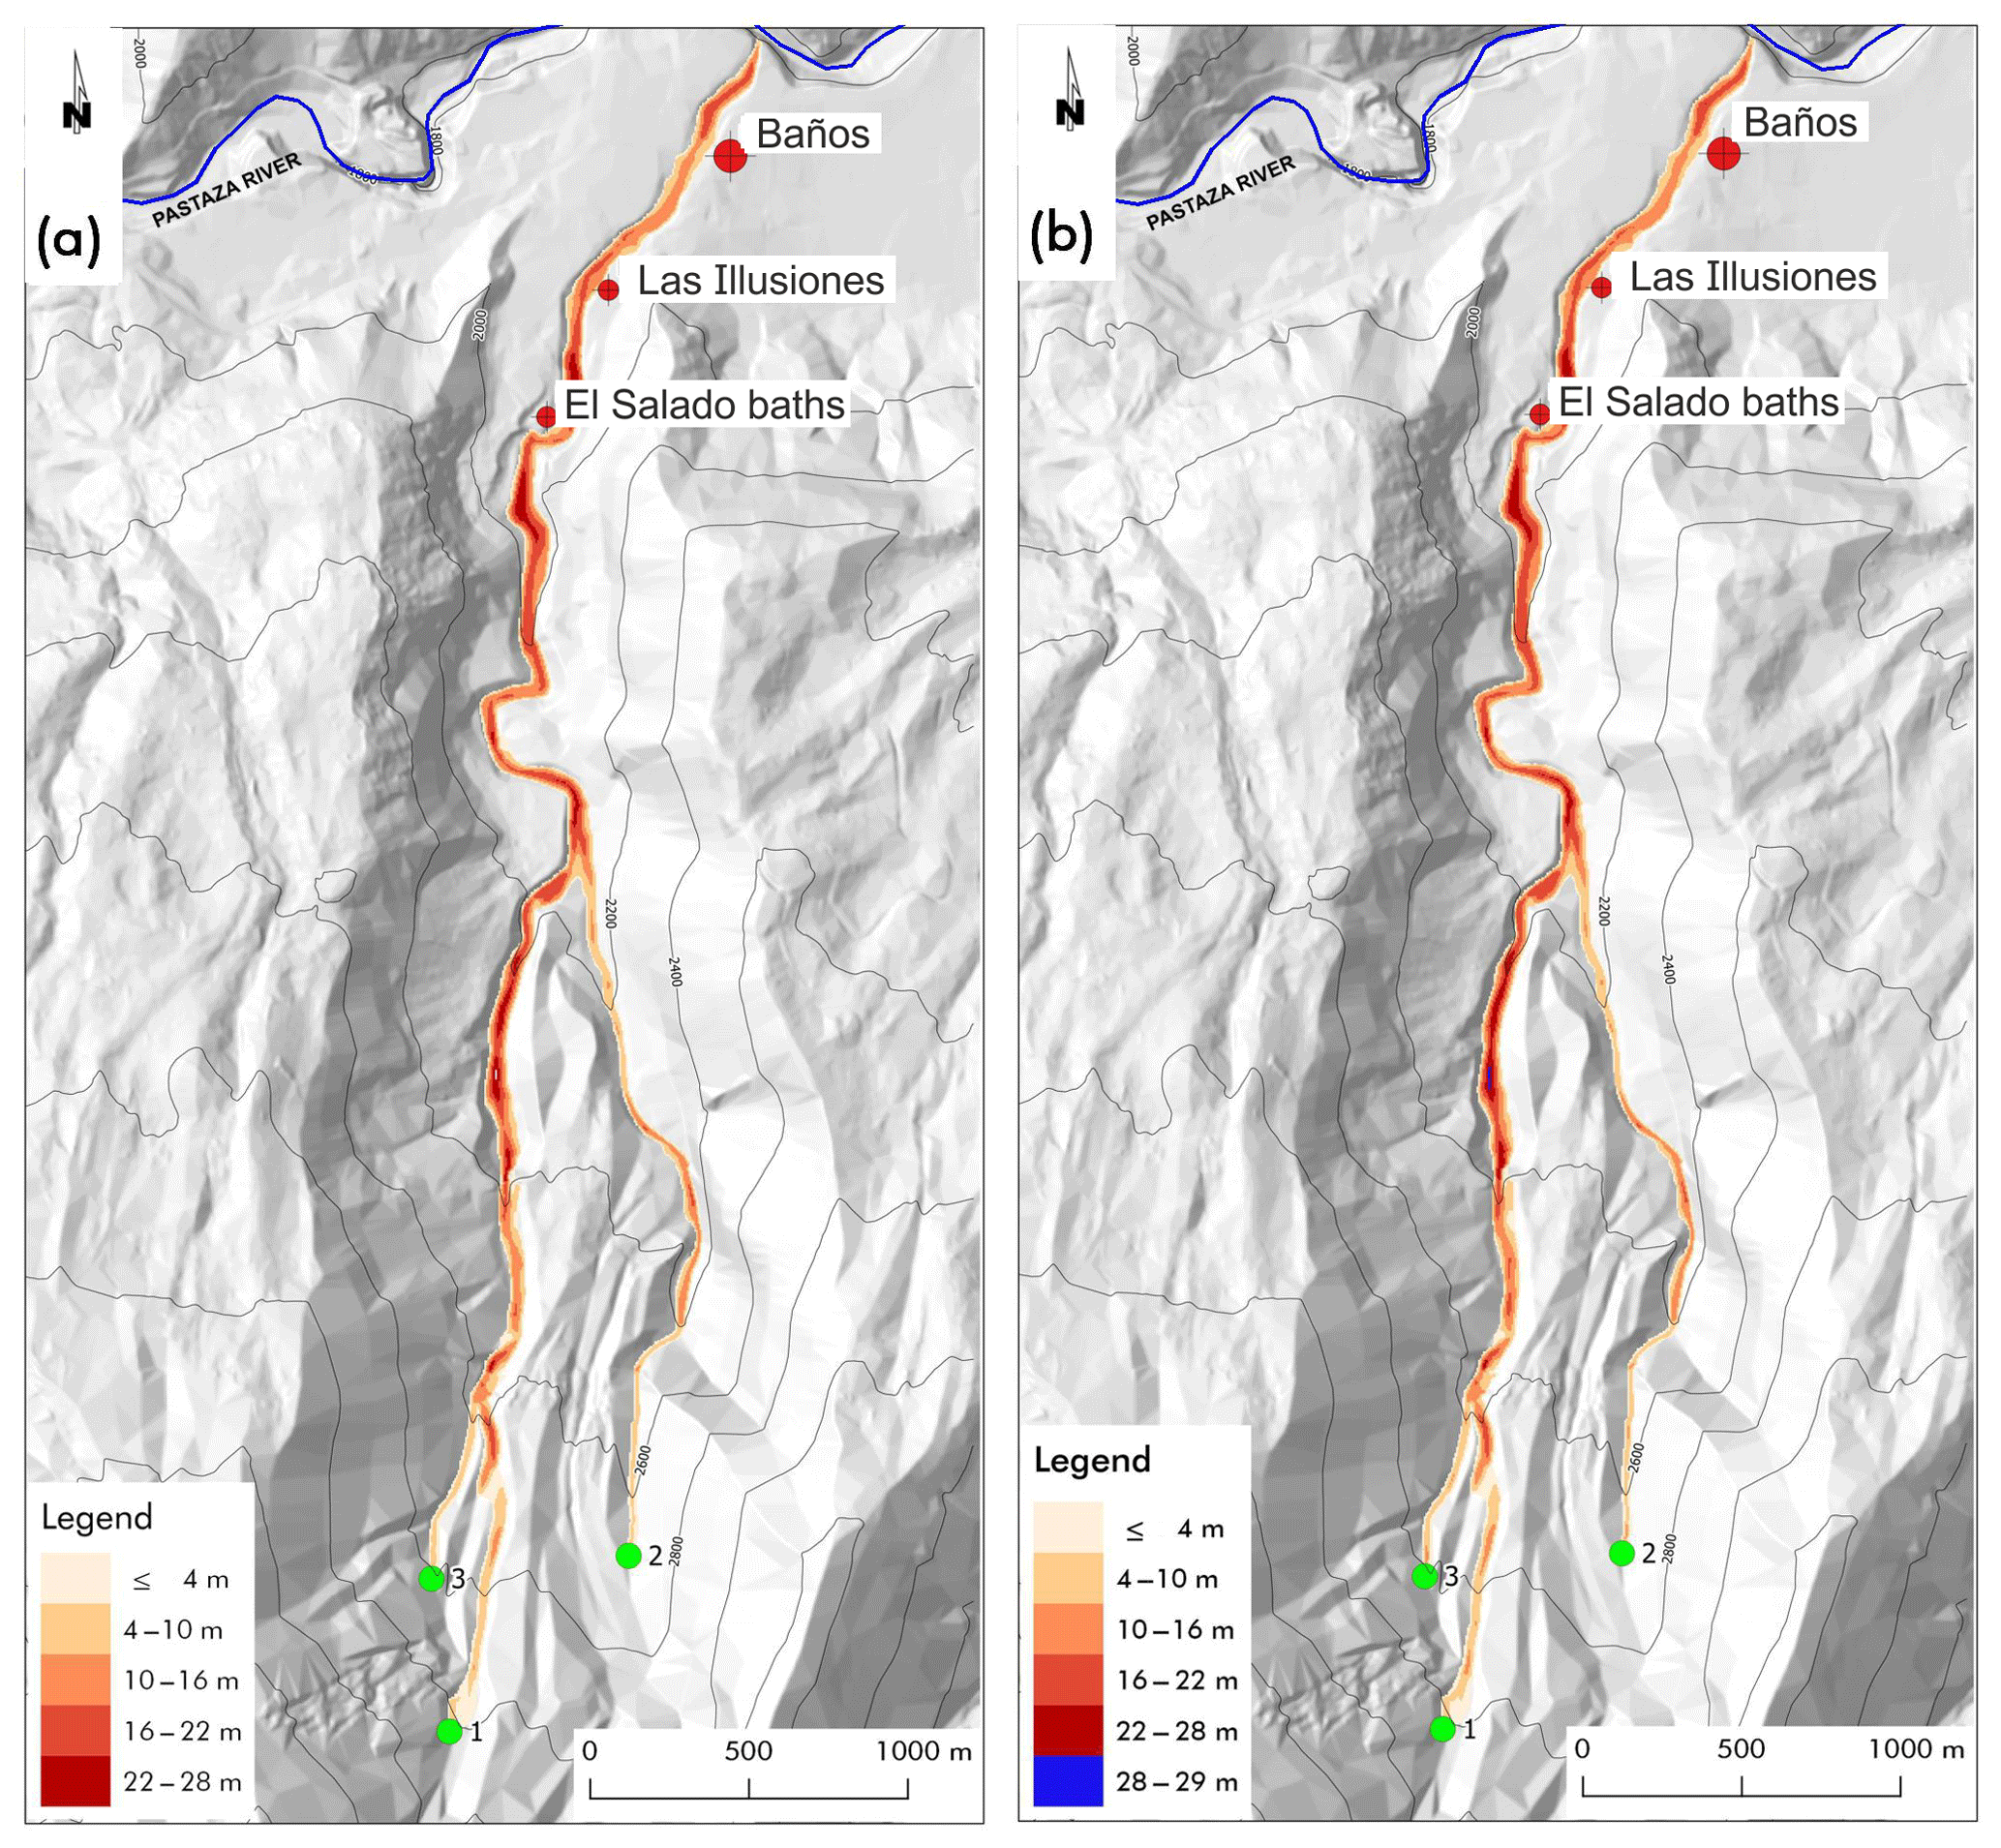
Figure 12Simulations of simultaneous triggering of lahars generated in point 1, 2, and 3: in panel (a) with total detachment volume of 13 625 m3 and in panel (b) with total detachment volume of 27 250 m3. The legend specifies the maximum thickness of the lahar reached during the conjectured events for each point (cell).
Initially, we considered two scenarios in order to investigate the effects of simultaneous and time-varying confluence of two lahars, the results of such simulations caused us to consider a larger set of cases. The former is generated by the simultaneous triggering from the points 1 with a detachment volume of 4875 m3 and 2 with a detachment volume of 4500 m3 (Fig. 9a), and the latter is generated by the simultaneous triggering from the points 2 with the same previous detachment volume and 3 with a detachment volume of 4250 m3 (Fig. 9b). The confluence of the lahars in the Vascún River (for the following the confluence point) is almost simultaneous in the latter scenario because of the similar distance between the triggering points and the confluence point. The situation is diverse for the former scenario because the distances of the triggering points from the confluence point are very different. Intuitively the former case would be less dangerous because the flood peaks of the two lahars cannot coincide at the confluence point, but the maximum thickness of the lahar in the former scenario is 27 m, while the smaller value of 21 m is detected in the latter scenario. The analysis of the two simulations showed that a much larger mass was eroded in the first part of the path from the point 1 in the former case. This unexpected result permits planning an opportune strategy according to the degree of control for triggering lahars 1, 2, and 3 from the three respective points. If triggering can be well controlled with moderate or heavy rainfall, then the best choice is to trigger lahar 3 (smaller erosion) before lahar 1 so that lahar 3 anticipates part of the erosion process in the common path of both the lahars (1 and 3) as far as the confluence point and reduces, consequently, the thickness of lahar 1. When the peak of lahar 3 goes beyond the confluence point, then lahar 2 can be triggered before lahar 1, which has to be generated as late as possible. Anyway, the last lahar to be triggered has to be surely lahar 1, but a further investigation is necessary to better understand the priority between lahar 2 and 3; the study of single lahars generated in points 1, 2, and 3 could solve the question, as it may be deduced by the following simulations.
Lahar 1 causes the maximum erosion, with a maximum thickness of 26 m because it follows the path of Vascún River, which is the main river in the valley (with a larger volume of pyroclastic cover to be eroded); lahar 3 shares a relevant part of the previous path and reaches a maximum thickness of 19 m, while lahar 2, whose path is shorter before its late confluence into Vascún River, involves the smallest erosion (maximum thickness of 16 m). Such results solve the doubt that we put forward with the first simulations.
An “cleaning” operation of pyroclastic cover could be projected by initially triggering lahar 2, with a first mobilization of the detrital cover also for the area related to the last part of Vascún River from the confluence point of lahar 2 (maximum thickness 16 m; Fig. 10b). When lahar 2 dissolves into Pastaza River, lahar 3 could be triggered with a first erosion of the detrital cover between the confluence points of lahars 2 and 3 into Vascún River so that the maximum thickness does not exceed 16 m (Fig. 10c). The most dangerous lahar 1 of Vascún River could then start at the exhaustion of lahar 3, minimizing the hazard; the maximum thickness before the confluence of lahar 3 into Vascún River does not exceed 22 m (Figs. 9a and 10a).
We tested successfully the outcomes of this strategy by simulating the triggering of the three lahars in successive times, each one immediately after the exhaustion of the previous one; the first phase concerns lahar 2 (Fig. 10b). The maximum thickness does not exceed 14 m in the last part of the path, from north of El Salado baths to south of Baños.
The erosion depth of pyroclastic cover, after lahar 2 exhaustion, prevents the maximum thickness of the successive lahar 3 to exceed 10–12 m after the confluence point with lahar 2 (Fig. 11a) because of the reduced pyroclastic cover, while 19 m are reached by triggering only lahar 3 (Fig. 10c).
Finally, the most dangerous lahar 1 does not exceed 4–8 m in the inhabited zones (Fig. 11b), while it reaches 26 m of maximum thickness in the last part of the path (Fig. 10a), when the other lahars 2 and 3 are not generated.
This last result points out the importance of cleaning the pyroclastic cover according to an opportune strategy, which can be deduced by the outcomes of simulations that explore all the possible significant cases.
The final simulations concern two cases of simultaneous triggering of all the lahars, with the same detachment volumes from points 1, 2, and 3 of the previous simulations (Fig. 12a) and the double detachment volumes from the same points (Fig. 12b) in order to understand how triggering larger volume could increase the lahar dangerousness. The results show that the maximum thickness of the lahar in the former case (Fig. 12a) is 28 m, while the maximum thickness of the lahar in the latter case (Fig. 12b) is 29 m, just a meter more. A double initial volume does not involve much larger erosion in this context, and the joint effect of a larger volume and erosion does not increase the hazard in a dramatic way.
The overall results confirm the goodness of the strategy of triggering lahars at different times according to an accurate analysis of simulations after gaining precise knowledge of the geological features of the area of application. We remember that these simulations were obtained without sufficient data about the pyroclastic cover (it is obviously overestimated) that would have led to more accurate results anyway; this issue does not compromise the reliability and validity of the proposed methodology.
Our case study starts from examination of some significant natural events in the Vascún valley, an area that is heavily exposed to lahar risk. Ponds form along watercourses (rios) in the canyons of this volcanic zone, when landslides of volcanic deposits impede the normal flow. The most frequent cause of breakout of such natural ponds is the overflow of water across the newly formed dam and subsequent erosion and rapid cutting down into the loose rock debris. By eroding the blockage and flowing out watercourse downstream, the initial surge of water will incorporate part of volcanic sediments and will generate lahars. The hazard related to these lahars depends both on the features of the temporary pond and the volcanic cover along the lahar path; a larger frequency of lahars produces smaller (shorter accumulation periods) and therefore less dangerous events.
We explored the possibility of inducing lahars artificially and performed many simulations for analyzing possible different scenarios for extremely complex situations; positive results obtained from these studies permit us to settle a methodology and encourage us to continue this investigation. We propose a controlled generation of small lahars, for risk mitigation, by the collapse of temporary ponds at different times in order to avoid the superposition of lahars having the same final path. Such a proposal does not adhere to standards and is based on observations and study of favorable situations together with the usage of a robust and well-validated model of simulation in order to choose the best procedures of intervention.
The computational paradigm of cellular automata has allowed the development of a reliable model for the simulation of lahars complex dynamics. Reliable simulation tools give the opportunity to test various hypotheses and to create related scenarios to be analyzed.
LLUNPIY/3r, the model that was used for lahar simulations in the Vascún valley, is a reduced version of LLUNPIY. It does not account for the preliminary phase modeled by the fully extended LLUNPIY (Machado, 2015), when the mixing of the rain water with the unconsolidated pyroclastic stratum originates the lahar, but it directly considers a “detachment area”, the initial area where the lahar can be considered to start for simulations of both real and conjectured events. Since some data of the real event are missing at this stage, the simulation starting point corresponds to the first area crossed by the lahar, whose data have a good level of reliability.
Simulation results of lahars triggered by the collapsed dam are oversized: the field data, relative to the depth of the unconsolidated pyroclastic layer along the path of lahars, are known very approximately; a constant value of 5 m was adopted, certainly not lower than the real one in any part of the lahar path but possibly exaggerated in some other parts. Of course, it was preferred to consider, with poor data, an overestimated lahar hazard rather than an underestimated one, but in the future, better precise data of the unconsolidated pyroclastic layer can be obtained thanks to geophysical surveys. Besides this, even if the simulations of lahars triggered by the collapsed dam produce overvalued hazard scenarios, the comparison among all the cases, where the depth of the unconsolidated pyroclastic layer is overestimated in the same way, shows that the application of this methodology with accurate field data is worthy of being taken into consideration. We remember that, in Ecuador, the two most accredited models for lahar simulation, LAHARZ (Muñoz-Salinas et al., 2009; Schilling, 1998) and TITAN2D (Sheridan et al., 2005; Williams et al., 2008), omit the erosion process. They impose the total amount of the eroded pyroclastic layer at the first simulation step, while LLUNPIY/3r starts from an initial amount, adding the new eroded quantity according to a step-by-step computation of the erosive detachment.
LLUNPIY/3r is limited for application to Vascún valley (or similar cases) because all the lahars end in Pastaza River without significant variation in viscosity, so the possible last phase affecting lahars in areas with small slopes, i.e., the water loss and the resulting solidification, fails to be considered; LLUNPIY (Machado, 2015) models such a situation, but a reliable validation of the model requires simulation of opportune real cases with detailed field data.
The possibility of simulating different scenarios with reliable field data permits forecasting the thickness of lahars, their velocity, and times of their peaks to operate for the best choice as a potential hazard with more efficient and reliable alert procedures. Applications of LLUNPIY/3r need a thorough geological study of the area of interest, especially regarding morphology (DEM and DTM), pyroclastic soil cover, and the composition of the erodible layer, also specified by geophysical surveys at the strategic points. Furthermore, it is also important to conduct a hydrological study of watercourses, where, most likely, the lahars are channeled.
Feasibility studies confirmed the previous hypotheses of building weak dams with a control drainage canal with significant cost containment. Unexpected (and sometime dangerous) situations were evidenced by simulation results, which permit evaluating the hazard of possible choices. Furthermore, more efficient and efficacious early warning protocols may be produced in such a context, and the social impact for partial evacuation could be mitigated. Interventions that solve provisionally the lahar hazard but involve future risks can be avoided. The complexity of the objective presupposes a multidisciplinary (or perhaps transdisciplinary) approach, which implies an even greater effort to ensure those competencies of different types (which are reflected by the various scientific extractions of the authors): geology, physics, mathematics, engineering, and computer science can cooperate to achieve common goals. Protocols for mitigating the lahar risk can be developed in such a context, involving also social and political sciences (Leung et al., 2003; Mercer et al., 2010).
A pilot project in which the setting up of an artificial pond is planned to conduct experiments for the triggering of small lahars in safe conditions would be necessary. This is a preliminary step for standard applications of this new strategy for reducing lahars risk.
A further achievement is the extension of LLUNPIY for modeling the flows in the urbanized area, as in the last versions of SCIDDICA (Lupiano et al., 2016, 2017).
The data are not publicly accessible. They are IGEPN property and were provided by means of personal communication.
The main contributions to this research are attributed to FC and VL, who carried out the research and wrote the paper. The remaining authors revised the paper and the computation, provided supplementary data and validation, and contributed to the editing.
The authors declare that they have no conflict of interest.
This paper reports part of the research of the international project (without direct financing) “Modelización y Simulación de Lahares con Autómatas Celulares mediante Computación Paralela” of the National University of Chimborazo. Indirect financial support was supplied by the University of Calabria.
This paper was edited by Filippo Catani and reviewed by two anonymous referees.
Aguilera, E., Pareschi, M. T., Rosi, M., and Zanchetta, G.: Risk from lahars in the northern valleys of Cotopaxi Volcano (Ecuador), Nat. Hazards, 33, 161–189, 2004.
Avolio, M. V., Crisci G. M., Di Gregorio, S., Rongo R., Spataro, W., and Trunfio, G. A.: SCIARA γ2: an improved Cellular Automata model for Lava Flows and Applications to the 2002 Etnean crisis, Comput. Geosci., 32, 897–911, 2006.
Avolio, M. V., Lupiano, V., Mazzanti, P., and Di Gregorio, S.: Modelling combined subaerial-subaqueous flow-like landslides by Cellular Automata, in: ACRI 2008, edited by: Umeo, H., Morishita, S., Nishinari, K., Komatsuzaki, T., and Bandini, S., LNCS 5191, 329–336, Springer, Berlin, Heidelberg, Germany, 2008.
Avolio, M. V., Di Gregorio, S., Spataro, W., and Trunfio, G. A.: A theorem about the algorithm of minimization of differences for multicomponent cellular automata, in: ACRI 2012, edited by: Sirakoulis, G. C. and Bandini, S., LNCS 7495, 289–298, Springer, Berlin, Heidelberg, Germany, 2012.
Avolio, M. V., Di Gregorio, S., Lupiano, V., and Mazzanti, P.: SCIDDICA-SS3: a new version of cellular automata model for simulating fast moving landslides, J. Supercomput., 65, 682–696, 2013.
Avolio, M. V., Errera, A., Lupiano, V., Mazzanti, P., and Di Gregorio, S.: A Cellular Automata Model for Snow Avalanches, J. Cell. Autom., 12, 309–332, 2017.
Barca, D., Di Gregorio, S., Nicoletta, F. P., and Sorriso-Valvo, M.: Flow-type landslide modelling by cellular automata, in: Mesnard G., Proc. A.M.S.E. International Congress Modelling and Simulation, Cairo, Egypt, March 1987, 4A 9–15, 1986 AMSE press, Tassin-la Demi-Lune, France, 1987.
Barclay, J., Alexander, J., and Sunik, J.: Rainfall-induced lahars in the Belham Valley, Montserrat, West Indies, J. Geol. Soc. London, 164, 815–827, 2007.
Biggs, J., Mothes, P., Ruiz, M., Amelung, F., Dixon, T. H., Baker, S., and Hong, S. H.: Stratovolcano growth by co-eruptive intrusion: the 2008 eruption of Tungurahua Ecuador, Geophys. Res. Lett., 37, 1–5, 2010.
Bommer, J. J., Rolo, R., Mitroulia, A., and Berdousis, P.: Geotechnical properties and seismic slope stability of volcanic soils, in: 12th European Conference on Earthquake Engineering, 9–13 September 2002, Barbicon Centre, Elsevier Science, London, UK, 2002.
Burgisser, A.: A semi-empirical method to calculate the permeability of homogeneously fluidized pyroclastic material, J. Volcanol. Geoth. Res., 243–244, 97–106, 2012.
Carey, M., Huggel, C., Bury, J., Portocarrero, C., and Haeberli, W.: An integrated socio-environmental framework for glacier hazard management and climate change adaptation: lessons from Lake 513, Cordillera Blanca, Peru, Climatic Change, 112, 733–767, 2012.
Chidichimo, F., De Biase, M., Rizzo, E., Masi, S., and Straface, S.: Hydrodynamic parameters estimation from self-potential data in a controlled full scale site, J. Hydrol., 522, 572–581, https://doi.org/10.1016/j.jhydrol.2015.01.022, 2015.
Chidichimo, F., Di Gregorio, S., Lupiano, V., Machado, G., Molina, L., and Straface, S.: Learning from nature: favoring small lahars formation for hazard mitigation, in: ENEA Proceedings of the international meeting “Relationality: between environmental awareness and societal challenges”, edited by: Fiorani, L., Román, Z., Falcioni, V., and Geremia, F., Budapest, Hungary, ISBN 978-88-8286-345-6, 87–90, 2016.
Chidichimo, F., Mendoza, B. T., De Biase, M., Catelan, P., Straface, S., and Di Gregorio, S.: Hydrogeological modeling of the groundwater recharge feeding the Chambo aquifer, Ecuador, in: AIP Conference Proceedings 2022, 22–24 June 2018, Sliema, Malta, 020003, https://doi.org/10.1063/1.5060683, 2018.
Chopard, B. and Droz, M.: Cellular automata modeling of physical systems – Cambrige University Press Collection Alea, Cambridge, UK, 1998.
Córdoba, G., Villarosa, G., Sheridan, M. F., Viramonte, J. G., Beigt, D., and Salmuni, G.: Secondary lahar hazard assessment for Villa la Angostura, Argentina, using Two-Phase-Titan modelling code during 2011 Cordón Caulle eruption, Nat. Hazards Earth Syst. Sci., 15, 757–766, https://doi.org/10.5194/nhess-15-757-2015, 2015.
Costa, J. E.: Hydraulic modeling for lahar hazards at Cascades volcanoes, Environ. Eng. Geosci., 3, 21–30, 1997.
Di Gregorio, S. and Serra, R.: An empirical method for modelling and simulating some complex macroscopic phenomena by cellular automata, Future Gener. Comp. Sy., 16, 259–271, 1999.
Glickman, T. S.: Glossary of Meteorology, American Meteorological Society, MA, USA, 2000.
Griffiths, D. V. and Lane, P. A.: Slope stability analysis by finite elements, Geotechnique, 49.3, 387–403, 1999.
Hall, M. L., Robin, C., Beate, B., Mothes, P., and Monzier, M.: Tungurahua Volcano, Ecuador: structure, eruptive history, and hazards, J. Volcanol. Geoth. Res., 91, 1–21, 1999.
IGEPN: Annual Review of the Activity of Tungurahua Volcano, Technical report, Instituto Geofísico, Quito, Ecuador, available at: https://www.igepn.edu.ec/ (last access: 1 April 2015), 2005.
IGEPN: Informe tecnico preliminar del aluvion del 23 de agosto en el rio Vascún, available at: http://www.igepn.edu.ec/tungurahua-informes/tung-especiales/tung-e-2008/8833-informe-especial-tungurahua-no-18/file (last access: 2 December 2019), 2008a.
IGEPN: Weekly Report from the Tungurahua Volcano Observatory (18-24 August, 2008), Technical Report 33, Instituto Geofísico, Quito, Ecuador, available at: https://www.igepn.edu.ec/ (last access: 1 April 2015), 2008b.
Iovine, G., D'Ambrosio, D., and Di Gregorio, S.: Applying genetic algorithms for calibrating a hexagonal cellular automata model for the simulation of debris flows characterised by strong inertial effects, Geomorphology, 66, 287–303, 2005.
Iovine, G., Di Gregorio, S., Sheridan, M. F., and Miyamoto, H.: Modelling, computer-assisted simulations, and mapping of dangerous phenomena for hazard assessment, Environ. Modell. Softw., 22, 1389–1391, 2007.
Janda, R. J., Scott, K. M., Nolan, K. M., and Martinson, H. A.: Lahar movement, effects, and deposits, US Geol. Surv. Prof. Pap., 1250, 461–478, 1981.
Janda, R. J., Daag, A. S., Delos Reyes, P. J., Newhall, C. G., Pierson, T. C., Punongbayan, R. S., Rodolfo, K. S., Solidum, R. U., and Umbal, J. V.: Assessment and response to lahar hazard around Mount Pinatubo, 1991 to 1993, in: Fire and mud: Eruptions and lahars of Mount Pinatubo, Philippines, USGS Books and Other Publications, Washington, USA, 107–140, 1996.
Kelman, I.: Reliance on Structural Approaches Increases Disaster Risk, Version 1, 26 July 2007, available at: http://www.ilankelman.org/miscellany/StructuralDefences.rtf (last access: 2 December 2019), 2007.
Künzler, M., Huggel, C., and Ramírez, J. M.: A risk analysis for floods and lahars: case study in the Cordillera Central of Colombia, Nat. Hazards, 64, 767–796, 2012.
Lambe, T. W. and Whitman, R. V.: Soil mechanics, SI version, Wiley, New York, USA, 1979.
Lane, L. R., Tobin, G. A., and Whiteford, L. M.: Volcanic hazard or economic destitution: hard choices in Baños, Ecuador, Global Environmental Change Part B: Environmental Hazards, 5, 23–34, 2003.
Launder, B. E. and Spalding, D. B.: The numerical computation of turbulent flows, in: Numerical prediction of flow, heat transfer, turbulence and combustion, Pergamon, Oxford, UK, 96–116, 1983.
Leavesley, G. H., Lusby, G. C., and Lichty, R. W.: Infiltration and erosion characteristics of selected tephra deposits from the 1980 eruption of Mount St. Helens, Washington, USA, Hydrolog. Sci. J., 34, 339–353, 1989.
Le Pennec, J. L., Jaya, D., Samaniego, P., Ramón, P., Moreno, S., Egred, J., and van der Plicht, J.: The AD 1300–1700 eruptive periods at Tungurahua volcano, Ecuador, revealed by historical narratives, stratigraphy and radiocarbon dating, J. Volcanol. Geoth. Res., 176, 70–81, 2008.
Leung, M. F., Santos, J. R., and Haimes, Y. Y.: Risk modeling, assessment, and management of lahar flow threat, Risk Anal., 23, 1323–1335, 2003.
Lupiano, V., Avolio, M. V., Di Gregorio, S., Peres, D. J., and Stancanelli, L. M.: Simulation of 2009 debris flows in the Peloritani Mountains area by SCIDDICA-SS3, in: Proceedings of the 7th International Conference on Engineering Mechanics, Structures, Engineering Geology (EMESEG 2014), 3–5 June 2014, Salerno, Italy, 53–61, published by WSEAS Press, 2014.
Lupiano, V., Avolio, M. V., Anzidei, M., Crisci, G. M., and Di Gregorio, S.: Susceptibility assessment of subaerial (and/or) subaqueous debris-flows in archaeological sites, using a cellular model, in: Engineering Geology for Society and Territory, 8, 405–408, https://doi.org/10.1007/978-3-319-09408-3_70, 2015a.
Lupiano, V., Peres, D. J., Avolio, M. V., Cancelliere, A., Foti, E., Spataro, W., and Di Gregorio, S.: Use of the SCIDDICA-SS3 model for predictive mapping of debris flow hazard: an example of application in the Peloritani Mountains area, in: Proceedings of the International Conference on Parallel and Distributed Processing Techniques and Applications (PDPTA), 27–30 July 2015, Las Vegas, USA, 625–631, 2015b.
Lupiano, V., Machado, G., Crisci, G. M., and Di Gregorio, S.: A modelling approach with Macroscopic Cellular Automata for hazard zonation of debris flows and lahars by computer simulations, Int. J. Geol., 9, 35–46, 2015c.
Lupiano, V., Machado, G., Molina, L. P., Crisci, G. M., and Di Gregorio, S.: Simulations of debris/mud flows invading urban areas: a cellular automata approach with SCIDDICA, in: ACRI 2016, edited by: El Yacoubi, S., Was, J., and Bandini, S., LNCS 9863, 291–302, Springer, Berlin, Heidelberg, Germany, 2016.
Lupiano, V., Machado, G., Molina, L. P., Crisci, G. M., and Di Gregorio, S.: Simulations of flow-like landslides invading urban areas: a cellular automata approach with SCIDDICA, Nat. Comput., 17, 553–568, https://doi.org/10.1007/s11047-017-9632-3, 2017.
Machado, G.: Cellular Automata for Modeling and Simulating Complex Phenomena: Lahars, Case Studies of Primary and Secondary Lahars in Ecuador, PhD Thesis in Mathematics and Computer Science, Department of Mathematics and Computer Science, University of Calabria, Rende, Italy, 2015.
Machado, G., Lupiano, V., Avolio, M. V., and Di Gregorio, S.: A preliminary cellular model for secondary lahars and simulation of 2005 case of Vascún Valley, Ecuador, in: ACRI 2014, edited by: Was, J., Ch. Sirakoulis, G., and Bandini, S., LNCS 8751, 208–217, Springer, Berlin, Heidelberg, Germany, 2014.
Machado, G., Lupiano, V., Crisci, G. M., and Di Gregorio, S.: LLUNPIY Preliminary Extension for Simulating Primary Lahars, in: Proceedings of the 5th International Conference on Simulation and Modeling Methodologies, Technologies and Applications, 21–23 July 2015, Colmar, France, 367–376, SCITEPRESS-Science and Technology Publications, Lda, 2015a.
Machado, G., Lupiano, V., Avolio, M. V., Gullace, F., and Di Gregorio, S.: A cellular model for secondary lahars and simulation of cases in the Vascún Valley, Ecuador, J. Comput. Sci.-Neth., 11, 289–299, 2015b.
Major, J., Pierson, T., Dinehart, R., and Costa, J.: Sediment yield following severe volcanic disturbance. A two-decade perspective from Mount St. Helens, Geology, 28, 819–822, 2000.
Manville, V.: An overview of break-out floods from intracaldera lakes, Global Planet. Change, 70, 14–23, 2010.
Manville, V., Major, J. J., and Fagents, S. A.: Modeling lahar behavior and hazards, in: Modeling Volcanic Processes: The Physics and Mathematics of Volcanism, 300–330, Cambridge University Press, Cambridge, UK, 2013.
Mazzanti, P., Bozzano, F., Avolio, M. V., Lupiano, V., and Di Gregorio, S.: 3D Numerical Modelling of Submerged and Coastal Landslide Propagation, in: Submarine Mass Movements and Their Consequences, 127–139, Springer, Netherlands, 2010.
Mercer, J., Kelman, I., Taranis, L., and Suchet-Pearson, S.: Framework for integrating indigenous and scientific knowledge for disaster risk reduction, Disasters, 34, 214–239, 2010.
Molinari, A., Chidichimo, F., Straface, S., and Guadagnini, A.: Assessment of natural background levels in potentially contaminated coastal aquifers, Sci. Total Environ., 476–477, 38–48, 2014.
Mothes, P. A. and Vallance, J. W.: Lahars at Cotopaxi and Tungurahua Volcanoes, Ecuador: Highlights from Stratigraphy and Observational Records and Related Downstream Hazards, in: Volcanic Hazards, Risks and Disasters, edited by: Shroder, J. F. and Papale, P., Elsevier, Boston, 141–168, https://doi.org/10.1016/B978-0-12-396453-3.00006-X, 2015.
Mothes, P. A., Yepes, H., Hall, M. L., Ramón, P., Steele, A. L., and Ruiz, M. C.: The scientific-community interface over the fifteen-year eruptive episode of Tungurahua Volcano, Ecuador, J. Appl. Volcanol., 4, 9, https://doi.org/10.1186/s13617-015-0025-y, 2015.
Muñoz-Salinas, E., Castillo-Rodríguez, M., Manea, V., Manea, M., and Palacios, D.: Lahar flow simulations using LAHARZ program: application for the Popocatépetl volcano, Mexico, J. Volcanol. Geoth. Res., 182, 13–22, 2009.
Neall, V. E.: Lahars as major geological hazards. Bulletin of the International Association of Engineering Geology – Bulletin de l'Association Internationale de Géologie de l'Ingénieur, 13.1, 233–240, 1976.
O'brien, J. S., Julien, P. Y., and Fullerton, W. T.: Two-dimensional water flood and mudflow simulation, J. Hydraul. Eng., 119, 244–261, 1993.
Orense, R. P., Zapanta Jr., A., Hata, A., and Towhata, I.: Geotechnical characteristics of volcanic soils taken from recent eruptions, Geotechnical and Geological Engineering, 24, 129–161, 2006.
Pierson, T. C., Janda, R. J., Thouret, J. C., and Borrero, C. A.: Perturbation and melting of snow and ice by the 13 November 1985 eruption of Nevado del Ruiz, Colombia, and consequent mobilization, flow and deposition of lahars, J. Volcanol. Geoth. Res., 41, 17–66, 1990.
Pitman, E. B., Nichita, C. C., Patra, A., Bauer, A., Sheridan, M., and Bursik, M.: Computing granular avalanches and landslides, Phys. Fluids, 15, 3638–3646, 2003.
Procter, J. N., Cronin, S. J., Fuller, I. C., Sheridan, M., Neall, V. E., and Keys, H.: Lahar hazard assessment using Titan2D for an alluvial fan with rapidly changing geomorphology: Whangaehu River, Mt. Ruapehu, Geomorphology, 116, 162–174, 2010.
Rodolfo, K. S., Umbal, J. V., Alonso, R. A., Remotigue, C. T., Paladio-Melosantos, M. L., Salvador, J. H., Evangelista, D., and Miller, Y.: Two years of lahars on the western flank of Mount Pinatubo: Initiation, flow processes, deposits, and attendant geomorphic and hydraulic changes, in: Fire and mud: eruptions and lahars of Mount Pinatubo, Philippines, edited by: Newhall, C. G. and Punongbayan, R. S. S., University of Washington Press, Seattle, USA and London, UK, 989–1013, 1996.
Schilling, S. P.: LAHARZ, GIS programs for automated mapping of lahar-inundation hazard zones, No. 98-638, US Geological Survey, Information Services, Washington, USA, 1998.
Scott, K. M.: Magnitude and frequency of lahars and lahar-runout flows in the Toutle-Cowlitz River system, US Geological Survey, Professional Paper, USA, 1447, 1989.
Sheridan, M. F., Stinton, A. J., Patra, A., Pitman, E. B., Bauer, A., and Nichita, C. C.: Evaluating Titan2D mass-flow model using the 1963 Little Tahoma Peak avalanches, Mount Rainier, Washington, J. Volcanol. Geoth. Res., 139, 89–102, 2005.
Shreve, C. M. and Kelman, I.: Does mitigation save? Reviewing cost-benefit analyses of disaster risk reduction, Int. J. Disast. Risk Re., 10, 213–235, 2014.
Straface, S., Rizzo, E., and Chidichimo, F.: Estimation of hydraulic conductivity and water table map in a large-scale laboratory model by means of the self-potential method, J. Geophys. Res.-Sol. Ea., 115, B06105, https://doi.org/10.1029/2009JB007053, 2010.
Straface, S., Chidichimo, F., Rizzo, E., Riva, M., Barrash, W., Revil, A., Cardiff, M., and Guadagnini, A.: Joint inversion of steady-state hydrologic and self-potential data for 3D hydraulic conductivity distribution at the Boise Hydrogeophysical Research Site, J. Hydrol., 407, 115–128, 2011.
Toffoli T.: Cellular Automata as an alternative to (rather than an approximation of) differential equations in modeling physics, Physica, 10D, 117–127, 1984.
Vallance, J. W.: Lahars, Encyclopedia of Volcanoes, Academic Press, San Diego, CA, USA, 2000.
Verstappen, H. T.: Volcanic hazards in Colombia and Indonesia; lahars and related phenomena, Geosciences in International Development Report, 15, 33–42, 1992.
Waythomas, C. F.: Water, ice and mud: lahars and lahar hazards at ice-and snow-clad volcanoes, Geology Today, 30.1, 34–39, 2014.
Williams, R., Stinton, A., and Sheridan, M.: Evaluation of the Titan2D two-phase flow model using an actual event: Case study of the 2005 Vazcún Valley Lahar, J. Volcanol. Geoth. Res., 177, 760–766, 2008.
Wisner, B., Gaillard, J. C., and Kelman, I. (Eds.): Handbook of hazards and disaster risk reduction and management, Routledge, Abingdon-on-Thames, UK, 2012.