the Creative Commons Attribution 4.0 License.
the Creative Commons Attribution 4.0 License.
 | 21 Apr 2020
A spatial decision support system for enhancing resilience to floods: bridging resilience modelling and geovisualization techniques
Charlotte Heinzlef
Vincent Becue
In the context of climate change and increasing urbanization, floods are considerably affecting urban areas. The concept of urban resilience may be an interesting means of responding to urban flood issues. The objective of this research is to propose a spatial decision support tool based on geovisualization techniques and a resilience assessment method. The goal is to localize the level of resilience modelled in different territories. The methodology proposed consists of integrating three resilience indicators applied to a case study in Avignon (Provence-Alpes-Côte d'Azur region, France) and the use of geovisualization techniques: using GIS for data processing and analysis, visualization, mapping, and model processing. The methodology integrates decision-making by identifying characteristics capable of improving urban resilience and facilitating its understanding using a visual tool. The results demonstrate the usefulness of modelling resilience using geovisualization techniques to identify the potential for local resilience; integrate local stakeholders into a process of clarifying the concept through the contribution of visualization; and consider easier access to this concept based on data analysis, processing and visualization through the design of maps.


1.1 Issues and background
The context of climate change has led to an increase in disasters, among which urban floods are considered the most damaging, accounting for 43.4 % of climate-related disasters over the period 1998–2017 (Wallemacq and House, 2018). At present, the European Environment Agency ranks France third among European countries affected by natural hazards over the period 1980–2017 (European Environment Agency, 2019), as 33 % of its municipalities were affected with “an estimated annual cost of around 250 million euros” (Lhomme, 2012). The Mediterranean region is among the most vulnerable in France, with an average of 10 deaths per year caused by floods; 42 % of the population of the Vaucluse department lives in areas at risk from floods, and it ranks first among departments exposed to flood risk in comparison to the national average of 11 % of the population living in flood risk areas in 2009. With 147∕151 municipalities in the department affected by floods, Vaucluse is extremely vulnerable to this growing risk.
To address this growing risk, the concept of resilience has been included step by step into risk management strategies worldwide, as it offers a systemic approach to and analysis of risks, their issues, territories, populations and management services (Bakkensen et al., 2017). The concept of resilience can be defined as “the ability of a system, community or society exposed to hazards to resist, absorb, accommodate to and recover from the effects of a hazard” (UNISDR, 2009). Despite a significant increase in the use of the concept and its positive opportunities for risk strategies, concrete progress towards operationalization is still needed (Klein et al., 2003). The objective of this research is therefore to propose an approach to address this lack of operationality. While some studies have been carried out in Europe to operationalize the concept of vulnerability through indicators (Opach and Rød, 2013), few of them mention resilience. When such is the case (Lhomme et al., 2013; Suárez et al., 2016), it is essentially from a technical and organizational angle, but without considering the social and therefore systemic dimensions of the territory concerned.
This research therefore aims at using the concept of resilience in a practical and understandable manner at the city level, with the design of a spatial decision support system. The originality of the methodology is justified by the collaborative approach taken, characterized by a socio-economic partnership with the city of Avignon and its urban services. By combining the experiences of managers and politicians with scientific advances, the approach aims at addressing the challenges and limitations of the concept of urban resilience in the face of flood risk. The result of joint design, the spatial decision support system is being tested in the Avignon area in response to more risky situations. Spatial decision makes it possible to establish a link between scientific advances and local knowledge and practices. This spatial decision support system involves redefining the criteria for resilience and measuring the potential for resilience (Frazier et al., 2013). It aims at overcoming the following:
-
theoretical obstacles by designing indicators to assess resilience,
-
methodological issues by representing the potential for resilience through mapping tools used to provide stakeholders with a medium capable of making them aware of the concept, integrate it into their risk management strategies, and transform it into concrete and applicable actions.
Meeting the challenges of operationalizing resilience therefore involves rethinking modelling and mapping practices as well as focusing on understanding the concept, adopting it and integrating stakeholders into the resilience process.
1.2 Research focus
We adopt the viewpoint that promoting techniques to make resilience operational can be achieved by collaboration and visualization methods. Getting people from different backgrounds to interact (Callon et al., 2001) enriches discussions, encourages the expression of opposing viewpoints on the same subject, and makes it possible to be both more measured and more incisive in a specific field. Resilience is therefore a subject that requires the confrontation of views and scientific and local knowledge (Radhakrishnan et al., 2017). We therefore propose developing strategies to operationalize resilience so that they are constructed jointly with the city's actors, allowing their direct investment. Rather than taking a top-down approach, our goal is to create a common discussion around resilience issues to initiate constructive dialogues to overcome the biases of each group of stakeholders (Jacobs et al., 2005; Moser, 2005; Næss et al., 2006; Patt and Dessai, 2005). In addition, we consider that techniques translating a fuzzy concept into a practical spatial decision support system – such as geovisualization and modelling – would promote stakeholder involvement and understanding of the related issues and thus lead to adapted decision-making. The motivation of the article is to demonstrate that combining certain geovisualization techniques with resilience modelling will contribute to better understanding of the concept and lead to its operationalization and translation into tangible strategies at the local level.
We defend the hypothesis that defining resilience criteria and translating them visually for implementation in an easy-to-use tool will promote and better integrate resilience techniques in view of managing urban floods. By carrying out a municipality-scale study and combining a collaborative methodology and GIS resilience modelling to develop a geovisualization tool, we hope to clarify the concept and ensure its understanding and adoption by urban planners in their approaches to urban dynamics. In the first section we present a state of the art of resilience modelling and geovisualization techniques in the field of climate risk management and then the methodologies chosen for this research. Finally, we present the first application of this research and its results in Avignon (France). Then, we discuss these initial results.
2.1 The resilience concept and modelling approaches
As the concept of resilience is multidisciplinary, its definition and application as a risk management strategy are extremely complex. In order to move towards its operationalization, it is necessary to build an analysis model to address the concept. Several studies have attempted to build analysis models to define indicators or a specific baseline (Bakkensen et al., 2017; Fox-Lent et al., 2015).
The 100 Resilient Cities (100RC) consortium was launched by the Rockefeller Foundation in 2013. The purpose of the 100 Resilient Cities consortium is to help cities around the world become more resilient to the physical, social and economic challenges of the 21st century. 100RC supports the adoption and integration of a vision of resilience that includes not only disasters – earthquakes, fires, floods, etc. – but also the tensions that weaken the urban area on a daily or cyclical basis. Resilience is defined as the ability of individuals, communities, institutions, businesses and urban systems to survive, adapt and evolve, regardless of the types of chronic stresses or shocks they may encounter. A holistic approach is advocated. 100RC has built a framework defining the characteristics of urban resilience (Fig. 1).
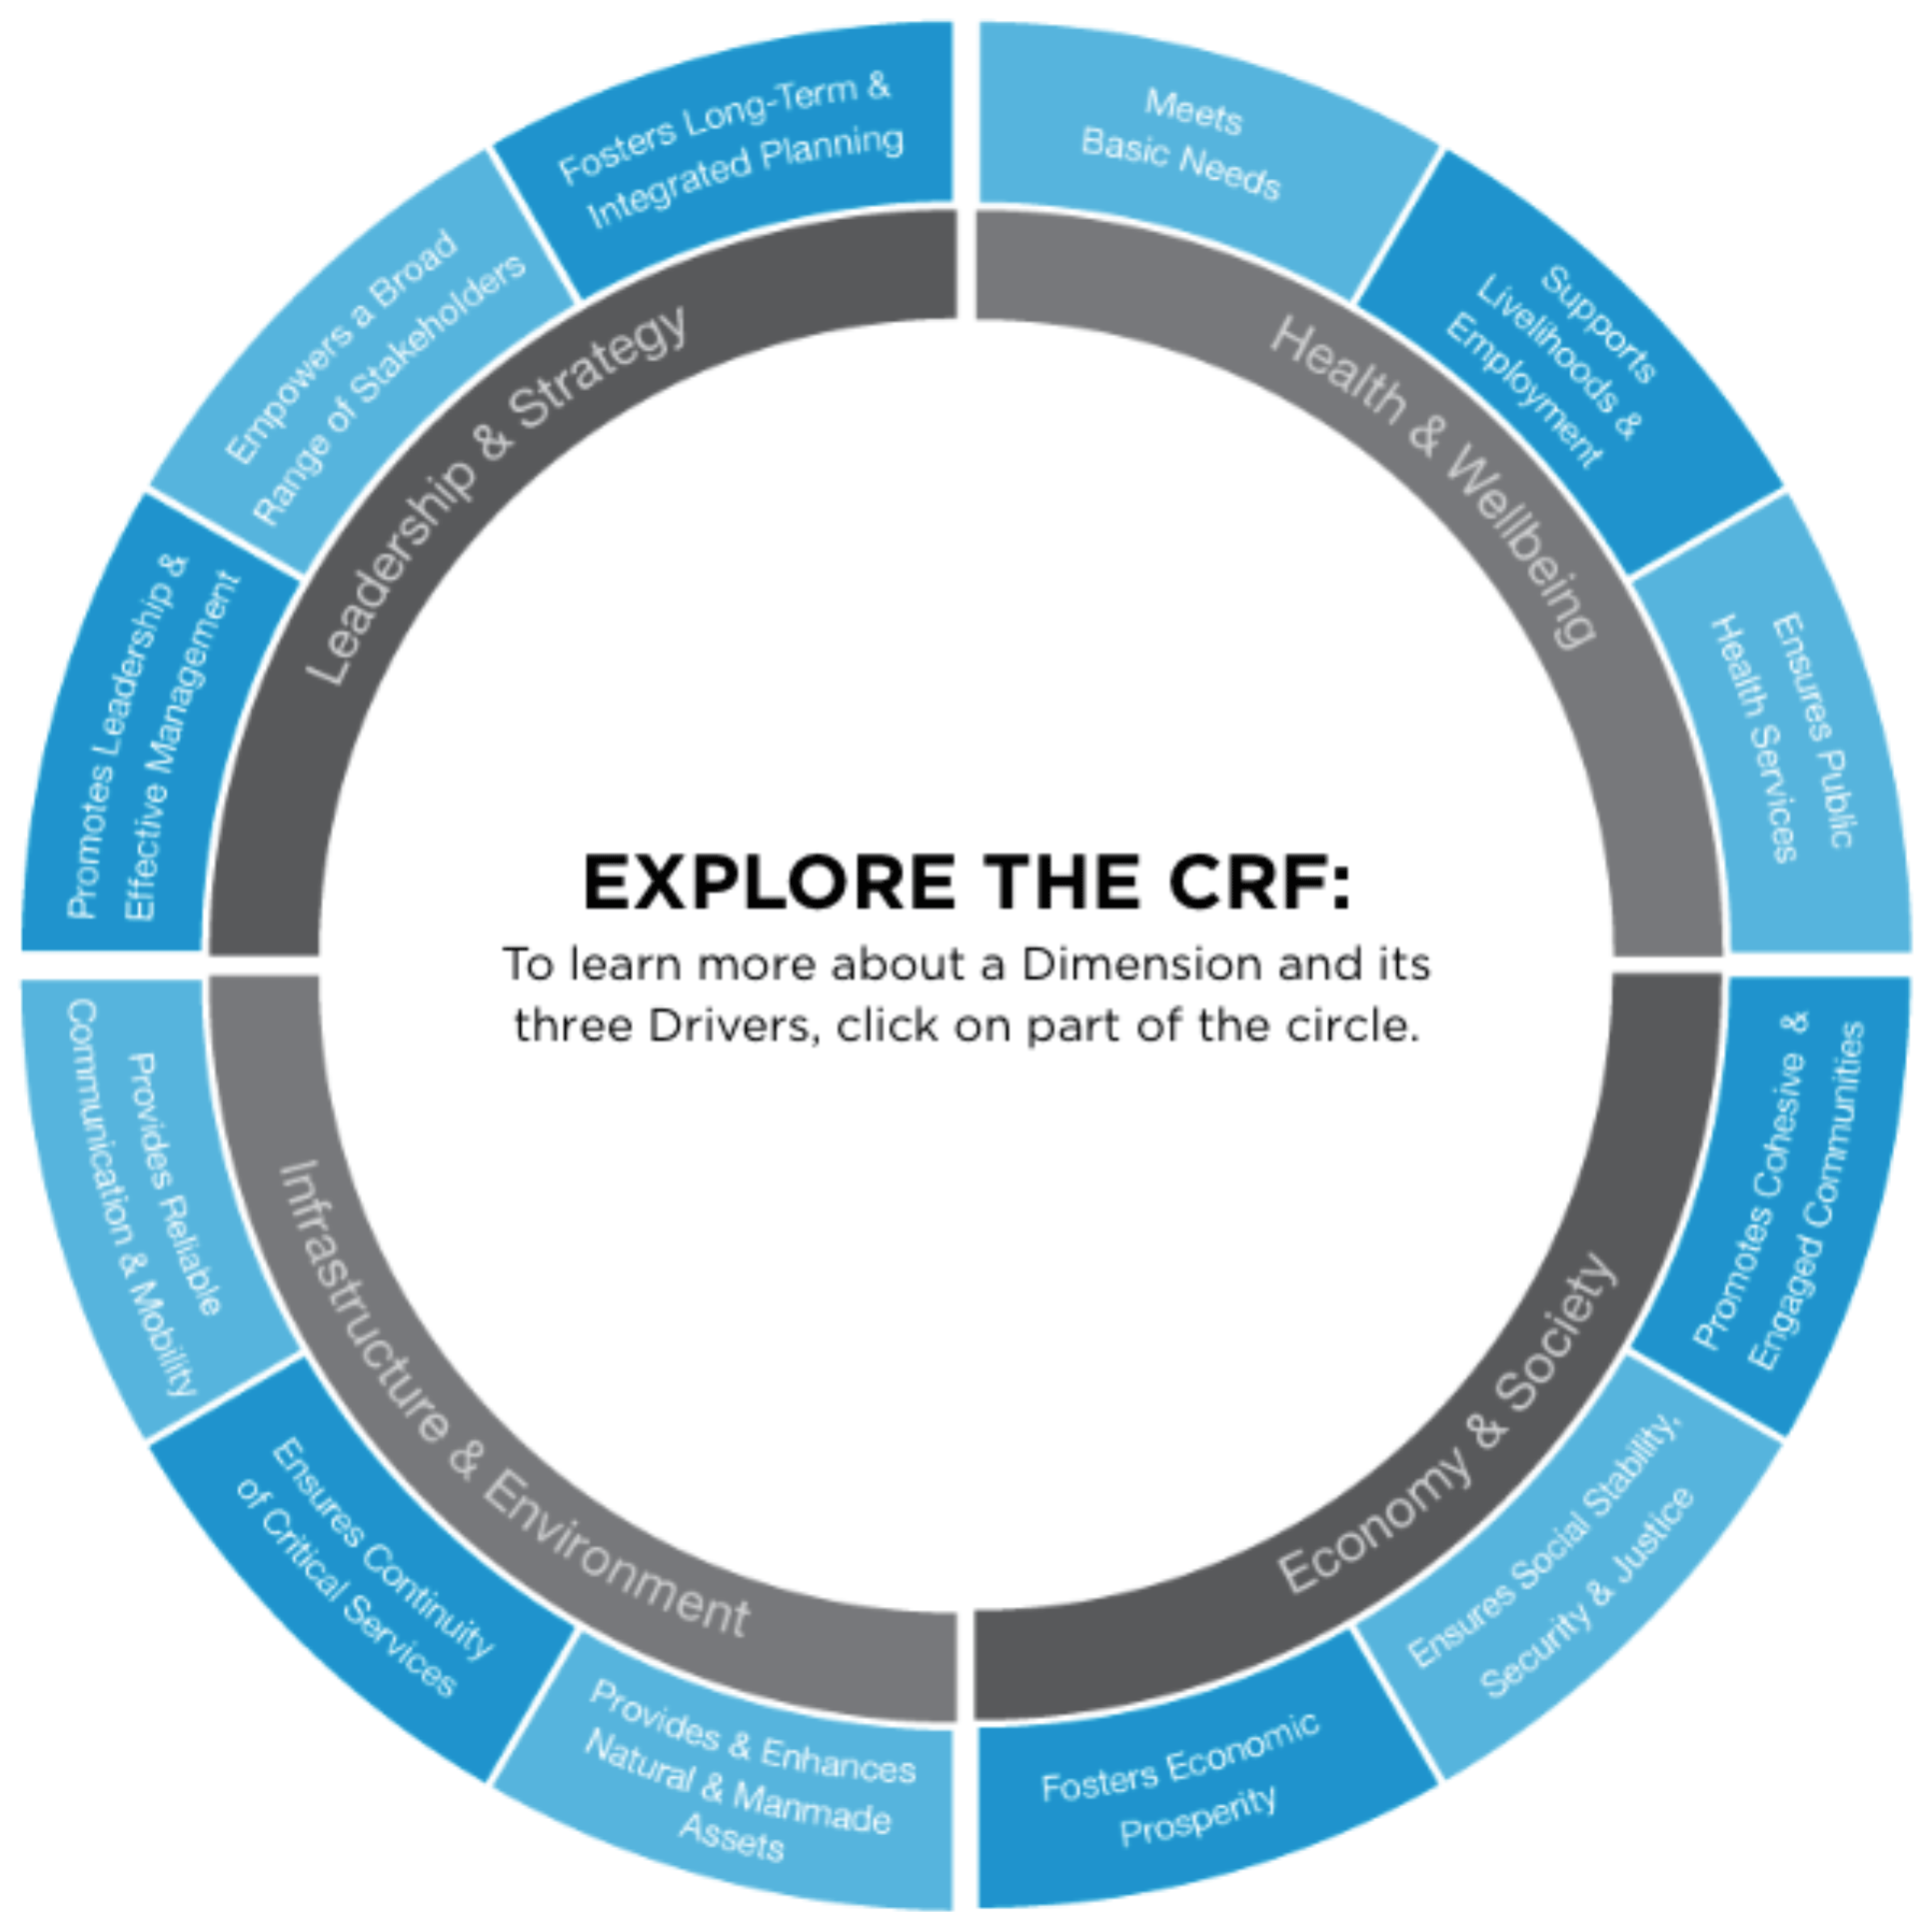
Figure 1100 Resilient Cities framework (taken from 100 Resilient Cities, 2015).
The definition of resilience via these indicators allows identifying criteria for resilience in a territory or within a population. It allows launching discussion around an initially fuzzy concept. However, it does not allow visualizing criteria or resilience potentials at the local level (100 Resilient Cities, 2015). Mapping is non-existent, and the absence of tangible data makes it difficult for local populations and actors to appropriate the concept, understand it and reproduce it.
Another study focused on identifying resilience capacities applied to urban networks. It led to the creation of the DS3 (spatial decision support system) model (Serre, 2018). Three resilience capacities were defined to study resilience (Serre, 2018), namely resistance, absorption and recovery (Fig. 2).
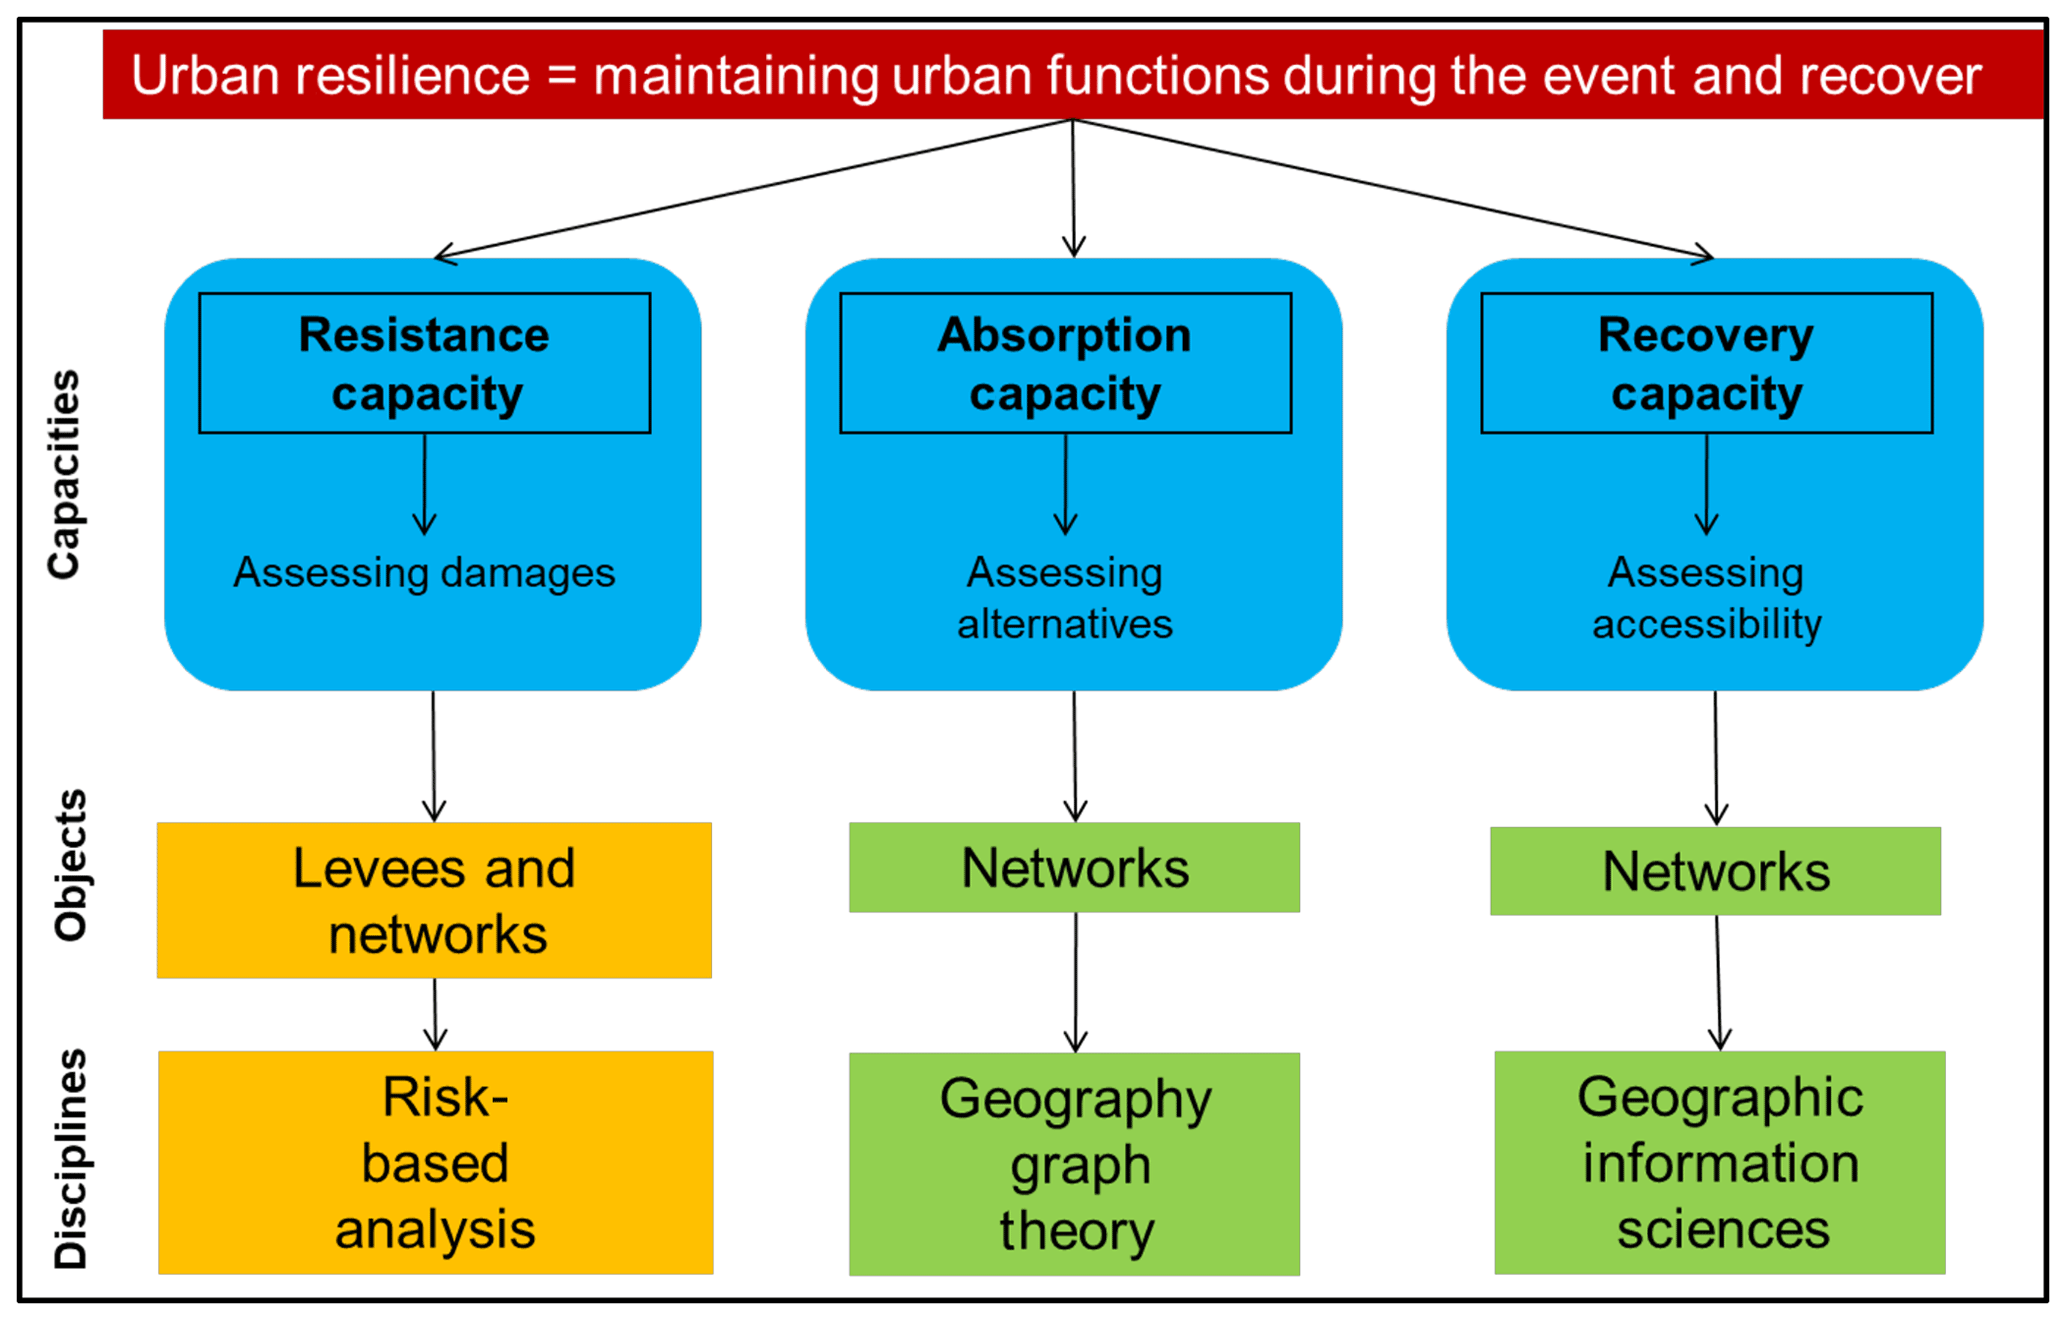
Figure 2DS3 Model (taken from Serre, 2016).
The resistance capacity is necessary to determine the material damage of the networks. It is a given that the more damaged a network is, the slower and more difficult it will be to return it to effective service. The results of the damage analysis make it possible to measure this damage and determine the interdependencies between the various components of the networks.
Absorption capacity represents the alternatives available to the network following a failure. The idea is to highlight solutions to maintain service continuity despite floods, operating in degraded mode.
Finally, the recovery capacity represents the time required to retrofit the networks until reaching a full level of service.
The DS3 model can be used to identify factors that would lead to increased urban resilience, highlighting the importance of urban networks and critical infrastructures. This technical approach focuses mainly on urban networks. However, cities comprise many factors, such as social dynamics, urban interactions and technical components, leading to additional indicators that must be monitored (Serre and Heinzlef, 2018).
A third study conducted by Cutter (Cutter et al., 2010) identified six indicators to measure resilience – social, economic, community, institutional, infrastructural and environmental. Each indicator is divided into sub-variables such as education, age, language proficiency, employment rate, immigration rate, access to food, disaster training, social stability, access to health, access to energy and so on. Each variable has a positive or negative effect on community resilience. Calculated using quantitative data, this method makes it possible to quantify and map resilience at the national level and more specifically at the county level in the United States. While this method greatly facilitates comparison across a large number of variables, the disadvantage is that the final score is not an absolute measure of community resilience for a single location but rather a relative value against which multiple locations can be compared. For this reason, the proposed work is done at the US scale (Fig. 3) and not at a finer scale or for a single year, not being a comparative work over several years.

Figure 3Disaster resilience value in USA (Cutter et al., 2014).
These three approaches attempt to address the biases of conceptualization and modelling resilience. But, in the first approach of the concept and data visualization, there is nothing evident about how the results should be processed and explored. In the second approach, the exploration of the results is visible through the application of the methodology, notably in a case study on Hamburg (Serre et al., 2016). Nonetheless, the exploration and analysis of the data are not accessible to the public concerned, limiting their understanding and appropriation of the method. Moreover, this approach analyses the territory only through urban networks and not with the other components that shape it. The third approach proposes a measurement and mapping of resilience, but the scale of analysis selected does not allow for decision-making by local stakeholders.
The objective of this work is therefore to model and operationalize resilience as comprehensively and exhaustively as possible. The aim is to analyse it at the local level in order to advise stakeholders and lead to decision-making that integrates resilience strategies into risk management.
2.2 Geovisualization techniques: added values in risk management processes
For many years, risk mapping was one of the main methods used to analyse, represent and examine the multiple characteristics of risks and risk management strategies (Barroca and Serre, 2018). However, new methods have been introduced, such as geographic information systems (GISs) and scientific information visualization (Kraak, 2003). A GIS gives access to voluminous and heterogeneous tools like databases and graphic applications to establish interactions between data and maps. These interactions can be visualized through an interface used to explore the characteristics of data. The adaptation of scientific visualization to mapping was initially called “geographic visualization” and then “geovisualization” (Maceachren and Kraak, 1997). Geovisualization is defined as “the set of visualization tools that allow interactive exploration of geolocated data in order to build knowledge without assumptions a priori” (Maceachren and Kraak, 1997). Geovisualization includes fields such as scientific visualization, mapping, image processing, knowledge extraction and GISs.
Therefore, geovisualization is a synthesis approach applied to GIS techniques that integrates practices such as mapping, visualization, data and image analysis by analysing geospatial data (MacEachren and Kraak, 2001). This methodology offers the possibility of representing multidimensional, voluminous and heterogeneous data. More specifically, geovisualization is mainly adapted to the representation and analysis of georeferenced data. The mapping exercise is divided into several objectives: explore, analyse, synthesize and present. Geovisual tools must be adapted to these different uses. The different tools currently available can be differentiated by three criteria. The first is the audience, which can range from the “general public” with little knowledge of geovisualization issues to experts with good knowledge of the subject. The second is the degree of interactivity offered by the geovisualization tool. The last criterion is knowledge of the data, which varies from the domain of the known to the domain of the unknown (MacEachren and Kraak, 1997). The four uses of geovisualization can therefore be placed inside a cube. Each axis of this cube () represents one of the three criteria previously mentioned (audience, interactivity, data relations).
This data representation (Donolo, 2014) – also called “virtual science” – allows constructing, reconstructing, representing and interpreting scientific issues (Yasobant et al., 2015). The ability to represent spatiotemporal data in different forms provides better understanding of the different phenomena involved, resulting in either better dissemination of the information or better decision-making. This methodology allows exploring hypotheses, sharing arguments, developing solutions and, most importantly, building common knowledge around the same issue (MacEachren, 1997).
Consequently, these characteristics and advantages make geovisualization an interesting methodology for studying risk management. Crisis management is, indeed, a concrete example of where it is useful to use visual, map-based tools to integrate, assess and apply multisource geospatial information and data (MacEachren et al., 2004). Indeed, in a context of climate change and related uncertainties, modelling or simulating disasters such as floods is becoming increasingly complex. Current techniques are limited in the face of the complexity of floods, particularly because of the multiple reasons, sources and causes of disasters (Leskens et al., 2014; Löwe et al., 2018), as they are essentially used to model urban planning projects or response strategies to cope with the increase in the occurrence of such events. Many studies have used geovisualization to analyse the complexity of flood risks, whether to analyse flooding from the perspective of risk, for instance expected damage (Meyer et al., 2009; Ward et al., 2011); hazard, such as duration, velocity, water depth, etc. (Schumann et al., 2009); and management strategy (de Moel et al., 2015) at the national (Burby, 2001), regional (Elmer et al., 2012; Gaslikova et al., 2011; Vorogushyn et al., 2012) and local (Aerts et al., 2013; Apel et al., 2009; Gerl et al., 2014) levels and even on the built scale (Fig. 4), with, for example, FReTs (flood resilience technologies; Schinke et al., 2016; Golz et al., 2015). Geovisualization techniques make it possible to aggregate different types of raw data (e.g. underground dynamics, urban structure, building vulnerability); transform them by joining these data (Fig. 4), calculating the damage rate based on these raw data; and then produce a final result, translated into a dynamic, understandable and accessible map.
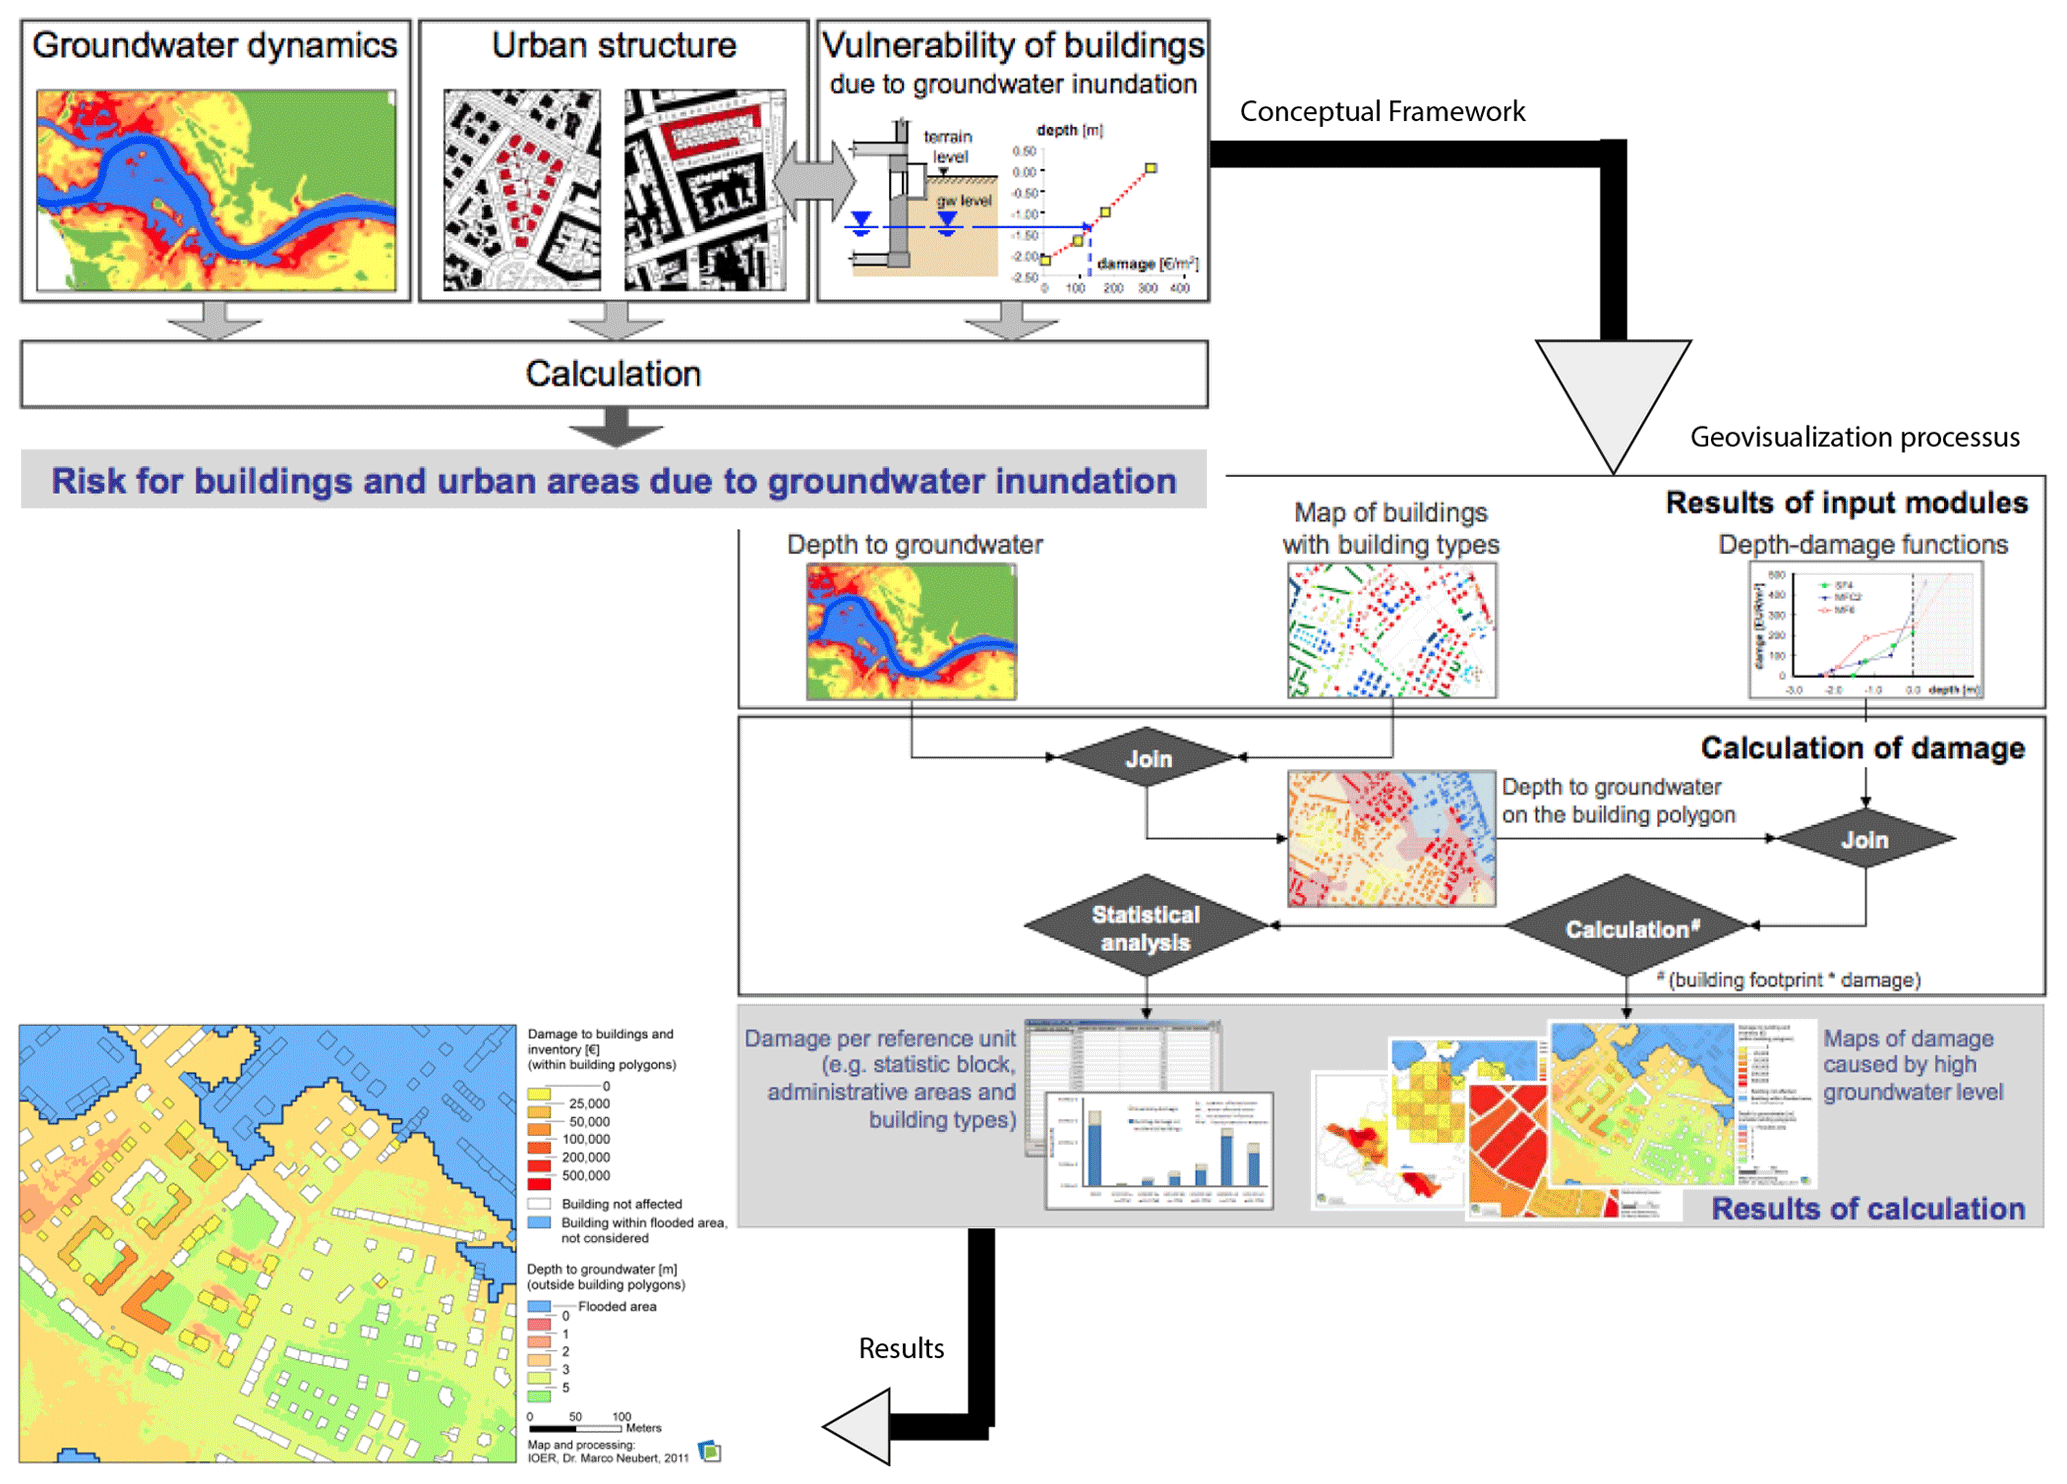
Figure 4Links between resilience modelling and geovisualization techniques – at the building scale (Schinke et al., 2012).
To summarize, geovisualization helps in exploring data, using visual geospatial representations to imagine hypotheses, solve problems and co-construct scientific knowledge (Kraak, 2003). Therefore, geovisualization methodology improves territorial knowledge and leads to tools such as decision support systems by making possible dialogues between users and stakeholders and promoting collaborative approaches. In the field of risk management, it is essential to defuse subjects of tension in order to present a risky situation objectively.
2.3 Making urban resilience operational through geovisualization techniques
Although several methods can be used to model risk characteristics, such as hydraulic modelling (Ernst et al., 2010) and geomorphological parameters (Bathrellos et al., 2012), it is quite difficult to model such fuzzy concepts like resilience and vulnerability, despite the common use of the latter in risk management. While the implementation of resilience policies and the design of resilient cities are desirable, assessing resilience and implementing it are complex. Several researchers have examined the difficulty of defining, implementing and evaluating urban resilience, usually through a geovisualization approach.
Cutter and Finch (2008) presented SoVI (Social Vulnerability Index), a tool providing a county-level (USA scale) comparative metric of social vulnerability to natural hazards based on socioeconomic and demographic profiles. The aim of SoVI is to illustrate the geographic patterns of the USA by defining social vulnerability as the sensitivity of a population to natural hazards and its ability to respond to and recover from them. Using several maps and in view of improving emergency management, SoVI identifies which areas of the American territory are more or less vulnerable and why. Geovisualization techniques improve understanding of the concept of vulnerability and help urban managers to localize vulnerable areas and variables.
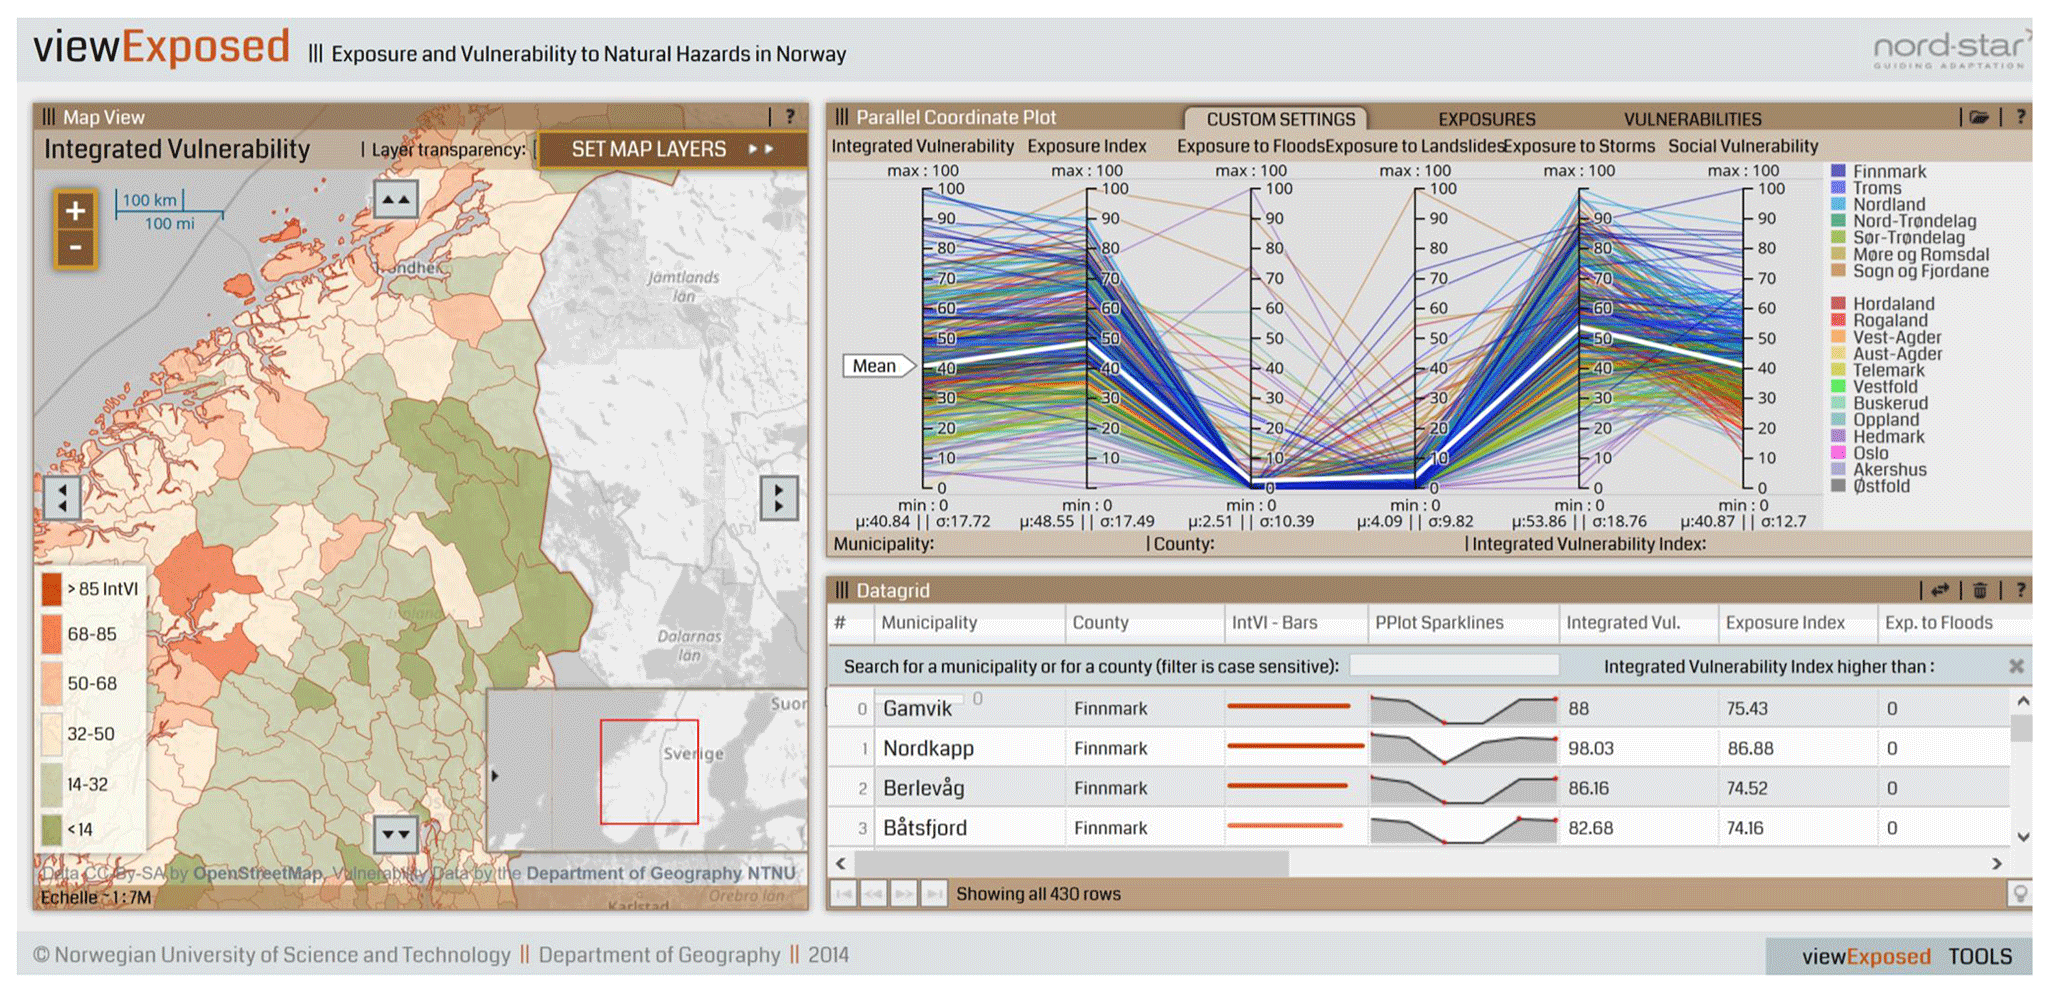
Figure 5The ViewExposed interface (Opach and Rød, 2013).
Based on SoVI, a Norwegian study examined the vulnerability of territories to climate change (Opach and Rød, 2013). To avoid an increase in local and national vulnerability, the researchers built a ViewExposed tool (Fig. 5), whose objective was to inform local authorities about the most vulnerable areas of Norwegian territory and the causes of this vulnerability.
The ViewExposed tool focuses on Norwegian municipalities' exposure to natural hazards and the capacity of local populations to resist them. This interface tool was designed for professionals, local elected officials and local residents. It is the result of collaboration between scientists and local experts via workshops. Although focused on the concept of vulnerability, this tool also integrates the response of local managers and actors to natural disasters, corresponding to the first step in resilience integration.
Another team of researchers and insurers developed a tool to help people in the Nordic countries to protect themselves and prepare for climate risks. The main target users are private landowners, but this tool can also be used by land-use planners and property managers. The tool, VisAdapt (Johansson et al., 2016), is intended as a guide on how to prepare for climate events liable to affect individual homes. It is very simple to use, so every citizen can employ it. The obvious interest of this tool is that it allows addressing local inhabitants directly by proposing solutions to adapt to natural risks linked to climate change.
These tools have the merit of proposing operational instruments to obtain a clearer idea of the vulnerability concept involved. The main scale is above all the national scale, which, despite major advances in the visualization and knowledge of vulnerable zones, does not always lead to decision-making by local actors and managers, since the scale is sometimes too broad for action. Beyond the spatial scale, the choice of data and tools for processing, analysis and visualization has not been designed for non-expert audiences. Data are not always freely accessible, nor are the processing and representation tools. Some tools are intended only for professionals, while others point to the need to open the results to a wider audience. In addition, the data are not accessible and downloadable, which makes the methodology difficult to adopt and reapply in other territories outside the scope of expertise of the research team. The limits are therefore divided between the choice of spatial scale, the free and accessible nature of data and tools, and the non-integration of local actors and thus the assurance of their understanding of the tools and concepts used. In addition, this research focuses on the “vulnerability” prism of risk management. While we defend the fact that these two concepts are linked and inseparable (Provitolo, 2012) in the apprehension of climate disruption (Heinzlef, 2019), the difficult definition of resilience and its operationalization is noteworthy. When vulnerability is defined as the propensity of a territory and a population to suffer damage, resilience focuses on the strategies and means to prepare territories and populations for the increase in risks and their damage in order to limit the negative impacts. Resilience is therefore more complex to quantify, operationalize and visualize. Here, we intend to overcome these limitations by proposing the approach we developed.
The objective of this research consists of the following:
-
making the concept of resilience more understandable through the construction of three indicators to define and measure resilience,
-
producing mapping results to quantify and visualize the results obtained,
-
designing a comprehensive method including choice of data, processing and analyses for local actors by mobilizing geovisualization techniques,
-
mapping the results to support decisions in favour of resilience to floods.
3.1 A framework for defining resilience data?
To analyse urban territories including their complexity through the prism of resilience, it was necessary to define their issues and challenges; their dynamics, material and immaterial interactions; and their structures that impact the functioning of urban space. It is essential to understand the city as a system (Gardner, 2016). These urban systems, like any living organism, are complex and hierarchical. Some studies have explored the impact of rapid urbanization, leading to complex territorial responses and the lack of suitable reactions. In parallel, challenges can increase when the country's gross domestic product (GDP) decreases. Nevertheless, in some case studies, urbanization has been shown to have other results and is one of main elements to be taken into account when building response capacity to risks (Garschagen and Romero-Lankao, 2015). This response capacity can be determined by flood preparedness (Chinh et al., 2016), government implication and risk governance (Garschagen, 2015). Studying the city in the face of risks and its resilience capacity requires considering different spatial scales of interactions and challenges. Therefore, several questions must be asked to support the understanding of the concept of resilience and decision-making, including the following. Who is vulnerable and/or resilient? What? When? What elements could limit the impacts of a crisis like a flood event? Are they efficient before, during and after a flood?
These questions allowed us to establish three resilience indicators to study technical, urban and social resilience (Heinzlef et al., 2019). The methodological choice of using indicators was based on several arguments. The first one is that by defining and characterizing an abstract concept, indicators allow sensitizing both the scientific community and the public to complex subjects (Prior and Hagmann, 2014). In addition, resilience indicators can make an important contribution to assessing a community's needs and goals while helping it to develop resilience strategies (Cutter, 2016). These indicators, useful when creating a strategy, are also important for monitoring the decision-making process. Finally, an essential benefit of using such indicators is that they can act as driving factors for risk management by including the concept of resilience clearly and more holistically (Linkov et al., 2014). The objective is to analyse the different social, urban and technical components (Serre and Heinzlef, 2018) of the area concerned (Table 1). The indicators were designed after adapting the Baseline Resilience Indicators for Communities (BRIC) methodology (Cutter et al., 2008; Patil et al., 2008; Singh-Peterson et al., 2014).

3.2 Resilience processing
The advantages of using geovisualization techniques to remove barriers to resilience are as follows:
-
analysing heterogeneous and geolocated data,
-
supplying a visualization based on the most recent scientific advances,
-
extracting, producing and sharing data with innovative layouts.
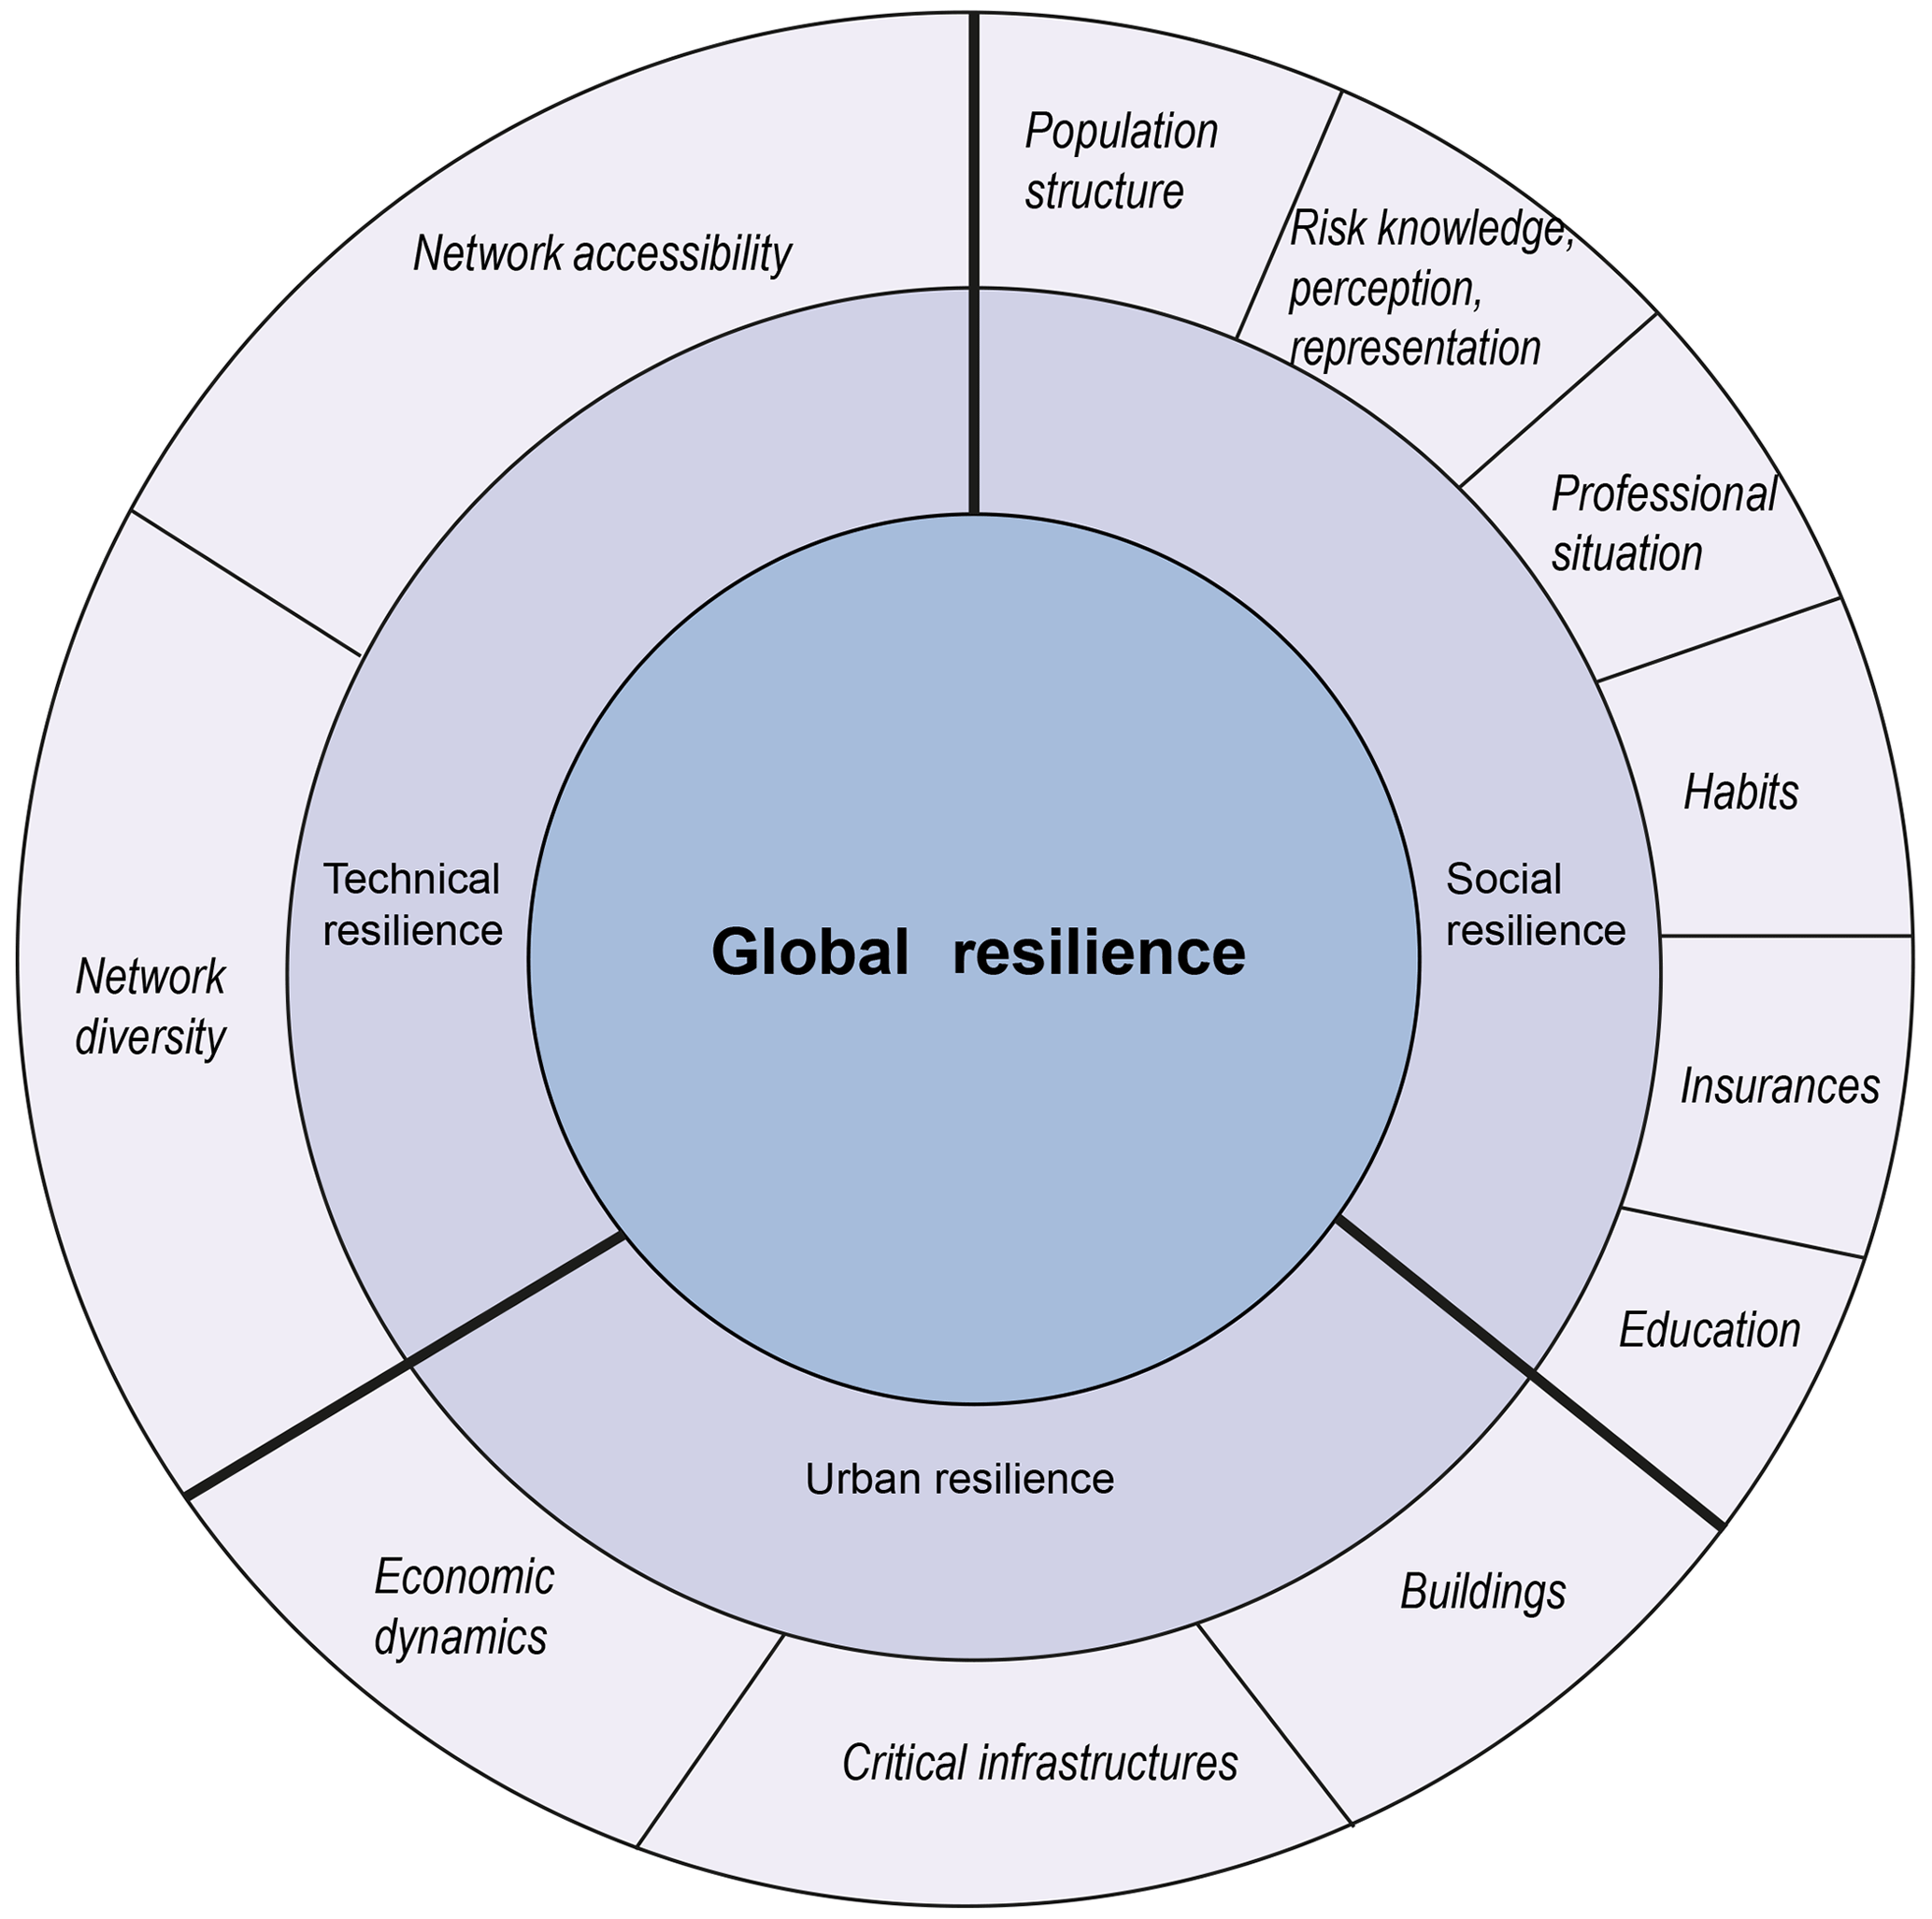
Figure 6Resilience characteristics (Serre and Heinlef, 2018).
To address these three pillars, we propose clarifying some of the resilience criteria defined above (Fig. 6) around three resilience indicators: social, technical and urban.
We argue that analysis of resilience at the local level is facilitated by using open-access data. On the other hand, data processing and analysis become more understandable for local actors when tools are chosen that highlight the visualization.
3.2.1 Data used for resilience assessment
We chose to use mainly open data which we acquired via the INSEE service of the French Ministry of the Economy and Finance (National Institute of Statistics and Economic Studies), whose function is to collect, analyse and disseminate data. Since we wanted to analyse urban resilience at the community scale as finely as possible, we chose to analyse the IRIS (Islets Grouped for Statistical Information) scale which constitutes the basic building block for the dissemination of infra-communal data.
The concept of “open” and accessible science has been developed to strengthen dialogue and commitment among scientists and the local population around common issues and problems by creating a language and vocabulary understandable to everyone. While there are obvious limitations to open data – security, privacy and property protection – it is nonetheless accepted that using ideas and knowledge freely is a universal right. This is why we chose to use a data source whose access, use and downloading are free: not only to ensure the reproducibility (Jovanovic et al., 2018) of the methodology but also to participate in the education and communication of the concept of resilience.
In addition to the INSEE INSPIRE database, we used the data from the SIRENE database (INSEE) in open source. The SIRENE database is an INSEE service used to identify all the characteristics of companies and establishments. The information provided gives a precise idea of the company's activity, its date of creation, etc. These data were used for the urban and technical resilience indicators to demonstrate economic, urban and technical dynamism.
Data from the city cadastre (MAJIC) were also used to complete the open-data database. These data are considered sensitive and owned exclusively by municipalities. It is therefore essential to create a partnership with a city and its GIS services.
3.2.2 Method and tools for resilience assessment
After selecting the raw data, data were transformed and normalized with a theoretical orientation. In order to understand the frequency of each variable, each item of raw data has been transformed into percentages:
Nevertheless the weighting is 1 for all the variables (Holand et al., 2011). This single weighting is explained by the willingness to avoid disparities between the variables (Fekete, 2009), since some of them are sensitive and subjective. Indeed, we have no theoretical references (Esty et al., 2005), and there is no practical experience (Fekete, 2009) on which to determine weights that are mostly subjective. Besides, applying such weights does not necessarily reflect decision makers' and urban planners' priorities and realities (Cutter et al., 2010). Nonetheless, since this approach puts forward a participatory and collaborative methodology, readjusting the weight of these variables with regard to managers' perceptions is entirely justified and in line with the current approach.
Following this process, it was necessary to determine the normalization. Normalization allows adjusting a series of values (typically representing a set of measurements) according to a transformation function to make them comparable with certain specific reference points. We proceeded with a min–max standardization (Casadio Tarabusi and Guarini, 2013) to obtain a positive resilience impact variable (Eq. 4) and a negative resilience impact variable (Eq. 5), where each variable is decomposed into an identical range between zero (worst rank) and 1 (best rank), to create indicators with similar measurement scales, and to compare them:
The choice of processing tools was influenced by the availability of open-source tools in order to uphold transparency and collaborative approaches as well as the availability of such tools to all stakeholders. To create the computer script, we used a tool, the Feature Manipulation Engine (FME), to extract, transform and load raw data (extraction–transformation–loading). Its interface allows visualizing each step of the processing, from loading raw data (INSEE files) to choosing variables, while integrating the resilience formula to finally obtain the results. Although this tool has a cost, it is nevertheless used by GIS practitioners at a large scale, nationally and internationally.

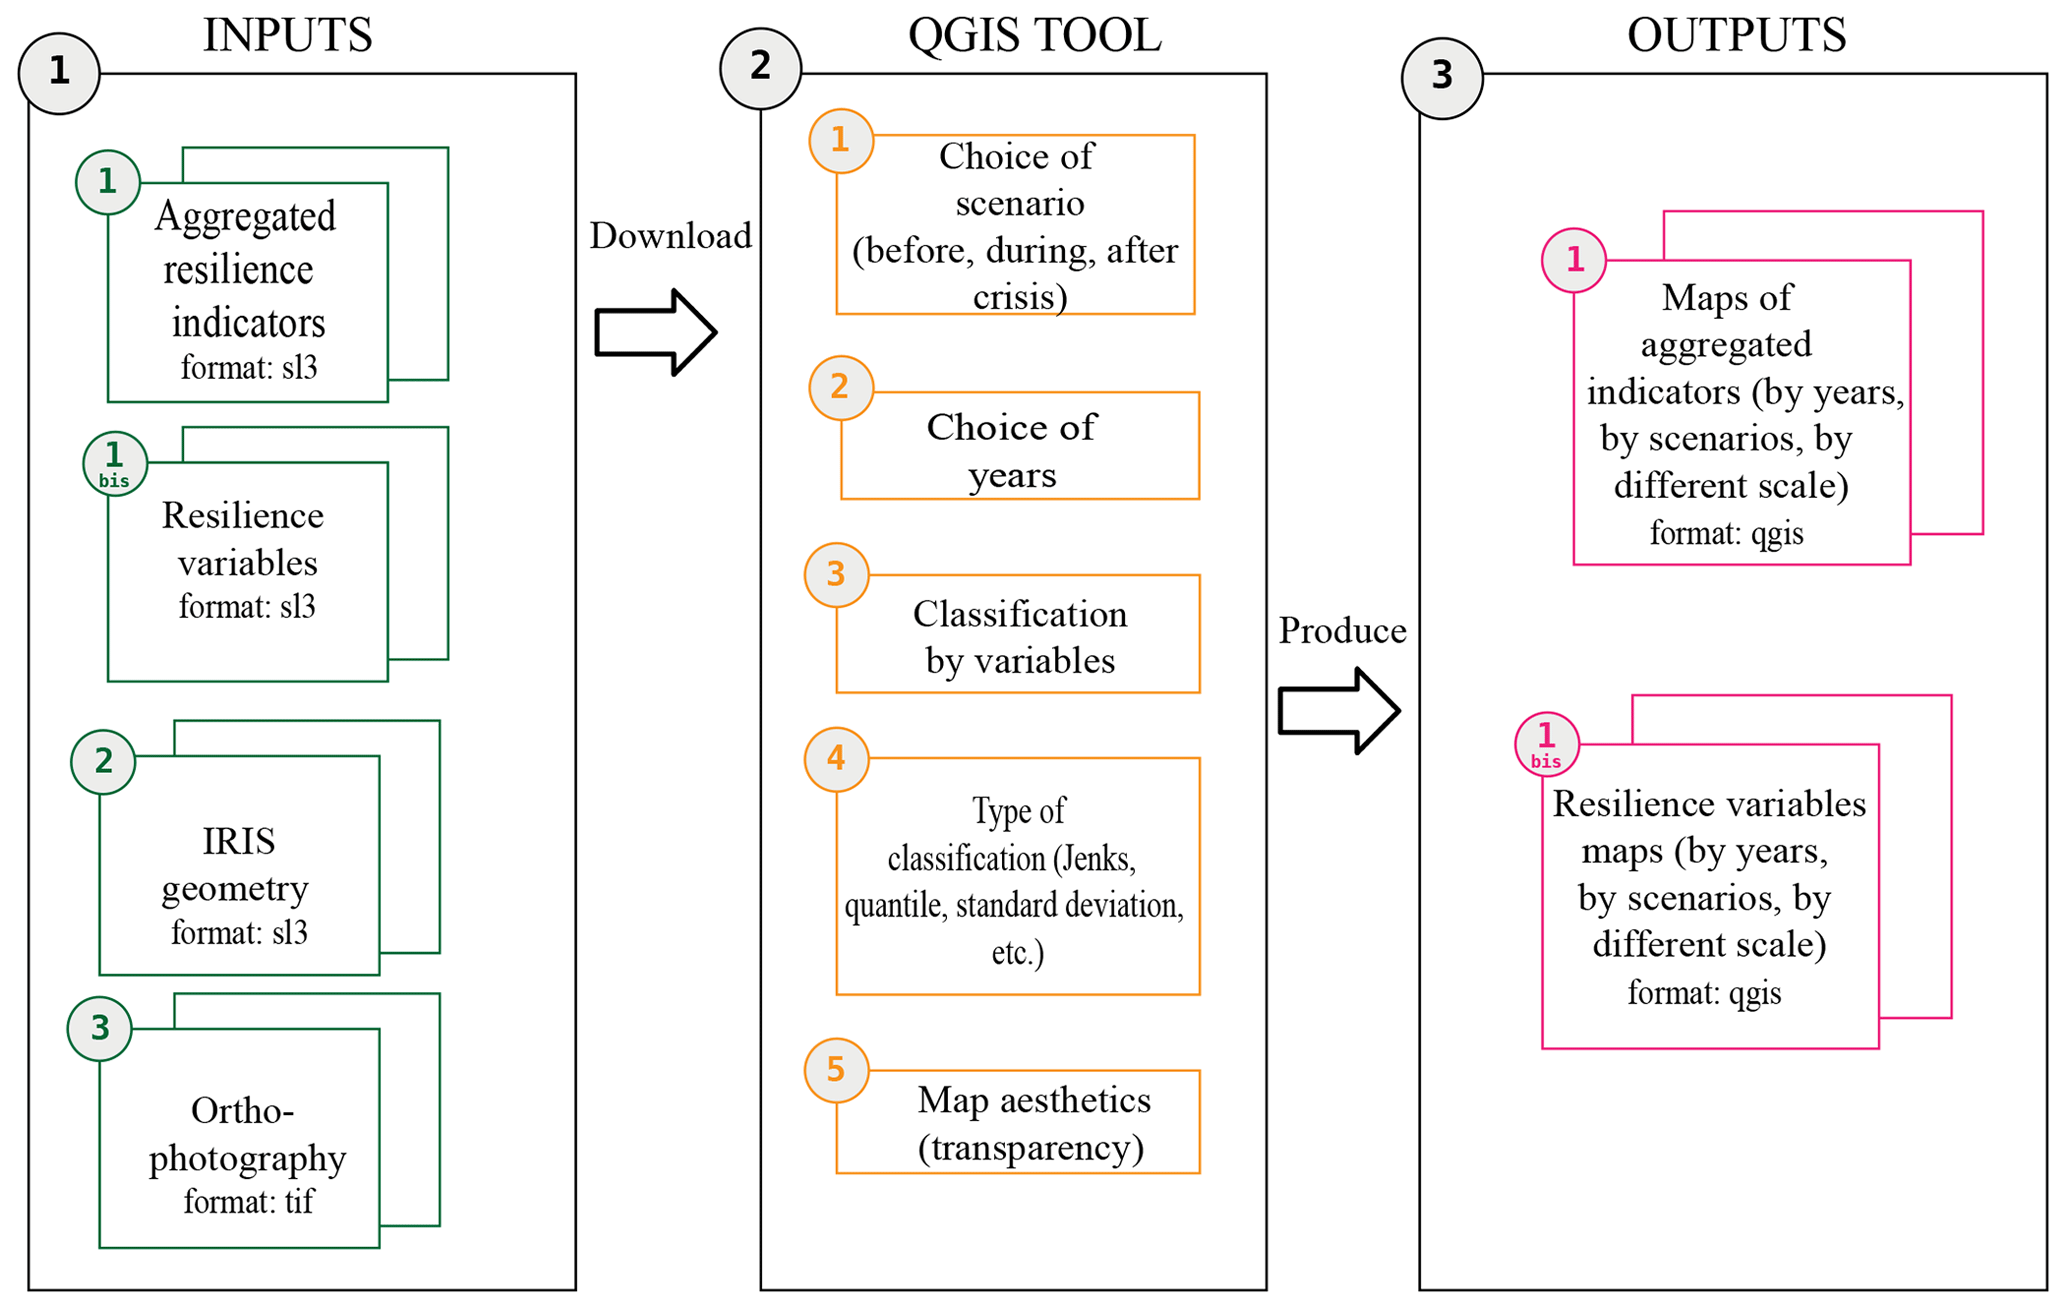
Several steps (Fig. 7) were necessary to set up the computer script, integrate the input data, create a geometry, generate the processing and forecast an overall resilience value. The output data are in SpatiaLite format (sl3 format), which is a spatial extension of SQLite and provides vector geodatabase capacity. This format can be understood by many processing, visualization and mapping software applications, including QGIS.
Once the computer processing was completed, the visualization and analysis work was done via a GIS, namely the QGIS software (Fig. 8). It allows the automatic spatialization of data according to data variables or variables resulting from relationships between objects and finally the use of graphical tools to visualize and differentiate data (sizes, colours, distances).
The map is therefore a decision-making tool in the sense that it represents and filters a mass of data and makes them accessible and comprehensible. But the production of a map cannot in itself be considered a spatial decision support system: its value first depends on the consistency and reliability of the information collected upstream, then on its structuring and effective readability.
4.1 Avignon flood issues
Avignon, the chief administrative centre of Vaucluse, is faced with flood risk due to its proximity to the confluence of the Rhône and Durance rivers (Fig. 9). The island of Barthelasse, the largest river island in Europe, is the area of Avignon most affected by the Rhône's floods. It serves as a buffer between the city and the Rhône and serves to absorb floods. The few existing dikes protect the island from low floods, but it is still floodable, as shown by the 2 m floods in 1993, 1994, 2002 and 2003.

Figure 9Extreme flood scenario in Avignon (Heinzlef et al., 2019), inspired by © DREAL PACA.
Therefore, a spatial decision support system that integrates resilience into practice would be helpful for a flood-prone community. It was developed in partnership with the Avignon city council GIS department. This collaboration took place at several levels, namely in the involvement of local actors in the study, in the data exchange process and in the choice of processing tools, to ensure and improve the reusability of the methodology once the study had been completed. The final choice of resilience variables, data processing and their final visualization was made in constant collaboration with the city's technical services to ensure that data and their analyses were shared and understood.
4.2 Resilience to flood assessment in Avignon: a few results
The city was divided into a local scale – IRIS scale – to visualize which areas are resilient or not. The indicators – social (Fig. 10), urban and technical – and each variable (Fig. 11) included in the model can be visualized. Therefore, it is easier to perceive which variables improve resilient capacities and which areas have developed these variables or not. As each indicator is independent of each other, it is easier for politicians and managers to work on variables with low levels of resilience and identify areas to be redeveloped and/or reintegrated into urban dynamics.

Figure 10Social resilience indicator – multi-scenario, Avignon scale (IRIS-scale analysis). Panel (a) identifies the most resilient areas (greener) according to the social resilience characteristics before a crisis, panel (b) identifies the most resilient areas according to the social characteristics during a crisis and panel (c) identifies the most resilient areas according to the social characteristics after a crisis – © Open Database License, “ODbL” 1.0.
The difference between the three maps in Fig. 10 is explained by the different scenarios considered before, during and after a crisis. Not every variable is included in every scenario. For example, age variables are important before (preparation, knowledge of risk, etc.), during (understanding of the situation, ability to move, etc.) and after the reconstruction process. On the contrary, whether or not individuals have a job does not play a role during the crisis but is decisive afterwards in order to rebuild and relaunch an activity.
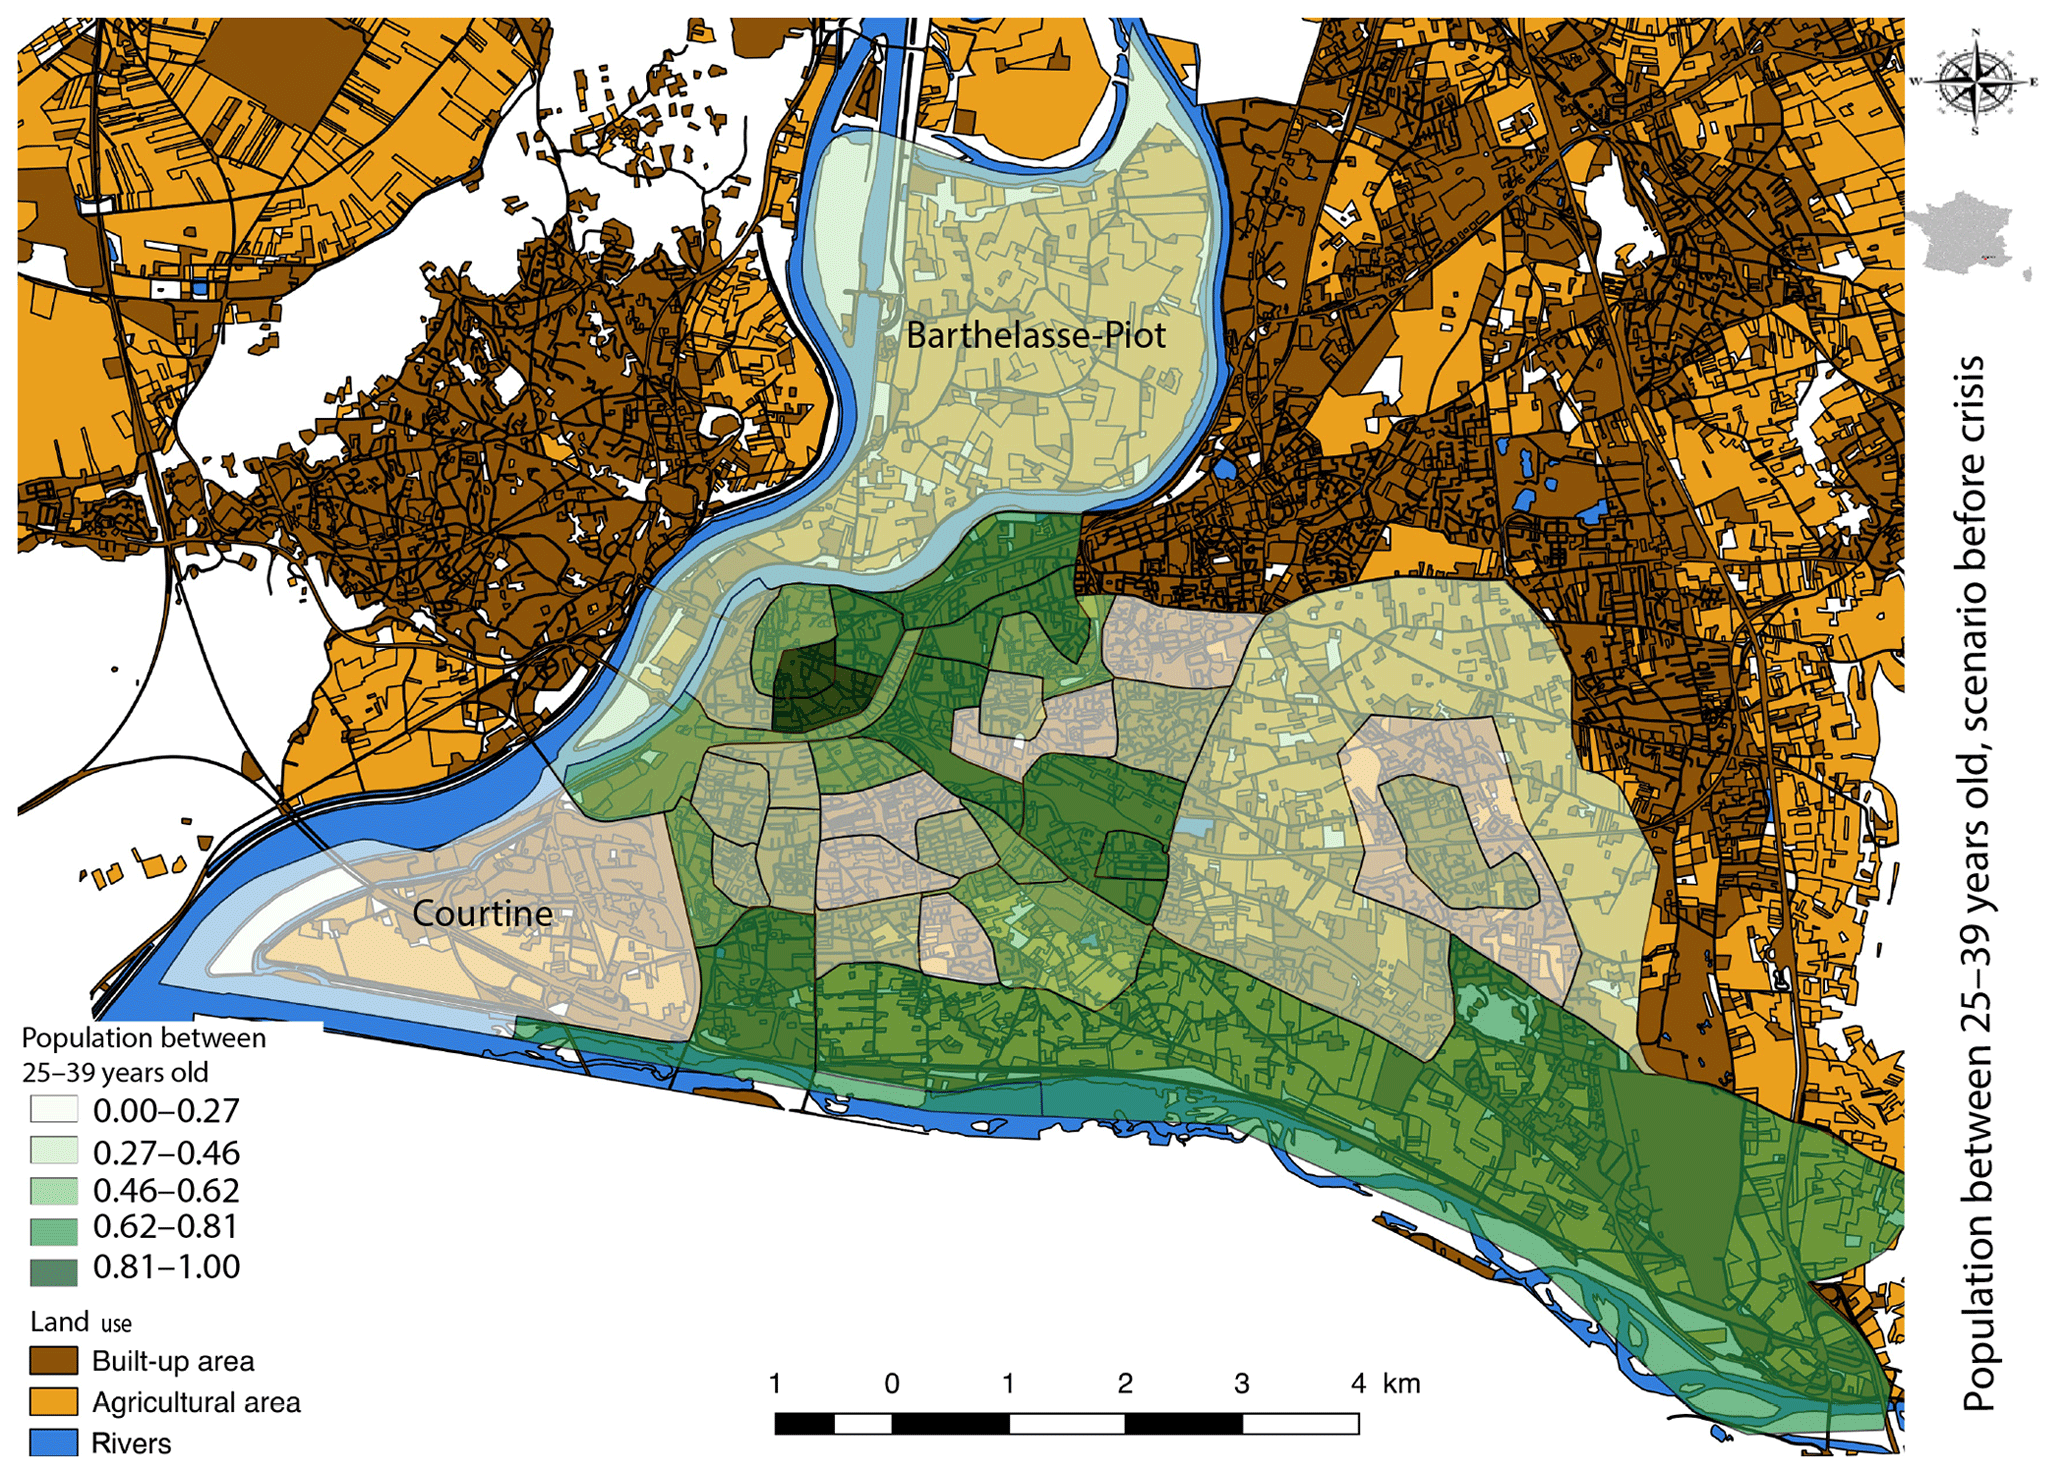
Figure 11Population between 25- and 39-year-old-scenario before crisis, at the Avignon scale (IRIS-scale analysis). The map identifies the value of the population variable 25–39 years old according to the total IRIS population before a crisis – © Open Database License, “ODbL” 1.0.
Figure 11 shows the location of individuals aged 25 to 39 years, with a segment of the population potentially more resilient, before, during and after. Indeed, they can have a risk culture beforehand, act and survive during, and restart an activity after the disruptive event. They are more prevalent in the city centre and in the south and south-east. This is mainly due to the location of the two universities, in the city centre and outside the city walls, which favours student accommodation and low-cost housing.

Table 2 presents the value of each variable according to the pre-crisis scenario for the IRIS of Barthelasse and Courtine (Table 2) after min–max standardization. These values illustrate the representativeness of each variable in the territory and make it possible to understand the social and spatial dynamics at the IRIS scale for Barthelasse and Courtine. This detailed analysis, carried out on a variable-by-variable basis, allows engaging in a discussion with local actors in an attempt to reintegrate neighbourhoods at the margins of territorial functioning in order to work on the integration of urban resilience in the face of daily territorial stresses and when confronted by a more exceptional event such as a flood.
Regarding the urban resilience indicator, INSEE data are available from 2009 to 2013, thus making it possible to perform a multi-date analysis over several years (Fig. 12) and gain understanding of urban evolutions and resilience trends. For instance, certain elements have evolved, such as the proportion of tourist accommodation and surgical and hospital activities, thereby increasing resilience capacities. Moreover, the advantage of using open data allows temporal as well as spatial scales to evolve, and the indicators can therefore be tested on other municipalities on the national territory.
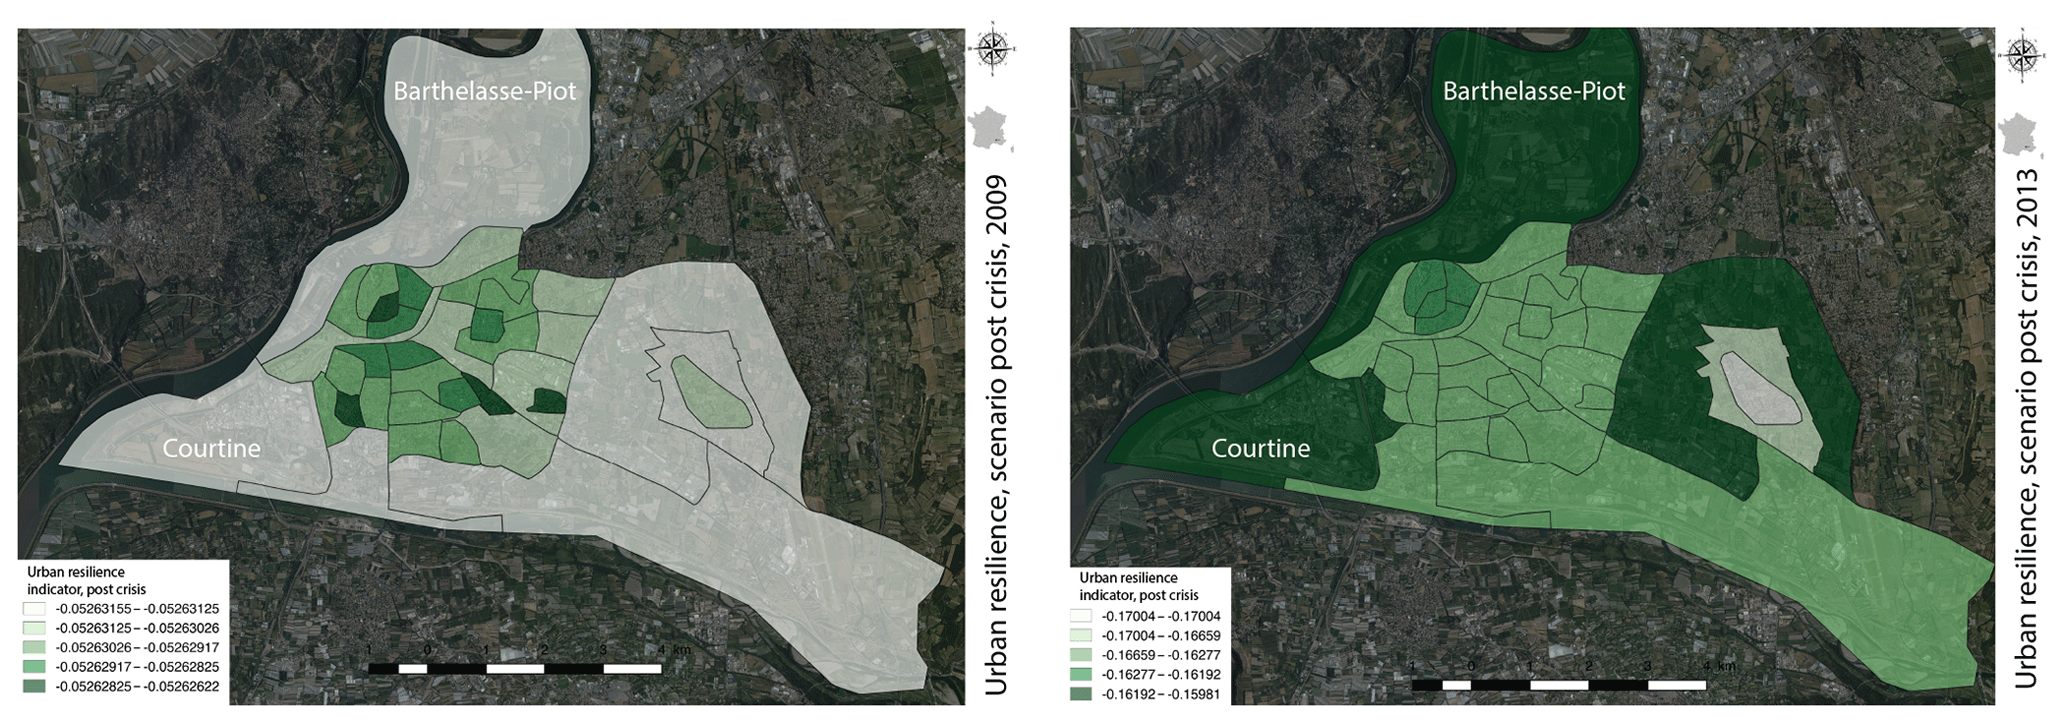
Figure 12Comparative analysis between 2009 and 2013 for the urban indicator, post-crisis scenario, at the Avignon scale (IRIS-scale analysis). The map on the left identifies the most resilient areas according to the urban characteristics after a crisis in 2009; the map on the right identifies the most resilient areas according to the urban characteristics after a crisis in 2013 – © Open Database License, “ODbL” 1.0.
After reflection on the visibility of the results, information sharing, and a neutral and collaborative approach, we are considering making our work accessible to inhabitants by developing a website to continue the risk communication process on flood risks and strengthen the geovisualization process. This website, which is currently subject to reflection, was developed with the creation of interactive maps accessible via a weblink (http://umap.openstreetmap.fr/fr/map/rg_avantcrise_353189#12/43.9311/4.8914, last access: 9 April 2020) and a QR code (Fig. 13).
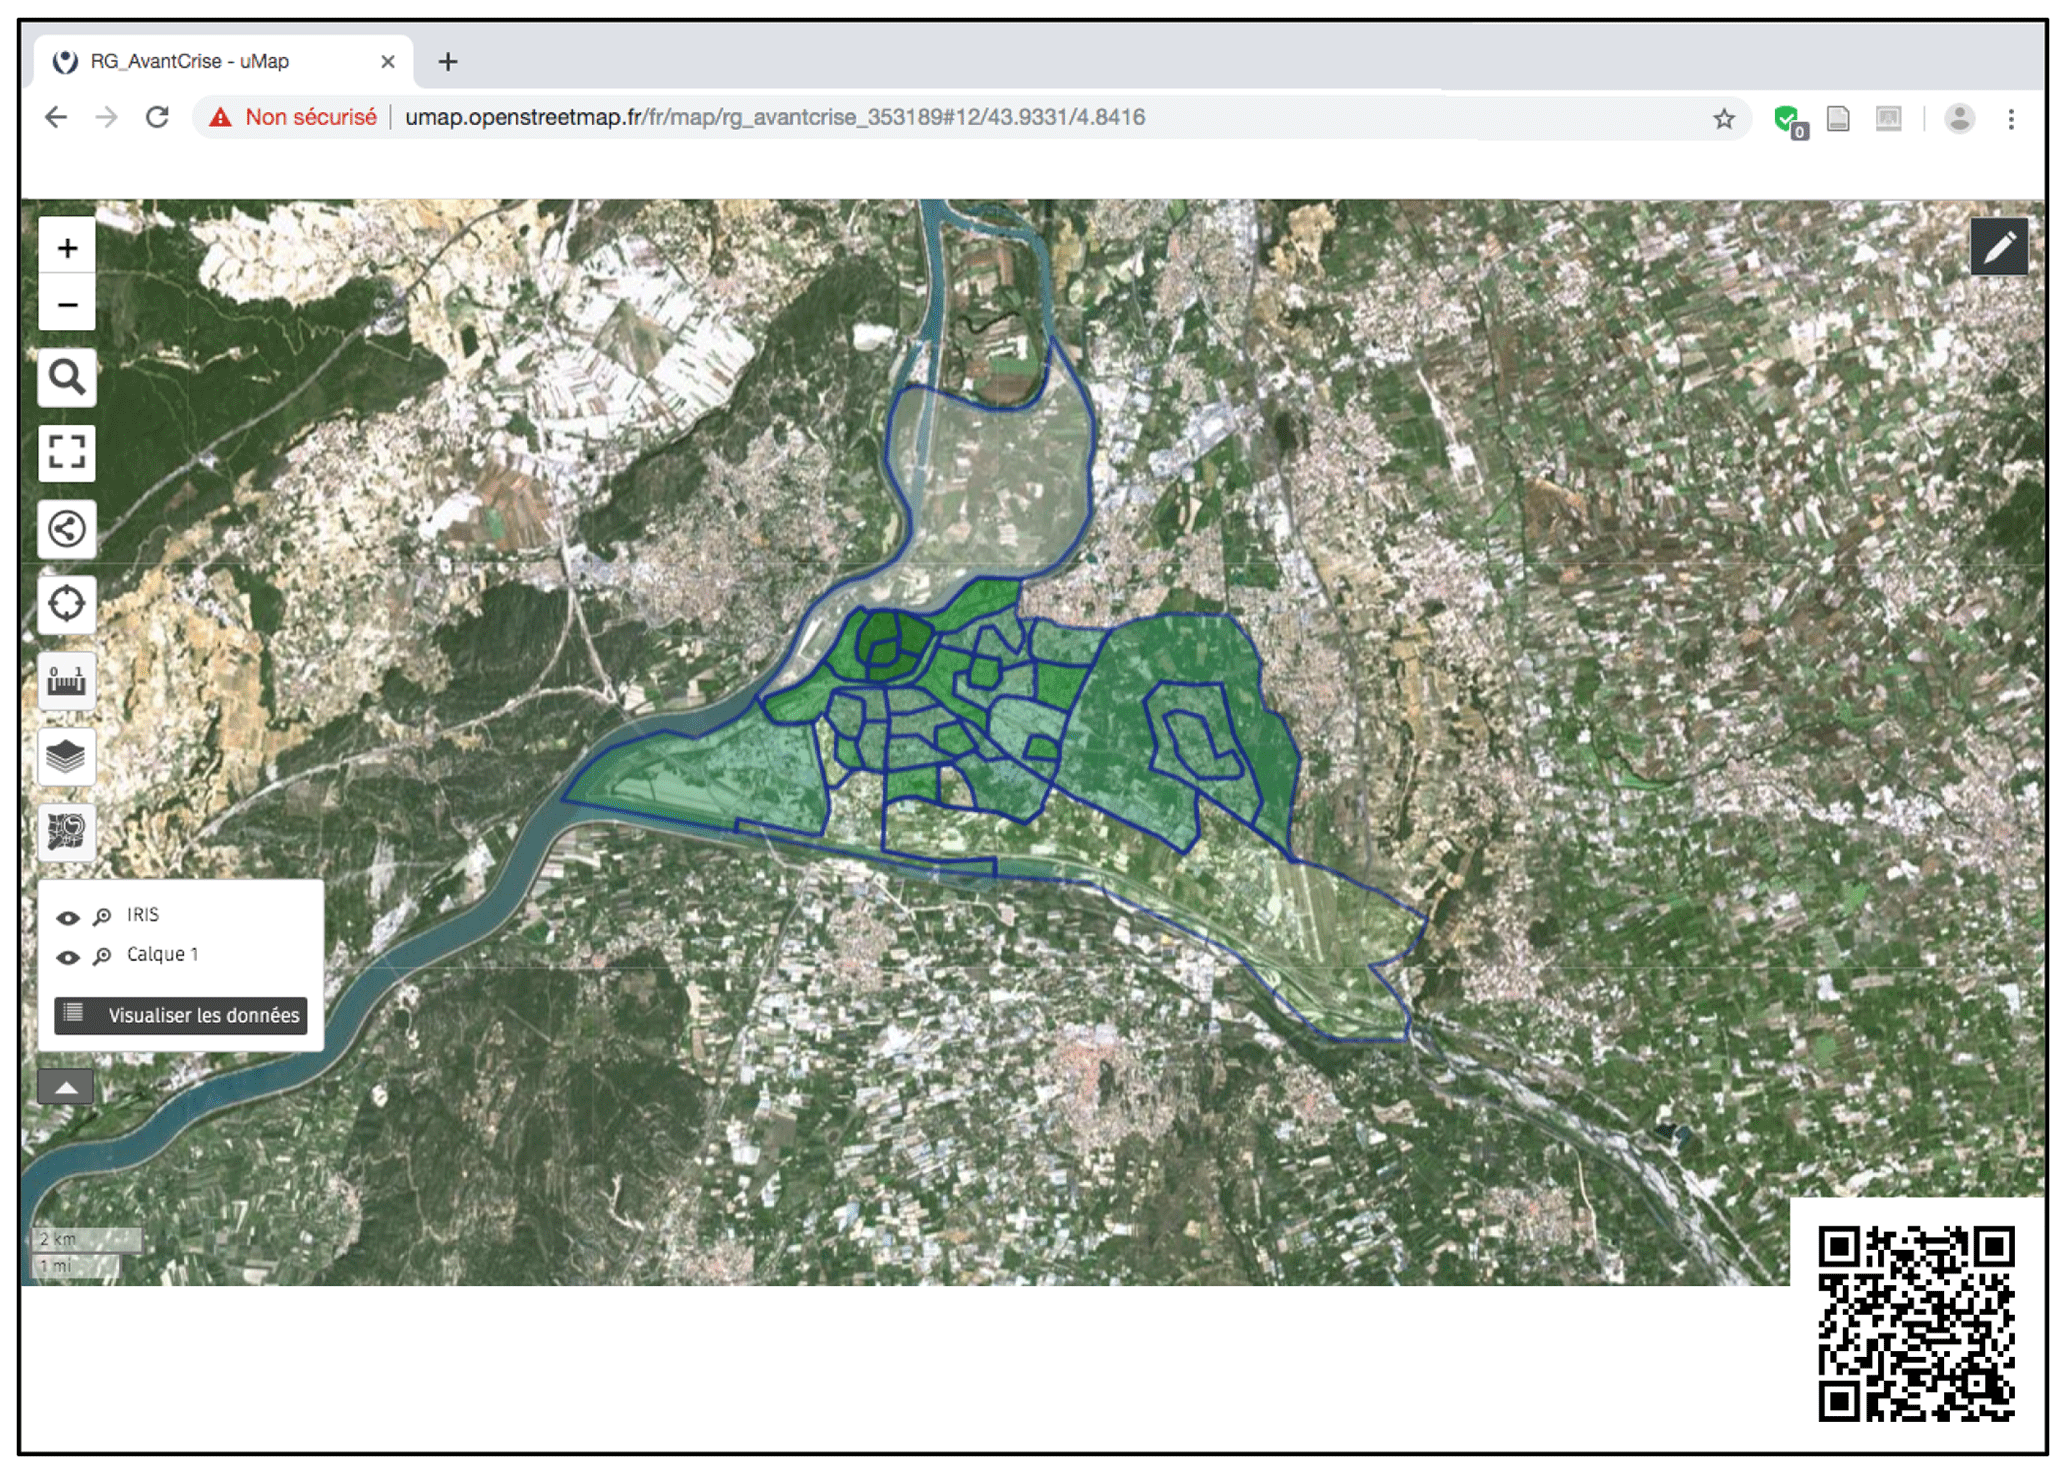
Figure 13Weblink global resilience – pre-crisis scenario map – QR code – © UMAP-Open Database License, “ODbL” 1.0.
Concerning the contribution of geovisualization used to promoter dialogue on the issue of territorial resilience, workshops were organized to develop interaction around the maps produced and the database provided and accessible to stakeholders. These workshops provided an opportunity for scientific experts and critical infrastructure managers as well as decision makers in risk management strategies to exchange views in order to support the reflection process and foster long-term collaboration. These maps and this new database allowed the actors to extract new knowledge from the decision support tool, especially theoretical knowledge provided by the maps and consistent with the database. This knowledge is both current and part of a long-term construction, since the data evolve as a function of INSEE production.
This research is at the crossroads of resilience modelling and geovisualization practices based on visualization, data processing, mapping and also the decision support process. Rather than focusing on technological developments, this work attempted to reflect on the accessibility of the methodology and its appropriation by local stakeholders. The results are expressed through maps illustrating the potential for social, urban and technical resilience at the community level. It therefore takes into account a large number of dimensions in making the concept of resilience operational.
Several improvements are already being considered to overcome the limitations of this work. Concerning the question of tools, willingness to switch entirely to free tools led to reflection on abandoning the FME tool. The project to build a QGIS plug-in is under study in view of increasing accessibility. The advantage of the plug-in would be to make the computer script behind the methodology completely free, accessible and downloadable.
Another improvement to consider would be testing the approach in other territories, either by developing a partnership of the same scope or by switching the entire process to open data. At present, this analysis can be performed at the scale of the Provence-Alpes-Côte d'Azur region (Fig. 14) and at the scale of France, but only for the social resilience indicator.
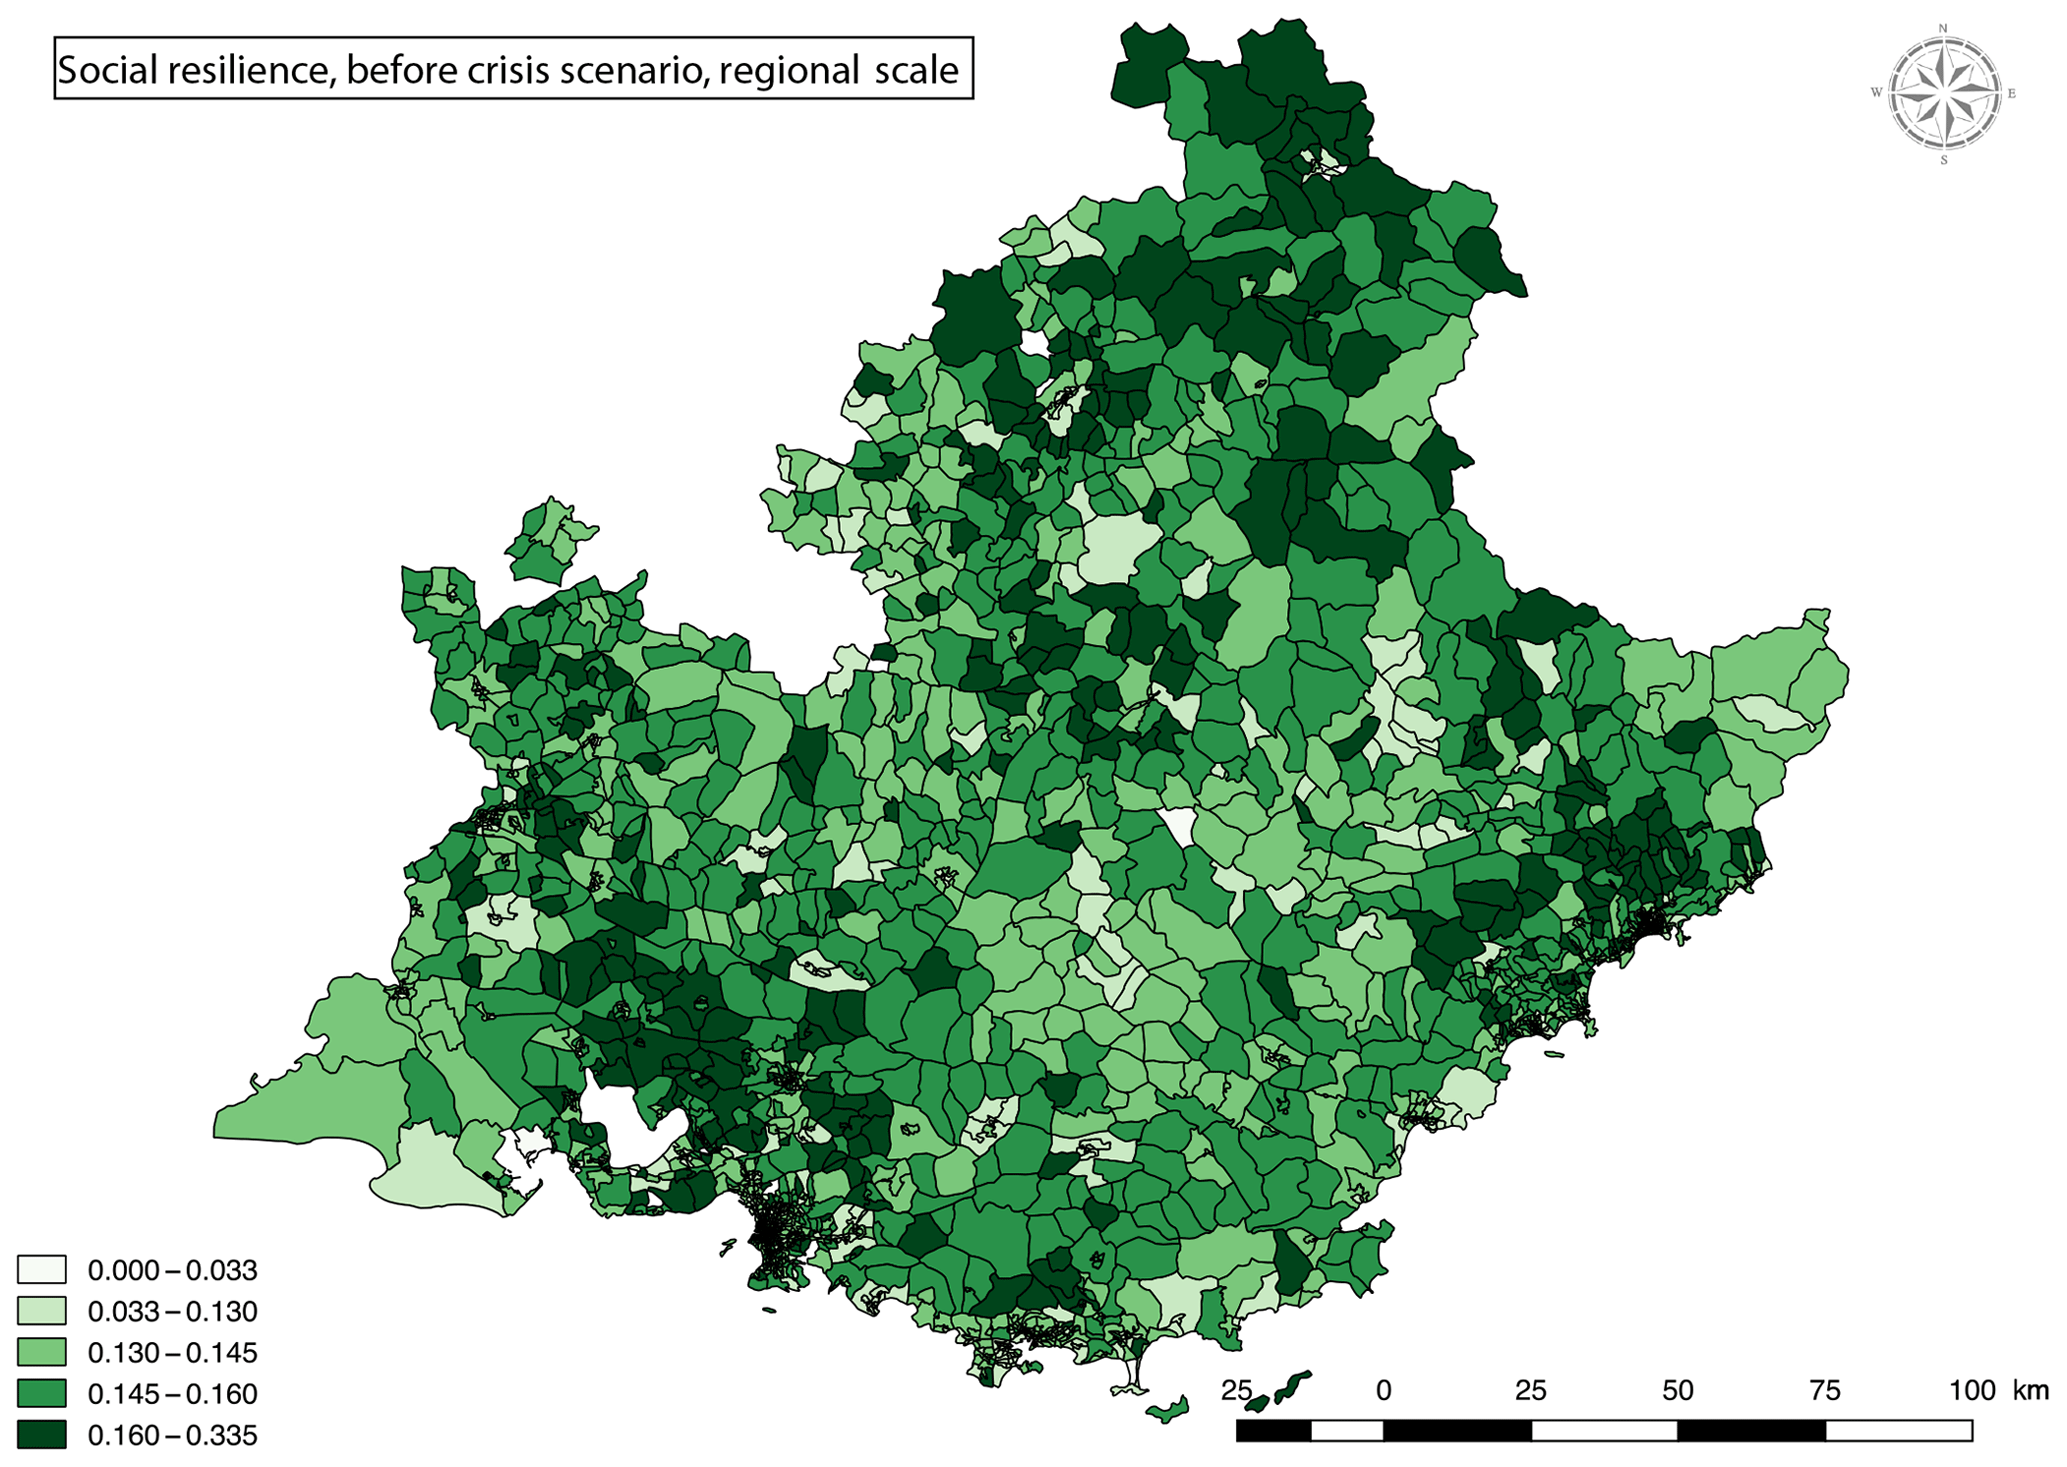
Figure 14Social resilience, pre-crisis scenario, Provence-Alpes-Côte d'Azur regional scale – © Open Database License, “ODbL” 1.0.
Following theoretical modelling and visual, cartographic and geovisualized production work, further development included the organization of workshops to question users on their understanding and use of the tool and the results (Heinzlef, 2019). These workshops took place with critical infrastructure managers and made it possible to (re)launch the debate around the issue of resilience and thus to build knowledge without a hypothesis a priori (Maceachren and Kraak, 1997) around a tool for visualizing a concept that is difficult to put into practice. This methodology made it possible to launch a longer-term reflection with local actors to reflect on a resilience strategy and integrate the concept into risk management. In particular, the results made it possible to consider a strategy for managing the risk of flooding in the Rhône.
This modelling and cartographic production work based on geovisualization has made it possible to rethink the issue of urban resilience. The mapping results led to workshops to review and compare the methodology with the reality of the territory and risk management practices. This work is part of a broader dynamic and reflection on the question of operationalizing resilience. Based on the results of this decision-making tool designed to operationalize urban resilience, a more global project is now under construction. It is thus planned to use these results to build an urban resilience observatory that will be tested on the island territories of French Polynesia. This will provide an opportunity to merge representations of risks, territories and techniques for data processing, production and analysis, visualization, and collaboration with local actors.
This article proposed a methodology intended to clarify the concept of resilience in the context of increasing urban flooding. This methodology is divided into two stages. First, we modelled and analysed the concept of resilience through the formulation of three definitions and measurement indicators in order to approach resilience in an exhaustive way on the basis of social, technical and urban criteria. Secondly, we used geovisualization techniques (mapping practices, visualization, data processing and analysis, map processing) to build a spatial decision support system accessible and understandable to local stakeholders in the Avignon community. This spatial decision support system sought to provide a simple and accessible methodology to quickly verify and analyse information for decision-making. The aim is to use the principles of visualization of geovisualization to widely disseminate map results in order to improve resilience culture. The contributions and innovations of this work are therefore of several kinds:
-
the design of a spatial decision support system with and for local actors,
-
the design of a resilience model,
-
the use of open-access data to enhance INSEE data and match the knowledge of local actors,
-
the use of tools to highlight the visualization of data processing, namely FME and QGIS,
-
the use of free and easy-to-use tools to perform advanced mapping processing,
-
the implementation of dialogue between local experts and actors through visual and understandable cartographic production.
The advances achieved have made it possible to map resilience at the local level and to ensure that local actors are understood and that the methodology is accessible to non-experts and reproducible. The method therefore focuses on the accessibility promoted by geovisualization techniques rather than on technicality.
While some limitations have been observed – in particular regarding the non-exhaustiveness of open-access tools, the need to include local actors from the outset and changes of scale – many perspectives are already being considered for the future. The first step has been taken to switch all the tools to open access via the development of a QGIS plug-in. In addition to the response to the tools, this plug-in will also integrate the reflections of different actors in order to develop the tool using the feedback expressed. Regarding the issue of scale, the need to go beyond the national framework was expressed through reflection on the use of OpenStreetMap data. Finally, regarding the form of this spatial decision-making tool itself, work is in progress to develop it by setting up a resilience observatory for the island territories of French Polynesia. Studies and analyses are being carried out to this end.
The data can be accessed directly on the INSEE site (https://www.insee.fr/fr/statistiques; INSEE, 2019) for the social resilience indicator and the INSEE SIRENE site (http://sirene.fr/sirene/public/accueil; ssirene.fr, 2019) for the urban resilience indicator. Concerning the technical resilience indicator, these are sensitive data, held only by the GIS department of the local authorities.
CH was responsible for conceptualization, methodology, investigation, writing the original draft, reviewing and editing the writing, and visualization. VB was responsible for project administration and supervision. DS was responsible for supervision, project administration, funding acquisition, and reviewing and editing the writing.
The authors declare that they have no conflict of interest.
This article is part of the special issue “Resilience to risks in built environments”. It is a result of the EGU General Assembly 2019, Vienna, Austria, 7–12 April 2019.
This research has been supported by the region Provence-Alpes-Côte d'Azur (grant no. 2016_11877). This project has received financial support from the CNRS through the MITI interdisciplinary programs and from the IRD.
This paper was edited by Bruno Barroca and reviewed by two anonymous referees.
100 Resilient Cities: The City Resilience Framework, available at: https://www.100resilientcities.org/resources/ (last access: 1 February 2020), 2015.
Aerts, J. C. J. H., Lin, N., Botzen, W., Emanuel, K., and de Moel, H.: Low-Probability Flood Risk Modeling for New York City: Low-Probability Flood Risk Modeling for New York City, Risk Anal., 33, 772–788, https://doi.org/10.1111/risa.12008, 2013.
Apel, H., Aronica, G. T., Kreibich, H., and Thieken, A. H.: Flood risk analyses – how detailed do we need to be?, Nat. Hazards, 49, 79–98, https://doi.org/10.1007/s11069-008-9277-8, 2009.
Bakkensen, L. A., Fox-Lent, C., Read, L. K., and Linkov, I.: Validating Resilienceand Vulnerability Indices in the Context of Natural Disasters: Validating Resilience and Vulnerability Indices, Risk Anal., 37, 982–1004, https://doi.org/10.1111/risa.12677, 2017.
Barroca, B. and Serre, D.: Risks revealed by cartography – cartography renewed by the geovisualization of risks, Int. J. Cartogr., 4, 1–3, https://doi.org/10.1080/23729333.2018.1444376, 2018.
Bathrellos, G. D., Gaki-Papanastassiou, K., Skilodimou, H. D., Papanastassiou, D., and Chousianitis, K. G.: Potential suitability for urban planning and industry development using natural hazard maps and geological–geomorphological parameters, Environ. Earth Sci., 66, 537–548, https://doi.org/10.1007/s12665-011-1263-x, 2012.
Balsells, M., Barroca, B., Becue, V., and Serre, D.: Making urban flood resilience more operational: current practice, P. I. Civil. Eng.-Wat. M., 168, 57–65, https://doi.org/10.1680/wama.14.00051, 2015.
Bambara, G., Peyras, L., Felix, H., and Serre, D.: Developing a functional model for cities impacted by a natural hazard: application to a city affected by flooding, Nat. Hazards Earth Syst. Sci., 15, 603–615, https://doi.org/10.5194/nhess-15-603-2015, 2015.
Burby, R.: Flood insurance and floodplain management: the US experience, Global Environ. Chang., 3, 111–122, https://doi.org/10.1016/S1464-2867(02)00003-7, 2001.
Callon, M., Lascoumes, P., and Barthe, Y.: Agir dans un monde incertain: essai sur la démocratie technique, La couleur des idées, Editions du Seuil, Paris, 2001.
Casadio Tarabusi, E. and Guarini, G.: An Unbalance Adjustment Method for Development Indicators, Soc. Indic. Res., 112, 19–45, https://doi.org/10.1007/s11205-012-0070-4, 2013.
Chinh, D. T., Bubeck, P., Dung, N. V., and Kreibich, H.: The 2011 flood event in the Mekong Delta: preparedness, response, damage and recovery of private households and small businesses, Disasters, 40, 753–778, https://doi.org/10.1111/disa.12171, 2016.
Cutter, S. L., Burton, C. G., and Emrich, C. T.: Disaster Resilience Indicators for Benchmarking BAseline Conditions, J. Homel. Secur. Emerg., 7, https://doi.org/10.2202/1547-7355.1732, 2010.
Cutter, S. L.: The landscape of disaster resilience indicators in the USA, Nat. Hazards, 80, 741–758, https://doi.org/10.1007/s11069-015-1993-2, 2016.
Cutter, S. L., Ash, K. D., and Emrich, C. T.: The geographies of community disaster resilience, Global Environ. Chang., 29, 65–77, https://doi.org/10.1016/j.gloenvcha.2014.08.005, 2014.
Cutter, S. L., Barnes, L., Berry, M., Burton, C., Evans, E., Tate, E., and Webb, J.: A place-based model for understanding community resilience to natural disasters, Global Environ. Chang., 18, 598–606, https://doi.org/10.1016/j.gloenvcha.2008.07.013, 2008.
Cutter, S. L., Burton, C. G., and Emrich, C. T.: Disaster Resilience Indicators for Benchmarking Baseline Conditions, J. Homel. Secur. Emerg., 7, https://doi.org/10.2202/1547-7355.1732, 2010.
Cutter, S. L. and Finch, C.: Temporal and spatial changes in social vulnerability to natural hazards, P. Natl. Acad. Sci. USA, 105, 2301–2306, 2008.
de Moel, H., Jongman, B., Kreibich, H., Merz, B., Penning-Rowsell, E., and Ward, P. J.: Flood risk assessments at different spatial scales, Mitig. Adapt. Strat. Gl., 20, 865–890, https://doi.org/10.1007/s11027-015-9654-z, 2015.
Donolo, R. M.: Contributions to geovisualization for territorial intelligence, Institut National des Sciences Appliquées de Lyon/Universita degli studi di Roma tor Vergata, 2014.
Elmer, F., Hoymann, J., Düthmann, D., Vorogushyn, S., and Kreibich, H.: Drivers of flood risk change in residential areas, Nat. Hazards Earth Syst. Sci., 12, 1641–1657, https://doi.org/10.5194/nhess-12-1641-2012, 2012.
Ernst, J., Dewals, B. J., Detrembleur, S., Archambeau, P., Erpicum, S., and Pirotton, M.: Micro-scale flood risk analysis based on detailed 2D hydraulic modelling and high resolution geographic data, Nat. Hazards, 55, 181–209, https://doi.org/10.1007/s11069-010-9520-y, 2010.
Esty, D. C., Levy, M., Srebotnjak, T., and de Sherbinin, A.: Environmental Sustainability Index: Benchmarking National Environmental Stewardship. Yale Center for Environmental Law and Policy, New Haven, 2005.
European Environment Agency: Economic losses from climate-related extremes in Europe, European Environment Agency, Copenhagen, 2019.
Fekete, A.: Validation of a social vulnerability index in context to river-floods in Germany, Nat. Hazards Earth Syst. Sci., 9, 393–403, https://doi.org/10.5194/nhess-9-393-2009, 2009.
Fox-Lent, C., Bates, M. E., and Linkov, I.: A matrix approach to community resilience assessment: an illustrative case at Rockaway Peninsula, Environ. Syst. Decis., 35, 209–218, https://doi.org/10.1007/s10669-015-9555-4, 2015.
Frazier, T. G., Thompson, C. M., Dezzani, R. J., and Butsick, D.: Spatial and temporal quantification of resilience at the community scale, Appl. Geogr., 42, 95–107, https://doi.org/10.1016/j.apgeog.2013.05.004, 2013.
Gardner, G.: The City: A System of Systems, in: State of the World, Island Press/Center for Resource Economics, Washington, DC, 27–44, https://doi.org/10.5822/978-1-61091-756-8_3, 2016.
Garschagen, M.: Risky Change? Vietnam's Urban Flood Risk Governance between Climate Dynamics and Transformation, Pac. Aff., 88, 599–621, https://doi.org/10.5509/2015883599, 2015.
Garschagen, M. and Romero-Lankao, P.: Exploring the relationships between urbanization trends and climate change vulnerability, Clim. Change, 133, 37–52, https://doi.org/10.1007/s10584-013-0812-6, 2015.
Gaslikova, L., Schwerzmann, A., Raible, C. C., and Stocker, T. F.: Future storm surge impacts on insurable losses for the North Sea region, Nat. Hazards Earth Syst. Sci., 11, 1205–1216, https://doi.org/10.5194/nhess-11-1205-2011, 2011.
Gerl, T., Bochow, M., and Kreibich, H.: Flood Damage Modeling on the Basis of Urban Structure Mapping Using High-Resolution Remote Sensing Data, Water, 6, 2367–2393, https://doi.org/10.3390/w6082367, 2014.
Golz, S., Schinke, R., and Naumann, T. Assessing the effects of flood resilience technologies on building scale, Urban Water J., 12, 30–43, https://doi.org/10.1080/1573062X.2014.939090, 2015.
Heinzlef, C.: Modélisation d'indicateurs de résilience urbaine face au risque d'inondation, Co-construction d'un système spatial d'aide à la décision pour contribuer à l'opérationnalisation du concept de résilience, Avignon Université, 2019.
Heinzlef, C., Becue, V., and Serre, D.: Operationalizing urban resilience to floods in embanked territories – Application in Avignon, Provence Alpes Côte d'azur region, Saf. Sci., 118, 181–193, https://doi.org/10.1016/j.ssci.2019.05.003, 2019.
H. John Heinz III Center for Science Economics, and the Environment: Human Links to Coastal Disasters, Washington, D.C, H. John Heinz Center, 2002.
Holand, I. S., Lujala, P., and Rød, J. K.: Social vulnerability assessment for Norway: A quantitative approach, Nor. Geogr. Tidsskr. – Nor. J. Geogr. 65, 1–17, https://doi.org/10.1080/00291951.2010.550167, 2011.
INSEE: available at: https://www.insee.fr/fr/statistiques, last access: 10 December 2019.
Jacobs, K., Garfin, G., and Lenart, M.: More than Just Talk: Connecting Science and Decisionmaking, Environ. Sci. Policy Sustain. Dev., 47, 6–21, https://doi.org/10.3200/ENVT.47.9.6-21, 2005.
Johansson, J., Opach, T., Glaas, E., Neset, T., Navarra, C., Linner, B.-O., and Rod, J. K.: VisAdapt: A visualization tool to support climate change adaptation, IEEE Comput. Graph., 2016, p. 1, https://doi.org/10.1109/MCG.2016.49, 2016.
Jovanovic, A., Øien, K., and Choudhary, A.: An Indicator-Based Approach to Assessing Resilience of Smart Critical Infrastructures, in: Urban Disaster Resilience and Security, Springer, 285–311, 2018.
Klein, R. J. T., Nicholls, R. J., and Thomalla, F.: Resilience to natural hazards: How useful is this concept?, Environ. Hazards, 5, 35–45, https://doi.org/10.1016/j.hazards.2004.02.001, 2003.
Kraak, M.-J.: Geovisualization illustrated, ISPRS J. Photogramm. Remote Sens. 57, 390–399, https://doi.org/10.1016/S0924-2716(02)00167-3, 2003.
Leskens, J. G., Brugnach, M., Hoekstra, A. Y., and Schuurmans, W.: Why are decisions in flood disaster management so poorly supported by information from flood models?, Environ. Model. Softw., 53, 53–61, https://doi.org/10.1016/j.envsoft.2013.11.003, 2014.
Lhomme, S.: Les réseaux techniques comme vecteur de propagation des risques en milieu urbain. Une contribution théorique et pratique à l'analyse de la résilience urbaine, Université Paris Diderot, Thèse de doctorat, 2012.
Lhomme, S., Serre, D., Diab, Y., and Laganier, R.: Analyzing resilience of urban networks: a preliminary step towards more flood resilient cities, Nat. Hazards Earth Syst. Sci., 13, 221–230, https://doi.org/10.5194/nhess-13-221-2013, 2013.
Linkov, I., Bridges, T., Creutzig, F., Decker, J., Fox-Lent, C., Kröger, W., Lambert, J. H., Levermann, A., Montreuil, B., Nathwani, J., Nyer, R., Renn, O., Scharte, B., Scheffler, A., Schreurs, M., and Thiel-Clemen, T.: Changing the resilience paradigm, Nat. Clim. Change, 4, 407–409, https://doi.org/10.1038/nclimate2227, 2014.
Löwe, R., Urich, C., Kulahci, M., Radhakrishnan, M., Deletic, A., and Arnbjerg-Nielsen, K.: Simulating flood risk under non-stationary climate and urban development conditions – Experimental setup for multiple hazards and a variety of scenarios. Environ. Model. Softw., 102, 155–171, https://doi.org/10.1016/j.envsoft.2018.01.008, 2018.
MacEachren, A. M., Gahegan, M., Pike, W., Brewer, I., Cai, G., Lengerich, E., and Hardisty, F.: Geovisualization for Knowledge Construction and Decision Support, IEEE Comput. Graph. Appl., 24, 13–17, 2004.
MacEachren, A. M. and Kraak, M.-J.: Research Challenges in Geovisualization, Cartogr. Geogr. Inf. Sci., 28, 3–12, https://doi.org/10.1559/152304001782173970, 2001.
Maceachren, A. M. and Kraak, M.-J.: Exploratory cartographic visualization: Advancing the agenda, Comput. Geosci., 23, 335–343, https://doi.org/10.1016/S0098-3004(97)00018-6, 1997.
Meyer, V., Scheuer, S., and Haase, D.: A multicriteria approach for flood risk mapping exemplified at the Mulde river, Germany, Nat. Hazards, 48, 17–39, https://doi.org/10.1007/s11069-008-9244-4, 2009.
Mileti, D.: Disasters by Design: A Reassessment of Natural Hazards in the United States, Joseph Henry Press, Washington, D.C., https://doi.org/10.17226/5782, 1999.
Morrow, B. H.: Community resilience: A social justice perspective, Community & Regional Resilience Initiative, https://doi.org/10.13140/RG.2.1.1278.9604, 2008.
Moser, S. C.: Impact assessments and policy responses to sea-level rise in three US states: An exploration of human-dimension uncertainties, Global Environ. Chang., 15, 353–369, https://doi.org/10.1016/j.gloenvcha.2005.08.002, 2005.
Næss, L. O., Norland, I. T., Lafferty, W. M., and Aall, C.: Data and processes linking vulnerability assessment to adaptation decision-making on climate change in Norway, Global Environ. Chang., 16, 221–233, https://doi.org/10.1016/j.gloenvcha.2006.01.007, 2006.
Norris, F. H., Stevens, S. P., Pfefferbaum, B., Wyche, K. F. and Pfefferbaum, R. L.: Community Resilience as a Metaphor, Theory, Set of Capacities, and Strategy for Disaster Readiness, Am. J. Commun. Psychol., 41, 127–150, https://doi.org/10.1007/s10464-007-9156-6, 2008.
Opach, T. and Rød, J. K.: Cartographic Visualization of Vulnerability to Natural Hazards. Cartogr. Int. J. Geogr. Inf. Geovisualization, 48, 113–125, https://doi.org/10.3138/carto.48.2.1840, 2013.
Patil, V. H., Singh, S. N., Mishra, S., and Todd Donavan, D.: Efficient theory development and factor retention criteria: Abandon the “eigenvalue greater than one” criterion, J. Bus. Res., 61, 162–170, https://doi.org/10.1016/j.jbusres.2007.05.008, 2008.
Patt, A. and Dessai, S.: Communicating uncertainty: lessons learned and suggestions for climate change assessment, Comptes Rendus Geosci., 337, 425–441, https://doi.org/10.1016/j.crte.2004.10.004, 2005.
Prior, T. and Hagmann, J.: Measuring resilience: methodological and political challenges of a trend security concept, J. Risk Res., 17, 281–298, https://doi.org/10.1080/13669877.2013.808686, 2014.
Provitolo, D.: Resiliencery vulnerability notion-looking in another direction in order to study risks and disasters, in: Resilience and Urban Risk Management, CRC Press, p. 192, 2012.
Radhakrishnan, M., Pathirana, A., Ashley, R., and Zevenbergen, C.: Structuring Climate Adaptation through Multiple Perspectives: Framework and Case Study on Flood Risk Management, Water, 9, 129, https://doi.org/10.3390/w9020129, 2017.
Schinke, R., Kaidel, A., Golz, S., Naumann, T., López-Gutiérrez, J., and Garvin, S.: Analysing the Effects of Flood-Resilience Technologies in Urban Areas Using a Synthetic Model Approach, ISPRS Int. J. Geo-Inf., 5, 202, https://doi.org/10.3390/ijgi5110202, 2016.
Schinke, R., Neubert, M., Hennersdorf, J., Stodolny, U., Sommer, T., and Naumann, T.: Damage estimation of subterranean building constructions due to groundwater inundation – the GIS-based model approach GRUWAD, Nat. Hazards Earth Syst. Sci., 12, 2865–2877, https://doi.org/10.5194/nhess-12-2865-2012, 2012.
Schumann, G., Di Baldassarre, G., and Bates, P. D.: The Utility of Spaceborne Radar to Render Flood Inundation Maps Based on Multialgorithm Ensembles, IEEE T. Geosci. Remote, 47, 2801–2807, https://doi.org/10.1109/TGRS.2009.2017937, 2009.
Serre, D.: Advanced methodology for risk and vulnerability assessment of interdependency of critical infrastructure in respect to urban floods, E3S Web Conf., 7, 7002, https://doi.org/10.1051/e3sconf/20160707002, 2016.
Serre, D.: DS3 Model Testing: Assessing Critical Infrastructure Network Flood Resilience at the Neighbourhood Scale, in: Urban Disaster Resilience and Security, edited by: Fekete, A. and Fiedrich, F., Springer International Publishing, Cham, 207–220, https://doi.org/10.1007/978-3-319-68606-6_13, 2018.
Serre, D., Barroca, B., Balsells, M., and Becue, V.: Contributing to urban resilience to floods with neighbourhood design: the case of Am Sandtorkai/Dalmannkai in Hamburg, J. Flood Risk Manag., 11, S69–S83, https://doi.org/10.1111/jfr3.12253, 2016.
Serre, D. and Heinzlef, C.: Assessing and mapping urban resilience to floods with respect to cascading effects through critical infrastructure networks, Int. J. Disast. Risk Res., 30, 235–243, https://doi.org/10.1016/j.ijdrr.2018.02.018, 2018.
sirene.fr: available at: http://sirene.fr/sirene/public/accueil, last access: 10 December 2019.
Singh-Peterson, L., Salmon, P., Goode, N., and Gallina, J.: Translation and evaluation of the Baseline Resilience Indicators for Communities on the Sunshine Coast, Queensland Australia, Int. J. Disast. Risk Re., 10, 116–126, https://doi.org/10.1016/j.ijdrr.2014.07.004, 2014.
Suárez, M., Gómez-Baggethun, E., Benayas, J., and Tilbury, D.: Towards an Urban Resilience Index: A Case Study in 50 Spanish Cities, Sustainability, 8, 774, https://doi.org/10.3390/su8080774, 2016.
Sylves, R.: Budgeting for Local Emergency Management and Homeland Security, in: Emergency Management: Principles and Practice for Local Government, edited by: Wzugh, W. L. andTierney, K., Washington, D.C., International City Managers Association, 183–206, 2007.
Tierney, K.: Disaster response: research findings and their implications for resilience measures, Carri Research Report No. 6, 2009.
Tierney, K. J.: The social roots of risk: producing disasters, promoting resilience, High reliability and crisis management, Stanford Business Books, an imprint of Stanford University Press, Stanford, California, 2014.
Tierney, K. J., Lindell, M. K., and Perry, R. W.: Facing the unexpected: disaster preparedness and response in the United States, Joseph Henry Press, Washington, D.C, 2001.
UNISDR – United Nations International Strategy for Disaster Reduction: Terminology on disaster risk reduction, 30 pp., Geneva, available at: https://www.preventionweb.net/files/7817_UNISDRTerminologyEnglish.pdf (last access: 1 February 2020), 2009.
Vorogushyn, S., Lindenschmidt, K.-E., Kreibich, H., Apel, H., and Merz, B.: Analysis of a detention basin impact on dike failure probabilities and flood risk for a channel-dike-floodplain system along the river Elbe, Germany, J. Hydrol., 436–437, 120–131, https://doi.org/10.1016/j.jhydrol.2012.03.006, 2012.
Wallemacq, P. and House, R.: Economic losses, poverty and disasters: 1998–2017, Center for Research on the Epidemiology of Disaster (CRED), UNISDR, 2018.
Ward, P. J., de Moel, H., and Aerts, J. C. J. H.: How are flood risk estimates affected by the choice of return-periods?, Nat. Hazards Earth Syst. Sci., 11, 3181–3195, https://doi.org/10.5194/nhess-11-3181-2011, 2011.
Yasobant, S., Vora, K. S., Hughes, C., Upadhyay, A., and Mavalankar, D. V.: Geovisualization: A Newer GIS Technology for Implementation Research in Health, J. Geogr. Inf. Syst., 7, 20–28, https://doi.org/10.4236/jgis.2015.71002, 2015.
- Abstract
- Introduction
- Resilience modelling and geovisualization techniques for risk management: a state of the art
- Methods: linking resilience modelling and geovisualization techniques
- Testing the resilience model and geovisualization process in Avignon
- Discussion
- Conclusion
- Data availability
- Author contributions
- Competing interests
- Special issue statement
- Financial support
- Review statement
- References