the Creative Commons Attribution 4.0 License.
the Creative Commons Attribution 4.0 License.
 | 24 Apr 2020
Risk assessment of sea ice disasters on fixed jacket platforms in Liaodong Bay
Ning Xu
Shuai Yuan
Xueqin Liu
Yuxian Ma
Wenqi Shi
Dayong Zhang
Sea ice disasters seriously threaten the structural safety of oil platforms in the Bohai Sea. Therefore, it is necessary to carry out a risk assessment of sea ice disasters on oil platforms in the Bohai Sea. In this study, a risk assessment of sea ice disasters on fixed jacket platforms in Liaodong Bay, in the Bohai Sea, was performed in five steps. Firstly, the formation mechanisms of sea ice disasters were analyzed and the sources and modes of sea ice risks were summarized. Secondly, according to the calculation formulas of extreme ice force, dynamic ice force, and accumulated force, several ice indices such as thickness, motion, strength, period, and concentration were proposed as the hazard indices, and corresponding values were then assigned to the proposed indices based on ice conditions in the Bohai Sea. Thirdly, based on four structural failure modes – structural overturning by extreme ice force (Mode 1), structural fracture failure caused by dynamic ice force (Mode 2), the damage of facilities caused by dynamic ice force (Mode 3), and structural function failure caused by accumulated ice (Mode 4) – the structural vulnerability index, overturning index, dynamic index, ice-induced vibration index, and function index were proposed, and corresponding values were assigned to the structural vulnerability index of fixed jacket platforms in Liaodong Bay. Fourthly, the weight of each risk index was determined according to previously recorded sea ice disasters and accidents, and the sea ice risk was then calculated with the weighted synthetic index method. Finally, with the above index system and risk assessment methods, the risk assessment of sea ice disasters on 10 jacket platforms in three sea areas in Liaodong Bay was carried out. The analysis results showed that efficient sea ice prevention strategies could largely mitigate the sea ice-induced vibration-related risks of jacket platforms in Liaodong Bay. If steady-state vibration occurs (usually in front of the vertical legged structure) or the structural fundamental frequency is high, the structural vulnerability is significantly increased and the calculated risk levels are high. The sea ice risk assessment method can be applied in the design, operation, and management of other engineering structures in sea ice areas.


Optimized selection and safety assessment of engineering structures generally involve a long-term simulation calculation and require a certain calculation basis. If an assessment index system is established based on the risk assessment theory, the safety level of various structures and the risk level of structural operation can be quickly assessed. Therefore, a structural risk assessment index system can be used as a basis for the more efficient and accurate structural safety analysis (Mangalathu et al., 2017; Melani et al., 2016; Sparks et al., 1994; Tromans and van de Graaf, 1994; Wang et al., 2012; Wu et al., 2012).
In recent years, the losses caused by sea ice disasters have increased significantly (Fang et al., 2017). In China, sea ice disasters mainly occur in the Bohai Sea and the northern Yellow Sea. Sea ice can push down offshore platforms, destroy ships and offshore engineering facilities, impede navigation, and cause losses to offshore and tidal aquaculture (Zhang et al., 2013; Wang et al., 2011; Lu, 1993; Ding, 2000). During the ice period in 1969, the entire Bohai Sea was covered by sea ice and ice thickness even reached 60 cm. During this sea ice disaster, the No. 2 well's living and drilling platforms collapsed due to the huge thrust of sea ice, leading to a large impact on the economy of China. In 1977, the beacon tower of the No. 4 drilling well was also pushed down by sea ice. On 28 January 2000, the JZ20-2 MS platform suffered from severe steady-state vibration due to the actions of level ice, causing a fatigue fracture in the evacuation pipeline of the No. 8 well, natural gas leakage, and platform suspension (Yue et al., 2009; Li et al., 2008; Timco et al., 2011). Since 2010, the aquaculture area affected by sea ice disasters has reached 40,000 ha per year (State Oceanic Administration, 2017).
Since the 1980s, Chinese scholars studied the preventive measures of sea ice disasters (Ouyang et al., 2017; Lu, 1993; Wang et al., 2011; Zhang et al. 2015), sea ice measurement and forecast (Luo et al., 2004; Zhao et al., 2014; Su and Wang, 2012), engineering coping strategies (Zhang et al., 2010, 2016), and mechanisms (Yue et al., 2009; Li et al., 2008; Liu et al., 2009; Huang and Li, 2001; Wang et al., 2018; Yue et al., 2007a). Most studies on existing sea ice risk assessment only involved descriptions of sea ice. Guo et al. (2008) proposed three sea ice parameters, i.e., thickness, strength, and period, as the influencing factors of sea ice disasters and established three sea ice disaster risk levels, i.e., as zero risk, low risk, and high risk. Gu et al. (2013) converted sea ice thickness into a sea ice hazard index and determined sea ice hazard risk levels. However, due to the differences in the classification results of sea ice disasters on different offshore engineering structures and sea ice factors, the sea ice data required in the assessment of structural ice disaster are different. Therefore, previous results cannot meet the current engineering requirements.
Risk assessment studies of engineering structures under environmental loads are mainly focused on large-span bridges, houses, and other buildings under wind and seismic loads (Park et al., 1985; Sparks et al., 1994; Kameshwar et al., 2014), and from these, corresponding vulnerability curves were obtained (Hwang and Liu, 2004; Singhal and Kiremidjian, 1996; Khanduri and Morrow, 2003). Risk assessments of sea ice loads on marine platforms, risk assessment index, or method were seldom reported. The fundamental studies are mainly focused on ice force calculation methods (Sanderson, 1988; Huang and Li, 2011), structural failure mode analysis (Yue et al., 2008), ice force resistance of engineering structures (Wang et al., 2012), and fatigue life calculation (Li et al., 2008; Liu et al., 2006). The previous results might be used as the basic theory for establishing a sea ice risk assessment index system and assessment method of marine structures.
This paper focuses on the risk assessment methods of sea ice disasters on jacket platforms. The hazard indices of sea ice were firstly determined based on the forms of sea ice force on platform structures. The weight coefficients of these indices were then calculated with ice force calculation formulas. Following this, the physical vulnerability index was determined according to the platform failure modes, and the weight of the vulnerability index was determined based on the previously recorded sea ice disasters and accidents. Sea ice disaster risks on 10 jacket platforms in three sea areas were individually assessed with the overall risk assessment method and the multimode risk assessment method. The assessment results indicated that, except for several auxiliary platforms that are in the high risk level, all other platforms are in a healthy condition but that safety management in winter should be further enhanced.
The Bohai Sea is a seasonally ice-covered sea in the latitude range from 37 to 41∘ N. It is also the ice-covered sea with the lowest latitude in the Northern Hemisphere. Liaodong Bay, in the Bohai Sea, is the most severely icy bay in the region, with an ice period of about 130 d. The edge of the ice-covered region is near the contour line of 15 m and about 129.64 km from the top of the bay. Generally, ice thickness in the Bohai Sea is 30–40 cm. The sea ice drifting speed is generally 0.5 m s−1, and the maximum speed is about 1.5 m s−1. The dominant wind in winter is northerly wind. Due to the clockwise flow along the coast and the right-turning tide, sea ice conditions in the east are more serious than those in the west. In addition, the warm current from Yellow Sea flows through the northern Bohai Strait into the Bohai Sea, and then to the west bank of Liaodong Bay, roughly along the northwestern direction, thus raising the water temperature in the western part of Liaodong Bay. Therefore, sea ice conditions to the west of Liaodong Bay are heavier than those in the east.
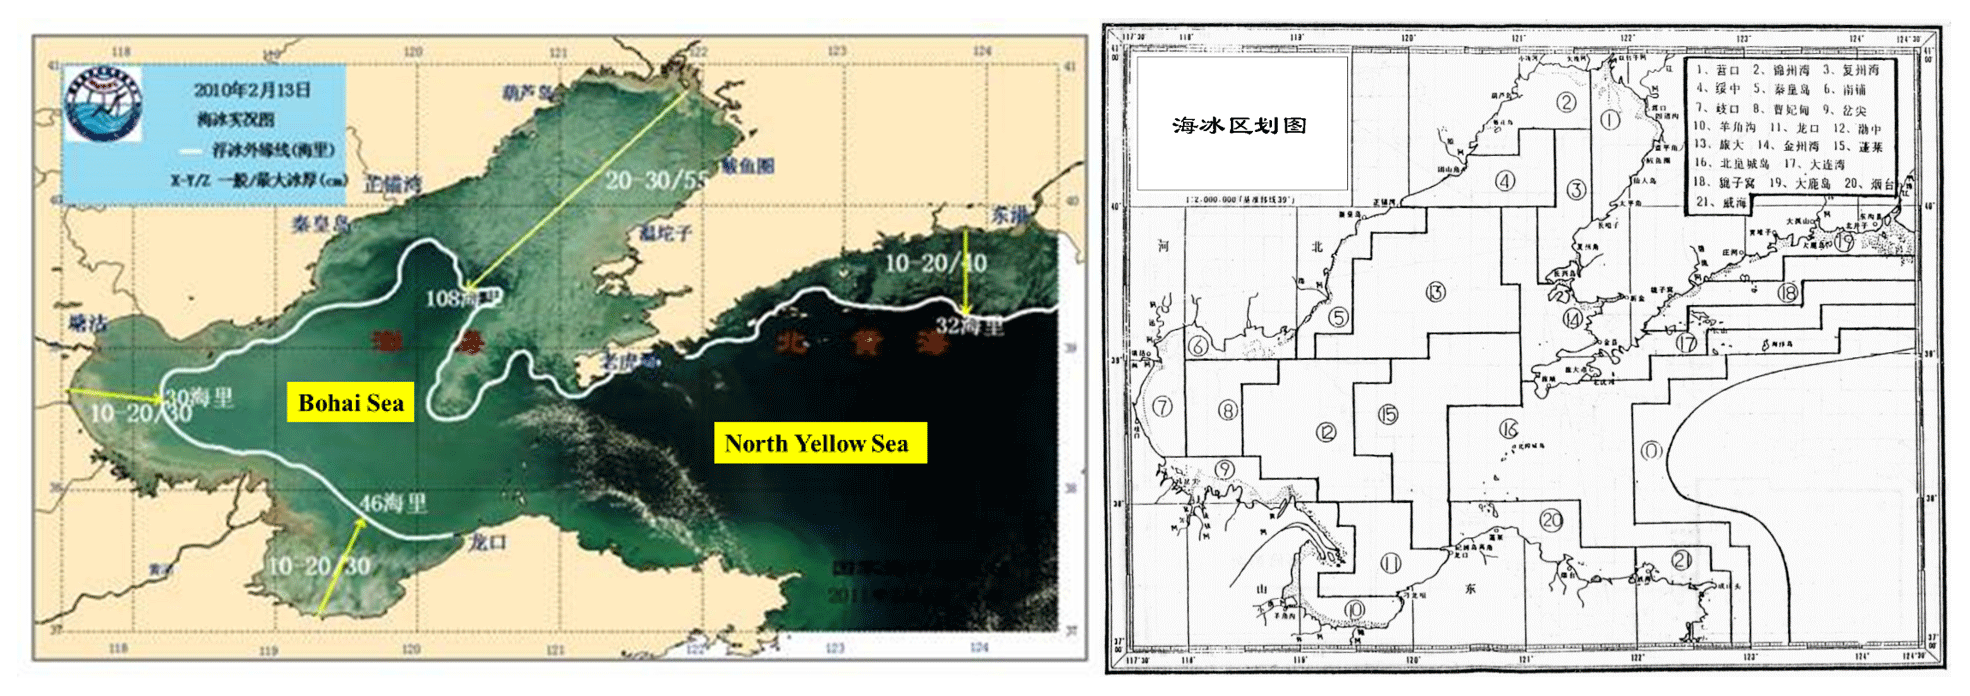
Figure 1Location map of Bohai Sea and northern Yellow Sea (State Oceanic Administration, 2010; China National Offshore Oil Corporation, 2002).
Based on the distribution characteristics of sea ice in China, the Bohai Sea and the northern Yellow Sea were divided into 21 regions in such a way that the ice conditions in each region were basically the same. The design parameters of marine structures in the 21 regions areas were then proposed, including physical and mechanical parameters as well as key parameters of ice conditions (period, thickness, and motion). The sea ice parameters in each ice region provide a useful reference for the design of ice structures and the fatigue life assessment of existing structures.

Figure 2Main structural forms of jacket platforms in Liaodong Bay: (a) a four-legged oil production platform (built in 1987), (b) a one-legged auxiliary platform (built in 1999), (c) a one-legged oil production platform (built in 2003), (d) a three-legged upright pile production platform (built in 1997), and (e) a three-legged upright pile production platform with cones (built in 2000). All of these images were created by Dalian University of Technology and the China National Offshore Oil Corporation.
Oil platforms in Bohai Sea have two structural categories: caisson structure and jacket structure. The latter is the dominant structure. In addition to the multi-legged structures (usually 4 legs, as shown in Fig. 2a), the single-legged structure has been widely applied in auxiliary platforms (Fig. 2b) and even main platforms (Fig. 2c). In oil platforms, ice-breaking cones are generally adopted to reduce the impact of sea ice. Old platforms had been equipped with ice-breaking cones (Fig. 2d), and new platforms were designed following the cone category (Fig. 2e). Due to the differences in ice conditions, structural category, dynamic performance, function, and structural ice resistance, platform structures in Liaodong Bay showed significant differences in sea ice risk levels. Current sea ice management measures in winter effectively reduced sea ice risks in oil and gas exploitation.
Oil platforms are densely distributed in Liaodong Bay, especially the narrow form of jacket structures. The impact of sea ice is significant in Liaodong Bay. Therefore, it is necessary to carry out a risk assessment of sea ice disasters on jacket oil platforms in Liaodong Bay.
3.1 Technical routes
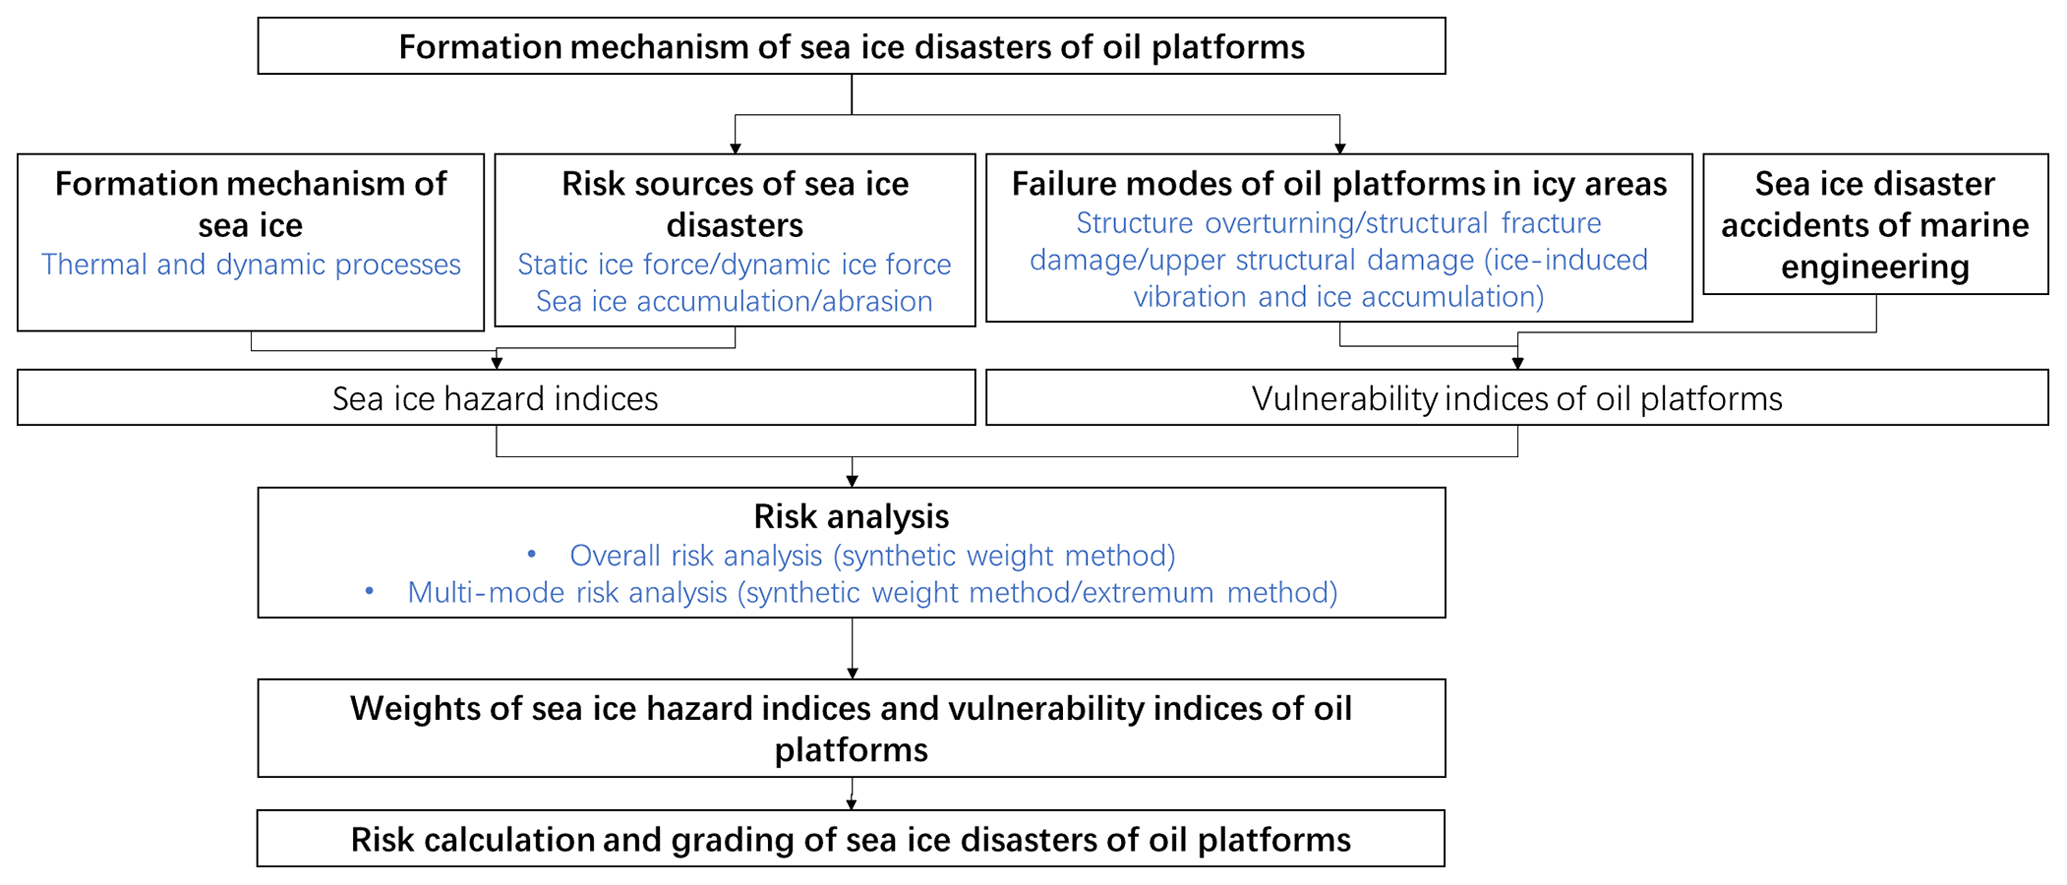
With the risk assessment method of natural disasters (Zhang and Li, 2007; Tachiiri, 2012), the technical routine of the risk assessment of sea ice disasters on oil platforms was established below (Fig. 3).
3.2 Risk assessment model index system
With the synthetic index method (Zhang and Li, 2007), the sea ice risk assessment index system of oil platforms was established with the following risk model: risk =F (hazard, vulnerability, resistance). Firstly, the hazard index (H), vulnerability index (V), and resistance index (R) were graded and corresponding values were assigned to these indices. Then the sea ice hazard index was qualitatively described using five levels, extremely high, high, medium, low, and extremely low, and the corresponding quantitative values were respectively set to 5, 4, 3, 2, and 1. The structural vulnerability index and the resistance levels were described qualitatively using three levels, high, medium, and low, and the corresponding values were set to 5, 3, and 1, respectively.
Sea ice disasters on oil platforms have different risk modes. Therefore, in the establishment of risk assessment index systems and evaluation models, two methods can be adopted: overall risk assessment and multimode risk assessment. With the overall risk assessment method, the weights of secondary indices are determined to calculate the hazard index (H), vulnerability index (V), and resistance (R), and, following this, the overall risk Ie is calculated according to Eq. (1). With the multimode risk assessment method, the assessment results of various risk modes Is,i are determined with the hazard index Hi, the vulnerability index Vi, and the disaster resistance ability index Ri of various risk modes (Eq. 2). The risk level with the highest risk level Is,max can then be calculated according to Eq. (3). Finally, with the cumulative weight coefficient of various risk modes, the overall risk Ie or the highest risk level of various modes Is,max can be selected:
where Ie is the overall risk assessment result; H, V, and R are respectively the overall hazard, vulnerability, and disaster resistance indices; i, j, and k are respectively the numbers of H, V, and R secondary indices; Hi, Vj, and Rk are the secondary indices; ωi, ωj, and ωk are respectively the weight coefficients of these secondary indices; Is is the calculation result of the multimode risk assessment method; Is,max is the calculation result with the maximum risk value according to the multimode risk assessment; is the calculation result of the ith risk mode; and λi is the weight of the ith risk mode.
4.1 Formation mechanisms of sea ice disasters
The impact of sea ice is the main cause for accidents and risks of marine structures in ice-covered areas. The impact energy mainly comes from wind, currents, thermal expansion, and sea ice (Sanderson, 1988). Sea ice disasters have three major risk sources (extreme ice force, dynamic ice force, and sea ice accumulation) and four structural risk modes (structural overturning by extreme ice force, structural fatigue damage induced by ice vibration, upper facility damage caused by ice vibration, and facility damage caused by ice jamming) (Zhang et al., 2015).
4.1.1 Risk sources of sea ice disasters and major sea ice risk factors
Extreme ice force
When sea ice makes contact with a structure it exerts a relatively stable ice force on the structure. Extreme ice force generates static effects and transient impacts. In the sea areas around oil platforms in Liaodong Bay, the sea ice flow rate can reach 1.4 m s−1 and extreme ice force is directly affected by sea ice thickness, sea ice strength, and structural width. The calculation methods of static ice force are given in various engineering design standards of cold zones. For example, when ice is crushed in front of a structure, the ice load generated on the structure can be calculated as follows (API, 1995):
where Fc is extrusion ice load; m is shape factor, set to 0.9, 1.0, and 0.7 for the circular section, the square section with a positively applied ice load, and the square section with an obliquely applied ice load, respectively; I is the embedding coefficient; fc is the contact coefficient; σc is the uniaxial compression strength of level ice in the horizontal direction, MPa; D is structural width; and t is the designed level ice thickness.
The horizontal component of ice bending load applied on a slope structure is as follows:
where FH is the horizontal component of ice bending load applied on a slope structure, Kα is the coefficient related to the structure and ice thickness, t is the designed level ice thickness, σf is bending strength of level ice, and β is the angle (∘) between the structural slope and the horizontal plane (RIL, 2001).
4.1.2 Dynamic ice force
When sea ice continuously passes through a structure, it generates a periodic impact load on the structure, namely, dynamic ice force. Dynamic ice force usually occurs on narrow structures. Under the action of dynamic ice force, a structure undergoes vibration, namely, ice-induced vibration. When the frequency of dynamic ice force is consistent with structural frequency, it causes strong vibration due to resonance. The ice force period is calculated as follows (Qu et al., 2006):
where T is ice force period; lb is breaking length of the ice plate, which is affected by ice thickness, ice strength, structural diameter, and ice velocity; and v is ice velocity.
Sea ice accumulation
After floe is applied on a structure and then broken, ice accumulates if broken ice is not removed in time due to structural blockage. Usually, broken ice accumulates in front of a wide structure or in the vicinity of dense ice-collecting members, such as the pile leg of an oil platform and the coarse grid over the water intake port of a nuclear power plant. The growth, size, and load of accumulation ice had been extensively explored. The calculation methods of extreme ice force in various specifications also involve ice accumulation. Sea ice accumulation height tacc is calculated as follows (Brown and Määttänen, 2009):
where t is level ice thickness.
4.1.3 Sea ice risk modes and key structural parameters of oil platforms
Extreme ice force may cause the overall structural failure
When the structural deformation under extreme ice force exceeds allowable deformation it can lead to a structural stiffness failure. When extreme ice force exceeds the ultimate bearing capacity of a structure, the structure is unstable.
Ice-induced vibration may cause structural fatigue failure
Structural fatigue damage is caused by a stress repeatedly applied at pipe joints, which are called hot spots. Structural hot spots fail after significant stress (S) has been applied for specified times (N). Long-term ice-induced structural fatigue damage may decrease structural resistance and even cause structural failure. In general, common ice loads have a higher probability and may cause greater damage to platform structures, whereas extreme ice loads have a lower probability and may have a smaller effect on platforms.
Dynamic ice force may lead to the function failure of facility and affect personnel safety
The strong ice-induced vibration of a structure directly affects its upper facility. In such a vibration, the platform deck can be considered as a vibration table and cause whiplash for upper components. Ice-induced vibration especially may lead to direct damage to key functional facility or components without anti-vibration capability. Natural gas pipelines are distributed on the upper part of platforms. Due to the long-term ice-induced vibration, connecting parts of these pipelines may be weakened, thus causing natural gas leakage, pipeline breaking, and even explosions. Ice-induced vibration may generate a slight impact on workers, decrease comfort and efficiency, and affect health.
Sea ice accumulation may cause damage to the upper facility or buildings
Sea ice accumulation increases the application area of ice force on marine structures as well as ice force itself. If sea ice climbs to a structure at a certain height from the ice surface along accumulated ice, it may cause damage to the upper facility or buildings. If sea ice climbs to a dam, it destroys onshore buildings. If sea ice climbs to the underlying cable aisle of a platform, sea ice may crush the fence and affect the structural stability.
4.2 Hazard index system
4.2.1 Determination of hazard indices based on the risk analysis of sea ice disasters
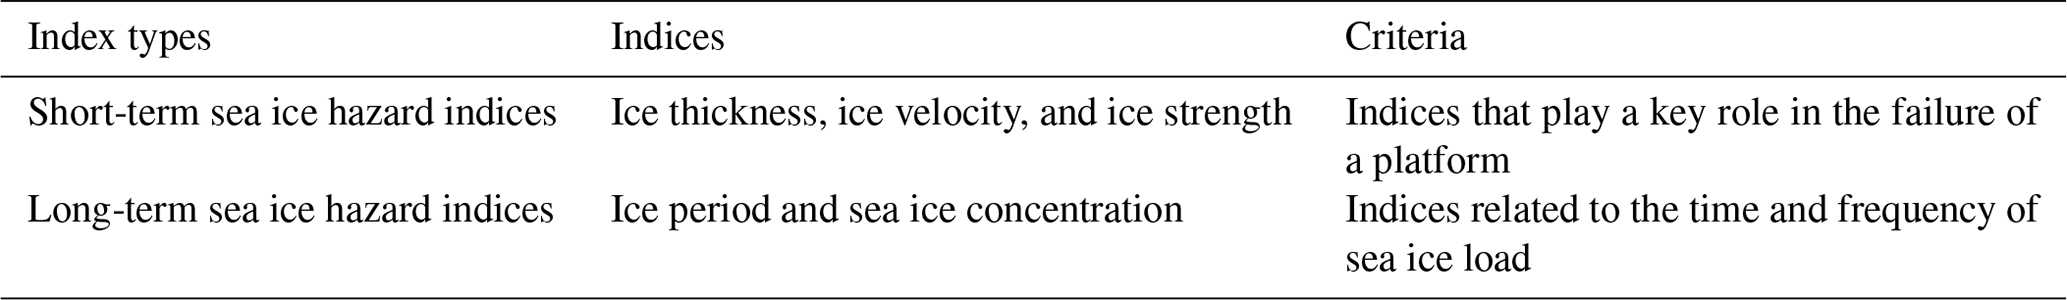
Based on the relationships among sea ice parameters and their contributions to ice force, key sea ice hazard indices were proposed (Table 1). Short-term sea ice hazard indices that play a key role in the failure of platforms include thickness, velocity, and strength. The long-term sea ice hazard indices related to the time and frequency of sea ice load include ice period and sea ice concentration.
4.2.2 Sea ice hazard indices
According to Technical Guidelines for Risk Assessment and Zoning of Sea Ice Disasters (State Oceanic Administration, 2016), various sea ice hazard indices were graded. The study area was divided into 21 regions and the values of the indices in each region were mainly determined based on the China Sea Ice Conditions and Application regulations (Q/HSn 3000-2002). A return period of 100 years was selected in the subsequent analysis; see Table 2.

4.3 Vulnerability indices
4.3.1 Determination of vulnerability indices based on the failure mode of jacket structures
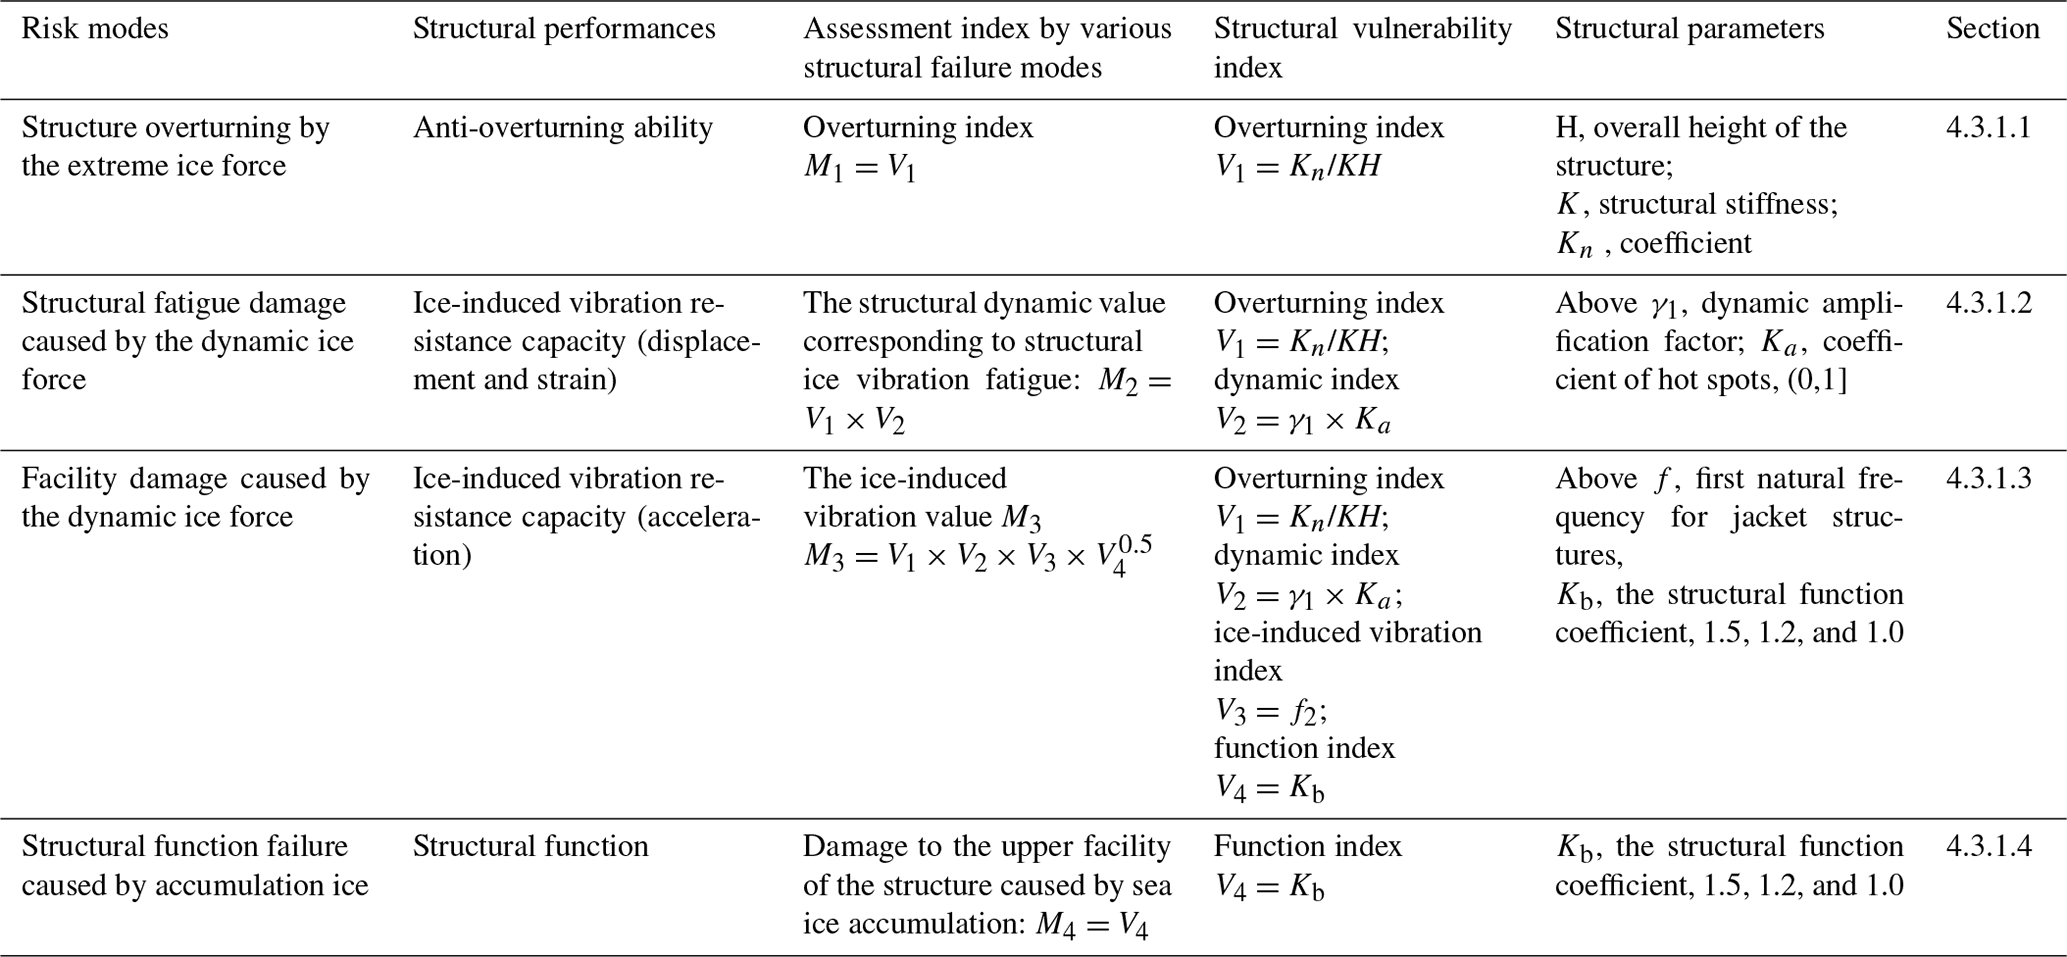
According to typical sea ice disaster risk modes, the assessment indices of various structural failure modes (M1, M2, M3, and M4), structural vulnerability indices (V1, V2, V3, and V4) of sea ice disasters are proposed for the first time. The above assessment indices are calculated with structural parameters (Table 3) and structural factors are analyzed. The main failure modes of jacket structures include structure overturning by extreme ice force, structural fatigue damage caused by dynamic ice force, and the damage to the upper facility (including personnel) caused by dynamic ice force. Yue et al. (2007b) analyzed the static displacement of typical platforms under extreme ice force in Liaodong Bay.
Table 3Sea ice disaster risk modes of oil platforms and corresponding vulnerability indices.
Structural overturning by extreme ice force (Mode 1) and structural overturning index
When extreme ice force exceeds the ultimate bearing capacity of a structure, the whole structure collapses. The overturning index V1 is proposed below.
Table 4Damage to marine structures under extreme ice loads.

Note: , where F is ice force; K is structural stiffness; HStr is the overall height of the structure.
Based on functional descriptions of buildings under seismic loads, the damage of a structure under extreme ice load is provided in Table 4 (Ji and Yue, 2011).
When the ice force difference is not large (10–100 kN), the overturning index of the platform under extreme ice force is proposed as follows:
where HStr is the overall height of the structure; K is structural stiffness and set to 10×107–10×109 for jacket platforms in Liaodong Bay; Kn is the coefficient related to the structural form (pile) and its values for the one-legged platforms and four-legged platforms are respectively set to 1 and 2 (Liu, 2007).
Structural fatigue damage caused by dynamic ice force (Mode 2) and structural dynamic index
Structural fatigue damage is caused by a stress repeatedly applied at hot spots of pipe nodes. For jacket structures, the stress applied at hot spots is usually linear with structural dynamic response (Δd), which is proportional to the static loading deformation (. The proportional coefficient is called the amplification factor γ and directly related to structural natural frequency and ice force frequency. Yue et al. (2007b) analyzed the dynamic characteristics of anti-ice jacket platforms in the Bohai Sea. For the steady-state vibration of an upright structure, the amplification factor is as follows:
For the random vibration of coned structures, the amplification factor is as follows:
where both r and r1 are the frequency ratio, ; ω(f) and ωn(fn) are respectively ice force frequency and structural natural frequency.
The structural dynamic index V2 is calculated as follows:
where γ1 is dynamic amplification factor and can be calculated with the measured data or frequency ratio (γ1=f(γ1,ξ)), according to Eqs. (10) and (11), and Ka is the reinforcement coefficient of hot spots, namely the ratio of the stress at the hot spot before reinforcement to that after reinforcement with a range of (0,1]. Based on finite element analysis or measured data, in the study, the values of Ka are respectively selected as 0.5 for main platforms and satellite platforms and 1.0 for auxiliary platforms (Xu, 2014).
Table 5Grading and assignment of structural vulnerability indices.

Considering the fatigue failure modes of jacket structures under dynamic ice force, with structural overturning index V1 and dynamic index V2, the structural dynamic value corresponding to structural ice vibration fatigue is expressed as follows:
where V1 is calculated according to Eq. (9).
Damage to the upper facility (including personnel) caused by dynamic ice force (Mode 3)
In general, greater deck acceleration leads to a greater vibration amplitude of the facility. If a jacket structure can be simplified as a structure with a single degree of freedom (Yue et al., 2007b), deck vibration is similar to simple harmonic motion, and its vibration displacement D, velocity V, and acceleration A can be respectively expressed as follows:
In Mode 2, vibration displacement D, corresponding to the structural vibration index, is the key factor to be considered. In the analysis of Mode 3, the structural dynamic parameter, the natural frequency f, should be carefully considered. The higher structural frequency means the greater acceleration. In addition, the structural function also directly affects the risk level. For example, there are many devices on oil production platforms. The design of manned platforms should consider personnel comfort since their risk level is relatively high. Unmanned platforms have a low risk level. In summary, structural ice vibration index V3 and structural function index V4 are respectively proposed based on natural frequency and structural function as follows:
where f is the dominant ice vibration frequency of a platform, the first natural frequency for jacket structures:
where Kb is the structural function coefficient and its values for manned central platforms, unmanned central platforms, and auxiliary function platforms such as the bollard are respectively set to 1.5, 1.2, and 1.0 (Xu, 2014).
In Mode 3, the vibration and functions of a structure should be considered. The structural vulnerability indices to be considered include the overturning index V1, dynamic index V2, ice-induced vibration index V3, and function index V4. The ice-induced vibration value M3 is expressed as follows:
where V1, V2, V3, and V4 are respectively calculated according to Eqs. (9), (12), (17), and (18).
The contribution of V4 (function index) is lower than other three structural vulnerability indexes (V1 overturning index,V2; dynamic index; V3 ice-induced vibration index); therefore, half the power was added to V4 (Xu, 2014).
Damage to the upper facility of the structure caused by sea ice accumulation (Mode 4)
If sea ice climbs to the platform deck due to sea ice accumulation, it directly threatens the safety of facilities and personnel. Therefore, the vulnerability index mainly considered in Mode 4 is the functional index V4:
Table 6Grading and assignment of the disaster resistance ability index.
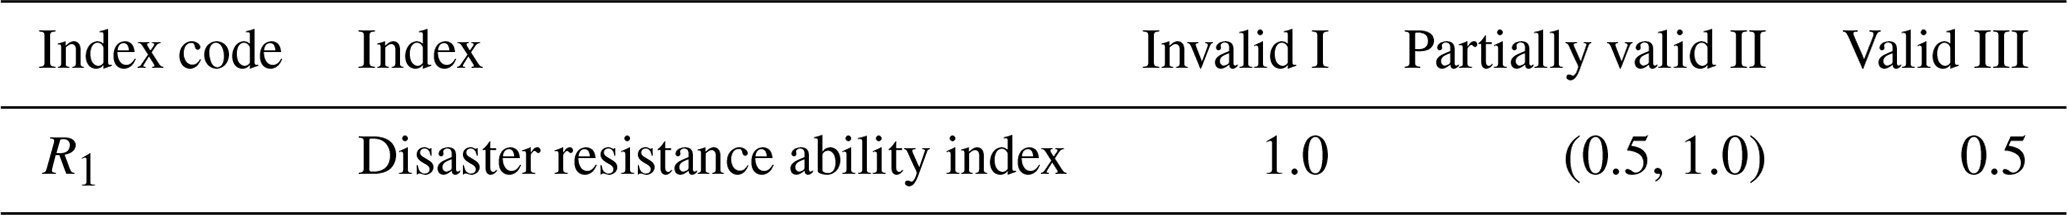
Table 7Hierarchical structure and weights of sea ice risk assessment factors for the overall risk assessment.
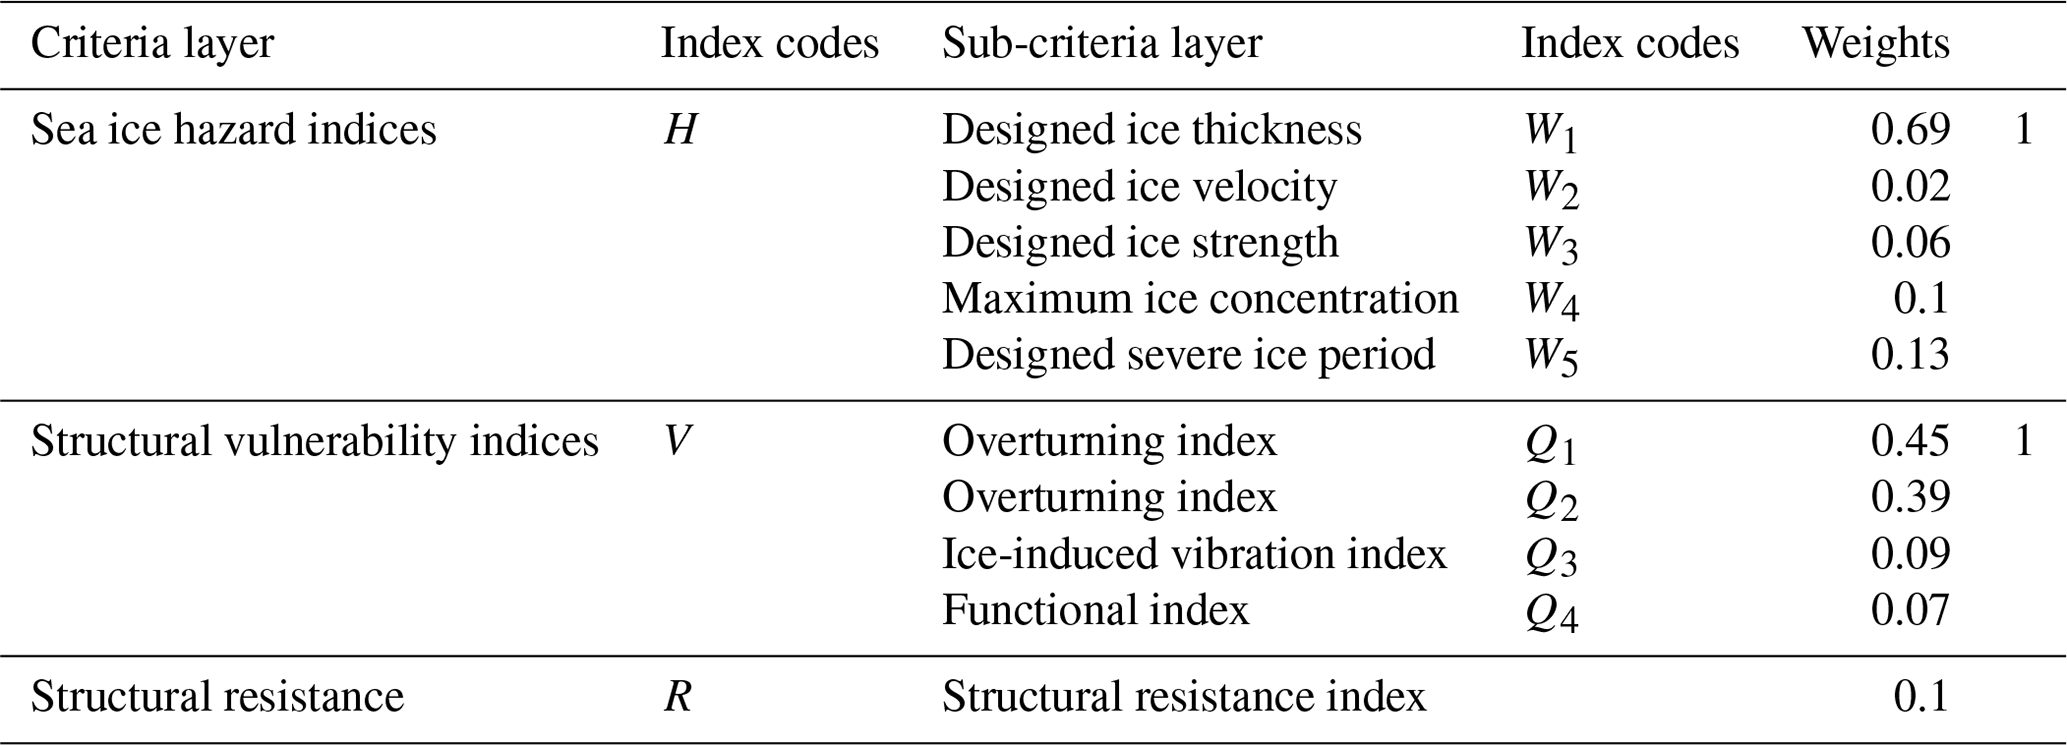
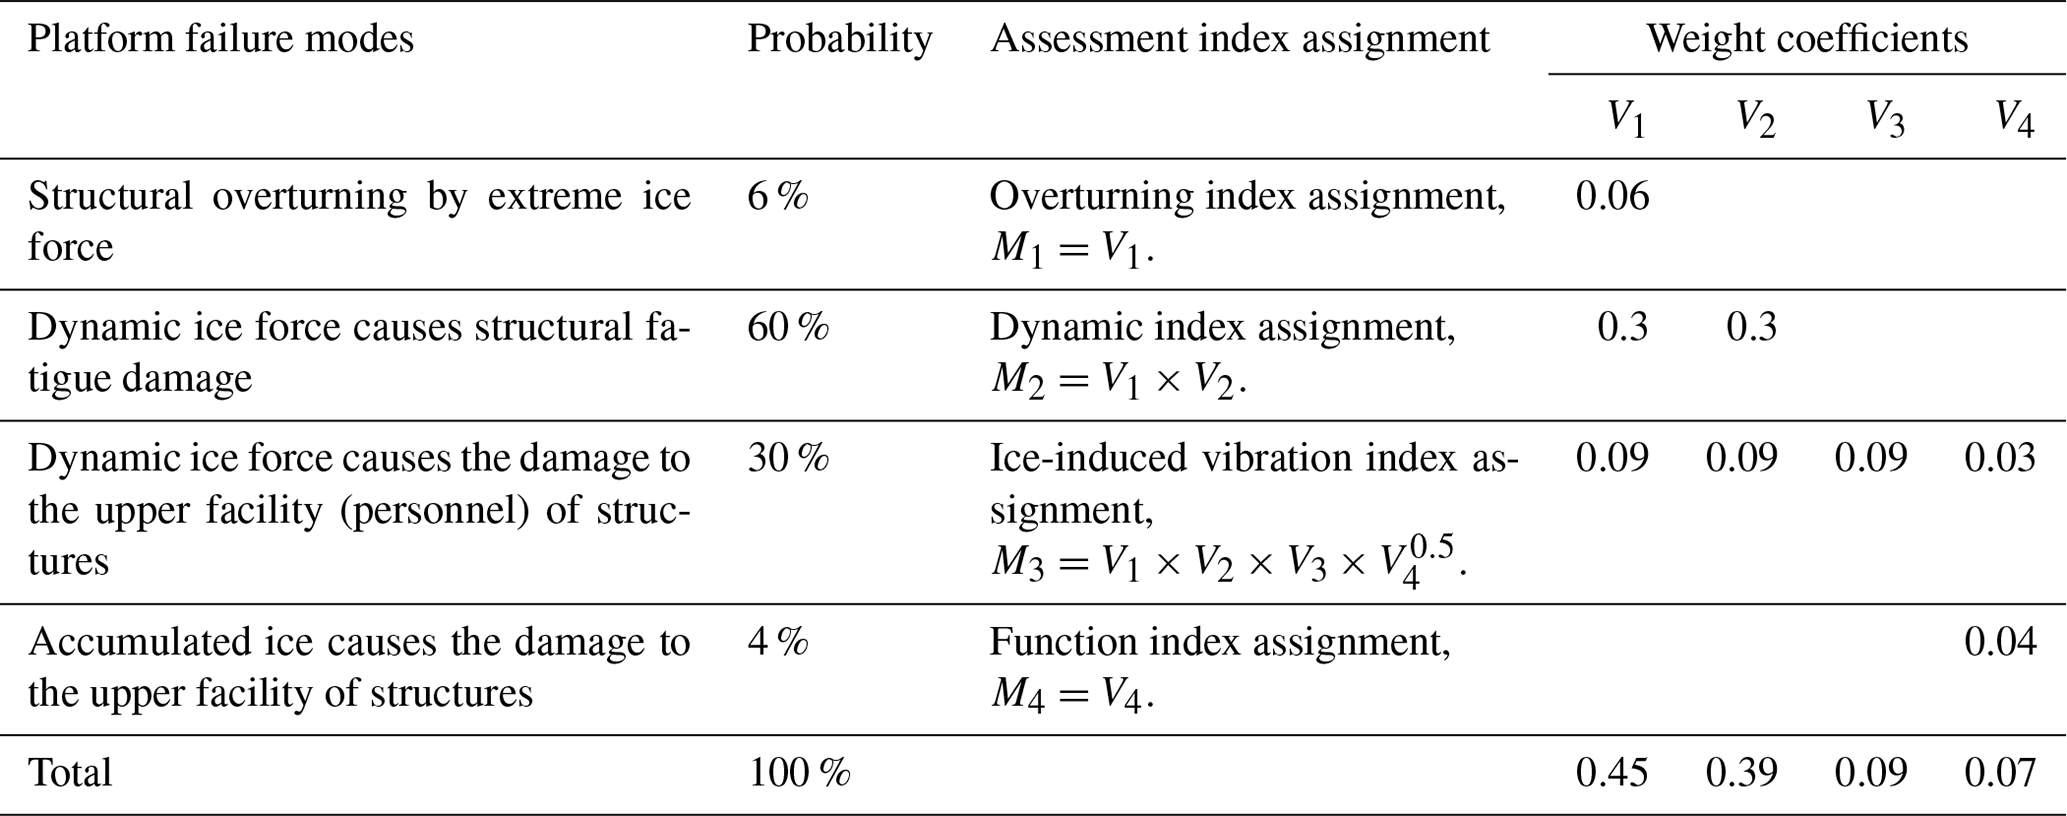
Table 8Probability of platform failure modes and weight coefficient assignment.
4.3.2 Vulnerability indices
According to the main distribution ranges of the parameters of jacket platforms in Liaodong Bay, the above-mentioned structural vulnerability indices proposed based on the sea ice risk modes of oil platforms are graded into three levels: high, medium, and low (Table 5).
4.4 Disaster resistance ability index
Emergency monitoring and sea ice management measures are the important factors to be considered in the assessment. The disaster resistance ability index R1 is proposed (Zhang et al., 2012) and graded in three levels (Table 6).
4.5 Risk assessment method
Before a risk assessment of sea ice disasters can be performed, it is necessary to separately determine the index system, assessment models, and grading standards. The index system varies with the assessment model. The index systems are introduced separately according to the overall risk assessment method and the multimode risk assessment method below.
4.5.1 Overall risk assessment method
The weight coefficients of sea ice hazard indices were determined according to the importance of each index in the ice force calculation models (Table 7). The weights of structural vulnerability indices (Table 7) were determined based on the failure modes of structures and the probabilities of corresponding risks or accidents (Table 8).
Table 9Hierarchical structure and weights of sea ice risk assessment factors for multimode risk analysis.

Table 10Assessment criteria of the risks of sea ice disasters on the oil platforms in the Bohai Sea.

Table 11Designed and assigned values of sea ice hazard indices in case analysis.

4.5.2 Multimode risk assessment method (multi-index synthetic risk assessment model)
Firstly, the weights of various risk modes were determined based on the failure modes of sea ice disasters and the probabilities of corresponding risks or accidents. Based on risk sources, risk mode assignments, and disaster resistance ability in various failure modes, the weights of the hazard indices, vulnerability indices, and disaster resistance ability indices were then determined (Table 9).
4.6 Assessment calculation method and grading criteria
According to Eqs. (1)–(3) in Sect. 3.2, the risk was calculated with the overall risk analysis method and then graded into four levels. The criteria and results of the risk assessment of sea ice disasters on oil platforms are proposed in this study (Table 10).
5.1 Parameters
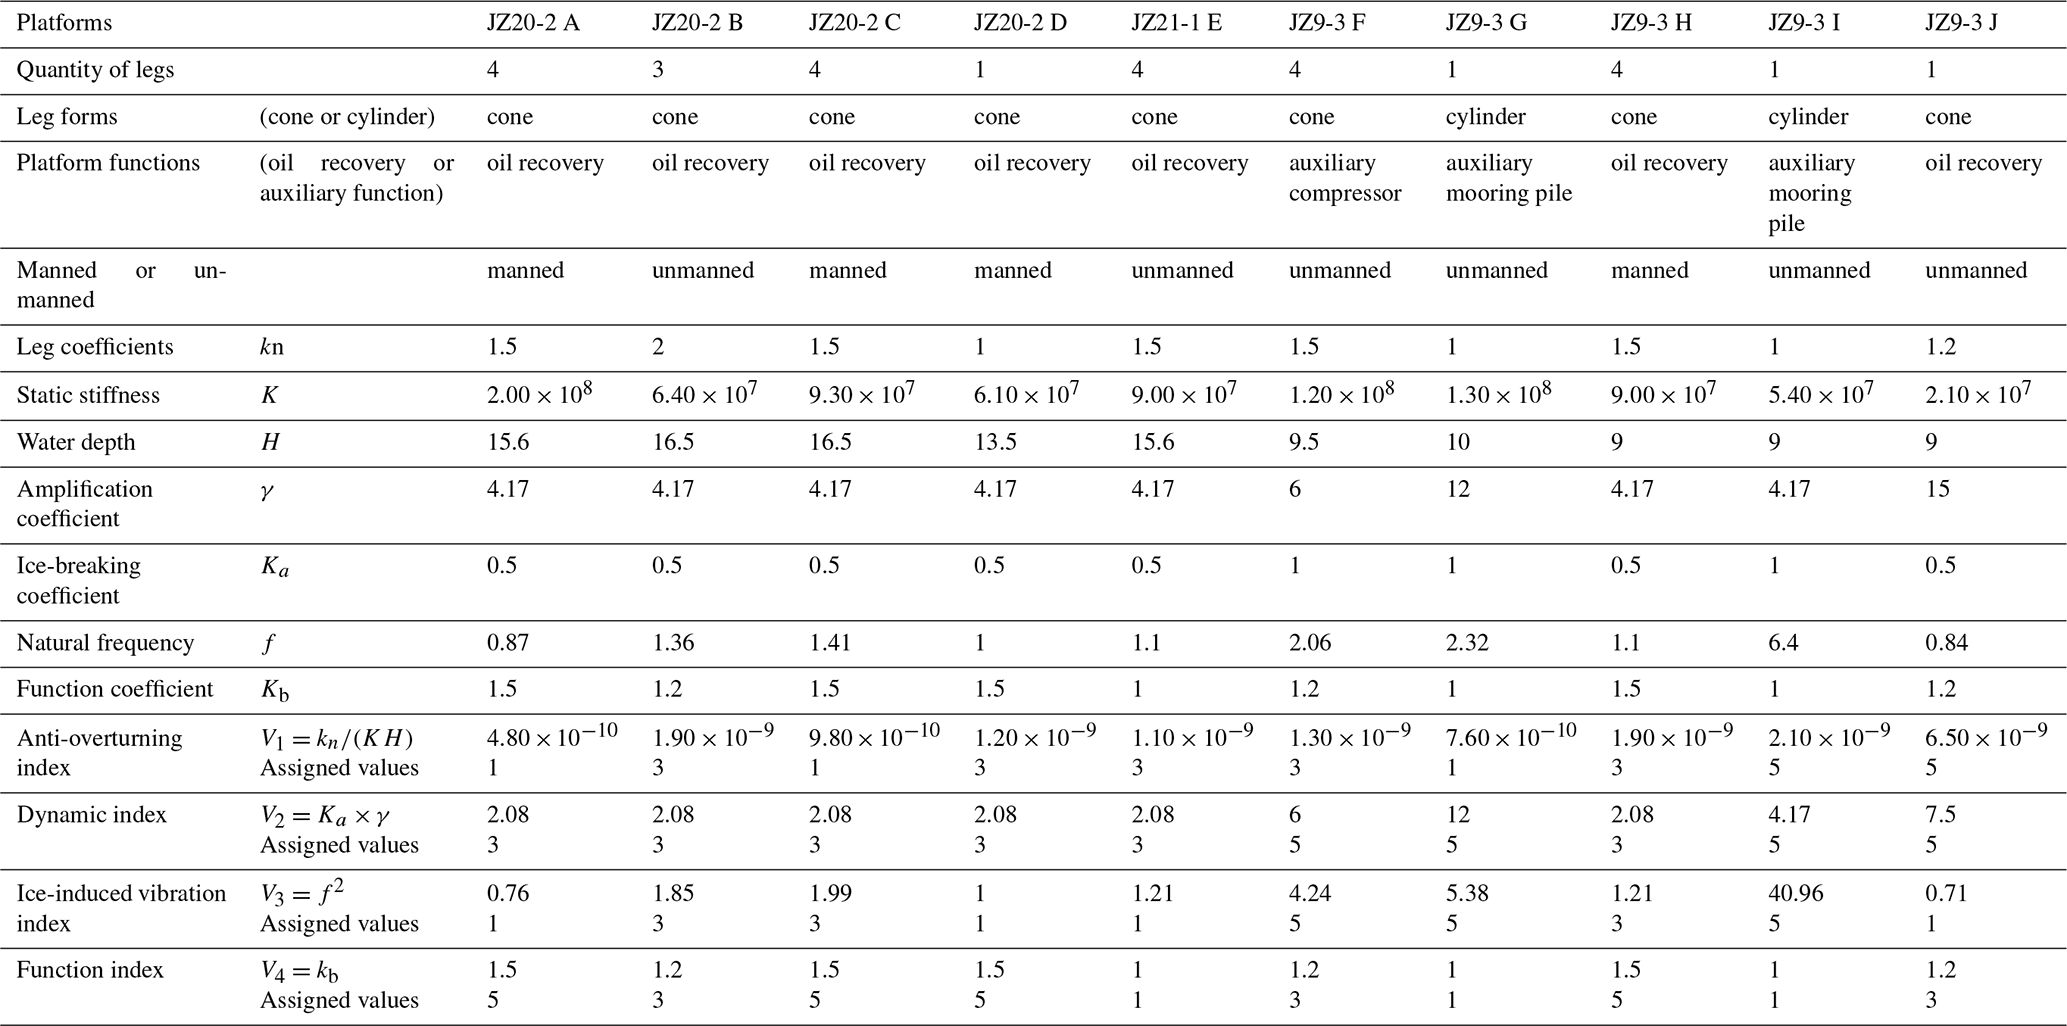
Taking 10 jacket platforms with different functions in the three regions of Liaodong Bay (JZ20-2, JZ21-1, and JZ9-3), sea ice risks were calculated with the above assessment methods. The vulnerability index was determined according to the locations of the three regions and corresponding sea ice parameters (Table 11). The designed and assigned values of the vulnerability indices of the 10 platforms were determined by the basic forms, functions and dynamic parameters of the platforms (Table 12).
Table 12Designed and assigned values of structural vulnerability indices in the case analysis.
5.2 Sea ice risk assessment and grading
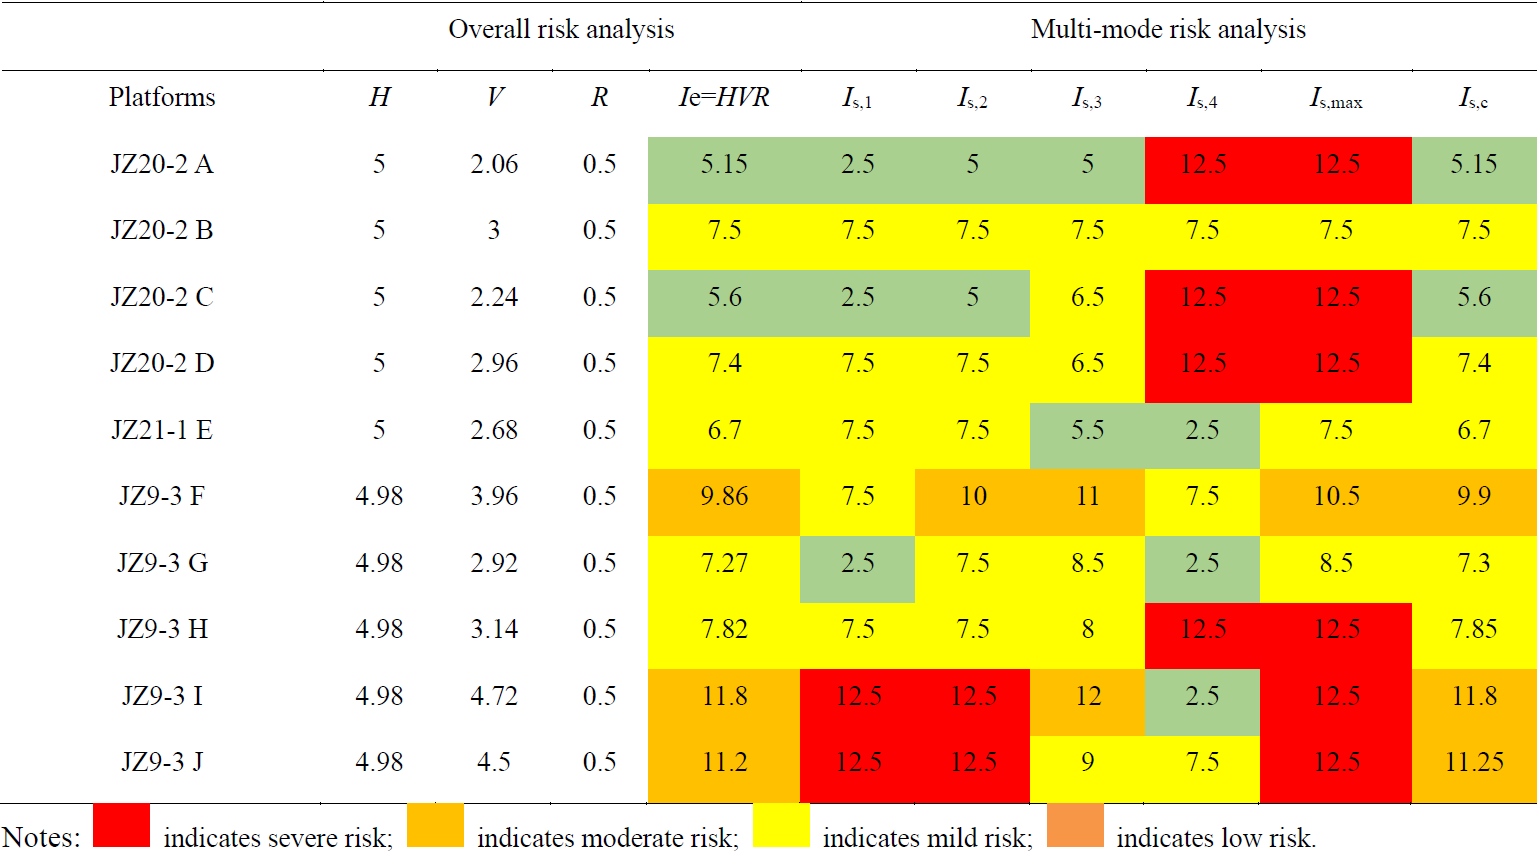
With the overall risk analysis method described in Sect. 4.4.1, the sea ice hazard (H), structural vulnerability (V), and disaster resistance ability (R) were determined, and then the overall risk Ie was calculated according to Eq. (1) and Table 7. The calculation results of four sea ice risks Is,i () were then determined. Following Eqs. (2) and (3), the multimode risk analysis results Is and maximum risk values Is,max were calculated using the synthetic index method.
Table 13Sea ice risk assessment analysis and risk grading results in the case analysis.
5.3 Analysis results
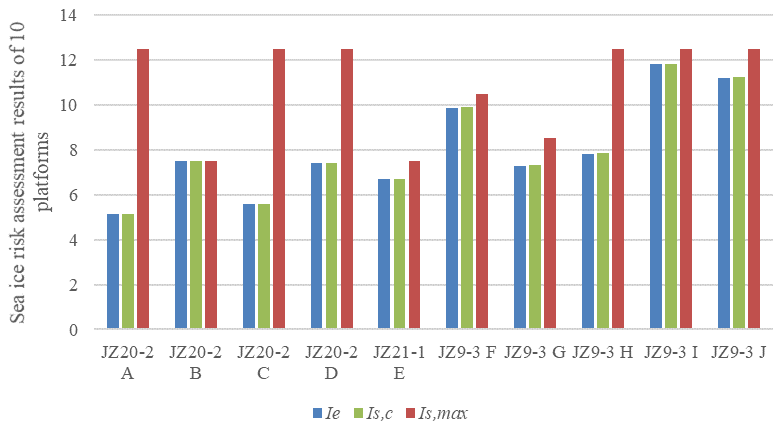
The three risk calculation results (Ie, Is, and Is,max) were analyzed (Fig. 4). In the calculation results obtained by the synthetic index method, the overall risk analysis results Ie were basically the same (Fig. 4) as the multimode risk analysis results Is and the risk grading results were the same because the theoretical basis for establishing the index system and the weights of the secondary indices adopted in the two methods were the same. The risk mode with the higher weight (such as Mode 2) dominated the multimode risk analysis results (Is) obtained with the synthetic index method. When Is,max was significantly different from Ie and Is, the risk values of most of the risk modes (such as Mode 4) with lower weights were higher, such as the risks for platforms A, C, D, and H (see Table 13).
The overall risk analysis results Ie and the multimode risk analysis results Is indicate that two main reasons are responsible for the higher risk level. Firstly, the steady-state vibration may occur on the structures and the dynamic larger amplification factor γ leads to the higher dynamic index V2. Therefore, the structural fatigue failure related to ice-induced vibration caused by dynamic ice force (Mode 2) occurs on some platforms, such as Platforms F and J. Secondly, due to the high structural fundamental frequency, the structural ice-induced vibration index V3 is large and the facility function failure caused by ice-induced vibration acceleration (Mode 3) occurs. For example, Platform I has a fundamental frequency of 6.4 Hz, which is significantly higher than the fundamental frequency of common jacket structures in Liaodong Bay (0.5–2 Hz).
In the study, the risk assessment method of sea ice disasters was developed for jacket platforms in ice-covered sea areas in Liaodong Bay in the Bohai Sea. The sea ice risk index system considering sea ice hazard, structural vulnerability and disaster resistance ability was established. In addition, based on the synthetic index method, sea ice disaster assessment methods were constructed, including the overall risk assessment method and multimode risk assessment method. The above key indices were determined based on the formation mechanism of sea ice disasters. The weights of these indices were recommended based on previously recorded sea ice disaster cases.
This paper focuses on the structural risk induced by level ice. The assessment method is also applicable to rafted ice since it has a similar ice–structure interaction process to level ice. In addition, the differences in ice parameters between rafted ice and level ice should be considered, such as the range of ice thickness, the value of ice strength, and the their weight for the risk value under different risk modes. The values of these indices were determined based on the ice conditions and parameters of jacket platforms in Liaodong Bay, so the applicability of these values in other sea areas needs to be further verified.
The assessment system is a qualitative description of risk and can be applied in structural optimization during the design phase and real-time risk level assessment during the operation phase. In the future, we will make a detailed analysis based on the preliminary results obtained with the risk assessment method in order to provide more efficient and accurate assessment results.
Access to designed and assigned values of sea ice hazard of the Bohai Sea is subject to Chinese regulations, i.e., China Sea Ice Conditions and Application regulation no. 45 (Q/HSn 3000-2002).
NX and SY conceived and designed the study. NX, YM, and WS performed the case analysis. DZ provided the value of vulnerability. NX and YM wrote the paper. SY and WS reviewed and edited the manuscript. All authors read and approved the manuscript.
The authors declare that they have no conflict of interest.
The authors would like to thank Qianjin Yue from the Dalian University of Technology for his great help in our study of formation mechanisms of sea ice disasters. Thanks are also given to for Huihui Li from the China National Offshore Oil Corporation for his help with the vulnerability analysis of oil platforms.
This study is financially supported by The National Key Research and Development Program of China (grant no. 2017YFQ0604902) and the National Natural Science Foundation of China (grant no. 41676087).
This paper was edited by Heidi Kreibich and reviewed by Shunying Ji and two anonymous referees.
API, API RP 2N: Recommended practice for planning, designing, and constructing structures and pipelines for arctic conditions, American Petroleum Institute, America, 1995.
Brown, T. G. and Määttänen, M.: Comparison of Kemi-I and Confederation Bridge cone ice load measurement results, Cold Reg. Sci. Technol., 55, 1–13, 2009.
China National Offshore Oil Corporation: Regulations for offshore ice condition & application in china Sea, Q/HSn 3000-2002, 2002.
Ding, D. W.: Introduction to sea ice engineering, China Ocean Press, Beijing, 1–70, 2000.
Fang, J., Liu, W., Yang, S., Brown, S., Nicholls, R. J., and Hinkel, J.: Spatial-temporal changes of coastal and marine disasters risks and impacts in mainland china. Ocean Coast. Manage., 139, 125–140, 2017.
Gu, W., Liu, C., Yuan, S., Li, N., Chao, J., and Li, L.: Spatial distribution characteristics of sea-ice-hazard risk in Bohai, China, Ann. Glaciol., 54, 73–79, 2013.
Guo, Q. Z., Gu, W., and Li, J.: Research on the sea–ice disaster risk in Bohai Sea based on the remote sensing, J. Catastrophol., 23, 10–18, 2008.
Huang, Y. AND Li, X.: Dynamic ice loads on conical structures, Theoretical & App, 2, 67–69, 2011.
Hwang, H. and Liu, Ji.: Seismic fragility analysis of reinforced concrete bridges, China Civil Eng. J., 37, 47–51, 2004.
Ji, S. Y. and Yue, Q. J.: Numerical model on engineering sea ice and its application, Science Press, Beijing, 327–328, 2011.
Kameshwar, S. P. and Jamie, E.: Multi-hazard risk assessment of highway bridges subjected to earthquake and hurricane hazards, Eng. Struct., 78, 154–166, 2014.
Khanduri, A. C. and Morrow, G. C.: Vulnerability of buildings to wind storms and insurance loss estimation, J. Wind Eng. Ind. Aerod., 91, 455–467, 2003.
Li, G., Liu, X., Liu, Y., and Yue, Q.: Optimum design of ice-resistant offshore jacket platforms in the Bohai Gulf in consideration of fatigue life of tubular joints, Ocean Eng., 35, 484–493, 2008.
Liu, X., Li, G., Yue, Q., and Oberlies, R.: Acceleration-oriented design optimization of ice-resistant jacket platforms in the bohai gulf, Ocean Eng., 36, 1295–1302, 2009.
Liu, Y.: Research on Dynamic Analysis and Structural Lectotype of Ice-resistant Offshore Platforms, Doctoral thesis, Dalian University of Technoloty, Dalian, 2007.
Liu, Y., Yue, Q. J., Yan, Q. U., Wang, R. X., and Yu, X. B.: Estimation of ice-reduced fatigue life for ice-resistant jacket platforms, Ocean Eng., 4, 539–547, https://doi.org/10.1016/j.mineng.2005.09.006, 2006.
Lu, T. N.: Sea ice disaster and its countermeasures of Bohai in China, J. Nat. Disast., 4, 53–59, 1993.
Luo, Y. W., Wu, H. D., Zhang, Y. F., Sun, C. R., and Liu, Y.: Application of the hy-1 satellite to sea ice monitoring and forecasting, Acta Oceanol. Sin., 23, 251–266, 2014.
Mangalathu, S., Jong-Su, J., Padgett J. E., and Reginald, D.: Performance – based grouping methods of bridge classes for regional seismic risk assessment: Application of ANOVA, ANCOVA, and non-parametric approaches, Earthq. Eng. Struct. D., 46, 2587–2602, https://doi.org/10.1002/eqe.2919, 2017.
Melani, A., Khare R., Dhakal R. P., and Mander, J. B.: Seismic risk assessment of low rise RC frame structur, Structures, 5, 13–22, 2016.
Ouyang, L. X., Hui, F. M., Zhu, L. X., Cheng, X., Cheng, B., Shokr, M., Zhao, J. Ding, M. H., and Zeng, T.: The spatiotemporal patterns of sea ice in the Bohai Sea during the winter seasons of 2000–2016, Int. J. Digit. Earth, 12, 1–17, https://doi.org/10.1080/17538947.2017.1365957, 2017.
Park, Y. J., Ang, A. H., and Wen, Y. K.: Seismic damage analys is of reinforced concrete buildings, Struct. Eng., 111, 740–757, 1985.
Qu, Y., Yue, Q., Bi, X., and Kärnä, T.: A random ice force model for narrow conical structures, Cold Reg. Sci. Technol., 45, 148–157, 2006.
RIL, RIL-144: Finnish civil engineers association, Guideline for the loading of structures, Finnish civil engineers association, Finland, 2001.
Sanderson, T.: Ice Mechanics: Risks to Offshore Structures, Graham and Trotman, London, UK, 1988.
Singhal, A. and Kiremidjian, A. S.: Method for probabilistic evaluation of seismic structural damage, J. Struct. Eng., 122, 1459–1467, 1996.
State Oceanic Administration: Technical Guidelines for Risk Assessment and Zoning of Sea Ice Disasters, Beijing, China, 2016.
State Oceanic Administration, People's Republic of China (SOAPRC): Statistical communique of maritime hazard of China from 2001–2016, Beijing, China, 2017.
Sparks, P. R., Schiff, S. D., and Reinhold, T. A.: Wind damage to envelopes of houses and consequent insurance losses, J. Wind Eng. Ind. Aerod., 53, 145–155, 1994.
Su, H. and Wang, Y.: Monitoring the spatiotemporal evolution of sea ice in the bohai sea in the 2009–2010 winter combining modis and meteorological data, Estuar. Coast., 35, 281–291, 2012
Tachiiri, K.: Quantitative risk assessment for future meteorological disasters, Climatic Change, 113, 867–882, 2012.
Timco, G. W., Irani, M. B., Tseng, J., Liu, L. K., and Zheng, C. B.: Model tests of dynamic ice loading on the chinese jz-20-2 jacket platf, Can. J. Civil Eng., 19, 819–832, 2011.
Tromans, P. S. and van de Graaf, J. W.: Substantiated Risk Assessment of Jacket Structure, J. Waterw. Port C. Ocean Eng., 120, 535–556, https://doi.org/10.1061/(asce)0733-950x(1994)120:6(535), 1994.
Wang, F., Zou, Z. J., Zhou, L., Ren, Y. Z., and Wang, S. Q.: A simulation study on the interaction between sloping marine structure and level ice based on cohesive element model, Cold Reg. Sci. Technol., 149, 1–15, https://doi.org/10.1016/j.coldregions.2018.01.022, 2018.
Wang, X. Y., Yuan, B. K. , Shang, J., and Li G.: Disaster of sea ice and defence Countermeasures in the Bohai Sea and the Yellow Sea, Coast. Eng., 30, 46–55, 2011.
Wang, Y., Yue, Q., Guo, F., Bi, X., Shi, Z., and Yan, Q.: Performance evaluation of a new ice-resistant jacket platform based on field monitoring, Cold Reg. Sci. Technol., 71, 44–53, 2012.
Wu, Q. Y., Zhu, H. P., and Fan, J.: Performance-based seismic financial risk assessment of, reinforced concrete frame structures, J. Cent. South Univ. T., 19, 1425–1436, 2012.
Xu, N.: Research on Critical Issues of Sea-ice Disaster Risk Assessment and Prevention Strategy, Posdoctoral Research Report, National Marine Environmental Monitoring Center and Dalian University of Technology, China, 2014.
Yue, Q., Guo, F., and Karna, T.: Dynamic ice forces of slender vertical structures due to ice crushing, Cold Reg. Sci. Technol., 56, 77–83, 2009.
Yue, Q. J., Qu, Y., Bi, X. J., and Karna, T.: Ice force spectrum on narrow conical structures, Cold Reg. Sci. Technol., 49, 161–169, 2007a.
Yue, Q. J., Yuan, L., Zhang, R. X., Yan, Q. U., and Wang, R. X.: Ice-induced fatigue analysis by spectral approach for offshore jacket platforms with ice-breaking cones, China Ocean Eng., 21, 1–10, 2007b.
Yue, Q. J., Zhang, D. Y., Liu, Y., and Tong, B. L.: Failure modes analysis of ice-resistant compliant structures based on monitoring oil platforms in Bohai Gulf, Ocean Eng., 26, 18–23, 2008.
Zhang, D., Xu, N., Yue, Q., and Liu, D: Sea ice problems in bohai bay oil and gas exploitation, J. Coastal Res., 73, 676–680, 2015.
Zhang, D., Wang, G., Yue, Q., and Lou, C.: Structural Ice-resistant Performance Evaluation of Offshore Wind Turbine Foundation, Proceedings of the 26th International Ocean and Polar Engineering Conference, 26 June–2 July, 16TPC-0778, Rhodes, Greece, 2016.
Zhang, D. Y., Yue, Q. J., Che, X. F., Liu, Y., and Li, H. H.: Dynamic characteristics analysis of ice-resistant jacket platforms in Bohai Sea, Ocean Eng., 28, 18–24, 2010.
Zhang, H., Li, J., Yin, L., Zhang, T., Ning, L., and Zhang, Q.: Risk quantitative technology of oil and gas drilling engineering, J. Safety Sci. Technol., 8, 127–131, 2012.
Zhang, J. Q. and Li, N.: Quantitative methods and applications of risk assessment and management on main meteorological disasters, Beijing Normal University press, Beijing, China, 2007.
Zhang, X. L., Zhang, Z. H., and Zong J.: Sea ice disasters and their impacts since 2000 in Laizhou Bay of Bohai Sea, China, Nat. Hazards, 65, 27–40, 2013.
Zhao, Q., Liu, Y., Tang, M. N. and Shi, J. P.: Numerical sea ice forecast for the Bohai Sea in the winter of 2012–2013, Marine Forecasts, 31, 73–79, 2014.