the Creative Commons Attribution 4.0 License.
the Creative Commons Attribution 4.0 License.
 | 14 May 2020
Analysis of the instability conditions and failure mode of a special type of translational landslide using long-term monitoring data: a case study of the Wobaoshi landslide (in Bazhong, China)
Chenghu Wang
Guiyun Gao
Pu Wang
Zhengyang Hou
Qisong Jiao
A translational landslide comprised of nearly horizontal sandstone and mudstone interbeds occurred in the Ba River basin of the Qinba–Longnan mountainous area. Previous studies have succeeded to some extent in investigating the formation mechanism and failure mode of this type of rainfall-induced landslide. However, it is very difficult to demonstrate and validate the previously established geomechanical model, owing to lack of landslide monitoring data. In this study, we considered a translational landslide exhibiting an unusual morphology, i.e., the Wobaoshi landslide, which occurred in Bazhong, China. First, geological conditions of this landslide were determined through field surveys, and the deformation and failure mode of the plate-shaped main bodies were analyzed. Second, long-term monitoring was performed to obtain multiparameter monitoring data (width of the crown crack, rainfall, and accumulated water pressure in cracks). Finally, an equation was developed to evaluate the critical water height of the multistage bodies, i.e., hcr, based on the geomechanical model analysis of the multistage main sliding bodies, and the reliability of this equation was verified using long-term relevant monitoring data. Subsequently, the deformation and failure mode of the plate-shaped bodies were analyzed and investigated based on numerical simulations and calculations. Thus, the monitoring data and geomechanical model proved that the accumulated water pressure in cracks makes cracks open much wider and causes the plate-shaped bodies to creep. Simultaneously, an optimized monitoring methodology was proposed for this type of landslide. Therefore, these research findings are of reference significance for the rainfall-induced translational landslides in this area.


A special type of landslide can be observed in the red beds of the Qinba–Longnan mountainous area. This landslide mainly occurs in the rock mass of the nearly horizontal sandstone and mudstone interbed located in the Ba River basin and exhibits the following characteristics: the cover layer is extremely thin (generally not more than 5 m), the sliding surface is nearly horizontal, and the inclination angle of the bedrock is generally only 3–8∘. The main body of this landslide is typically a thick sandstone layer with good integrity, whereas its bottom is a weak layer comprised of mudstone. During the monsoon season, especially in the rainstorm scenario, the main body is pushed horizontally along the sliding surface. Some scholars have defined this sliding body as a flat-push landslide, which is a typical rainfall-induced landslide (Zhang et al., 1994; Xu et al., 2010).
Previous research classified the formation mechanisms and failure mode of the translational landslide into two categories. The first category of translational landslide is primarily driven by the rising hydrostatic pressure or confined water pressure due to occasional rainstorms (Kong and Chen, 1989; Matjaž et al., 2004; Zhao et al., 2014). The main body of thick sandstone can slide along the surface because of the integrated action of the hydrostatic pressure in crown cracks and the uplift pressure from the sliding surface (Wang and Zhang, 1985; Zhang et al., 1994; Fan, 2007). Meanwhile, the interbedded soil, which is expanded by rainwater, also leads to slip between the nearly horizontal layers (Yin et al., 2007). The second category includes landslides in which the upper layer of hard rock (such as granite and sandstone) has a crushing effect on the lower rock layer, then resulting in the sliding of the upper rock mass (Cruden and Varnes, 1996; Emelyanova II, 1986).
With respect to the geomechanical analysis of rainfall-induced translational landslide, scholars and researchers have used physical simulation experiments (Fan et al., 2008), geomechanical modeling analysis (Fan et al., 2009; Xu et al., 2010), susceptibility models (Hussin et al., 2013), and satellite remote-sensing methods (Barlow et al., 2003; Martin and Franklin, 2005) to investigate the formation mechanism, initiation criteria, and sensitivity analysis of the safety factors. Fan et al. (2008) reproduced the deformation and failure process of the landslides via a physical simulation and further verified the deformation mechanism as well as the initiation criterion formula of the flat-push landslide (Zhang et al., 1994). Sergio et al. (2006) investigated the soil failure mode and the stability of rainfall-induced landslides, which resulted from the increase in pore-water pressure by physical simulation experiments. Floris and Bozzano (2008) and Teixeira et al. (2015) used laboratory experiments to establish an optimization model for rainfall-induced sliding initiation criteria, together with rainfall data based on the historical periodic rainfall conditions, for landslides in the southern Apennines and shallow landslides in northern Portugal; they also estimated the possibility of landslide reactivation induced by rainstorms regarding landslide susceptibility and safety factors. Barlow et al. (2003) and Martin and Franklin (2005) used the US land satellite data (ETM+) and the digital elevation model to detect the residues of translational bedrock landslides in alpine terrain. Bellanova et al. (2018) used electrical-resistivity-imaging technology to investigate the Montaguto translational landslide that occurred in the southern part of the Apennines; they also established a refined geometric model to observe the lithologic boundaries, structural features, and lateral and longitudinal discontinuities associated with the sliding surfaces.
Engineering geologists have conducted some sophisticated research on the formation characteristics and genetic mechanism of translational landslides. Based on the findings of the previously conducted studies, this study mainly focuses on the following two aspects.
-
The occurrences of plate-shaped translational landslides are often unexpected and covert. The plate-shaped translational landslides are primarily induced by rainfall; such events often occur in the red-bed zone of the Qinba–Longnan mountainous area. The plate-shaped landslides, which were characterized by large volumes of mass and covert and abrupt occurrence, often cause massive property loss and casualties due to the dense population and infrastructure in this area. Such destructive events revealed by the past field surveys were often classified as small-scale bedrock collapses, and the entire evaluation process of the hidden dangers was generally ignored by most hazard prevention participants.
-
After screening the previous research findings, we found just a few field surveys and monitoring data for this type of landslide. In previous studies, specific geomechanical models for the failure mode under different rainfall conditions have been established, and many laboratory experiments have been conducted to verify the models (Fan et al., 2008; Xu and Zeng, 2009). However, all these geomechanical models should be proved by the long-term monitoring data. Therefore, several key field monitoring parameters, including the width of the crown crack, amount of rainfall, accumulated water pressure in cracks, and groundwater level, should be evaluated to investigate and validate the deformation as well as the failure mode of the translational landslides, to establish a new geomechanical model.
In this research, we selected a typical and specific translational landslide (the Wobaoshi landslide) occurring in the Ba River basin of the Qinba–Longnan mountainous area to conduct field surveys, long-term monitoring (February 2015 to July 2018), geomechanical model analysis, and numerical simulation to investigate the instability conditions and failure mode of this translational landslide under the influence of periodic rainfall.
2.1 Landslide location
The Wobaoshi landslide is located in the Ba River basin in the Qinba–Longnan mountainous area. It is located in the village of Baiyanwan, town of Sanhui, Enyang District, in the city of Bazhong, Sichuan Province, China, and the specific location and elevation information are indicated in Fig. 1. The Wobaoshi landslide occurred just on the left bank of the Shilong River, the second-grade tributary of the Ba River, and the boundaries of the landslide are controlled by the local topography of the riverbank. The local geomorphology around the slide is characterized by low cuesta and a structural slope. The stratum consists of interbeds of sandstone and mudstone and belongs to the Upper Jurassic Penglaizhen Formation of the Jurassic series (Chen et al., 2015). The stratum is also called red beds in China (Hu and Zhao, 2006).
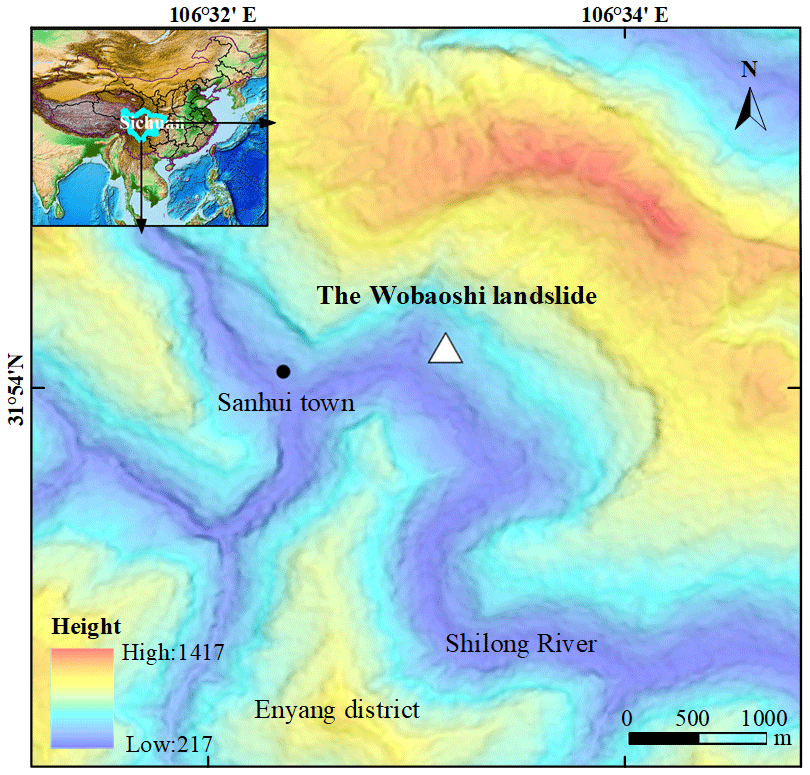
Figure 1Geographic location and elevation map of the Wobaoshi landslide.
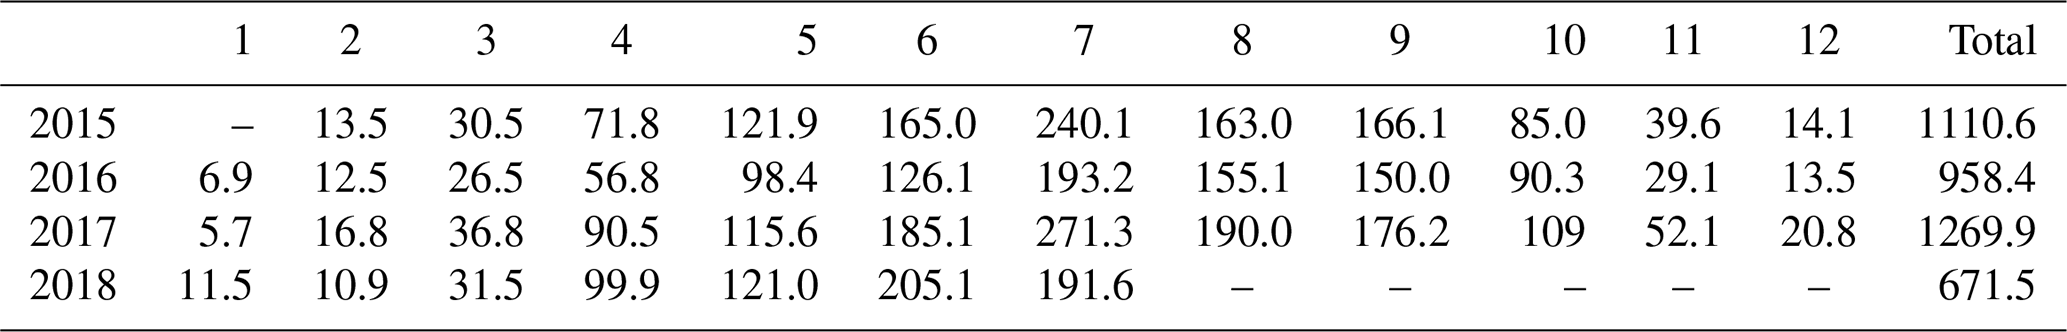
This area belongs to the subtropical monsoon region with abundant rainfall, and 75 % to 85 % of total annual rainfall is mostly concentrated between May and October. The monthly average rainfall in 1 year is greater than 100 mm. The maximum monthly rainfall, often occurring in July, is more than 200 mm, and severe rainstorms often occur in the same month. The precipitation in this region gradually decreases after August. The surface water in this area includes fissure water in weathered bedrock and accumulated water in the cracks.
2.2 Landslide characteristics
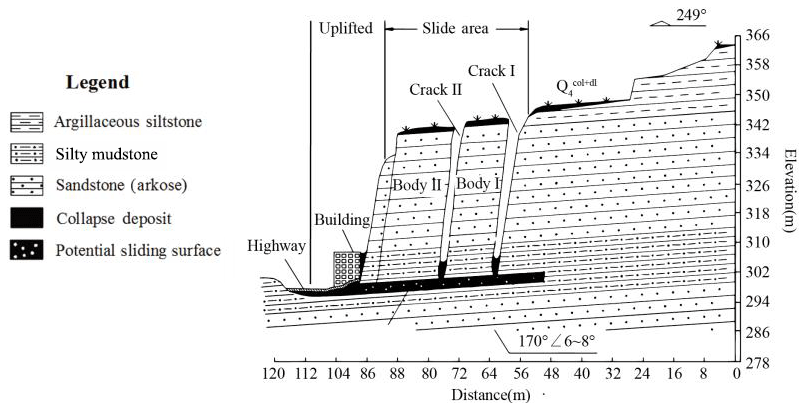
According to the remote-sensing data by the GF-2 satellite and the field surveys, the landslide looks long, flat, and rectangular in shape. The landslide body is nearly 32 m long in the longitudinal (sliding) direction, 160 m wide in the lateral direction, and approximately 30 m thick in the vertical direction, and the total volume is approximately 1.536×10⁵ m3 (Chen et al., 2015). This main body belongs to small- to medium-sized landslides according to the classification proposed the Ministry of Land and Resources of the PRC (2006). Figure 2 shows the schematic map of the Wobaoshi landslide and photographs of five observation points. The landslide lies in the south of the Nanyangchang anticline of the geotectonic outline map of the Daba Mountains (Dong et al., 2006). The landside occurred on a subhorizontal inclining rocky slope. The sliding direction of the landslide is 249∘, and the degree of inclination of the bedrock is 6–8∘. Figure 3 demonstrates the I–I′ cross section of the landslide.
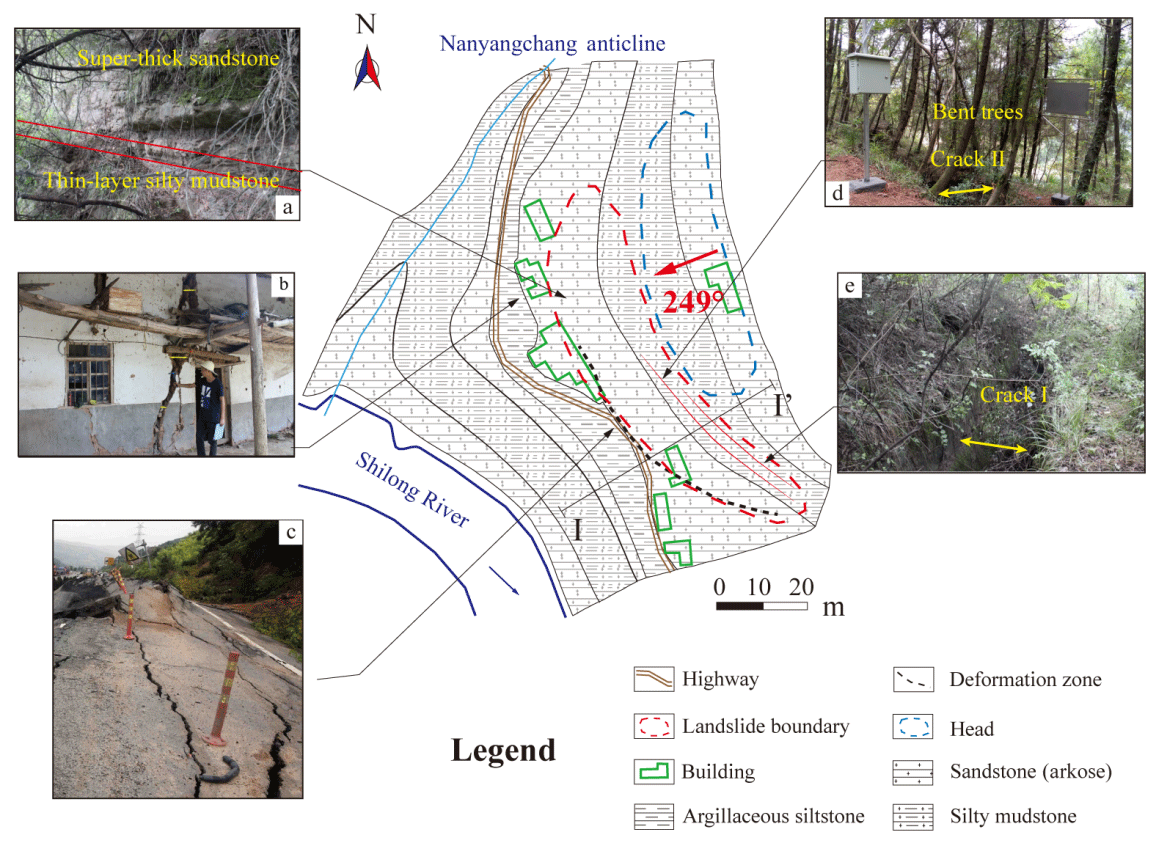
Figure 2The schematic map of the Wobaoshi landslide and photographs of the observation points: (a) exposed bedrock at the front edge, (b) the houses at the front edge with cracks, (c) the roadbed, which is uplifted at the front edge, (d) crack II and bent trees, and (e) crack I.
As shown in Fig. 2a, there is 2–3 m thick mixture layer of soil and colluvial deposits, covering the bedrock mass. The major bedrock mass consists of integral and thick sandstone, and the potential bottom sliding surface is in the weak interlayer of silty mudstone. As shown in Fig. 2b and c, the Wobaoshi landslide poses a major threat to residential houses and highways, cracking the houses and uplifting the highways on its front edge; therefore, this landslide considerably threatens the safety of local people's property and transportation. According to Fig. 2d, bent trees grow on the crown of the landslide bodies I and II. The existence of bent trees implies that the geological bodies on the potential sliding surface become unstable, which is also historical evidence of the slow sliding movement of the Wobaoshi landslide.
Totally different from the common geometry of landslides, as shown in Fig. 2, the ratio of the longitudinal length to the lateral width is much smaller than those of common landslides; therefore, this type of geological-hazard mass is often categorized as a bedrock collapse by mistake during the routine field surveys. As indicated in Fig. 3, the two major sliding bodies are almost vertical and look like two parallel walls, a shape which is created by two sets of long and straight structural planes cutting through sub-horizontal sedimentary rock mass perpendicularly into two narrow plates (bodies I and II), and the potential sliding surface is sub-horizontal, parallel with the sedimentary bedding plane. For body I of the landslide, it is 12 m long in the longitudinal direction, 70 m wide in the lateral direction, and 30 m high; for body II of the landslide, it is 16 m long in the longitudinal direction, 65 m wide in the lateral direction, and 28 m high. Cracks I and II, formed by bodies I and II and head rock mass, are filled with clay, gravel, and collapsed debris. When high-intensity precipitation occurs during the monsoon, accumulated water can often be observed in the two cracks, indicating that cracks I and II exhibit favorable water storage conditions.
3.1 Monitoring scheme
According to the detailed field surveys and preliminary analysis of Wobaoshi landslide, this landside should be categorized as rainfall-induced translational landslide according to the landslide geometry, lithology conditions, slope structures, and water accumulation situation in cracks (Xu et al., 2010). Based on the previous landslide monitoring cases (Ayalew et al., 2005; Fan et al., 2009), the rainfall, width of cracks I and II, and level of accumulated water in cracks I and II were chosen as key monitoring indicators for the Wobaoshi landslide. The layouts of all the field monitoring instruments are demonstrated in Fig. 4.
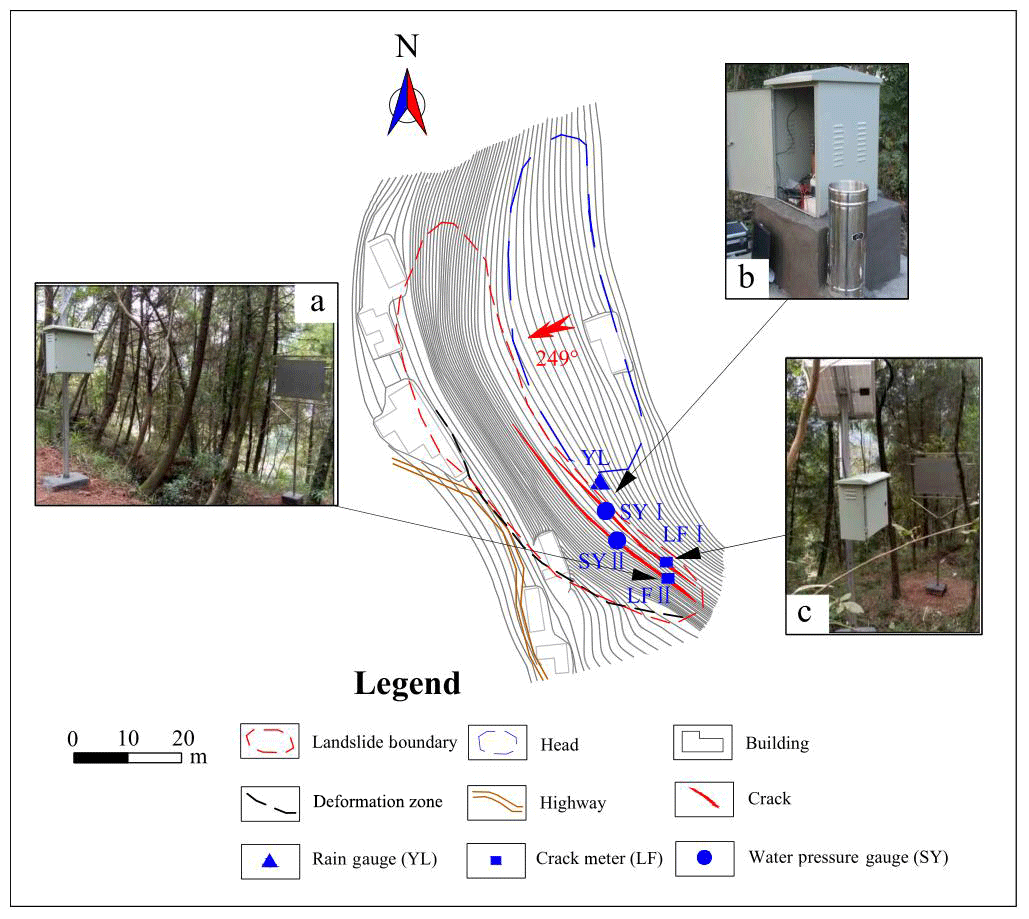
Figure 4Location of the monitoring equipment: (a) crack II meter, (b) rain gauge and water pressure gauge, and (c) crack I meter.
As shown in Fig. 4a and c, two non-contact automatic crack meters, LF I and II, are installed on the crown surface of bodies I and II to record the real-time widths of cracks I and II (Liu and Wang, 2015). As shown in Fig. 4b, an automatic rain gauge is installed on the crown of the Wobaoshi landslide to measure monthly and cumulative rainfall values, and two water pressure gauges are installed at the bottom of cracks I and II to measure the water level of accumulated water in cracks I and II. The measurement frequency for the crack width is three times per day, the measurement frequency for the accumulated water level is twice per day, and the monthly accumulative value of precipitation is adopted to indicate the local rainfall amount. All the monitoring data were transmitted to a network monitoring server through the public GPRS network.
The field monitoring work was started from February 2015 and ended as of July 2018. The monitoring work lasted for about 3.5 years; all the monitoring data are consecutive during the field monitoring and qualified for community warning and scientific analysis with reference to the geological data standards issued by the China Association of Geological Hazard Prevention (CAGHP; CAGHP, 2018).
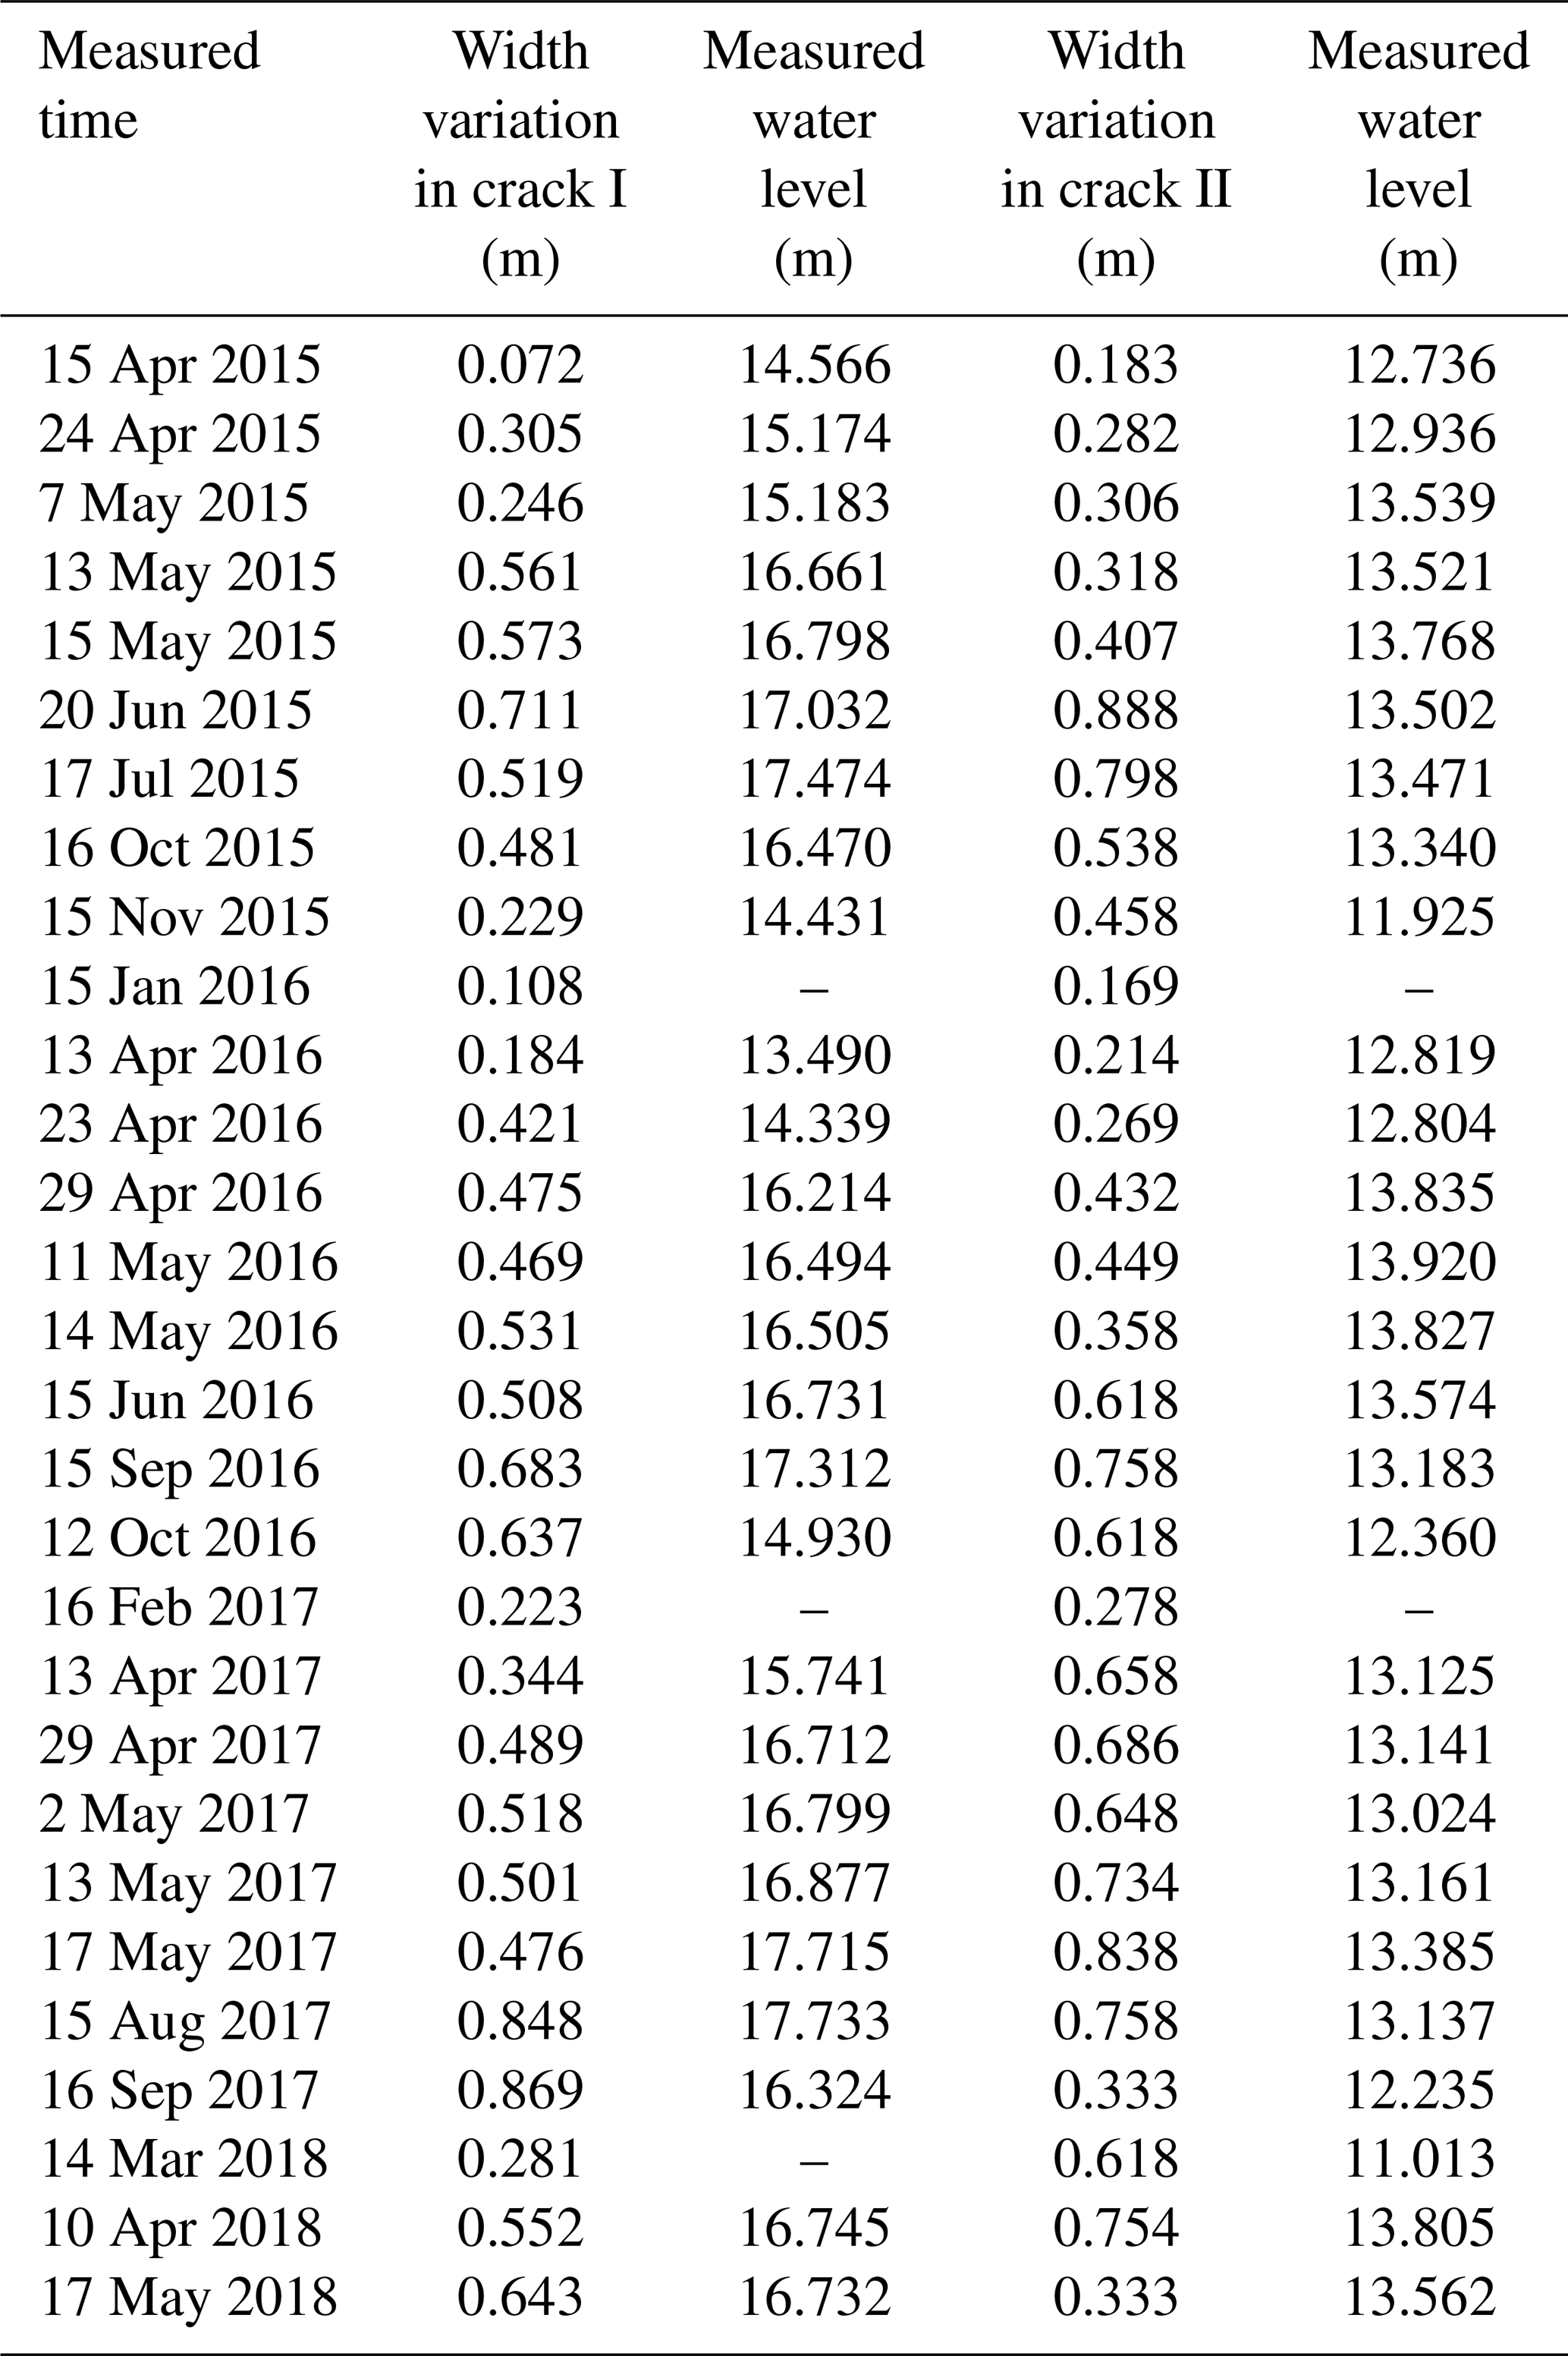
As shown in Fig. 5, for the data processing of water level in cracks, the actual water level, hc, can be calculated using , where hi is the installation depth of the water pressure gauge, H is the actual depth of the crack, and hm is the measured the water level. For crack I, with the installation depth m, the depth of crack I is H1=38 m; thus m + . For crack II, with the installation depth m, the depth of crack II is H2=35 m; thus m + . The initial width of crack I is 5.640 m, and the initial width of crack II is 4.492 m; the first measurement was commenced in January 2015 (Chen et al., 2015).
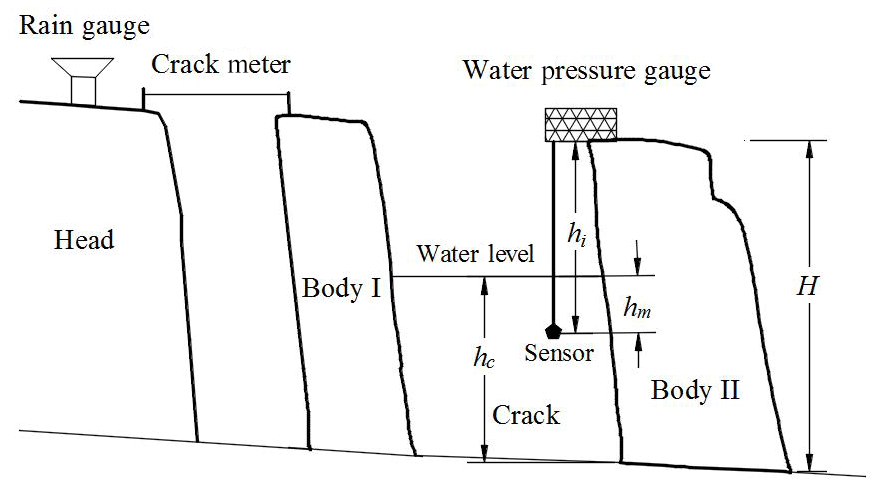
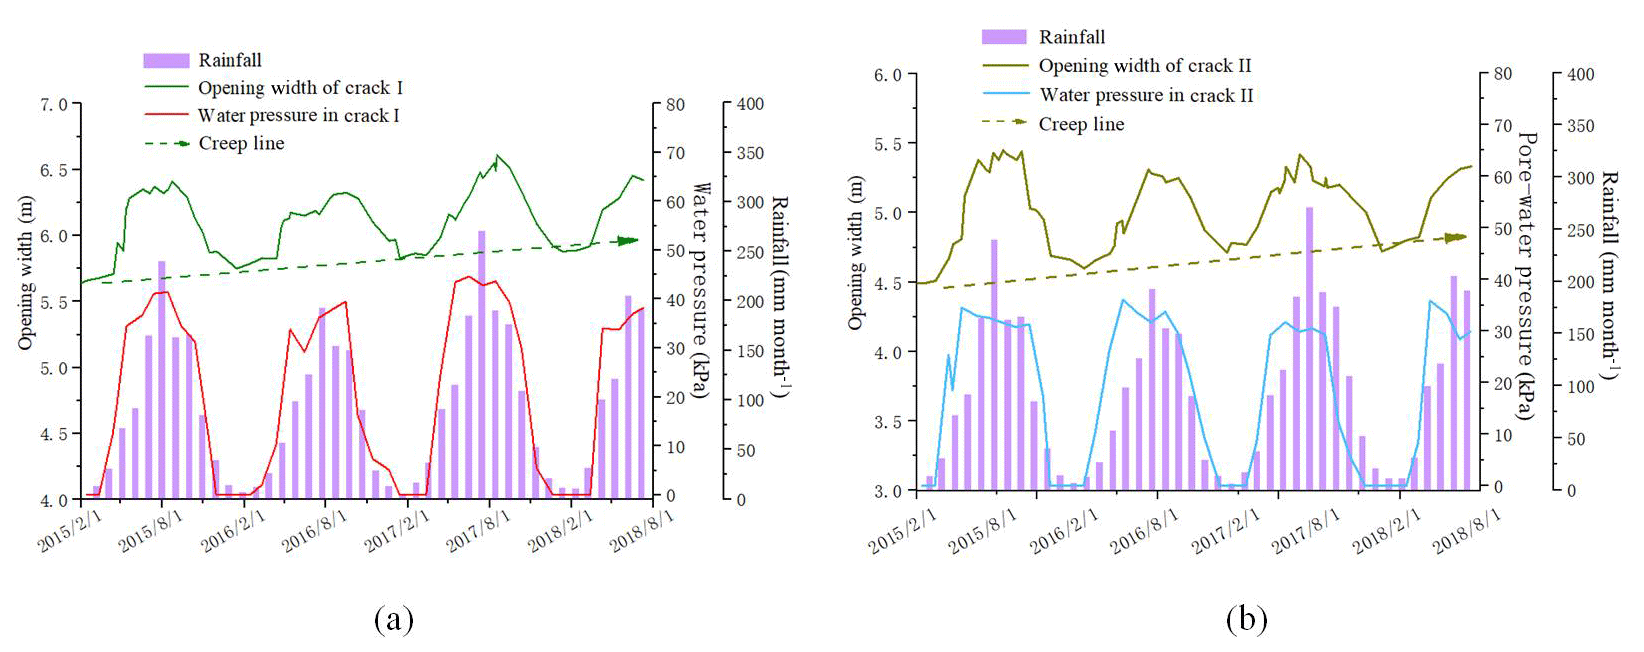
Figure 6The monitoring data curves: (a) opening width of crack I, water pressure, and rainfall with respect to monitoring time, and (b) opening width of crack II, water pressure, and rainfall with respect to monitoring time.
3.2 Data analysis
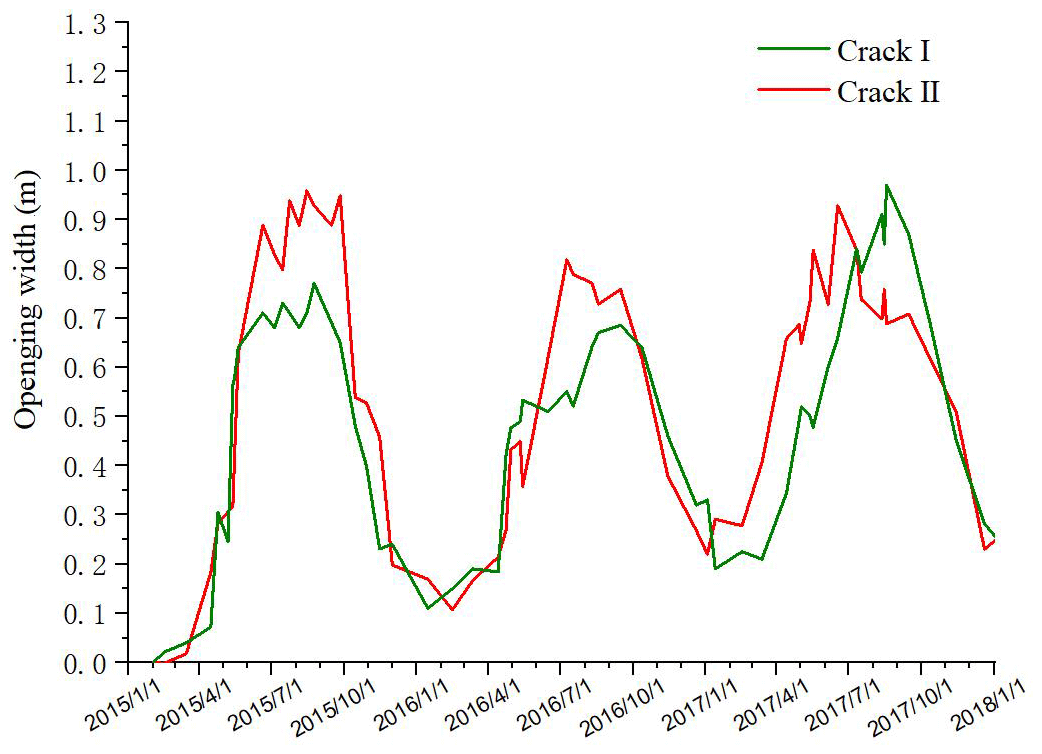
All the monitoring data and processed results were presented in Tables 1–3 and Fig. 6 and were plotted based on Tables 1 and 2. The plots of Fig. 6a and b denote the comparison plots of the opening widths of cracks I and II, water pressures in crack I and II, and the monthly rainfall with respect to the monitoring time.
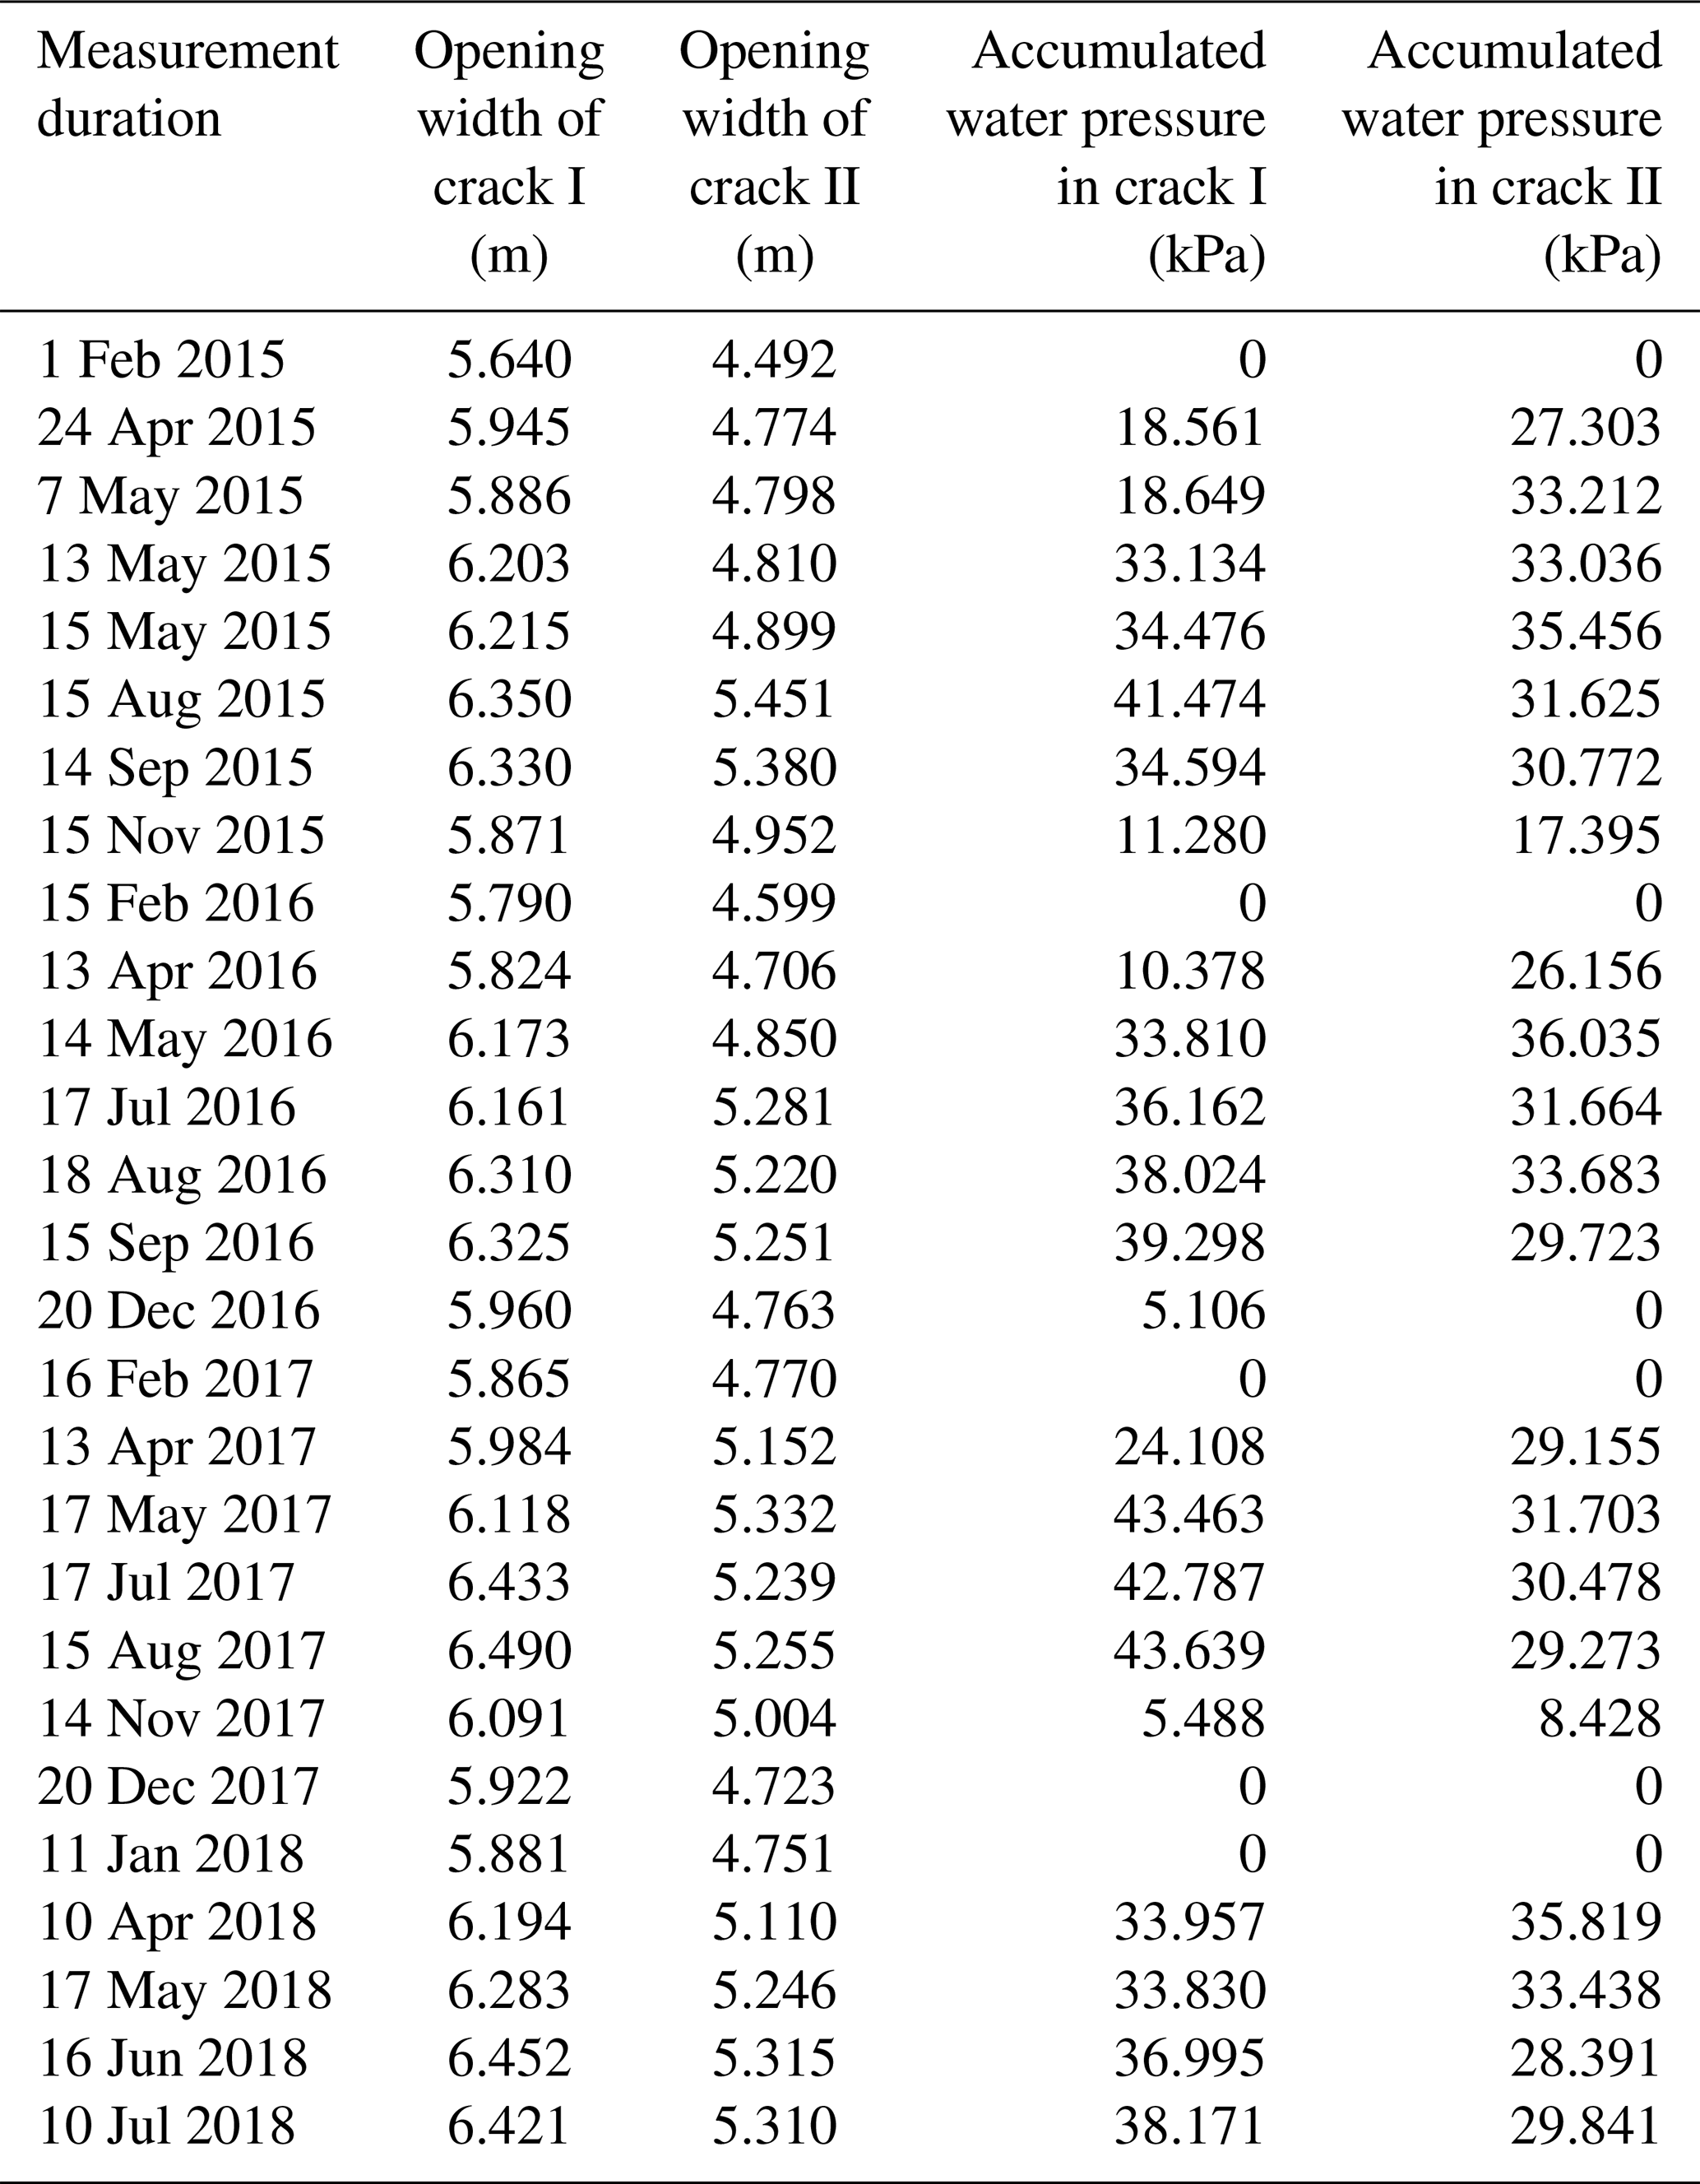
Table 2Cumulative rainfall values of the Wobaoshi landslide (mm per month).
According to the above data comparison and analysis, cracks I and II have favorable water storage capability during the monsoon season. According to Fig. 6a, the opening width of crack I increases with the rise of water table positively during the monsoon season, and the crack width waves slightly while the water level is almost static; the same phenomenon happens to the crack II. Therefore, the variation in crack widths is controlled by changes of water levels. As shown by the creep lines indicated both in Fig. 6a and b, the minimum widths of cracks I and II tend to increase year by year, and these values are considerably affected by the amount of rainfall, indicating that the upper part of body I and body II tends to slide outward gradually.
As shown in Fig. 7, plotted with data in Table 3, the absolute width variations in cracks I and II are both approximately 1 m from July to August 2017 (in which the monthly rainfall amount is greater than 250 mm). During the dry season, the crack width narrows with the decrease in the monthly rainfall, and the minimum opening widths of cracks I and II appeared in the months of January during the monitoring period.
The above-mentioned monitoring data show that the opening widths of cracks I and II and the potential stability of the Wobaoshi landslide are closely related with the variation in water levels in the cracks. Furthermore, these monitoring data should be utilized to assess the future sliding tendency of the Wobaoshi landslide so as to take some proper prevention countermeasures. Some typical geomechanical models for translational plate landslides have been established and applied in some cases successfully (Fan, 2007; Xu et al., 2010). In this research, because of the slightly different landslide geometry, one new geomechanical model should be created to conduct the stability analysis and simulate the failure mode and processes.
4.1 Model establishment and stability calculation
Regarding the characteristics of the Wobaoshi landslide, the surface soil layer can be ignored during the establishment of the geomechanical model, and a typical section of plate-shaped bodies I and II of the Wobaoshi landslide was selected, as shown in Fig. 8. A static geomechanical model of the plate-shaped rock bodies is established by using the limit equilibrium method. The basic assumptions of the limit equilibrium method are the plastic behavior for soil mass and validity of the Mohr–Coulomb failure criterion (Vardoulakis, 1983), and a kinematically feasible sliding surface is assumed to define the mechanism of failure. Besides, the ideal elastic–plastic model in the stress–strain state is selected for stability analysis based on associated flow rules (Darve and Vardoulakis, 2004; Labuz and Zang, 2012).
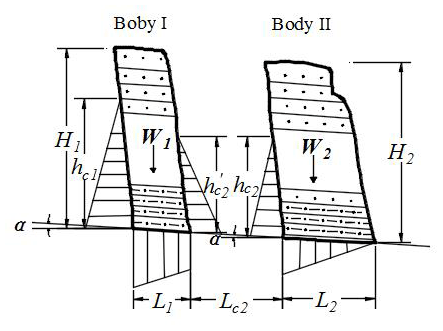
As indicated in Fig. 8, α denotes the dip angle of the sliding surface, and are the heights of the water levels in cracks I and II, L1 and L2 are the widths of bodies I and II, is the distance between bodies I and II, H1 and H2 are the heights of bodies I and II, respectively, and W1 and W2 are the weights of bodies I and II per unit. The stability analysis was commenced from the outer body II; subsequently, that of the inner body I is analyzed.
According to the relation between K, the stability coefficient of the main body, and hc, the height of the water level, the stability coefficient of body II, K2, can be obtained as follows when considering the internal cohesive strength of the sliding surface:
Here, c is the internal cohesion of the sliding surface, γr is the unit weight of the saturated sandstone, γw is the unit weight of water, and . In order to obtain the critical failure height of water level, K2 is set to 1; i.e., body II is set in a critical sliding state. Equation (2) is derived from Eq. (1) and can be used to calculate the critical water level of body II when K2 is set to 1:
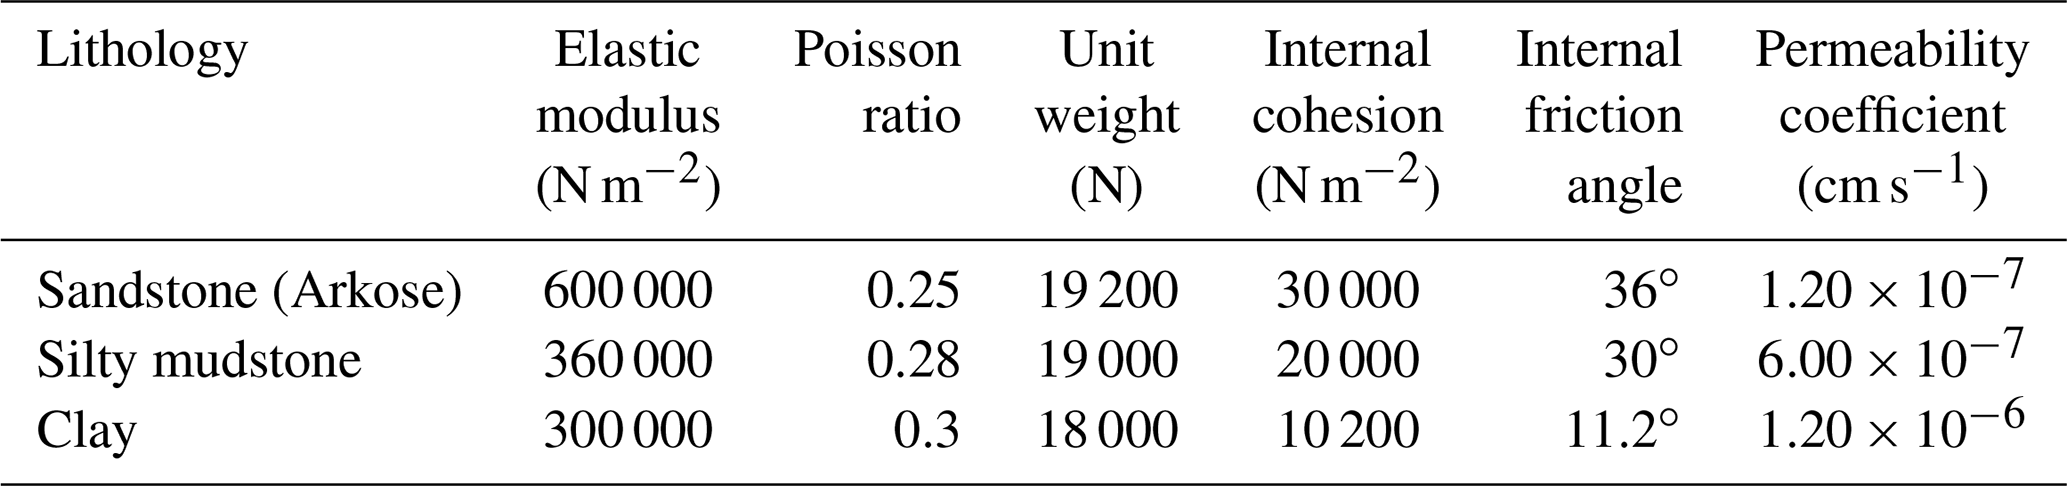
According to the experimental data obtained from the triaxial test of rock cores extracted from the sand–mudstone contact surface of the Wobaoshi landslide, θ, the internal friction angle of the sliding surface, is 11.2∘; c, the internal cohesion of the sliding surface, is 10.2 kPa; and γr, the unit weight of saturated sandstone, is 19.2 kN m−3. According to the cross section of the Wobaoshi landslide (Fig. 2), H=35 m, L=16 m, and α=6∘. All the values are substituted into Eq. (2), so m.
Table 3The measured accumulated water-level data of the main bodies.
Based on the stability analysis of body II, using Eqs. (1) and (2), the stability coefficient K1 of the inner layer of body I can be obtained using Eq. (3). In addition, and m; therefore, m:
Similarly, K1 is set to 1; for sliding body I, H1=38 m, L1=12 m, α=6∘, and m; therefore, the critical water level of body I can be calculated using Eq. (3) and m.
The above calculation results indicate that the water pressure in cracks I and II will drive the two plate-shaped bodies to creep slightly when the accumulated water level reaches the critical height, i.e., when m and m.
The water-level-monitoring data from cracks I and II can be used to verify the critical height, calculated by Eq. (2). In order to achieve this goal, two parameters, the opening widths of cracks and actual water level, are adopted to analyze the slipping process of bodies I and II. The two parameters can be calculated with the monitoring data in Table 1, the processing methods are described in Table 3, and all the processed data are listed in Table 3. The relationship between the sudden opening-width increase and the rise of the actual water level in cracks I and II is demonstrated in Fig. 9, plotted with data in Table 3.
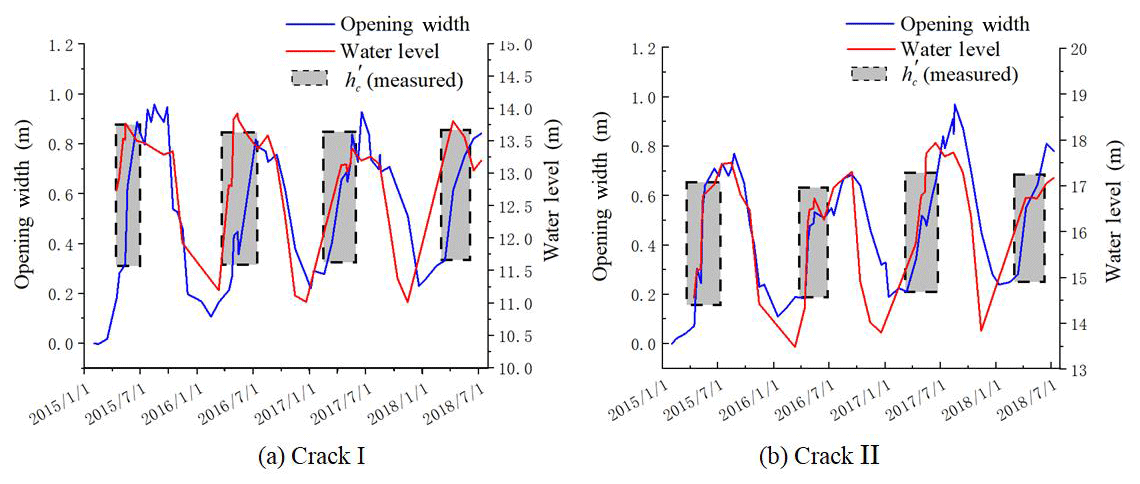
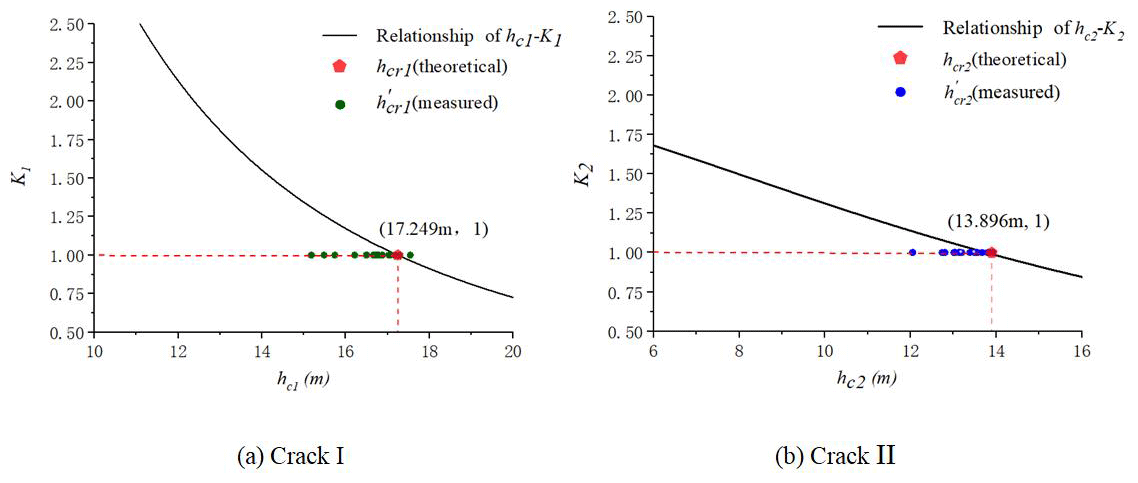
The dotted boxes in Fig. 9 denote the fact that when the accumulated water level approaches the critical water level, , the water pressure in cracks I and II, can make cracks open much wider and cause the main bodies to creep. The measured in Fig. 9 can be utilized to verify the relation between the actual water level, hc, and the stability coefficients of the bodies, K1 and K2, obtained using Eqs. (1) and (3), respectively, which are also depicted in Fig. 10.
In Fig. 10, the curves of the and represent Eqs. (1) and (3), respectively. The values of (measured) in Fig. 10 denote that most measured actual water levels are not higher than the theoretically calculated values. The monitoring data from the Wobaoshi landslide show that when , the measured value, almost approaches hcr, the theoretical value, water pressure in cracks I and II can cause the main bodies to creep and incline outward and result in wider upper opening of cracks I and II.
4.2 Numerical simulation of the plate-shaped main bodies
Numerical simulation and calculations were performed with respect to the main bodies using the MIDAS GTS NX geotechnical finite-element software. First, the 1:1 main body model presented in Fig. 8 was introduced into the aforementioned software, and the mechanical parameters of the main body model, i.e., the elastic modulus, Poisson's ratio, gravity internal cohesion, and the friction angle, were defined as shown in Table 4. The left and right boundaries were located at a distance of approximately 30 m from bodies I and II, respectively, and the lower boundary was located at sea level to eliminate the boundary effect. A plane strain quadrilateral–triangle mixing element was considered, and the entire model is divided into 13 775 elements and 14 026 nodes. Here, we constrained the vertical and horizontal displacement of its bottom boundary, and the left and right boundary conditions were established to constrain the horizontal displacement. The model used steady-state seepage calculation, and the water levels at the left and right boundaries were 342 and 275 m, respectively. The boundary conditions were set as follows.
-
In case of the displacement boundary, the left and right boundaries constrained the displacement in the X direction; i.e., TX=0. In case of the bottom boundary, the displacements in the X and Y directions in Fig. 11 were constrained; i.e., .
-
In case of the seepage conditions, the water levels at the left and right boundaries were set to 342 and 275 m, respectively.
The typical accumulated water-level data of the four cycles obtained from 2015 to 2018 with respect to cracks I and II (presented in Table 3 and Fig. 9) were introduced into the finite-element model and selected for a typical cycle change period, presented in Table 5, followed by numerical calculations to obtain the typical deformation and displacement states of the plate-shaped bodies during the rainy and dry seasons, as shown in Fig. 11.
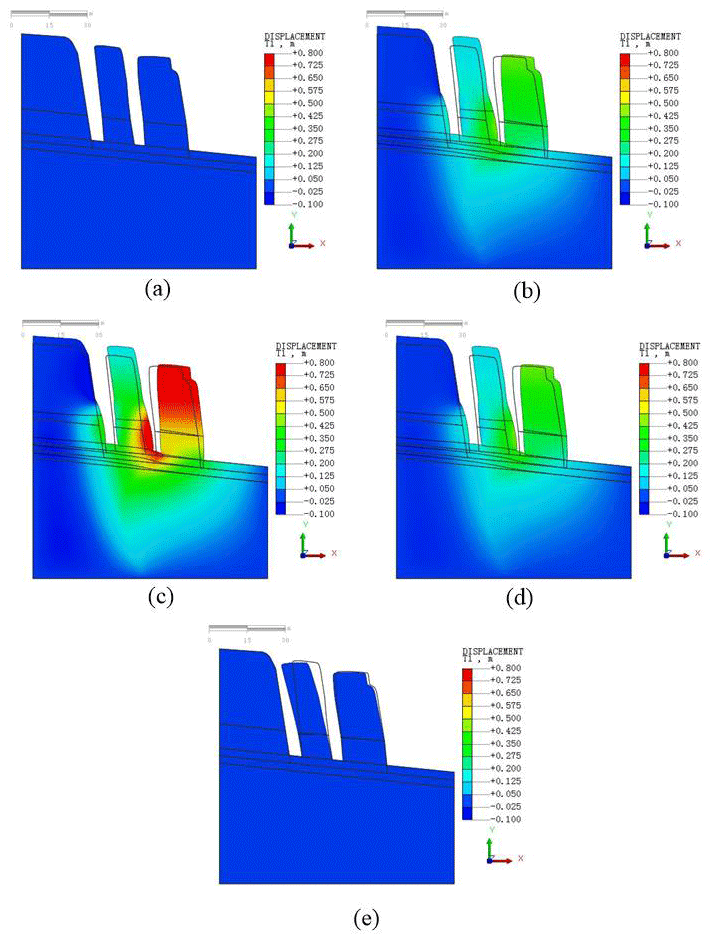
Figure 11Example of finite-element simulation and numerical calculation: (a) the initial state (step 0), (b) tilt and slide, which occurs with an increase in accumulated water level (step 1), (c) bodies slide to the maximum state (step 2), (d) bodies tilt and slide when the accumulated water level decreases (step 3), (e) bodies tilt backward and stop creeping when the water level decreases to original values (step 4).
Table 5Loading steps of the water level in cracks I and II in finite-element model.

The initial displacement state in Fig. 11a is set to zero for performing the following analysis. Figure 11b shows that bodies I and II deform horizontally along the sliding surface under the combined effect of water pressure and seepage. In Fig. 11c, the bodies slide to the maximum distance, where the maximum distance of body II is 0.945 m, which is approximately similar to the value obtained in the monitoring data. In Fig. 11d and e, bodies I and II exhibit the same tendency of tilting and a stop in creeping, owing to the decrease in the water level during the dry season. In Fig. 11e the maximum horizontal displacement is m, which implies that the maximum tilting value of body I is consistent with the measured opening widths of crack I in Table 3. Therefore, the calculation results obtained via the numerical simulation can corroborate the above-mentioned geomechanical model and landslide monitoring data.
The deformation or sliding movement of the nearly horizontal bedrock slope is almost impossible according to the traditional theory of a granular equilibrium limit, and the likelihood of occurrence of a landslide is minimal. However, this type of translational landslides of special structure was discovered often in the Qinba–Longnan mountainous area during the local geological-hazard investigation. Therefore, the characteristics and deformation of the plate-shaped landslide should be taken into account during the investigation and risk assessment of geological hazards due to the hidden dangers associated with the local precipitation conditions. The deformation and failure mode should be analyzed and discussed in order to obtain appropriate monitoring methods for this type of translational landslide.
5.1 Deformation and failure mode of the Wobaoshi landslide
The monitoring results of the Wobaoshi landslide can be used to validate the rainfall-induced failure mode of the translational landslide (Zhang et al., 1994). The deformation and failure mode for the Wobaoshi landslide were obtained through field monitoring data, geomechanical model analysis, and numerical simulation. Based on the above-mentioned analysis, a schematic drawing of the deformation and failure mode for the Wobaoshi landslide was created, as shown in Fig. 12. In Fig. 12b, the large amount of rainfall during the monsoon season causes cracks I and II to become accumulated with water; when the accumulated water level reaches the critical height, the landslide begins to creep, and cracks I and II open the most. The increased water pressure positively affects the creep initiation of the outermost body (Fan, 2007). Regarding the monitoring data, the accumulated water pressure can drive cracks I and II to open up to by about 1 m, and the consequent gradual creep results in the uplift of residential houses and highways on its leading edge.
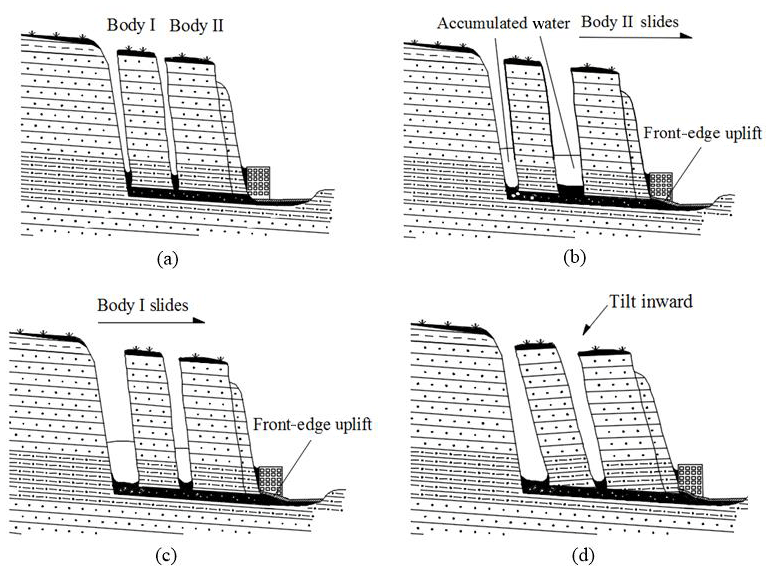
Figure 12Schematic drawing of the deformation and failure mode of the Wobaoshi landslide: (a) the initial state of bodies I and II, (b) body II sliding firstly in rainy season, (c) body I sliding after body II, and (d) bodies I and II tilting inward in dry season.
For the arrival of rainy season, the plate-shaped body II begins to slide firstly (Fig. 12b) and the water pressure balance in cracks is destabilized; such a situation causes the sliding of body I (Fig. 12c). The failure mode of the Wobaoshi landslide is characterized by the gradual sequential creep from the outer part to the inner part.
As shown in Fig. 12d, the bodies are tilted toward the crown of landslide because of the lower water level and their own weights when there is less rainfall during the dry season, causing the body to fall backward (contrary to the slope inclination). The monitoring data of the Wobaoshi landslide and numerical simulation of the plate-shaped body can be used to verify the deformation and failure mode of the plate-shaped landslide after its occurrence (Xu et al., 2010). As years pass, the cracks at the bottom of the plate-shaped body will increase in size, and the inclination of the body will become severe, which will pose a high risk to the houses and roads located toward the front edge of the landslide.
5.2 Determination of the critical accumulated water level hcr
The stability calculation of the geomechanical model of the body is described in Sect. 3.1, i.e., determination of the critical water height in the crack, hcr, and calculation of the body's stability coefficient, K, which can be determined theoretically by calculating the stratum inclination, shape, weight, and physical properties (unit weight of the saturated volume, γr, internal cohesion of the sliding surface, c, and internal friction angle of the sliding surface, θ) based on the limit equilibrium theory (Lin et al., 2018). Therefore, the stability coefficient of the landslide is observed to exponentially decrease with an increase in the filled water height of the crown crack (Fan et al., 2008; Xu et al., 2010).
The internal friction angle, θ=11.2∘, is considerably low for clay and seems unrealistic. This may be because the clay layer is severely weathered, resulting in a considerably small internal friction angle. Generally, the dilatancy effect obtained via the associated flow law is considerably larger than the actual observation, especially in the case of lateral confinement (Tschuchnigg et al., 2015a). However, in the case of slope stability analysis, lateral infinity is mostly not considered, and the dilatancy effect is not significant (Griffiths and Fenton, 2004). Therefore, it is reasonable to set the dilatancy angle to be equal to the internal friction angle.
With respect to the critical water level, hcr, in Eq. (2), we can observe that the measured critical water level, , is close to the theoretical critical water level, hcr, validating the calculation equation of hcr in Eq. (2) by comparing with the measured data. Additionally, the measured data in Table 3 are slightly less than the theoretical calculation value. Thus, when compared with the equation to calculate the critical water height proposed by Zhang et al. (1994) and the physical simulation experiment conducted by Fan et al. (2008), the monitoring case of the Wobaoshi landslide shows that for , the measured data are mostly lower than the theoretical calculated value, hcr, which can destabilize the main body. This instability may be attributed to the fact that the actual cohesion value c′ of the contact surface of sandstone and mudstone is smaller than the cohesive force value c of the sliding surface in Eq. (2) during the creep state of the landslide for a long duration or that the frictional angle of the sliding surface, θ, changes slightly. According to Eq. (2), if , means that when , the measured value, almost approaches hcr, the theoretical value, this condition will cause the main bodies to be unstable and result in wider upper opening of the cracks.
5.3 Optimization methods of landslide monitoring
In this study, we propose a long-term monitoring method containing more parameters based on the characteristics of the plate-shaped translational landslides in accordance with the existing field monitoring experience as well as deformation and failure mode exploration.
First, long-term monitoring should be conducted to obtain sufficient monitoring data, mainly including obtaining the accumulated water level in cracks, amount of rainfall, and displacement data on the front edge of the landslide during monsoon as well as focusing on the change of the overall inclination of the body during the dry season. The inclination angle α relative to the sliding surface also changes while the body slides. Thus, an inclination measuring device, a three-axis accelerometer and electronic compass, should be installed on the main body to verify the theoretical model of the deformation mode of the plate-shaped body during the dry season, as indicated in Fig. 12c. Furthermore, a sensitivity analysis of the various parameters, affecting the stability coefficient K of the main body (including the accumulated water level in cracks, internal cohesive force in saturated water, internal friction angle of the sliding surface, and inclination angle of the body), should be conducted based on the monitoring data. Therefore, a detailed analysis and investigation of the deformation and failure mode of the plate-shaped landslide would be beneficial and improve the success rate of landslide warning.
By considering the Wobaoshi landslide as an example, we use field surveys, long-term monitoring techniques, geomechanical model analysis, and numerical simulation to analyze the instability conditions and failure characteristics of a special type of translational landslide. The research findings are beneficial to the stability analysis and evaluation of this type of landslide. Some specific monitoring methods are proposed to enrich practical research on translational landslides. Therefore, these research findings are of reference significance for the rainfall-induced translational landslides in this area. Based on the above-mentioned analysis and discussions, the following conclusions can be drawn.
-
The field monitoring scheme and instrument layout for the Wobaoshi landslide worked very well, and the monitoring work lasted for about 3.5 years. The key monitoring parameters, including rainfall, opening widths of cracks, and water pressure in the crack, are useful for community warning and scientific analysis. According to the qualified monitoring data, the opening widths of cracks I and II, and the gradual creep of sliding bodies, are controlled by the local precipitation. Therefore, control of the accumulated water level in the cracks among sliding bodies is very crucial for alleviating local risks of geological hazards. At the same time, an optimized monitoring methodology, comprehensively considering the water pressure, rainfall, displacement, and inclination angle, should be adopted for future hazard-monitoring engineering.
-
A new geomechanical model, describing the relation between the stability coefficient of the multistage body K and the water level h, was established with reference to the mechanical model of the plate-shaped bodies. The critical water level hcr, which causes the instability of the multistage bodies, was calculated and verified based on the long-term monitoring data. The new geomechanical model is of reference significance for the rainfall-induced translational landslides in other areas.
-
Based on the integrated analysis and discussion, we put forward the deformation and failure mode for the Wobaoshi landslide, one plate-shaped landslide. That is to say, the main bodies are considered to slide horizontally along the contact surface of the bottom contact weak layer between sandstone and mudstone layers, driven by the water pressure in the cracks and the seepage effect during the monsoon season. During the dry season, the water pressure decreases to almost zero; the main bodies will be inclined toward the crown of landslide, owing to the weights.
The data used to support the findings of this study are available from the corresponding author upon request.
All authors contributed to this article, with the order of the authors' names reflecting the size of their contribution. YL and CW discussed and wrote the original draft, YL and PW supervised the field work and collected the monitoring data, GG and ZH built the geomechanical model, GG and YL calculated and analyzed data, and PW and QJ made the figures.
The authors declare that they have no conflict of interest.
We thank Long Chen at the Institute of Exploration Technology of CAGS for providing landslide monitoring data. This research was supported by the National Natural Science Foundation of China (grant no. 41804089), Project of Observation Instrument Development for Integrated Geophysical Field of China Mainland (grant no. Y201802), and CGS of the China Geological Survey Project (grant nos. 1212011220169 and 12120113011100).
This research has been supported by the National Natural Science Foundation of China (grant no. 41804089), the Project of Observation Instrument Development for Integrated Geophysical Field of China Mainland (grant no. Y201802), and the CGS of the China Geological Survey Project (grant nos. 1212011220169 and 12120113011100).
This paper was edited by Paola Reichenbach and reviewed by three anonymous referees.
Ayalew, L., Yamagishi, H., Marui, H., and Kanno, T.: Landslides in Sado Island of Japan: Part I. Case studies, monitoring techniques and environmental considerations, Eng. Geol., 81, 419–431, https://doi.org/10.1016/j.enggeo.2005.08.005, 2005.
Barlow, J., Martin, Y., and Franklin, S. E.: Detecting translational landslide scars using segmentation of Landsat ETM+ and DEM data in the northern Cascade Mountains, British Columbia, Can. J. Remote Sens., 29, 510–517, https://doi.org/10.5589/m03-018, 2003.
Bellanova, J., Calamita, G., Giocoli, A., Luongo, R., and Piscitelli, S.: Electrical resistivity imaging for the characterization of the Montaguto landslide (southern Italy), Eng. Geol., 243, 272–281, https://doi.org/10.1016/j.enggeo.2018.07.014, 2018.
CAGHP – China Association of Geological Hazard Prevention: Emergency Monitoring and Early Warning Technology Guide of Sudden Geological Disaster, T/CAGHP 023-2018, Beijing, China, 2018.
Chen, L., Liu, Y., and Feng, X.: The investigation report of Wobaoshi landslide, Sanhui Town, Enyang District, Bazhong City, Open File Rep. 57-75, The Institute of Exploration Technology of CAGS, Chengdu, 2015.
Cruden, D. M. and Varnes, D. J.: Landslide Types and Processes, Special Report, Transportation Research Board, National Academy of Sciences, Canada, 36–75, 1996.
Darve, F. and Vardoulakis, I.: Degradations and Instabilities in Geomaterials, Springer, Vienna, Austria, https://doi.org/10.1007/978-3-7091-2768-1, 2004.
Dong, S., Hu, J., Shi, W., Zhang, Z., and Liu, G.: Jurassic Superposed Folding and Jurassic Foreland in the Daba Mountain, Central China, Acta Geosci. Sin., 27, 403–410, https://doi.org/10.3321/j.issn:1006-3021.2006.05.003, 2006.
Emelyanova II, E.: The basic rule of landslide movement, Chongqing Publishing House, Chongqing, China, 1986.
Fan, X.: Mechanism and remediation measures for translational landslide, MS Thesis, Chengdu University of Technology, Chengdu, 2007.
Fan, X., Xu, Q., Zhang, Z., Meng, D., and Tang, R.: Study of genetic mechanism of translational landslide, Chin. J. Rock Mech. Eng., 27, 3753–3759, https://doi.org/10.3321/j.issn:1000-6915.2008.z2.067, 2008.
Fan, X., Xu, Q., Zhang, Z., Meng, D., and Tang, R.: The genetic mechanism of a translational landslide, Bull. Eng. Geol. Environ., 68, 231–244, https://doi.org/10.1007/s10064-009-0194-1, 2009.
Floris, M. and Bozzano, F.: Evaluation of landslide reactivation: A modified rainfall threshold model based on historical records of rainfall and landslides, Geomorphology, 94, 40–57, https://doi.org/10.1016/j.geomorph.2007.04.009, 2008.
Griffiths, D. V. and Fenton, G. A.: Probabilistic slope stability analysis by finite elements, J. Geotech. Geoenviron. Eng., 130, 507–518, https://doi.org/10.1061/(ASCE)1090-0241(2004), 2004.
Hu, H. and Zhao, X.: Studies on rockmass structure in slope of red beds in China, Chin. J. Geotech. Eng., 28, 689–694, https://doi.org/10.3321/j.issn:1000-4548.2006.06.003, 2006.
Hussin, H., Zumpano, V., Sterlacchini, S., Reichenbach, P., Bãlteanu, D., Micu, M., Bordogna, G., and Cugini, M.: Comparing the predictive capability of landslide susceptibility models in three different study areas using the Weights of Evidence technique, in: EGU General Assembly, 7–12 April 2013, Vienna, Austria, 2013.
Kong, J. and Chen, Z.: The translational landslide in red stratum located in east of Sichuan in July, 1989, China Railway Publishing House, Beijing, 1989.
Labuz, J. F. and Zang, A.: Mohr–Coulomb Failure Criterion, Rock Mech. Rock Eng., 45, 975–979, https://doi.org/10.1007/s00603-012-0281-7, 2012.
Lin, J., Yang, W., and Bao, C.: Progressive collapse mechanism of hybrid structures with different vertical stiffness, China Earthq. Eng. J., 40, 713–720, https://doi.org/10.3969/j.issn.1000-0844.2018.04.713, 2018.
Liu, Y. and Wang, J.: The research and application of landslide surface crack monitoring method based on laser ranging mode, Environ. Earth Sci. Res. J., 2, 19–24, 2015.
Martin, Y. E. and Franklin, S. E.: Classification of soil- and bedrock-dominated landslides in British Columbia using segmentation of satellite imagery and DEM data, Int. J. Remote Sens., 26, 1505–1509, https://doi.org/10.1080/01431160412331330202, 2005.
Matjaž, M., Matja, C., and Mitja, B.: Hydrologic conditions responsible for triggering the Stože landslide, Slovenia, Eng. Geol., 73, 193–213, https://doi.org/10.1016/j.enggeo.2004.01.011, 2004.
Ministry of Land and Resources of the PRC: Specification of Design and Construction for Landslide Stabilization, DZ/T 0219-2006, Beijing, China, 2006.
Sergio, D. N., Lourenco, K. S., and Hiroshi, F.: Failure process and hydrologic response of a two layer physical model: Implications for rainfall-induced landslides, Geomorphology, 73, 115–130, https://doi.org/10.1016/j.geomorph.2005.06.004, 2006.
Teixeira, M., Bateira, C., and Marques, F.: Physically based shallow translational landslide susceptibility analysis in Tibo catchment, NW of Portugal, Landslides, 12, 455–468, https://doi.org/10.1007/s10346-014-0494-9, 2015.
Tschuchnigg, F., Schweiger, H. F., and Sloan, S. W.: Slope stability analysis by means of finite element limit analysis and finite element strength reduction techniques. Part I: Numerical studies considering non-associated plasticity, Comput. Geotech., 70, 178–189, https://doi.org/10.1016/j.compgeo.2015.07.019, 2015a.
Vardoulakis, I.: Rigid granular plasticity model and bifurcation in the triaxial test, Acta Mechanica, 49, 57–79, https://doi.org/10.1007/BF01181755, 1983.
Wang, L. and Zhang, Z.: The mechanical patterns of the deformation in rock slope, Geological Publishing House, Beijing, China, 1985.
Xu, Q. and Zeng, Y.: Research on acceleration variation characteristics of creep landslide and early-warning prediction indicator of critical sliding, Chin. J. Rock Mech. Eng., 28, 1099–1106, https://doi.org/10.1002/9780470611807.ch2, 2009.
Xu, Q., Fan, X., Li, Y., and Zhang, S.: Formation condition, genetic mechanism and treatment measures of plate-shaped landslide, Chin. J. Rock Mech. Eng., 29, 242–250, https://doi.org/10.6052/1000-0992-1984-122, 2010.
Yin, K., Chen, L., and Zhang, G.: Regional Landslide Hazard Warning and Risk Assessment, Earth Sci. Front., 14, 85–93, https://doi.org/10.1016/S1872-5791(08)60005-6, 2007.
Zhang, Z., Wang, S., and Wang, L.: The analytical principle on engineering geology, Geological Publishing House, Beijing, China, 1994.
Zhao, Q., Shang, Y., and Zhi, M.: Modification of the start-up criterion of translational glidiing landslide, J. Jilin Univers. (Earth Sci. Edn.), 44, 596–602, https://doi.org/10.13278/j.cnki.jjuese.201402204, 2014.