the Creative Commons Attribution 4.0 License.
the Creative Commons Attribution 4.0 License.
 | 20 May 2020
Geo-climatic hazards in the eastern subtropical Andes: distribution, climate drivers and trends
Iván Vergara
Stella M. Moreiras
Diego Araneo
René Garreaud
Detecting and understanding historical changes in the frequency of geo-climatic hazards (G-CHs) is crucial for the quantification of current hazards and project them into the future. Here we focus in the eastern subtropical Andes (32–33∘ S), using meteorological data and a century-long inventory of 553 G-CHs triggered by rainfall or snowfall. We first analyse their spatio-temporal distributions and the role of climate variability in the year-to-year changes in the number of days per season with G-CHs. Precipitation is positively correlated with the number of G-CHs across the region and year-round; mean temperature is negatively correlated with snowfall-driven hazards in the western (higher) half of the study region during winter and with rainfall-driven hazards in the eastern zone during summer. The trends of the G-CH frequency since the mid-20th century were calculated, paying attention to their non-systematic monitoring. The G-CH series for the different triggers, zones and seasons were generally stationary. Nonetheless, there is a small positive trend in rainfall-driven G-CHs in the eastern zone during summer, congruent with a rainfall increase there. We also found a decrease in snowfall-driven G-CHs in the western zone from the late 1990s onwards, most likely due to a reduction in winter precipitation rather than to an increase in temperature.


Geo-climatic hazards are natural phenomena that occur by a combination of atmospheric (e.g. precipitation, temperature, wind) and terrain (geotechnical and morphometric properties) factors. This definition includes landslides, snow avalanches and phenomena of glacial (surges, glacier lake outburst floods – GLOFs, ice-dammed lake outburst floods – IDLOFs) and fluvial (floods, lateral erosions, avulsions) origin. All of them constitute an important risk along the Argentinean–Chilean Andes that runs for nearly 4000 km along the western part of South America, especially in its central portion (32–33∘ S), which has the highest erosion rates (Carretier et al., 2013), reaches more 5 km in elevation, and where geo-climatic hazards have caused considerable human and economic losses, mostly to the international traffic crossing this sector (e.g. Sepúlveda and Moreiras, 2013; Moreiras et al., 2018).
There is some work about historical and projected trends in the frequency of regional geo-climatic hazards (G-CHs; e.g. Moreiras, 2006; Moreiras and Vergara Dal Pont, 2017), but a quantitative analysis has not yet been carried out in order to attribute their origin. A first issue to elucidate is the origin of what seems to be an increase in the number of G-CHs triggered by rainfall since the mid-20th century (Moreiras and Vergara Dal Pont, 2017), which could be due to an actual change in precipitation or to an increase in monitoring efforts during the last decades. A second question is on the origin of a decrease in the frequency of G-CHs triggered by snowfall since the end of the 1990s (Moreiras and Vergara Dal Pont, 2017). This could be due to a decrease in winter precipitation, an increase in the freezing level during these hazards due to the ongoing regional warming or both (Masiokas et al., 2006; Vuille et al., 2015).
The purpose of this research is to assess the significance of the G-CH trends and investigate their causes. To attribute these trends, we began by improving our general understanding of regional G-CHs, analysing their distributions in time and space and establishing their relationship with different climate elements. This research took advantage of a long, updated record of G-CHs on the eastern side of the subtropical Andes, with daily resolution and precise spatial location along a portion of an international, highly transited highway connecting Chile and Argentina. On the other hand, meteorological information is rather poor in this area, with few surface stations and an absence of other measurement systems (radar, local radiosondes, etc.).
The paper is organized as follows. We begin by describing the physical characteristics of the area, the assembly of the G-CH record and its usage. In the “Results” section we present the spatio-temporal characterization of the G-CHs, followed by their association with the local climate and the temporary changes of the climatic variables and the G-CHs. In the “Discussion” section, the results obtained are analysed, a future research direction is proposed and a conceptual evaluation of the future geo-climatic hazard of the region is carried out. Finally, in the “Conclusions” section, the most important results are described.
1.1 Study area and geographical setting
At subtropical latitudes (32–33∘ S) the Andes cordillera separates central Chile (to the west) and western central Argentina (to the east), with the border approximately following the highest peaks of the range, which reach over 5 km a.s.l. in this sector (Fig. 1). Here, an international road and the ex-Trasandino railway link the cities of Los Andes (Chile) and Mendoza (Argentina). This is a major commercial and touristic route which has been in use since the 17th century, connecting the eastern and western side of the continent. G-CHs occur at both sides of the Andes (e.g. Sepúlveda and Moreiras, 2013; Sepúlveda et al., 2015), but here we focus on the eastern side because of the availability of a historical record taken in the Argentinean side of the road and railway, extending eastward from the border down to the plains near the city of Mendoza. This sector coincides with the middle and upper Mendoza River basin (Fig. 1a) and hosts more than 10 000 inhabitants. Anthropic changes in the landscape are negligible due to the absence of significant cultivated areas and the limited infrastructure. The National Route 7 currently has an average traffic of about 3000 vehicles per day (ONDaT, 2018), maintained throughout the year due to domestic travel and the daily opening of the international pass, except when large snowfalls or major G-CHs occur.
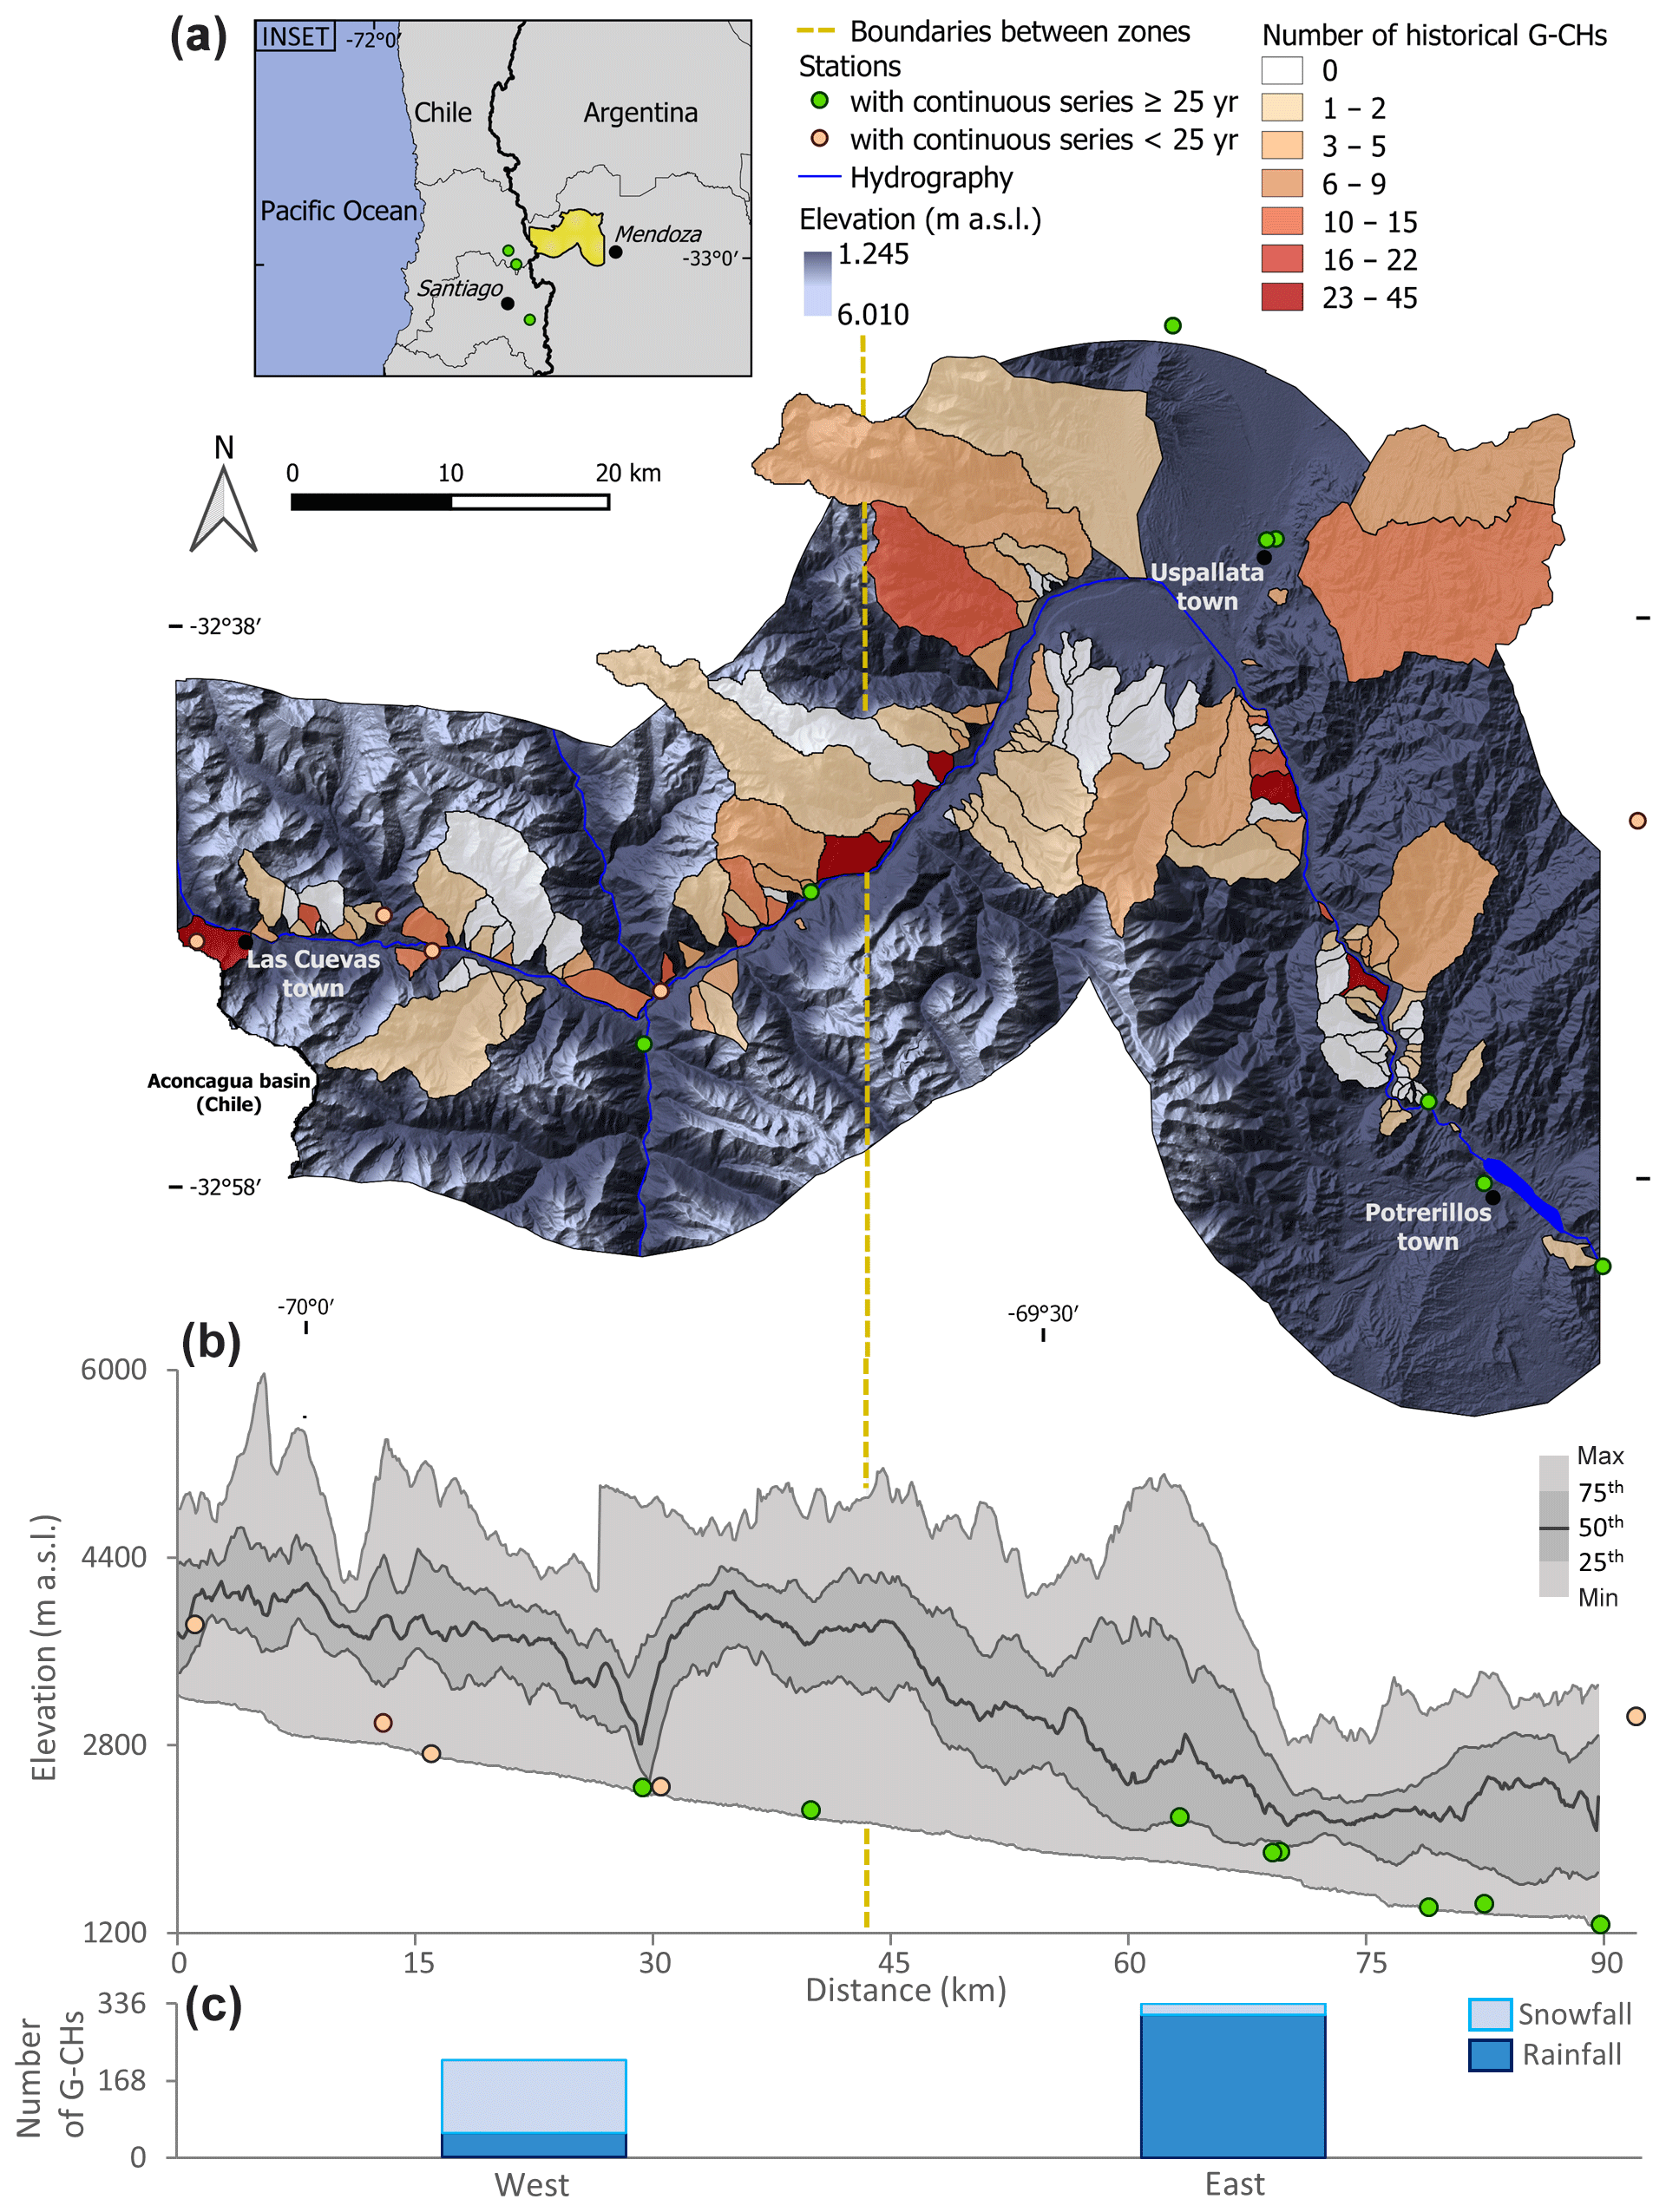
Figure 1Main features of the study area and G-CHs. (a) Location of the study area (inset) and number of G-CHs for each ravine, talus cone and rock wall monitored, superimposed on a topographic map. (b) Topographic profile along the Mendoza River. (c) G-CH number for each trigger and zone. The yellow line in (a) and (b) delimits zones W and E.
The study area has elevations from 1250 to 5970 m a.s.l. (when using a buffer of 15 km with respect to the Mendoza River that roughly encompassed all the terrain units studied; Fig. 1b). The lower limit of discontinuous permafrost is at approximately 3700 m a.s.l. (Trombotto et al., 1997). The area covered by perennial snow and glaciers (including inactive rock glaciers) is 103 km2 (2.7 % of the total area; IANIGLA, 2018). The study area encompasses the morphotectonic units Cordillera Principal, Cordillera Frontal and Precordillera (Ramos, 1996), so the geotechnical, geological and morphometric characteristics vary widely. The first morphotectonic units are strongly altered by Quaternary glacial activity, with U-shaped valleys that have highly steep walls.
The vegetation types are Andean steppe and Monte scrubland (Paruelo et al., 2001), and their low density favours the triggering of landslides and snow avalanches. In the ravine headwaters there is a large amount of unconsolidated material generated by the seismic activity, the latest glaciations and the current cryoclasticism. Considering this factor and the dry climate of the region (described below), it is likely that the frequency and magnitude of debris flows are limited by the availability of water and not by debris supply. Debris flows are triggered by shallow failure planes and/or in-channel entrainment (Mergili et al., 2012), with little or no influence of the edaphic humidity generated by previous rainfall (Vergara Dal Pont et al., 2018). Jointed and partially weathered rock walls with slopes greater than 30∘ are prone to fall occurrence (Moreiras, 2005b). Snow avalanches are usually triggered by snowfall (sudden overload), although they may occur some weeks afterwards due to earthquakes, rains, or an increase in temperature and radiation.
Through photointerpretation and field surveys, Moreiras (2009) mapped a total of 869 landslides in the middle and upper Mendoza River basin. Based on that work, the abundance of the different types of landslides was established: debris flows – 79 %, falls – 9 %, rotational and translational slides – 7 % – and complex landslides – 5 %. More recently, Moreiras et al. (2012) used historical sources to describe 72 landslides and snow avalanches in the upper Mendoza River basin in the period 1822–2010, allowing an identification of their triggering causal factors (henceforth triggers or drivers): total precipitation – 77 %, snowmelt – 14 % – and seismicity – 9 %. The most important conditioning factors of landslides in the middle Mendoza River basin are lithology and slope (Moreiras, 2005a).
1.2 Climate
The subtropical Andes, with its impressive altitude (>5000 m a.s.l.), continuity and nearly north–south orientation, acts as a barrier separating two distinct climate regimes (Garreaud et al., 2009; Viale et al., 2019). The western side of the Andes receives most of the precipitation during austral winter (May–September) due to the arrival of cold fronts and other disturbances moving from the Pacific Ocean (Falvey and Garreaud, 2007; Viale and Nuñez, 2011). On this side, frontal precipitation tends to be homogeneous (encompassing hundreds to thousands of kilometres) but tends to increase with altitude, causing a vertical gradient in accumulation from about 300 mm yr−1 in the Chilean lowlands to about 1000 mm yr−1 atop the Andes (e.g. Viale and Garreaud, 2015). The freezing level during winter storms is around 2500 m a.s.l. (Garreaud, 2013) so that a significant portion of the precipitation over the western Andes is in the form of snow. Although the strong westerly flow atop the Andes can spill over some snow towards its eastern side, the Argentinean sector receives most of the precipitation during austral summer (October to March; Viale and Garreaud, 2014) in connection with the southern edge of the South American monsoon (e.g. Vera et al., 2006). In sharp contrast with the western side, precipitation to the east has a convective nature, and its water source is ultimately the Atlantic Ocean. These precipitation systems usually have an extension of 10 km2 and intensities that can double those of the frontal systems (raw data of Vergara Dal Pont et al., 2018). The convection presents the maximum peak of probability during evening and early night and the minimum in the morning (Saluzzi, 1983).

Figure 2Mean annual cycles of selected variables. (a) Monthly mean standardized precipitation along a west–east transect. The vertical axis indicates the distance eastward from the Andes ridge. Diamonds indicate the stations' positions, vertical lines the seasonal division and horizontal line the longitudinal division. (b) Periods of prevailing precipitation by frontal systems in each zone. (c) Range of monthly mean standardized precipitation considering the stations in each zone. (d) Mean average standardized temperature in each zone. In (b–d) yellow (grey) lines refers to the W (E) zone.
In our study area (Fig. 1a), the western (wintertime frontal) and eastern (summertime convective) regimes have varying degrees of influence in the zonal direction (recall that the Andes axis is north–south-oriented, so moving in longitude, the terrain altitude changes rapidly). Of course, there is a continuous change in the nature and seasonality of precipitation across the region (e.g. Fig. 2a), but a division into W and E zones is useful for subsequent analyses. The mean elevations of W and E zones are 3740 and 2700 m a.s.l., respectively (Fig. 1b), and both have similar zonal lengths (between 43.6 and 46.1 km). The mean climate features were obtained by averaging the stations' data, available in each zone for the period 1993–2017 (Table 1). Because of the marked vertical gradients and the different features of valley sections where the stations are located, the monthly averages at each station were transformed into standardized anomalies before being averaged. The E, lower zone has a semi-arid climate with summer-dominated, convective precipitation (Araneo et al., 2011; Fig. 2c). The climate of the W, higher zone is of the tundra type (Sarricolea et al., 2016), with frontal precipitation concentrated during austral winter (Fig. 2b and c). Note that both sectors share the same annual cycle of temperature, with warm summers and cold winters (Fig. 2d).
Table 1Stations used and their main characteristics. The registration period does not consider interruptions. The stations without asterisks were used for trigger determination and statistical analysis, and those with one (two) asterisks were used only for trigger determination (statistical analysis).
The regional precipitation has a high interannual standard deviation, about 35 %–40 %, with respect to the annual average (Garreaud et al., 2009). The El Niño–Southern Oscillation (ENSO) is the major driver of these changes on the western side of the Andes, with a clear tendency for above-normal (below-normal) winter precipitation during El Niño (La Niña) years (see review in Garreaud et al., 2009). Indeed, in the study area there is a positive correlation between the ENSO and the number of landslides and snow avalanches (Moreiras, 2005b; Moreiras et al., 2012). The Pacific Decadal Oscillation (PDO) and the Antarctic Oscillation (AAO) also modulate Andean precipitation. The PDO increases precipitation during its positive phases, while AAO does so during its negative phase (e.g. Masiokas et al., 2006). These oscillations have a greater impact on the wintertime precipitation. El Niño (La Niña) years also tend to produce above-normal (below-normal) precipitation in the eastern half of our study region, although the ENSO impact on the monsoonal regime at subtropical latitudes is rather weak (e.g. Montecinos et al., 2000), and other large-scale modes also contribute to interannual variability in summer (e.g. Scian et al., 2006).
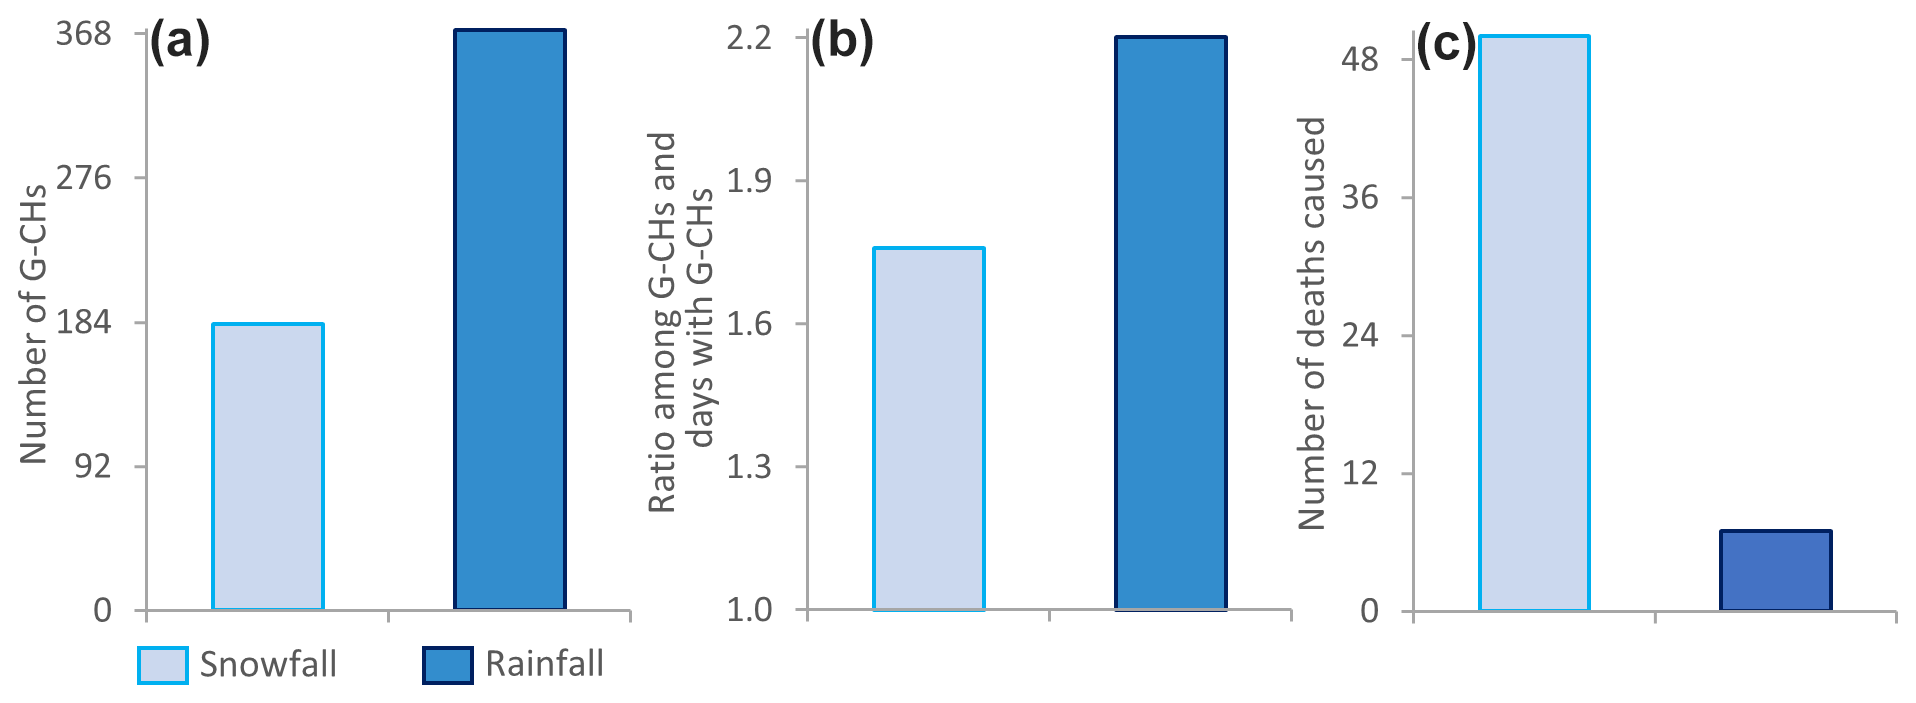
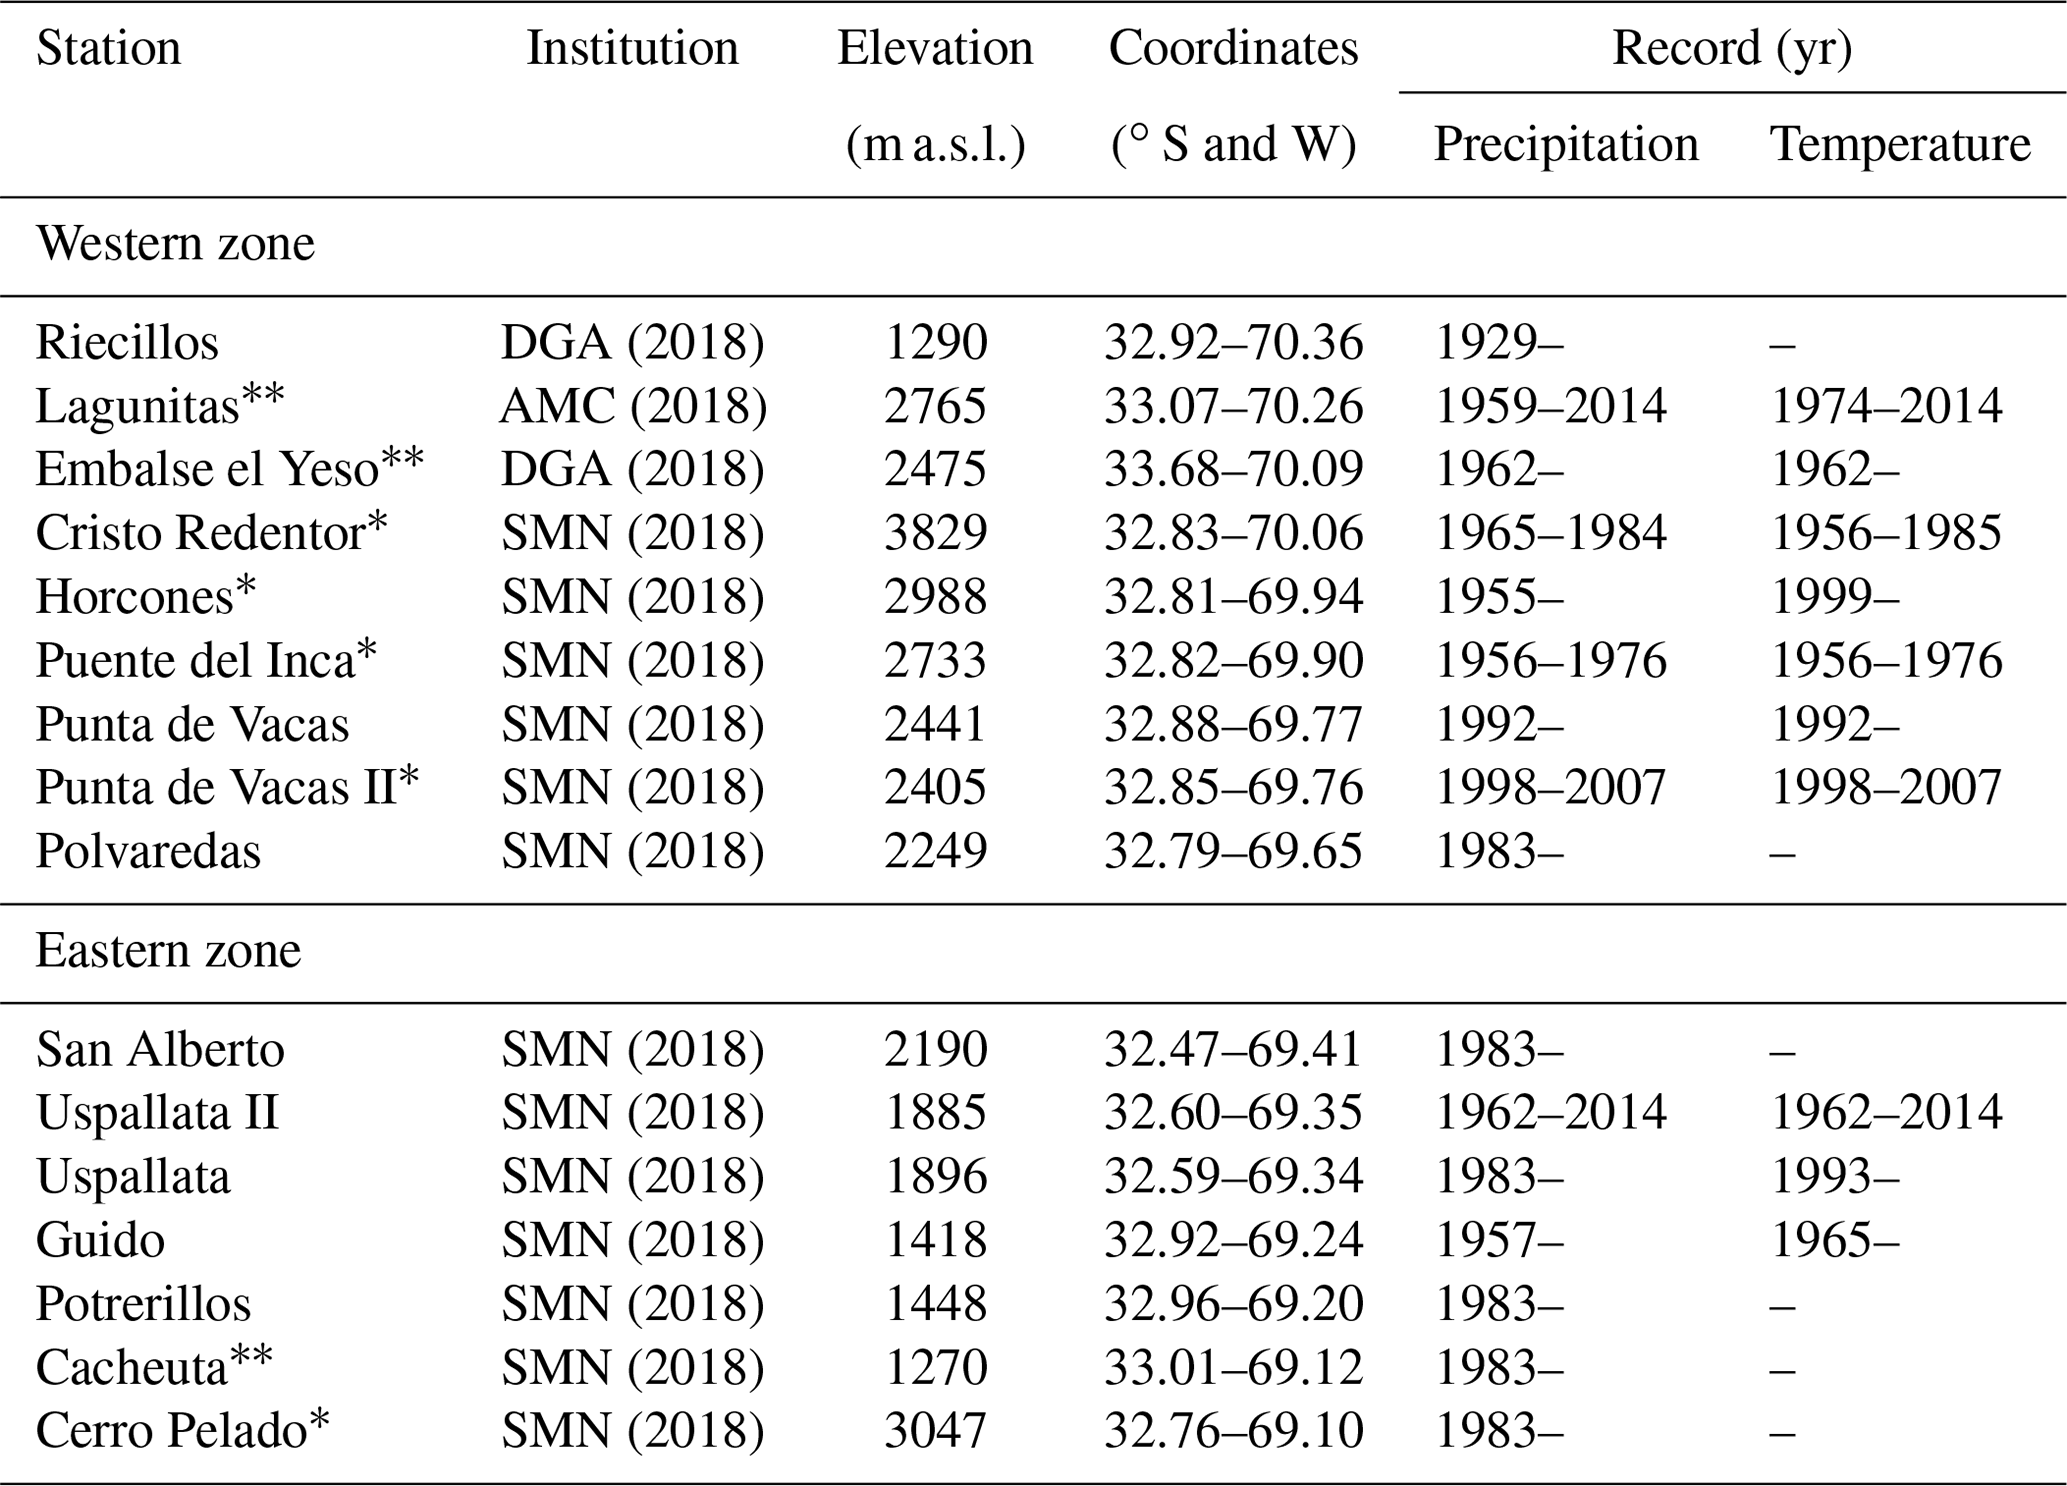
Figure 3Main statistics of the G-CH triggers considering the entire record. (a) Total number, (b) relationship between number of G-CHs and number of days with G-CHs, and (c) associated fatalities.
Our starting point for the present analysis is the historical record of landslides in the middle Mendoza River basin for the period 1790–2003 (Moreiras, 2006) as well as the landslide and snow avalanche inventory in the upper Mendoza River basin for the period 1822–2010 (Moreiras et al., 2012). The recorded landslides and snow avalanches are concentrated in ravines, talus cones and rock walls adjacent to the valleys' thalwegs of the Mendoza and Uspallata rivers, where the routes and the railway are located. These terrain units were drawn with hydrological tools of the SAGA software (version 2.3.2) and setting a minimum size of 0.2 km2 for its individualization. The landslides and snow avalanches were assigned to the different terrain units because the sources indicate either the name of the activated ravine or the kilometre of the route or the railway that was cut. For the 18th and 19th centuries, the record is mainly composed of travellers' notes, where the location and date of the hazards were usually indicated. For the 20th century, the record is mainly composed of articles from regional newspapers and written communication from railway and road companies. These sources indicate the date and position where the routes or the railway were blocked and sometimes also inform the trigger, time and description of the main deposit. For the 21st century, field surveys of scientists from the Argentine Institute of Nivology and Glaciology were added, so the record became more detailed and the number of landslides and snow avalanches increased considerably. In addition to this, we continue using regional newspapers (El Andino, Los Andes Online, MDZ, Los Andes, Diario UNO, El Sol) as well as printed communication from Argentinean and Chilean customs and communication from road institutions (National Highway Management and Provincial Highway Management).
For each landslide and snow avalanche in the historical record, the most probable trigger was inferred from the original sources (the reports indicate if there was rain, snow, earthquakes, etc.) or was established using in situ or satellite data. To decide on the occurrence of daily precipitation, we used 13 stations in the study area (Table 1), complemented by satellite estimates from the CMORPH daily product (Joyce et al., 2004; since December 2002). The freezing level in the days with landslides and/or snow avalanches was estimated using daily mean temperature data at eight surface stations (Table 1), from which the zero-isotherm altitude (ZIA) was calculated, employing a wet adiabatic gradient of 6 ∘C km−1. The freezing level was obtained by subtracting 125 m from the ZIA to account for the average distance that it takes for snow crystals to become liquid (Garreaud, 1992; White et al., 2010). Finally, to discard (or confirm) seismically driven hazards we employed seismicity reports (USGS, 2018). In general, the most difficult trigger to identify was the rainfall during summer due to the reduced spatial extent of the convective systems that occur during this season. For rainfall-driven landslides identified during summer we first discard the action of an earthquake or a rapid melting of snow and/or ice (Vergara Dal Pont et al., 2020) and then confirm the occurrence of rain in some of the gauging stations and/or CMORPH.
In total, 683 landslides and snow avalanches were collected for the period 1790–2017. Snowfall and rainfall are the only triggers that we study here; therefore, 59 landslides triggered by earthquakes (9 %), 16 landslides triggered by rapid melting of snow and/or ice within the active layer (2 %), and 55 landslides without an established trigger (8 %) were excluded. In turn, of the 553 G-CHs triggered by rainfall or snowfall (Fig. 3), 35 were discarded because it was not possible to recover the precise geographic location. Since in many G-CHs the magnitude was not available, we refrained from using this variable. The record included the types of G-CHs: flow (31 %; debris flow, mudflow, hyper-concentrated flow and debris avalanche), fall (33 %; rockfall and debris fall) and snow avalanche (20 %; Fig. 4). The remaining 16 % corresponds to landslides where the type of movement could not be determined. The flow type was defined based on the characteristics of the G-CHs deposits, obviating the pre-failure mechanism. A priori, the percentages of this research and that calculated by Moreiras (2009; see Sect. 1.1) are not contradictory to the different methodology used. In particular, Moreiras (2009) mapped landslides regardless of their age and recurrence, while here we limit the analysis to historical events.
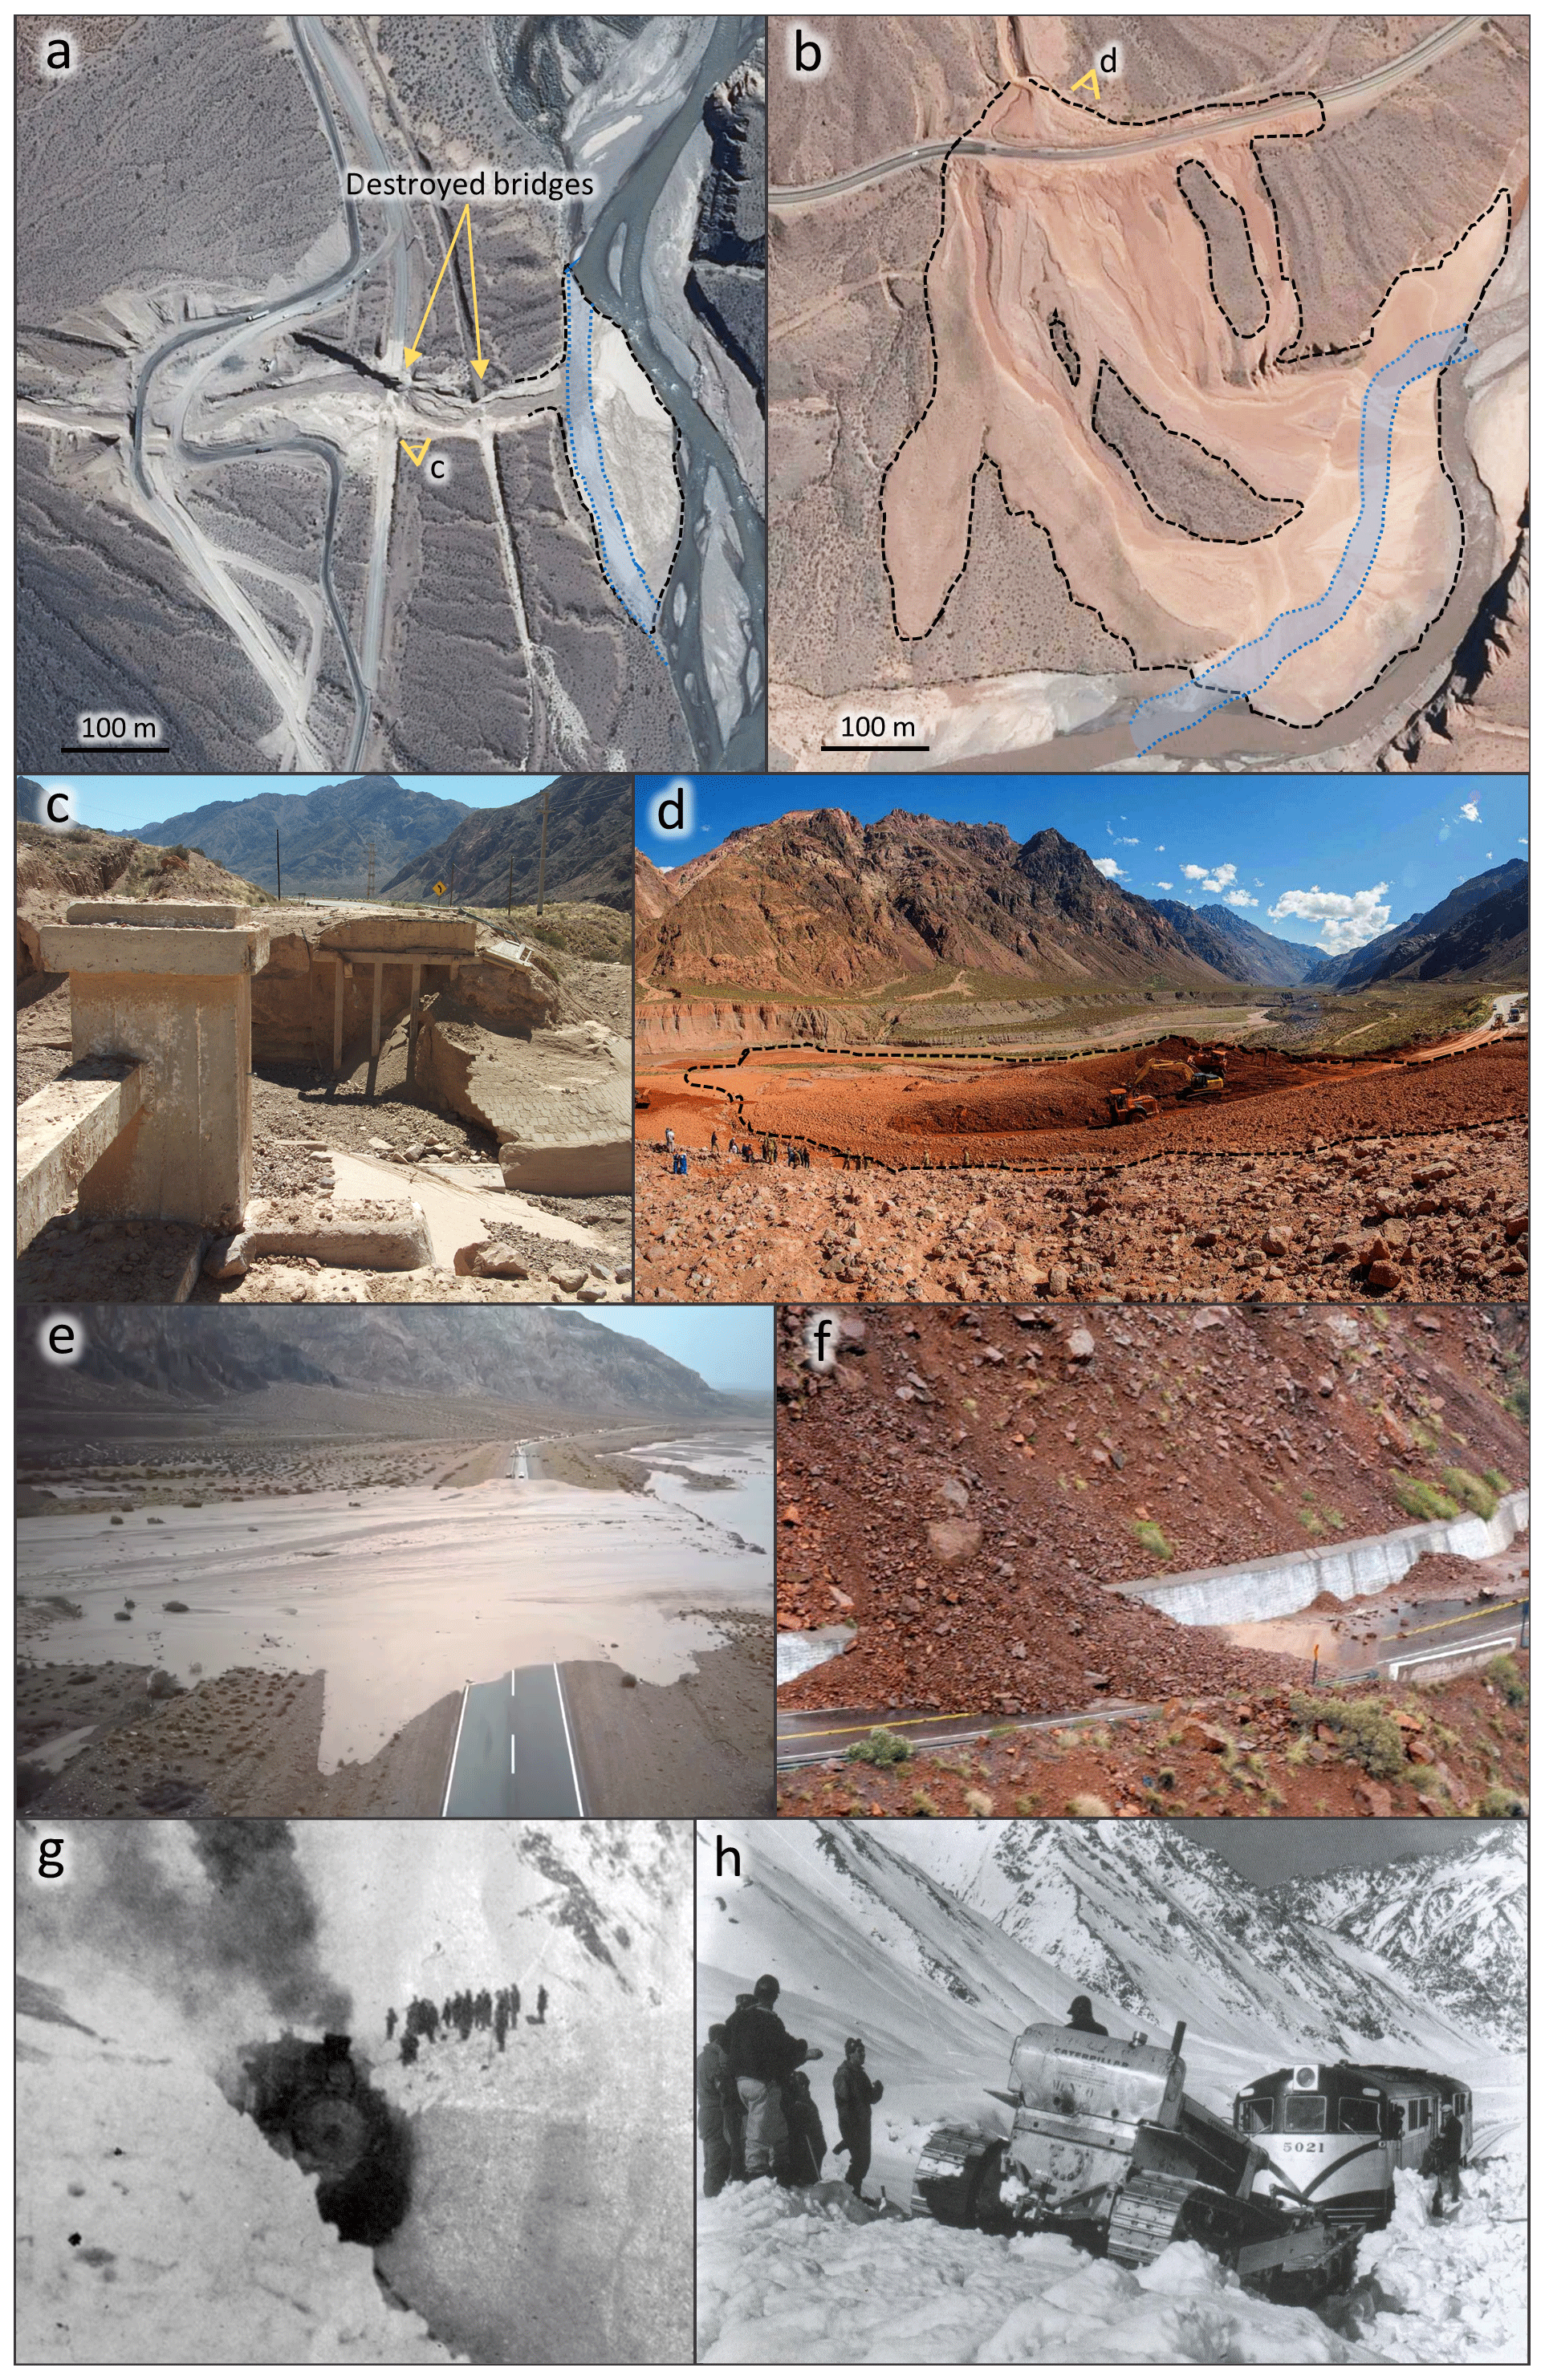
Figure 4Pictures illustrating G-CHs in study area: (a, c) rainfall-driven debris flow occurred on 2 February 2016 in the E zone, (b, d) rainfall-driven debris flow occurred on 23 January 2016 in the E zone, (e) rainfall-driven debris flow occurred on 4 February 2018 in the E zone, (f) rainfall-driven debris falls occurred on 2 August 2013 in the E zone and (g, h) snow avalanches in the W zone.
Rainfall exclusively triggers landslides, while snowfall can trigger snow avalanches and landslides. Indeed, about 35 % of the snowfall-driven hazards in the W zone (high-elevation sector) and the 83 % in the E zone (lower-elevation sector) were rockfalls or debris falls. During the snowfall these landslides can be triggered by short intervals of rain or by the melting of snow when it is deposited on the rock (and the consequent interstitial pressure in the fractures). The snow avalanches were considered to be triggered by snowfall, although they may occur due to other causes (see Sect. 1.1). This simplification was done because the anomalous snowfall is the main atmospheric cause of its occurrence.
The greatest deficiency of the record is its generation from a non-systematic monitoring, depending on whether there was an observer that recorded a G-CH. To avoid this error to the maximum, most of the analyses were carried out for the period 1961–2017 (unless otherwise indicated). In 1961, the last section of international Route 7 was paved, leading to a stabilization of traffic and G-CHs reports.
Using the G-CHs record, two time series were made. The first is the sum of all G-CHs during a given period (season or year) referred to as the number of G-CHs. The second is the sum, over a given period, of the number of days in which there was at least on G-CH, referred to as the number of days. The number of G-CHs is more representative of the spatial extent and intensity of the meteorological event but has a larger bias by non-systematic monitoring. We therefore use the number of days (with at least one G-CH) per season as our primary variable for analysis, segregating by trigger (snowfall, rainfall) and zone (W, E). In order to have a minimum number of cases in the segregated series that guarantees the robustness of the statistical analyses, we refrained here from making further subdivision based on terrain unit, G-CH type (landslide or snow avalanche) or landslide movement (flow or fall).

Figure 5Distributions of the two triggers of G-CHs. (a) Probability of G-CH annual occurrence for each ravine, talus cone and rock wall monitored, superimposed on a topographic map. (b) Monthly mean probability density along a west–east transect for snowfall (left) and rainfall (right). The horizontal axis indicates the distance eastward from the Andes ridge. The cyan lines indicate the mean winter freezing level. Horizontal lines indicate the seasonal division and vertical line the longitudinal division.
3.1 Spatio-temporal distributions of G-CHs
Figure 5a shows the probability of G-CH annual occurrence for each ravine, talus cone and rock wall within our study region. As expected, snowfall-induced hazards are concentrated in the upper, W zone, although a few occur in the eastern, lower sector. Likewise, rainfall-induced landslides concentrate in the E zone but also extend into the W zone. The rainfall trigger has the four highest values (maximum probability of 67 %), and the snowfall trigger the fifth and eighth highest values (maximum probability of 40 %; Fig. 5a).
To obtain a more complete view of the G-CHs' spatio-temporal distribution we calculated the monthly mean probability density of these hazards across the full study area (following the longitudinal axis) using the non-parametric kernel density estimator for directional-linear data (García-Portugués et al., 2013). The bandwidth was selected through the maximum likelihood cross validation in order to optimize the trade-off between bias and variance (Hall et al., 1987). For this calculation, the day number of the year and the distance on the longitudinal axis of each G-CH were used. The methodology used allows considering the circular distribution of dates. The snowfall-driven hazards presented probability densities greater than the rainfall-driven landslides, with a well-defined peak in W zone during May–June (early winter) but extending into the full winter semester (Fig. 5b). The probability densities of the rainfall-driven hazards are more diffuse within the E zone and maximize at the height of the austral summer (January–February). Overall, the probability of G-CHs closely follows the annual cycle of the precipitation (Fig. 2a–c).
The snowfall-driven hazards are concentrated in the W because here the winter precipitation is greater and in the solid state due to elevation. On the other hand, rainfall-triggered landslides are greater in the E zone due to the lower elevation and the higher occurrence of intense, convective rainfall over this area during summer. While the snowfall trigger can only occur in the wintertime, due to the need for a low ZIA, the rainfall trigger can occur throughout the year, due to the fact that a sector of the E zone is below the mean freezing level of winter precipitation (Fig. 5a).
3.2 Association with climate drivers
We now establish the association between G-CHs with climate drivers (precipitation and temperature) at interannual timescales, considering the different combinations of seasons (winter, summer) and zones (W, E). An annual series of precipitation was calculated for each season and zone using the stations that have at least 89 % of annual values of the 1982–2000 period. In total, three (four) stations of the W (E) zone were used. Each value of the series was expressed as a percentage of the common period, and then averages were calculated between the stations of the same zone. For the annual series of mean temperature, the available stations of each zone were used – that is to say, Punta de Vacas for the W zone and Uspallata and Guido for the E zone (Table 1). For the latter, simple averages were calculated as both records cover the same period.
Due to the non-normality in the precipitation and G-CH series, the Spearman correlation coefficient was used. The significance of the correlations was evaluated with the method proposed by Zar (1972) considering a 95 % level of confidence (same percentage used in the following cases). Precipitation exhibits a positive correlation in all combinations so that above-average (below-average) average precipitation tends to increase (decrease) G-CHs in both zones throughout the year (Fig. 6a). Winter precipitation is significantly correlated with snowfall-induced hazards across the whole study region, while summer precipitation is significantly correlated with rainfall-induced landslides in the E zone only (recall that summer rainfall in the W zone is low). The larger correlation values during winter in the W zone may result from the spatially coherent pattern of frontal precipitation, in contrast with the isolated, convective nature of summer precipitation. Another reason may be that the G-CHs of this spatio-temporal combination are generally snow avalanches, which increase their occurrence probability with precipitation accumulation. On the contrary the falls and flows, most common in summer and E zone, depend on sub-daily precipitation intensity, data that are not available in this region.
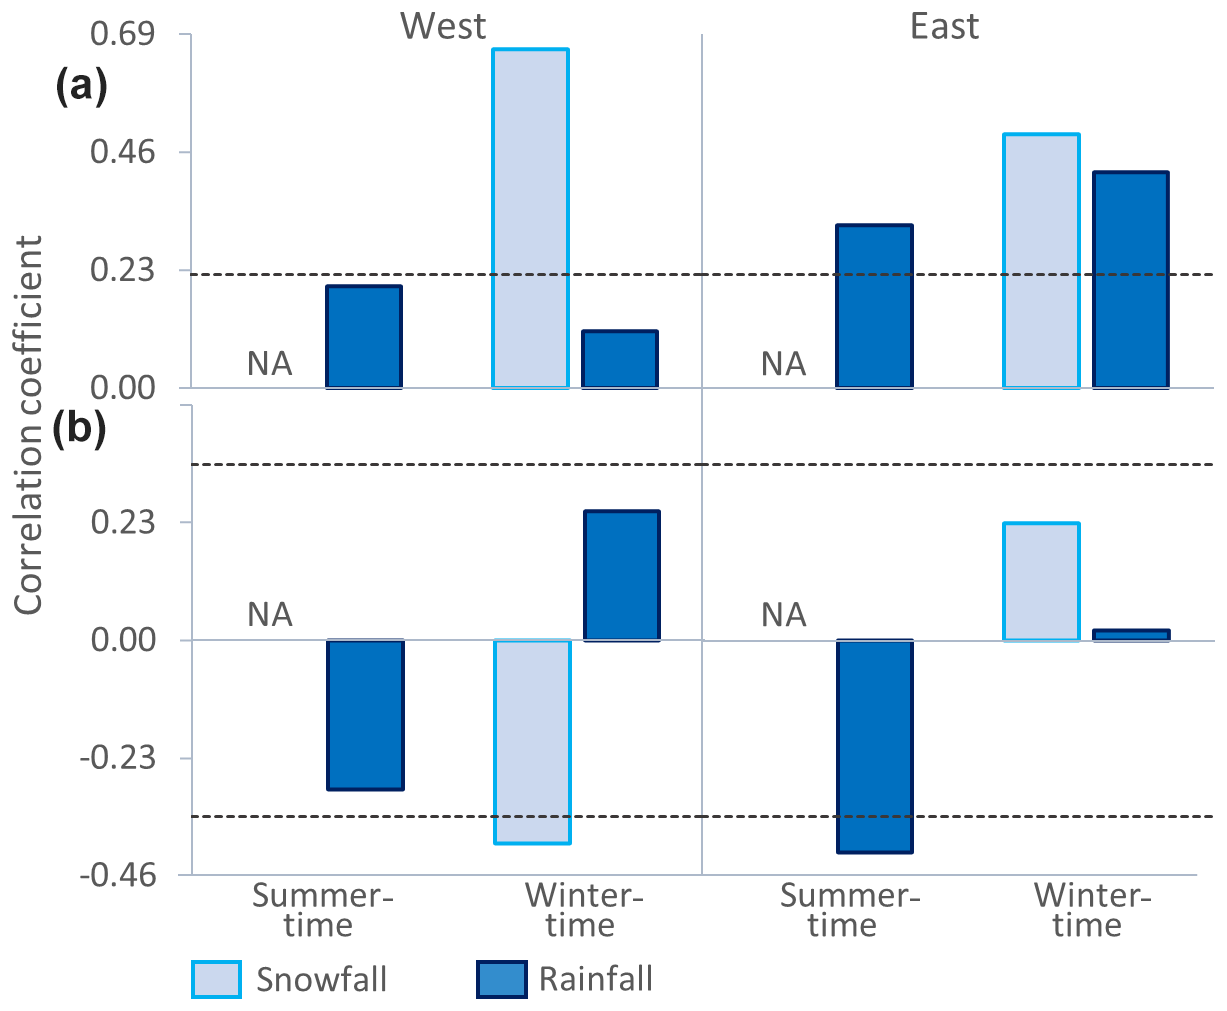
Figure 6Interannual correlations between the series of the number of days with G-CHs per season and (a) precipitation and (b) mean temperature. Dashed lines indicate significance at 95 % level.
Correlation values with average temperature are lower than those with precipitation and differ in sign among zones and seasons (Fig. 6b). The temperature is negatively and significantly correlated with snowfall-driven hazards in the W zone during winter and with rainfall-driven hazards in the E zone during summer. The weaker G-CH–temperature correlations may reflect an indirect association mediated by precipitation (for instance, a season with lower-than-average temperature may reflect a larger number of weather systems crossing the region).
3.3 Contemporaneous changes
The linear trend over the period 1961 to 2017 for the precipitation and the G-CHs is calculated for each zone and season, using the non-parametric Mann–Kendall statistic (Mann, 1945; Kendall, 1975). The linear slope was estimated with the non-parametric statistic developed by Sen (1968). These methods are considered more adequate than the least-squares approach given the non-normality of the series. In the higher W zone, precipitation exhibits non-significant trends that differ between seasons: negative in winter (the wet season) and positive in summer (Table 2 and Fig. 7a and e). The winter drying trend is in line with the negative rainfall tendency observed along the lowlands of central Chile (Boisier et al., 2016, 2018) that has been accentuated in the last decade in connection with the so-called central Chile mega-drought (Garreaud et al., 2017; Rivera et al., 2017). Instead, in the E zone, precipitation has increased year-round but only significantly during winter (Table 2 and Fig. 7b and f). These results coincide with the significant increase in precipitation in the central–western Argentine plain that occurred mainly between December and May (SADSN, 2018; Labraga, 2010; Vera and Díaz, 2015). The trends in the E and W zones remain similar when considering the full period 1957–2017 (Table 2).

Figure 7Trends in drivers and G-CHs. Series of precipitation (grey lines) and number of days with G-CHs (lines with points) in the W zone (a, c, e, g) and E zone (b, d, f, h) for (a–d) summer and (e–h) winter months. In the case of G-CHs, blue refers to rainfall-driven hazards and light blue to snowfall-driven hazards. Dashed lines indicate significant trends at 95 % level.
Table 2Decadal changes in the precipitation percentage (Pp), the number of days with snowfall-driven G-CHs (S) and the number of days with rainfall-driven G-CHs (R). The values with asterisks are significant at 95 %; the empty spaces correspond to data not available.
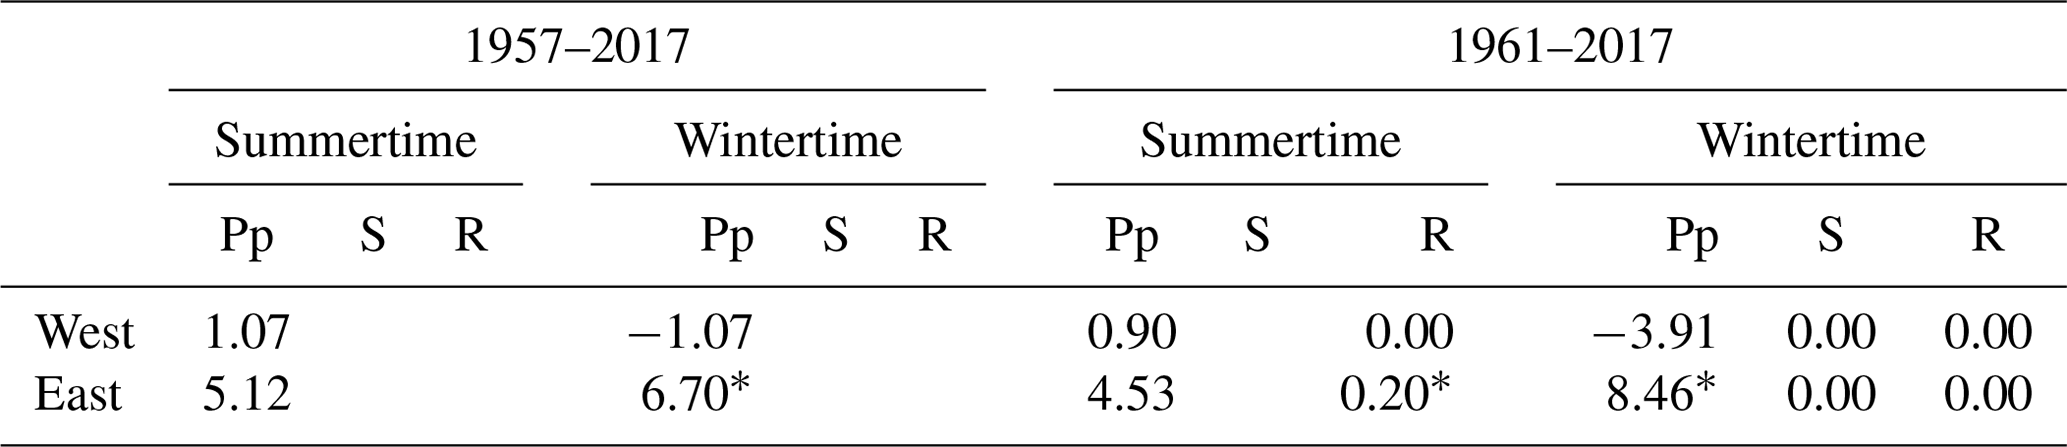
Given their episodic nature, finding trends in the G-CH frequency is more difficult. Nonetheless, rainfall-driven G-CHs show a significant increase in their number during summer over the E zone that is congruent with the weak precipitation increase in this sector and season (Fig. 7b and d and Table 2).
The snowfall-driven winter hazards have exhibited a decrease in the W zone since the end of the 1990s (−0.7 d with G-CHs per decade for the 1997–2017 period – p<0.05; Fig. 7g). This decrease may be connected with the precipitation decline or with an elevation of the freezing level due to the ongoing regional warming (Masiokas et al., 2006; Vuille et al., 2015). To assess the role of the temperature, we examine its evolution in the May–September season during the 1974–2017 period. To this end, we used surface temperature data from two nearby stations on the Chilean side (Lagunitas and Embalse el Yeso; Table 1). These stations were considered the most appropriate in terms of record length and data continuity as well as elevation (>2400 m a.s.l.) and proximity to the study area (less than 80 km). For dry days we calculated the ZIA using a dry adiabatic gradient of 6.5 ∘C km−1, and for days with precipitation we calculated the freezing level (see Sect. 2).
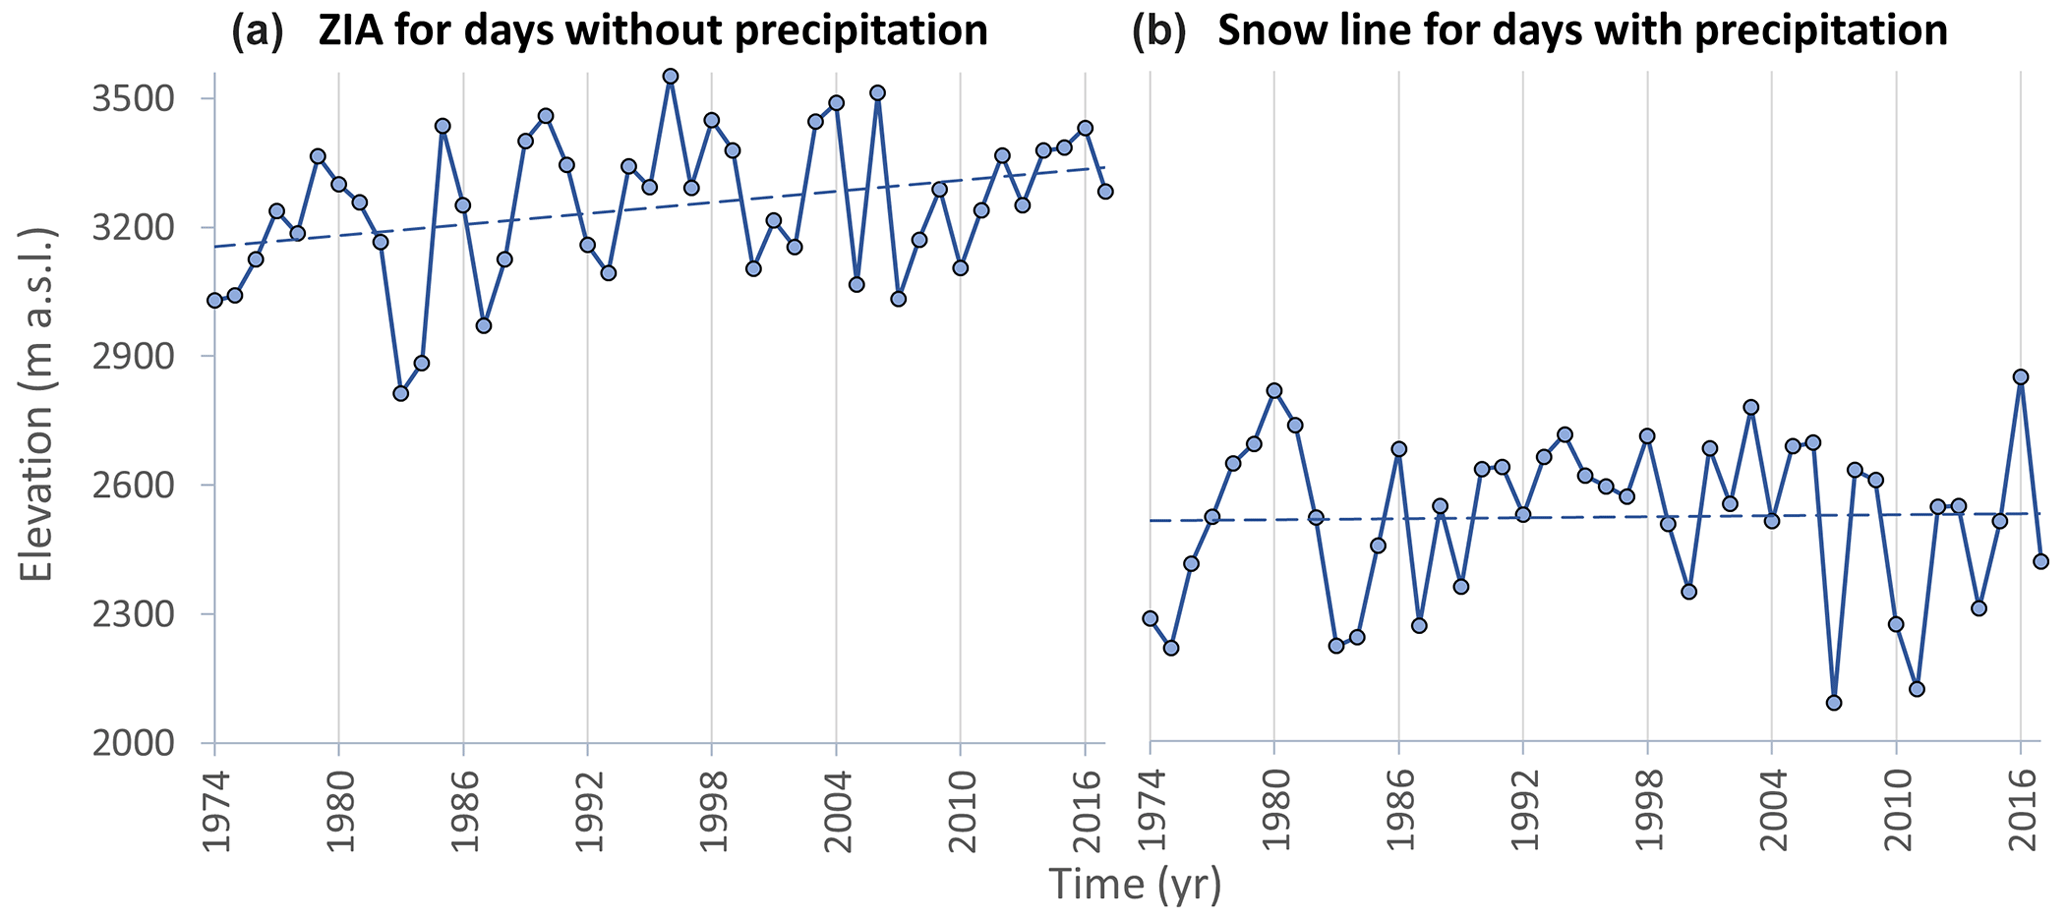
Figure 8Warming effects. (a) Annual series for the May–September average of the zero-degree isotherm altitude during dry days. (a) Annual series for the May–September average of the snow line during days with precipitation. Dashed lines indicate the trends.
The linear trends were calculated for the resulting ZIA series through the least-squares method. The ZIA for dry days has a significant trend of +4.31 m yr−1 (Fig. 8), in agreement with previous studies (Carrasco et al., 2008) and the overall warming over the subtropical Andes (Falvey and Garreaud, 2009; Vuille et al., 2015; Vergara Dal Pont et al., 2020). On the other hand, the freezing level for days with precipitation had a very weak, non-significant trend of +0.42 m yr−1 (Fig. 8), similar to the trend obtained by Carrasco et al. (2005) in the annual ZIA for days with precipitation and notably lower than the trend during dry days. This suggests that the warming over the last decades has – for now – a limited impact on the decrease in snowfall-driven G-CHs.
As an independent method, elevations of the main deposits of the snowfall-driven G-CHs for the periods 1882–1953 (39 cases) and 1993–2015 (52 cases) were compared (Fig. 9). The significance of difference in mean elevations between both periods was determined through the non-parametric bootstrap method (999 simulations; Zieffler et al., 2011). The mean elevations of the main deposits of the snowfall-driven G-CHs of both periods did not have a significant difference. These results lend support to the notion that the decrease in snowfall-driven winter hazards is largely caused by the decline in Pacific-sourced rainfall rather than an elevation in the ZIA due to regional warming.
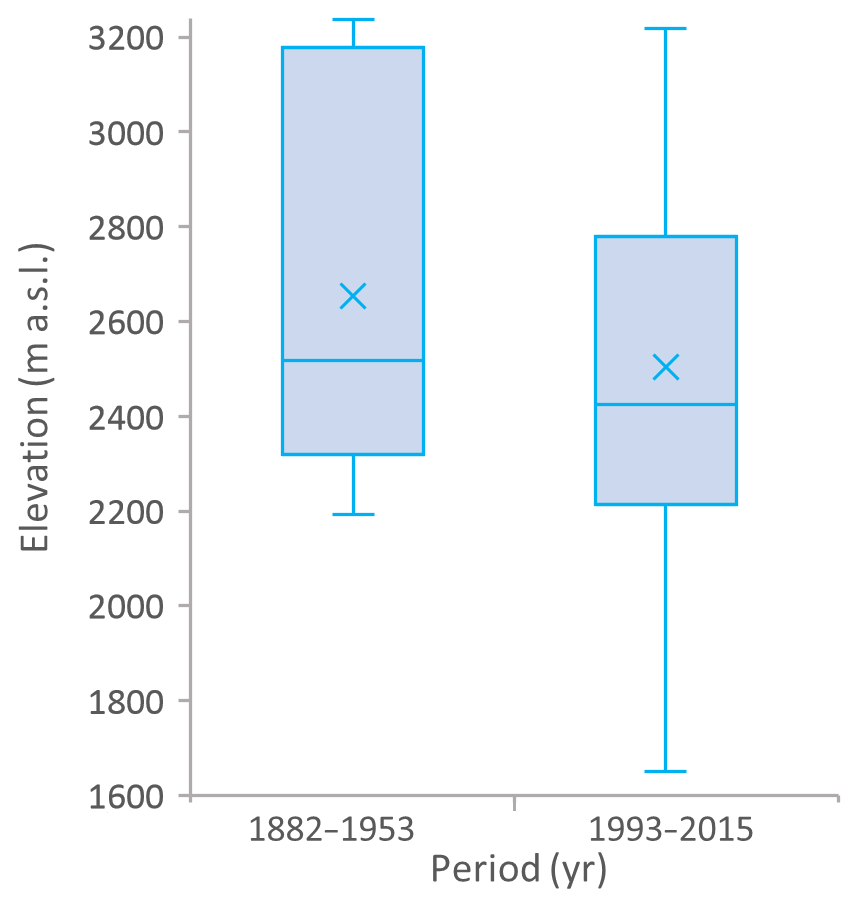
Figure 9Boxplots for the elevations of the main deposits of snowfall-driven G-CHs during the periods 1882–1953 and 1993–2015.
The seasonal mean temperature exhibits a weak and non-systematic correlation with the number of days with G-CHs, reflecting the lack of a direct physical link between these variables. By contrast precipitation accumulated during winter is positively associated with the number of days with snowfall-driven hazards in both zones, while summer rainfall is correlated with the number of days with rainfall-driven landslides in the E zone. Although some of these correlations are statistically significant, their values are not high enough to fit predictive models at the interannual (Pavlova et al., 2014) or meteorological event scale (e.g. Staley et al., 2017). An improved, denser meteorological network across this complex terrain (including radar monitoring of summer convection) may result in a better depiction of the climate control of the local geo-climatic hazard, suitable for a more quantitative diagnosis, forecast and projections of their future frequency.
Our trend analysis indicates that winter precipitation has been decreasing in the W zone. Although barely significant, this decrease is associated with a more robust decline in frontal, Pacific-sourced precipitation in central Chile (Boisier et al., 2016) and the occurrence of a decade-long drought in that region (Garreaud et al., 2017). On the other hand, we found an overall increase in precipitation in the E zone. The trend is more significant in the winter semester due to the enhanced moisture transport from the Atlantic to the east of the Andes (SADSN, 2018; Barros et al., 2015; Vera and Díaz, 2015). We also studied the winter temperature given its control on altitude, separating rainfall and snowfall (in close correspondence with ZIA). In agreement with other evidence of regional warming, we found a clear increase in ZIA during dry days, which are the majority in this region. In the subset of days with precipitation, however, the ZIA exhibits an insignificant increase, suggesting that the thermal structure of winter, Pacific-sourced storms has not changed enough yet to cause an impact on the number of snowfall-driven G-CHs over the subtropical Andes.
Considering the interannual correlation between G-CHs and climate elements, as well as the tendencies of the latter, we advanced in the attribution of the trends in the number of days with snow avalanches and landslides. Finding trends in the G-CH frequency is complex given their highly variable nature and the non-systematic monitoring, resulting mostly in non-significant values. Nonetheless, two series of G-CHs show significant trends. The first is the increasing number of days with rainfall-driven hazards during summer over the E zone, in line with the weak precipitation increase in this sector and season. Secondly, we confirm a decrease in the number of days with snowfall-driven hazards during winter in the W zone since the end of the 1990s. We further show that such a decrease is consistent with the decline in winter precipitation over central Chile and the adjacent Andes, with little or no effect of the regional warming in the last decades, since the freezing level during precipitating days exhibits an insignificant change.
When corrections for non-systematic monitoring are not applied (variable used, type and start year of trends) much larger tendencies are obtained. For example, when the trend of rainfall trigger, E zone and summer season G-CHs is calculated using a number of G-CH variables, the least-squares method and the 1950–2017 period, a tendency of 1.5 G-CHs per decade is obtained instead of 0.2 d of G-CHs per decade (consider that on average in a day with G-CHs, there are 2.2 hazards; Fig. 4b). This indicates that the previously found increase in the record of rainfall-driven G-CHs since the mid-20th century (Moreiras and Vergara Dal Pont, 2017) was mainly due to increases in monitoring.
A weakness of this study is to group processes of a different nature such as falls and snow avalanches. This was done in order to have a minimum number of cases in the segregated series to perform statistical inferences; however, it generates some uncertainty about whether the results obtained are representative for all types of G-CHs grouped. Another weakness is that it does not account for the magnitude of landslides and snow avalanches. A future research direction, which may include this intensity metric, could be to establish a relationship between the G-CHs and fluvial solid discharge, the latter proving to be a regionally good proxy of rainfalls (Garreaud and Viale, 2014). Positive results could add a magnitude proxy to the existing series and increase their reliability.
In closing this section, we speculate on the future prospect of geo-climatic activity over our study area. Model-based climate projections (e.g. Junquas et al., 2012; Vera and Díaz, 2015; Bozkurt et al., 2018) consistently reveal (a) a marked warming over the subtropical Andes, (b) a decline of Pacific-sourced, winter precipitation, and (c) an increase in Atlantic-sourced, monsoonal precipitation during the warm season. The last two projections, seemingly acting in the present, will result in the maintenance of the observed trends during the next decades: an increase in rain-driven hazards in the E zone and a decrease in snowfall-driven hazards in the W zone, eventually amplified by the projected warming.
In this work we analysed a long record of G-CHs (including geo-location and possible trigger) in a sector, extending from the subtropical Andean crest toward the lowlands of western Argentina (city of Mendoza), that follows a 90 km long transect of a highly used international highway. We focused our work on landslides and snow avalanches that can be triggered by rainfall and snowfall. The purpose of the research was to calculate the trends of the G-CHs and to explore their causes. The precautions taken before calculating trends were to separate spatially and temporally climate regimes and avoid, as much as possible, the effects of non-systematic monitoring. The G-CH series for the different triggers, zones and seasons were generally stationary; however, two series had tendencies. The rainfall-driven G-CHs during summer over the E zone have shown an increase since the mid-20th century, which was related to the weak rainfall increase in that zone and season. The calculated increase is much lower than that which would have been obtained without corrections for non-systematic monitoring. On the other hand, snowfall-driven G-CHs in the W zone have been decreasing since the late 1990s. In this case, non-systematic monitoring cannot explain the trend, since it only increased over time. This change was attributed to a decrease in winter precipitation, since the snow line increase occurred mainly on days without precipitation.
Station data (rainfall, temperatures) for Chile are available from http://explorador.cr2.cl/ (last access: 8 January 2018). (Muñoz and Garreaud, 2018). Station data (rainfall, temperatures) for Argentina are available from http://bdhi.hidricosargentina.gob.ar/ (last access: 8 January 2018) (Secretary of Infrastructure and Water Policy, 2018). Data from the hazard database are not publicly accessible.
IV, SM, DA and RG contributed to the conception and design. IV and SM contributed to the acquisition of data. IV, SM, DA and RG contributed to analysis and interpretation of data. IV and RG drafted the article.
The authors declare that they have no conflict of interest.
We are grateful to Eduardo García-Portgués for the advice in the kernel density estimation for directional–linear data. We also thank the reviewer, Martin Mergili; an anonymous reviewer; and the editor, Thom Bogaard, for their comments and suggestions on earlier versions of the paper. RG is partially supported by the Center for Climate and Resilience Research (CR(2), CONICYT/FONDAP/15110009).
This research has been supported by the Centro de Investigación del Clima y la Resiliencia, CR(2) Chile (grant no. CONICYT-Chile/FONDAP/15110009).
This paper was edited by Thom Bogaard and reviewed by Martin Mergili and one anonymous referee.
AMC: Data of Lagunitas meteorological station, available at: https://www.codelco.com/andina, last access: 8 January 2018.
Araneo, D., Simonelli, S., Norte, F., Viale, M., and Santos, R.: Caracterización de sondeos estivales del norte de Mendoza mediante el análisis de componentes principales y obtención de un índice de convección, Meteorologica, 36, 31–47, 2011.
Barros, V. R., Boninsegna, J. A., Camilloni, I. A., Chidiak, M., Magrín, G. O., and Rusticucci, M.: Climate change in Argentina: trends, projections, impacts and adaptation, WIREs Clim. Change, 6, 151–169, https://doi.org/10.1002/wcc.316, 2015.
Boisier, J. P., Rondanelli, R., Garreaud, R. D., and Muñoz, F.: Anthropogenic and natural contributions to the Southeast Pacific precipitation decline and recent megadrought in central Chile, Geophys. Res. Lett., 43, 413–421, 2016.
Boisier, J. P., Alvarez-garreton, C., Cordero, R. R., Damiani, A., Gallardo, L., Garreaud, R., Lambert, F., Ramallo, C., and Rojas, M.: Anthropogenic Drying in Central-Southern Chile Evidenced by Long-Term Observations and Climate Model Simulations, Elementa Science of the Antropocene, 6, 1–20, https://doi.org/10.1525/elementa.328, 2018.
Bozkurt, D., Rojas, M., and Boisier, J. P.: Projected Hydroclimate Changes over Andean Basins in Central Chile from Downscaled CMIP5 Models under the Low and High Emission Scenarios, Climatic Change, 150, 131–147, https://doi.org/10.1007/s10584-018-2246-7, 2018.
Carrasco, J. F., Casassa, G., and Quintana, J.: Changes of the 0 ∘C isotherm and the equilibrium line altitude in central Chile during the last quarter of the 20th century, Hydrolog. Sci. J., 50, 933–948, 2005.
Carrasco, J. F., Osorio, R., and Casassa, G.: Secular trend of the equilibrium-line altitude on the western side of the southern Andes, derived from radiosonde and surface observations, J. Glaciol., 54(186), 538-550, 2008.
Carretier, S., Regard, V., Vassallo, R., Aguilar, G., Martinod, J., Riquelme, R., Pepin, E., Charrier, R., Hérail, G., Farías, M., Guyot, J.-L., Vargas, G., and Lagane, C.: Slope and climate variability control of erosion in the Andes of central Chile, Geology, 41, 195–198, 2013.
DGA: Statistics of meteorological stations, avaiable at: https://dga.mop.gob.cl/Paginas/default.aspx, last access: 8 January 2018.
Falvey, M. and Garreaud, R.: Wintertime Precipitation Episodes in Central Chile: Associated Meteorological Conditions and Orographic Influences, J. Hydrometeorol., 8, 171–193, 2007.
Falvey, M. and Garreaud, R.: Regional cooling in a warming world: Recent temperature trends in the southeast Pacific and along the west coast of subtropical South America (1979–2006), J. Geophys. Res.-Atmos., 114, 1–16, 2009.
García-Portugués, E., Crujeiras, R. M., and González-manteiga, W.: Kernel density estimation for directional–linear data, J. Multivar. Anal., 121, 152–175, 2013.
Garreaud, R.: Estimación de la altura de la línea de nieve en cuencas de Chile central, Rev. Chilena de Ing. Hidráulica, 7, 21–32, 1992.
Garreaud, R.: Warm winter storms in Central Chile, J. HydrometeorOL., 14, 1515–1534, 2013.
Garreaud, R., Vuille, M., Compagnucci, R., and Marengo, J.: Present-day South American Climate, Palaeogeogr. Palaeocl., 281, 180–195, 2009.
Garreaud, R., Viale, M.: Análisis de los fenómenos meteorológicos y climáticos que afectan la cuenca del río Maipo, Aquae Papers, 5, 17–29, 2014.
Garreaud, R. D., Alvarez-Garreton, C., Barichivich, J., Boisier, J. P., Christie, D., Galleguillos, M., LeQuesne, C., McPhee, J., and Zambrano-Bigiarini, M.: The 2010–2015 megadrought in central Chile: impacts on regional hydroclimate and vegetation, Hydrol. Earth Syst. Sci., 21, 6307–6327, https://doi.org/10.5194/hess-21-6307-2017, 2017.
Hall, P., Watson, G. S., and Cabrera, J.: Kernel Density Estimation with Spherical Data, Biometrika, 74, 751–762, 1987.
IANIGLA: Inventario Nacional de Glaciares, available at: http://www.glaciaresargentinos.gob.ar/, last access: 8 January 2018.
Joyce, R. J., Janowiak, J. E., Arkin, P. A., and Xie, P.: CMORPH: a method that produces global precipitation estimates from passive microwave and infrared data at high spatial and temporal resolution, J. Hydrometeorol., 5, 487–503, 2004.
Junquas, C., Vera, C., Li, L., and Le Treut, H.: Summer Precipitation Variability over Southeastern South America in a Global Warming Scenario, Clim. Dynam., 38, 1867–1883, 2012.
Kendall, M. G. (Ed.): Rank correlation methods, Griffin, London, 1975.
Labraga, J. C.: Statistical Downscaling Estimation of Recent Rainfall Trends in the Eastern Slope of the Andes Mountain Range in Argentina, Theor. Appl. Climatol., 99, 287–302, 2010.
Mann, H. B.: Non-parametric test against trend, Econometrica, 13, 245–259, 1945.
Masiokas, M. H., Villalba, R., Luckman, B. H., Le Quesne, C., and Aravena, J. C.: Snowpack Variations in the Central Andes of Argentina and Chile, 1951–2005: Large-Scale Atmospheric Influences and Implications for Water Resources in the Region, J. Climate, 19, 6334–6352, 2006.
Mergili, M., Fellin, W., Moreiras, S. M., and Stötteret, J.: Simulation of debris flows in the Central Andes based on Open Source GIS: possibilities, limitations, and parameter sensitivity, Nat. Hazards, 61, 1051–1081, 2012.
Montecinos, A., Díaz, A., and Aceituno, P.: Seasonal Diagnostic and Predictability of Rainfall in Subtropical South America Based on Tropical Pacific SST, J. Climate, 13, 746–758, 2000.
Moreiras, S. M.: Climatic effect of ENSO associated with landslide occurrence in the Central Andes, Mendoza Province, Argentina, Landslides, 2, 53–59, 2005a.
Moreiras, S. M.: Landslide susceptibility zonation in the Rio Mendoza Valley, Argentina, Geomorphology, 66, 345–357, 2005b.
Moreiras, S. M.: Frequency of debris flows and rockfall along the Mendoza river valley (Central Andes), Argentina: Associated risk and future scenario, Quatern. Int., 158, 110–121, 2006.
Moreiras, S. M.: Análisis estadístico probabilístico de las variables que condicionan la inestabilidad de las laderas en los valles de los ríos Las Cuevas y Mendoza, Rev. Asoc. Geol. Argent., 65, 780–790, 2009.
Moreiras, S. M. and Vergara Dal Pont, I.: Climate Change Driving Greater Slope Instability in the Central Andes, in: Advancing Culture of Living with Landslides, edited by: Mikoš, M., Vilímek, V., Yin, Y., and Sassa, K., Springer, Cham, 191–197, 2017.
Moreiras, S., Lisboa, M. S., and Mastrantonio, L.: The role of snow melting upon landslides in the central Argentinean Andes, Earth Surf. Proc. Land., 37, 1106–1119, 2012.
Moreiras, S. M., Vergara Dal Pont, I., and Araneo, D.: Were merely storm-landslides driven by the 2015–2016 Niño in the Mendoza River valley?, Landslides, 15, 997–1014, 2018.
Muñoz, F. and Garreaud, R.: Station data (rainfall, temperatures) for Chile were downloaded from the CR(2) website, available at: http://explorador.cr2.cl/, last access: 8 January 2018.
ONDaT: Tránsito Medio Diario Anual (TMDA) en rutas nacionales, available at: http://ondat.fra.utn.edu.ar/, last access: 8 January 2018.
Paruelo, J. M., Jobbagy, E. G., and Sala, O. E.: Current distribution of ecosystem functional types in temperate South America, Ecosystems, 4, 683–698, 2001.
Pavlova, I., Jomelli, V., Brunstein, D., Grancher, D., Martin, E., and Déqué, M.: Debris flow activity related to recent climate conditions in the French Alps: A regional investigation, Geomorphology, 219, 248–259, 2014.
Ramos, V. A.: Evolución tectónica de la Alta Cordillera de San Juan y Mendoza, in: Geología de la región del Aconcagua, provincias de San Juan y Mendoza, edited by: Ramos, V. A., Aguirre-Urreta, M. B., Alvarez, P. P., Cegarra, M., Cristallini, E. O., Kay, S. M., Lo Forte, G. L., Pereyra, F., and Pérez, D., Dirección Nacional del Servicio Geológico, Buenos Aires, 447–460, 1996.
Rivera, J., Penalba, O., Villalba, R., and Araneo, D.: Spatio-Temporal Patterns of the 2010–2015 Extreme Hydrological Drought across the Central Andes, Argentina, Water, 9, 652, https://doi.org/10.3390/w9090652, 2017.
SADSN: Cambio Climático en Argentina; Tendencias y Proyecciones, available at: http://3cn.cima.fcen.uba.ar/3cn_informe.php, last access: 8 January 2018.
Saluzzi, M. E.: Aspectos físicos de la convección severa en Mendoza, PhD Thesis, Universidad de Buenos Aires, Buenos Aires, Argentina, 1983.
Sarricolea, P., Herrera-Ossandon, M., and Meseguer-Ruiz, Ó.: Climatic regionalisation of continental Chile, J. Maps, 13, 66–73, 2016.
Scian, B., Labraga, J. C., Reimers, W., and Frumento, O.: Characteristics of Large-Scale Atmospheric Circulation Related to Extreme Monthly Rainfall Anomalies in the Pampa Region, Argentina, under Non-ENSO Conditions, Theor. Appl. Climatol., 85, 89–106, 2006.
Secretary of Infrastructure and Water Policy: Station data (rainfall, temperatures) for Argentina were downloaded from the Integrated Hydrological Database, available at: http://bdhi.hidricosargentina.gob.ar/, last access: 8 January 2018.
Sen, P. K.: Estimates of the regression coefficient based on Kendall's tau, J. Am. Stat. Assoc., 63, 1379–1389, 1968.
Sepúlveda, S. A. and Moreiras, S. M.: Large volume Landslides in the Central Andes of Chile and Argentina (32∘–34∘ S) and related hazards, Bull. Eng. Geol. Environ., 6, 287–294, 2013.
Sepúlveda, S. A., Moreiras, S. M., Lara, M., and Alfaro, A.: Debris flows in the Andean ranges of central Chile and Argentina triggered by 2013 summer storms: characteristics and consequences, Landslides, 12, 115–133, 2015.
SMN: Meteorological stations network, available at: https://back.argentina.gob.ar/interior, last access: 8 January 2018.
Staley, D., Negri, J., Kean, J., Laber, J., Tillery, A., and Youberg, A.: Prediction of spatially explicit rainfall intensity-duration thresholds for post-fire debris-flow generation in the western United States, Geomorphology, 278, 149–162, 2017.
Trombotto D., Buk, E., and Hernández, J.: Monitoring of Mountain Permafrost in the Central Andes, Cordon del Plata, Mendoza, Argentina, Permafrost. Periglac., 8, 123–129, 1997.
USGS: Earthquake Catalog, available at: https://earthquake.usgs.gov/earthquakes/search/, last access: 8 January 2018.
Vera, C. and Díaz, L.: Anthropogenic Influence on Summer Precipitation Trends over South America in CMIP5 Models, Int. J. Climatol., 35, 3172–3177, 2015.
Vera, C., Higgins, W., Amador, J., Ambrizzi, T., Garreaud, R., Gochis, D., Gutzler, D., Lettenmaier, D., Marengo J., Mechoso, C. R., Nogues-Paegle, J., Dias, P. L., and Zhang, C.: Toward a Unified View of the American Monsoon Systems, J. Climate, 19, 4977–5000, 2006.
Vergara Dal Pont, I. P., Santibañez, F., Araneo, D., Ferrando, F., and Moreiras, S.: Determination of probabilities for the generation of high-discharge flows in the middle basin of Elqui River, Chile, Nat. Hazards, 93, 531–546, 2018.
Vergara Dal Pont, I. P., Moreiras, S. M., Santibañez, F., Araneo, D., and Ferrando, F.: Debris flows triggered from melt of seasonal snow and ice within the active layer in the Semi-Arid Andes, Permafrost. Periglac., 31, 57–68, 2020.
Viale, M. and Garreaud, R.: Summer Precipitation Events over the Western Slope of the Subtropical Andes, Mon. Weather Rev., 142, 1074–1092, 2014.
Viale, M. and Garreaud, R.: Orographic effects of the subtropical and extratropical Andes on upwind precipitating clouds, J. Geophys. Res.-Atmos., 120, 4962–4974, 2015.
Viale, M. and Nuñez, M.: Climatology of Winter Orographic Precipitation over the Subtropical Central Andes and associated synoptic and regional characteristics, J. Hydrometeorol., 12, 481–507, 2011.
Viale, M., Bianchi, E., Cara, L., Ruiz, L., Villalba, R., Pitte, P., Masiokas, M., Rivera, J., and Zalazar, L.: Contrasting Climates at Both Sides of the Andes in Argentina and Chile, Front. Environ. Sci., 7, 69, https://doi.org/10.3389/fenvs.2019.00069, 2019.
Vuille, M., Franquist, E., Garreaud, R., Sven, W., Casimiro, L., and Cáceres, B.: Impact of the global warming hiatus on Andean temperature, J. Geophys. Res.-Atmos., 120, 3745–3757, 2015.
White, A. B., Gottas, D. J., Henkel, A. F., Neiman, P. J., Ralph, F. M., and Gutman, S. I.: Developing a performance measure for snow-level forecasts, J. Hydrometeorol., 11, 739–753, 2010.
Zar, J.: Significance Testing of the Spearman Rank Correlation Coefficient. J. Am. Stat. Assoc., 67, 578–580, 1972.
Zieffler, A. S., Harring, J. R., and Long, J. D.: Comparing Groups: Randomization and Bootstrap Methods Using R, Wiley, New York, 2011.