the Creative Commons Attribution 4.0 License.
the Creative Commons Attribution 4.0 License.
 | 05 Feb 2020
The impact of topography on seismic amplification during the 2005 Kashmir earthquake
Mark van der Meijde
Harald van der Werff
Muhammad Shafique
Ground surface topography influences the spatial distribution of earthquake-induced ground shaking. This study shows the influence of topography on seismic amplification during the 2005 Kashmir earthquake. Earth surface topography scatters and reflects seismic waves, which causes spatial variation in seismic response. We performed a 3-D simulation of the 2005 Kashmir earthquake in Muzaffarabad with the spectral finite-element method. The moment tensor solution of the 2005 Kashmir earthquake was used as the seismic source. Our results showed amplification of seismic response on ridges and de-amplification in valleys. It was found that slopes facing away from the source received an amplified seismic response, and that 98 % of the highly damaged areas were located in the topographically amplified seismic response zone.


Intensity and duration of seismic-induced ground shaking is mainly determined by earthquake magnitude, depth of hypocenter, distance from the epicenter, medium of the seismic waves, topography and site-specific geology (Kramer, 1996; Wills and Clahan, 2006; Shafique and van der Meijde, 2015; Khan et al., 2017). The influence of the Earth's topography on seismic response has been observed and proven numerically and experimentally (Athanasopoulos et al., 1999; Sepúlveda et al., 2005; Lee et al., 2009a). The Earth's topography acts as a reflecting surface for upcoming seismic energy and produces surface waves (Lee et al., 2009a, b). The undulating nature of surface topography leads to scattering or focusing of propagating waves (Lee et al., 2009a, b). Previous studies found that topography amplifies ground shaking at mountain tops and ridges, while it de-amplifies it in valleys; see, for example, Hartzell et al. (1994) and Spudich et al. (1996) in California, Lee et al. (2009a, b) in Taiwan, Hough et al. (2010) in Haiti, Kumagai et al. (2011) in Ecuador and Restrepo et al. (2016) in Colombia. Most seismic active areas are rugged in nature, which makes these regions prone to topographic (de-)amplification (Lee et al., 2009a; Hough et al., 2010; Shafique and van der Meijde, 2015). Incorporating the topographic impact on seismic response is thus important for seismic shaking prediction, seismic hazard assessment and risk mitigation (Bauer et al., 2001; Wu et al., 2008; Shafique et al., 2011a).
During the 2005 Kashmir earthquake, the city of Muzaffarabad and its surroundings in northern Pakistan were severely damaged. Various aspects of the earthquake have been studied. Ali et al. (2009) studied the impact of surface faults on infrastructure and environment, primarily based on field surveys done immediately after the earthquake. Several satellite-based studies primarily focused on field displacement and slip distribution, such as Parsons et al. (2006), Avouac et al. (2006), Pathier et al. (2006), Wang et al. (2007) and Leprince et al. (2008). Others addressed relationships between co-seismic displacement and landslides (e.g., Kamp et al., 2010; Dunning et al., 2007; Saba et al., 2010). Topographic amplification of seismic responses induced by the Kashmir earthquake was first evaluated by Shafique et al. (2008) using the topographic aggravation factor (TAF) after Bouckovalas and Papadimitriou (2005). Their method involved the use of topography-derived parameters such as terrain slope and relative height as a proxy for terrain characteristics in a homogeneous half-space. One of the major simplifications in their work was the use of these pixel-wise proxies instead of a full 3-D topographic model. In this paper, we use a 3-D spectral-element method (SEM) modeling approach that incorporates an elevation model and full elastic waveform simulations, including all possible waves, based on the source characteristics of the earthquake in a homogeneous half-space.
The SEM was developed by Patera (1984) for computational fluid dynamics, and was introduced for 3-D seismic wave propagation by (Komatitsch and Vilotte, 1998; Komatitsch and Tromp, 1999). The method has been adopted in several studies afterwards; Komatitsch et al. (2004) simulated ground motion in the Los Angeles Basin for the 2001 Mw 4.2 Hollywood earthquake and the 2002 Mw 4.2 Yorba Linda earthquake. Pilz et al. (2011) modeled basin effects on earthquake ground motion in the Santiago de Chile Basin using scenario earthquake of Mw 6.0. Magnoni et al. (2014) simulated the 2009 Mw 6.3 L'Aquila earthquake, considering topographic and basinal features in central Italy. Lee et al. (2008, 2009a, b, 2013, 2014b) developed a real-time online earthquake simulation system based on SEM in Taiwan. Liu et al. (2015) simulated a scenario of an earthquake with strong ground motion in the Shidian Basin to study basinal influence on seismic amplification and the distribution of strong ground motion. Evangelista et al. (2016) studied the site response at the Aterno Basin (Italy). Paolucci et al. (2016) estimated ground motion for the historical 1915 Marsica earthquake in the Facino Basin incorporating topography and bedrock morphology. Restrepo et al. (2016) simulated four scenario earthquakes of Mw 5 along the Romeral fault for the metropolitan area of Medellín (Colombia), demonstrating how topography affects ground response. Smerzini et al. (2017) studied site effects by taking the historical Mw 6.5 1978 Volvi earthquake in the Thessaloniki urban area (Greece).
In this study we exclusively study the role of topography on ground motion for the area of Muzaffarabad and surrounding areas during the 2005 Kashmir earthquake.
Within the area affected by the 2005 Kashmir earthquake, we selected an area of approximately 40×40 km around the city of Muzaffarabad (Fig. 1). Being part of the western Himalayas, its position on a converging plate boundary makes this region particularly prone to earthquakes. Its rugged terrain makes it sensitive to topographic (de-)amplification (Lee et al., 2009a; Hough et al., 2010; Shafique and van der Meijde, 2015). The earthquake was caused by reactivation of the Muzaffarabad fault (also known as the Balakot–Bagh fault; Hussain et al., 2009) shown in (Fig. 1). The centroid moment tensor (CMT) of the (Mw 7.6) 8 October 2005 Kashmir earthquake (Dziewoński et al., 1981; Ekström et al., 2012), retrieved from (http://www.globalcmt.org/, last access: 1 January 2019) was used for the simulation and lies in the center of the study area at depth of 12 km (Fig. 1). The USGS (https://earthquake.usgs.gov/earthquakes/, last access: 1 January 2019) reported, after comparing waveform fits based on the two planes of the input moment tensor (Fig. 1), that the nodal plane (strike =320.0∘, dip =29.0∘) fits the data better. The seismic moment release based upon this plane is 3.0×1027 dyn cm−1 and was calculated using a 1-D crustal model interpolated from CRUST2.0 (Bassin et al., 2000). Several studies (e.g., Avouac et al., 2006; Pathier et al., 2006; Wang et al., 2007) provide detailed information about the fault dynamics, including moment tensor solutions and finite fault models.
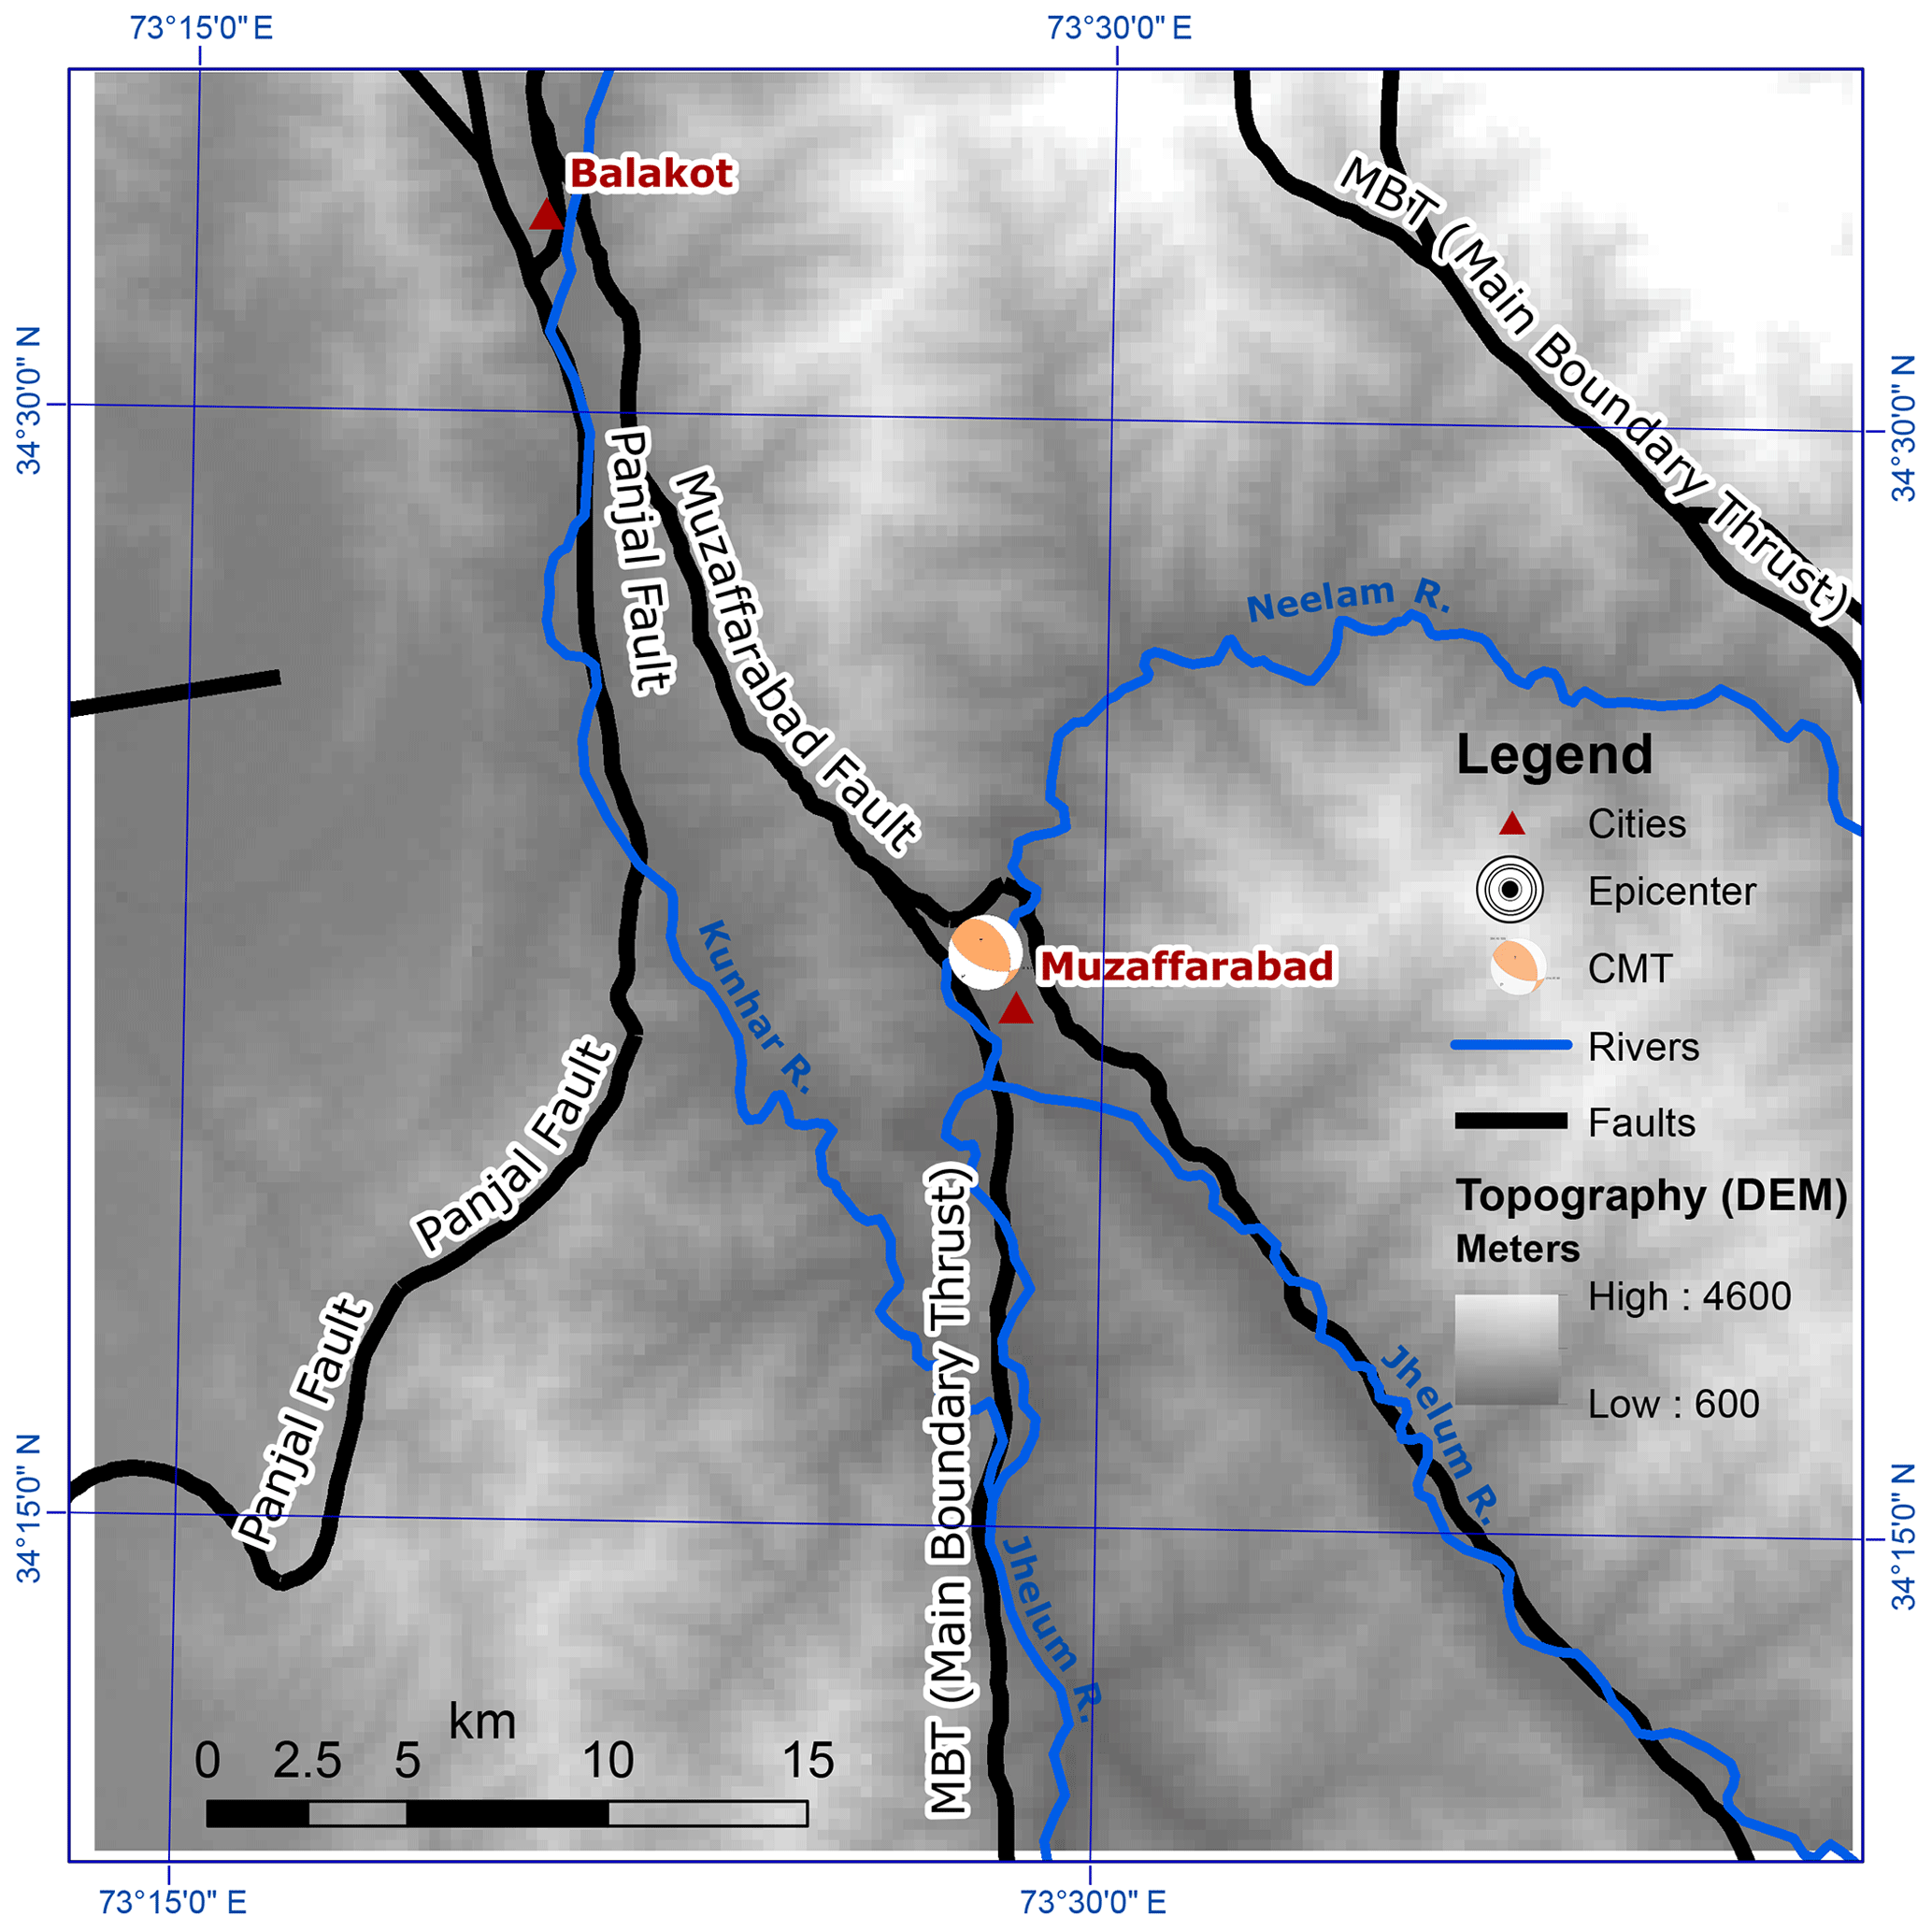
Figure 1Digital elevation model (DEM) of the study area of Muzaffarabad (Pakistan). The Main Boundary Thrust (MBT) and its segments (after Hussain et al., 2009) are shown along with centroid moment tensor (CMT) solution.
We based our analysis on modeling with the spectral-element method (SEM) for simulating 3-D seismic wave propagation. The software package SPECFEM3D (Computational Infrastructure for Geodynamics, 2016) is used for SEM simulations. SPECFEM3D can simulate global, regional and local seismic wave propagation. It uses the continuous Galerkin spectral-element method to simulate elastic waves propagation caused by earthquakes (Komatitsch and Tromp, 1999).
SEM-based modeling relies on meshed objects or volumes. A high-quality 3-D mesh is a key factor for successful application of SEM (Casarotti et al., 2008). A mesh is composed of hexahedra elements that are isomorphous to a cube (Komatitsch et al., 2002). It is defined with material and structural properties that define how it will react to applied conditions (e.g., an earthquake). We used the Cubit v.13.0 software (Sandia National Laboratories, 2011) for generation of the meshes. Surface topography is based on the ASTER Global DEM, a product of National Aeronautics and Space Administration (NASA) and Japan Ministry of Economy, Trade and Industry (METI). It was retrieved from the Global Data Explorer, courtesy of the NASA Land Processes Distributed Active Archive Center (LP DAAC), USGS/Earth Resources Observation and Science (EROS) Center (Sioux Falls, South Dakota, https://lpdaacsvc.cr.usgs.gov/appeears/, last access: 29 January 2020).
A previous study has explored at which resolution one can best model the topography in relation to mesh resolution (Khan et al., 2017). They analyzed the impact of data resolution (mesh and DEM) on seismic response using SPECFEM3D. Different combinations of mesh and DEM resolutions were modeled to find the optimal mesh and DEM resolution for getting accurate results while keeping computational resources to a minimum. Their conclusion was that a mesh and topography of 270 m resolution was optimal for the topography around Muzaffarabad. Therefore we adopt this resolution in our models, thereby allowing seismic wave simulations with frequencies up to ∼5.5 Hz. We use a polynomial degree N=4 to sample the wave field; therefore, each spectral element contains Gauss–Lobatto–Legendre (GLL) points, which is 5 GLL points per wavelength. In order to correctly sample the wave field, one needs to use roughly five GLL points per wavelength (Komatitsch et al., 2004). The mesh extends to a depth of 40 km, and contains two tripling layers. Tripling is a refinement technique in meshing for subdividing hexahedral elements in a conforming fashion (Peter et al., 2011). Tripling layers increase the spatial resolution of the mesh to 270 m at the surface from 2430 m at the bottom of the model (at a depth of 40 km). This is done in order to reduce the computational time and cost by reducing the total number of mesh elements following the approach as proposed in several other studies (e.g., Lee et al., 2008). Due to the unavailability of a seismic velocity model for the area, we assigned constant seismic velocities (Vp =2800 m s−1, Vs =1500 m s−1) and density (ρ=2300 kg m−3) in the modeling, representative for upper crustal conditions (Taborda and Roten, 2015; Wang et al., 2016; Makra and Raptakis, 2016).

Figure 2Data on damage induced by the 2005 Kashmir earthquake after Shafique et al. (2012).
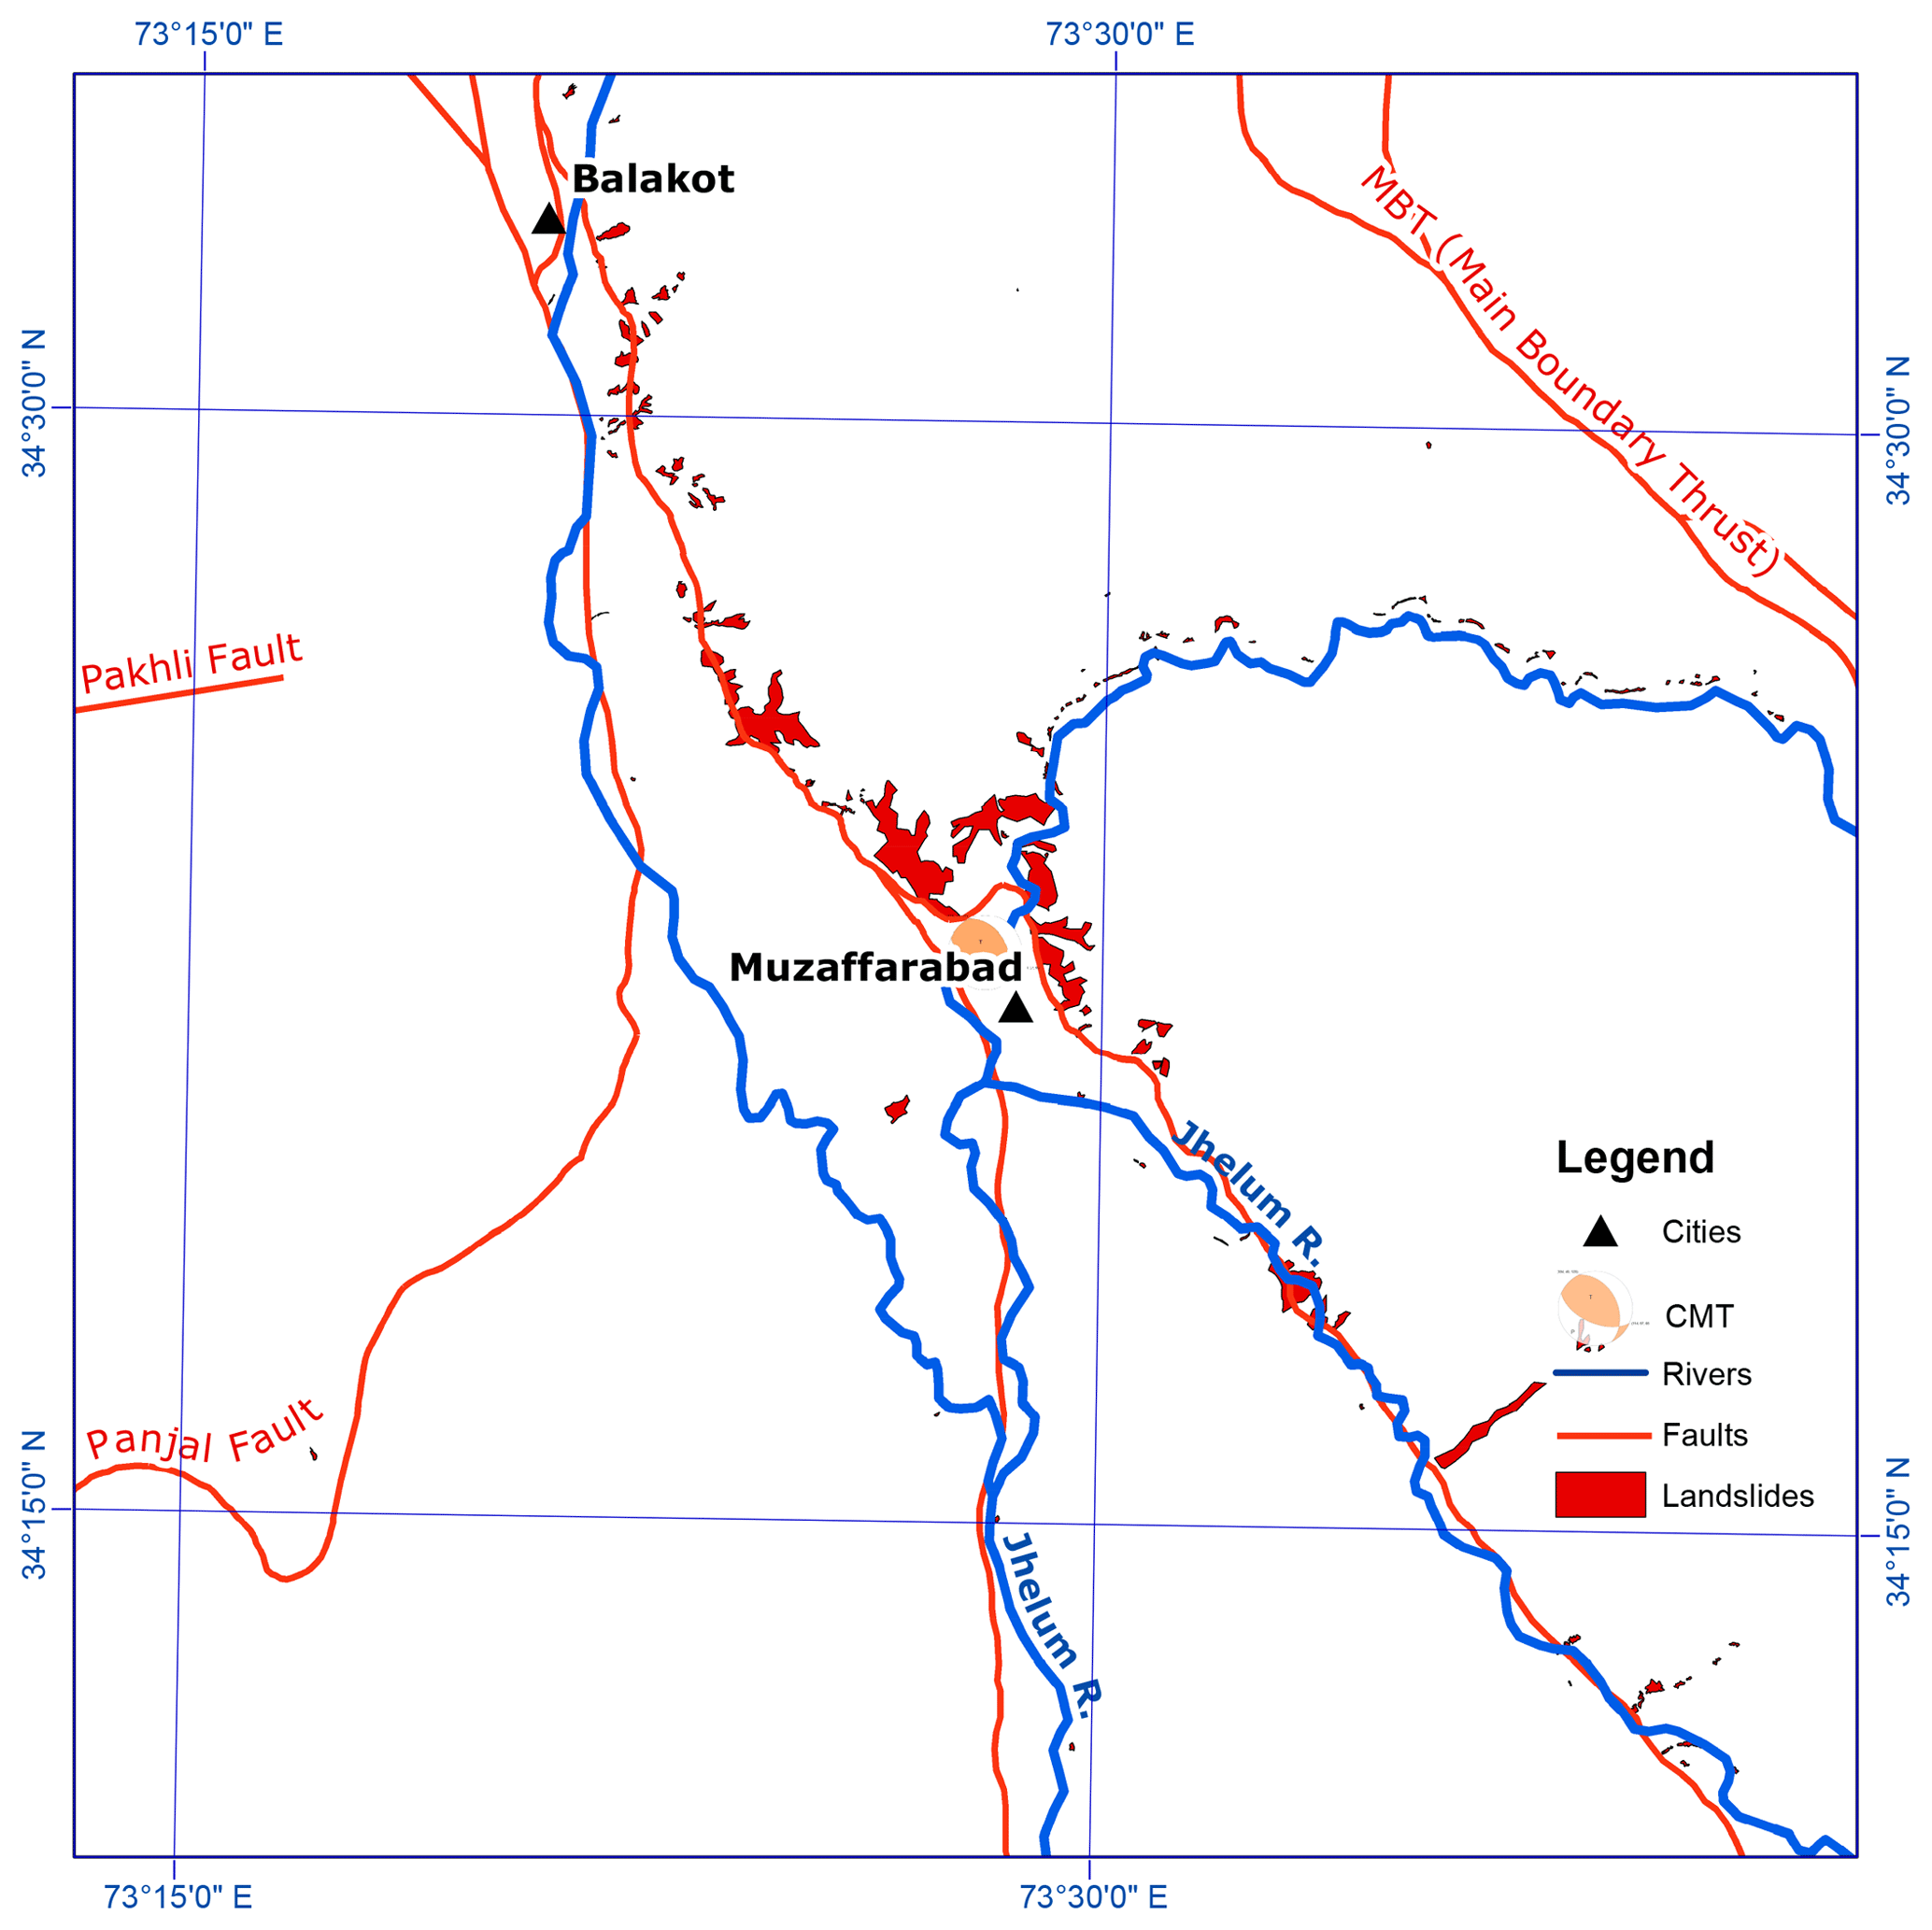
Figure 3Co-seismic landslides inventory was developed by the Humanitarian Information Center (HIC), a subsidiary organization of the United Nations Office for Coordination of Humanitarian Affairs (OCHA), which was reported by Shafique et al. (2008).
To investigate the effect of regional topography on seismic amplification, we ran the 3-D model once with a topographic surface and once without topography (having a plain surface instead, with constant elevation of 0 m. It should be noted that a choice for any other datum (e.g., the valley bottom) would actually give the same output, as long as that the reference datum is below the (deepest) valley floor to ensure that all topography and geomorphological characteristics are included in the model with topography, and excluded in the model without. As a source for the simulation we used the 3-D wave field as described in the CMT solution of 2005 Kashmir earthquake. The point source (CMT) possesses rupture characteristics and release of energy. The rupture of this earthquake had a strike of 338∘, dip of 50∘ N–NE, observed surface displacement of around 5 m and a modeled dimensions of about 70×35 km (Hussain et al., 2006; Pathier et al., 2006; Hayes et al., 2017), which is almost double the length of the study area. To include a much longer fault in our models would significantly increase the calculation time with no added value for the area that we studied. The CMT location as point source is therefore a realistic simplification that shows good correlation with damage (Raghukanth, 2008). Since SEM is efficient in simulating low-frequency ground displacement and has limited capability in simulation of high-frequency accelerations (Dhanya et al., 2016), we present our results in peak ground displacement (PGD) maps based on models with and without topography. Based on these PGD maps we created an amplification map. In order to evaluate the impact of topography, the pattern of amplification was compared with the topography of the area. The impact of topography on seismic response was also evaluated by correlating the amplification pattern with the earthquake-induced building damage and co-seismic landslide data. The damage data (Fig. 2) is taken from Shafique et al. (2012), who categorized damage to infrastructure as high, moderate and less. The landslide data (Fig. 3) is taken from the Humanitarian Information Center Pakistan (HIC-Pakistan), first published by Shafique et al. (2008). Based on the orientation of the slopes relative to the CMT location, aspects of the slopes were categorized into away (facing away from the CMT), towards (facing towards the CMT) and other (facing in directions other than towards and away). The categorization is based on 60∘ set of aspect with respect to its angle towards the CMT location.
This study has been carried out in a data-sparse environment and therefore we opted to use a homogeneous half-space (with constant meterial/velocities) model. There is not a single tomographic velocity model available at a relevant resolution. All tomographic velocity models are too coarse; the best resolution is 1∘ spatially with the crust poorly resolved (Johnson and Vincent, 2002). Seismic lines are not available for the region, and nearby seismic lines (Bhukta and Tewari, 2007) cannot provide sufficient detail on the Muzaffarabad region. However, to overcome this simplification, we have tried to establish the velocities as accurate as possible by comparing our results with observed displacements by Pathier et al. (2006), Avouac et al. (2006), Wang et al. (2007) and Leprince et al. (2008). Our displacement values, based on the homogeneous velocity model, are fairly comparable with their results and our velocities are comparable to upper crustal velocities in coarse tomographic models for the region (Johnson and Vincent, 2002; Bhukta and Tewari, 2007). Furthermore, with changing velocities, the absolute values will change but the amplification pattern will still remain the same; for events at the same location the effect of amplification is largely magnitude and velocity independent. Since our model would be, based on previous studies, homogeneous for the upper crust anyway, with no sediment inclusion, the effect of a full homogeneous model is limited. Because of the depth of the earthquake in relation to the limited size of the area the amount of energy that might have been deflected back up is very limited and considered negligible in this study. We are aware that the phenomena exists and is ignored, but any assumption on the velocity model will carry similar uncertainties as to this simplification. In a heterogeneous model, there are chances that the heterogeneity may affect amplification; therefore, to avoid any uncertainty of whether the amplification is because of the heterogeneity or topography, we have chosen to avoid any heterogeneity and adopt a homogeneous model instead.
The modeling results show that seismic response is sensitive to slope angle, aspect, geometry, and height of the terrain features. The modeled PGD amplitudes differ for a homogeneous half-space without topography (Fig. 4a) and with topography (Fig. 4b). The higher amplitudes coincide with mountain ridges, as shown in the DEM (Fig. 4c). Without topography, the PGD falls within the range of 0.23–5.8 m (Fig. 4a), but increases to a range of 0.36–7.85 m (Fig. 4b) when topography is taken into account. The difference between the PGDs of the two models (ΔPGD) is shown in Fig. 4d. The difference in PGD between a model with topography versus the same model without topography is represented in terms of amplification. For positive values we use the term amplification, meaning the seismic signal has become stronger due to topography compared to simulation without topography. On the other hand, for negative values we use de-amplification, meaning the seismic signal has become weaker due to topography compared to the simulation without topography. The topographic (de-)amplification causes local changes of approximately −2.50 to +3.00 m (Fig. 4d).

Figure 4(a) Peak ground displacement (PGD) for the model without topography, (b) PGD for the model with topography, (c) topography (ASTER Global DEM at 270 m), (d) difference between panels (a) and (b) (ΔPGD). Red colors (positive values) indicate amplification, blue (negative values) indicate de-amplification while green represents zero difference. The CMT location is represent by a red beach ball.
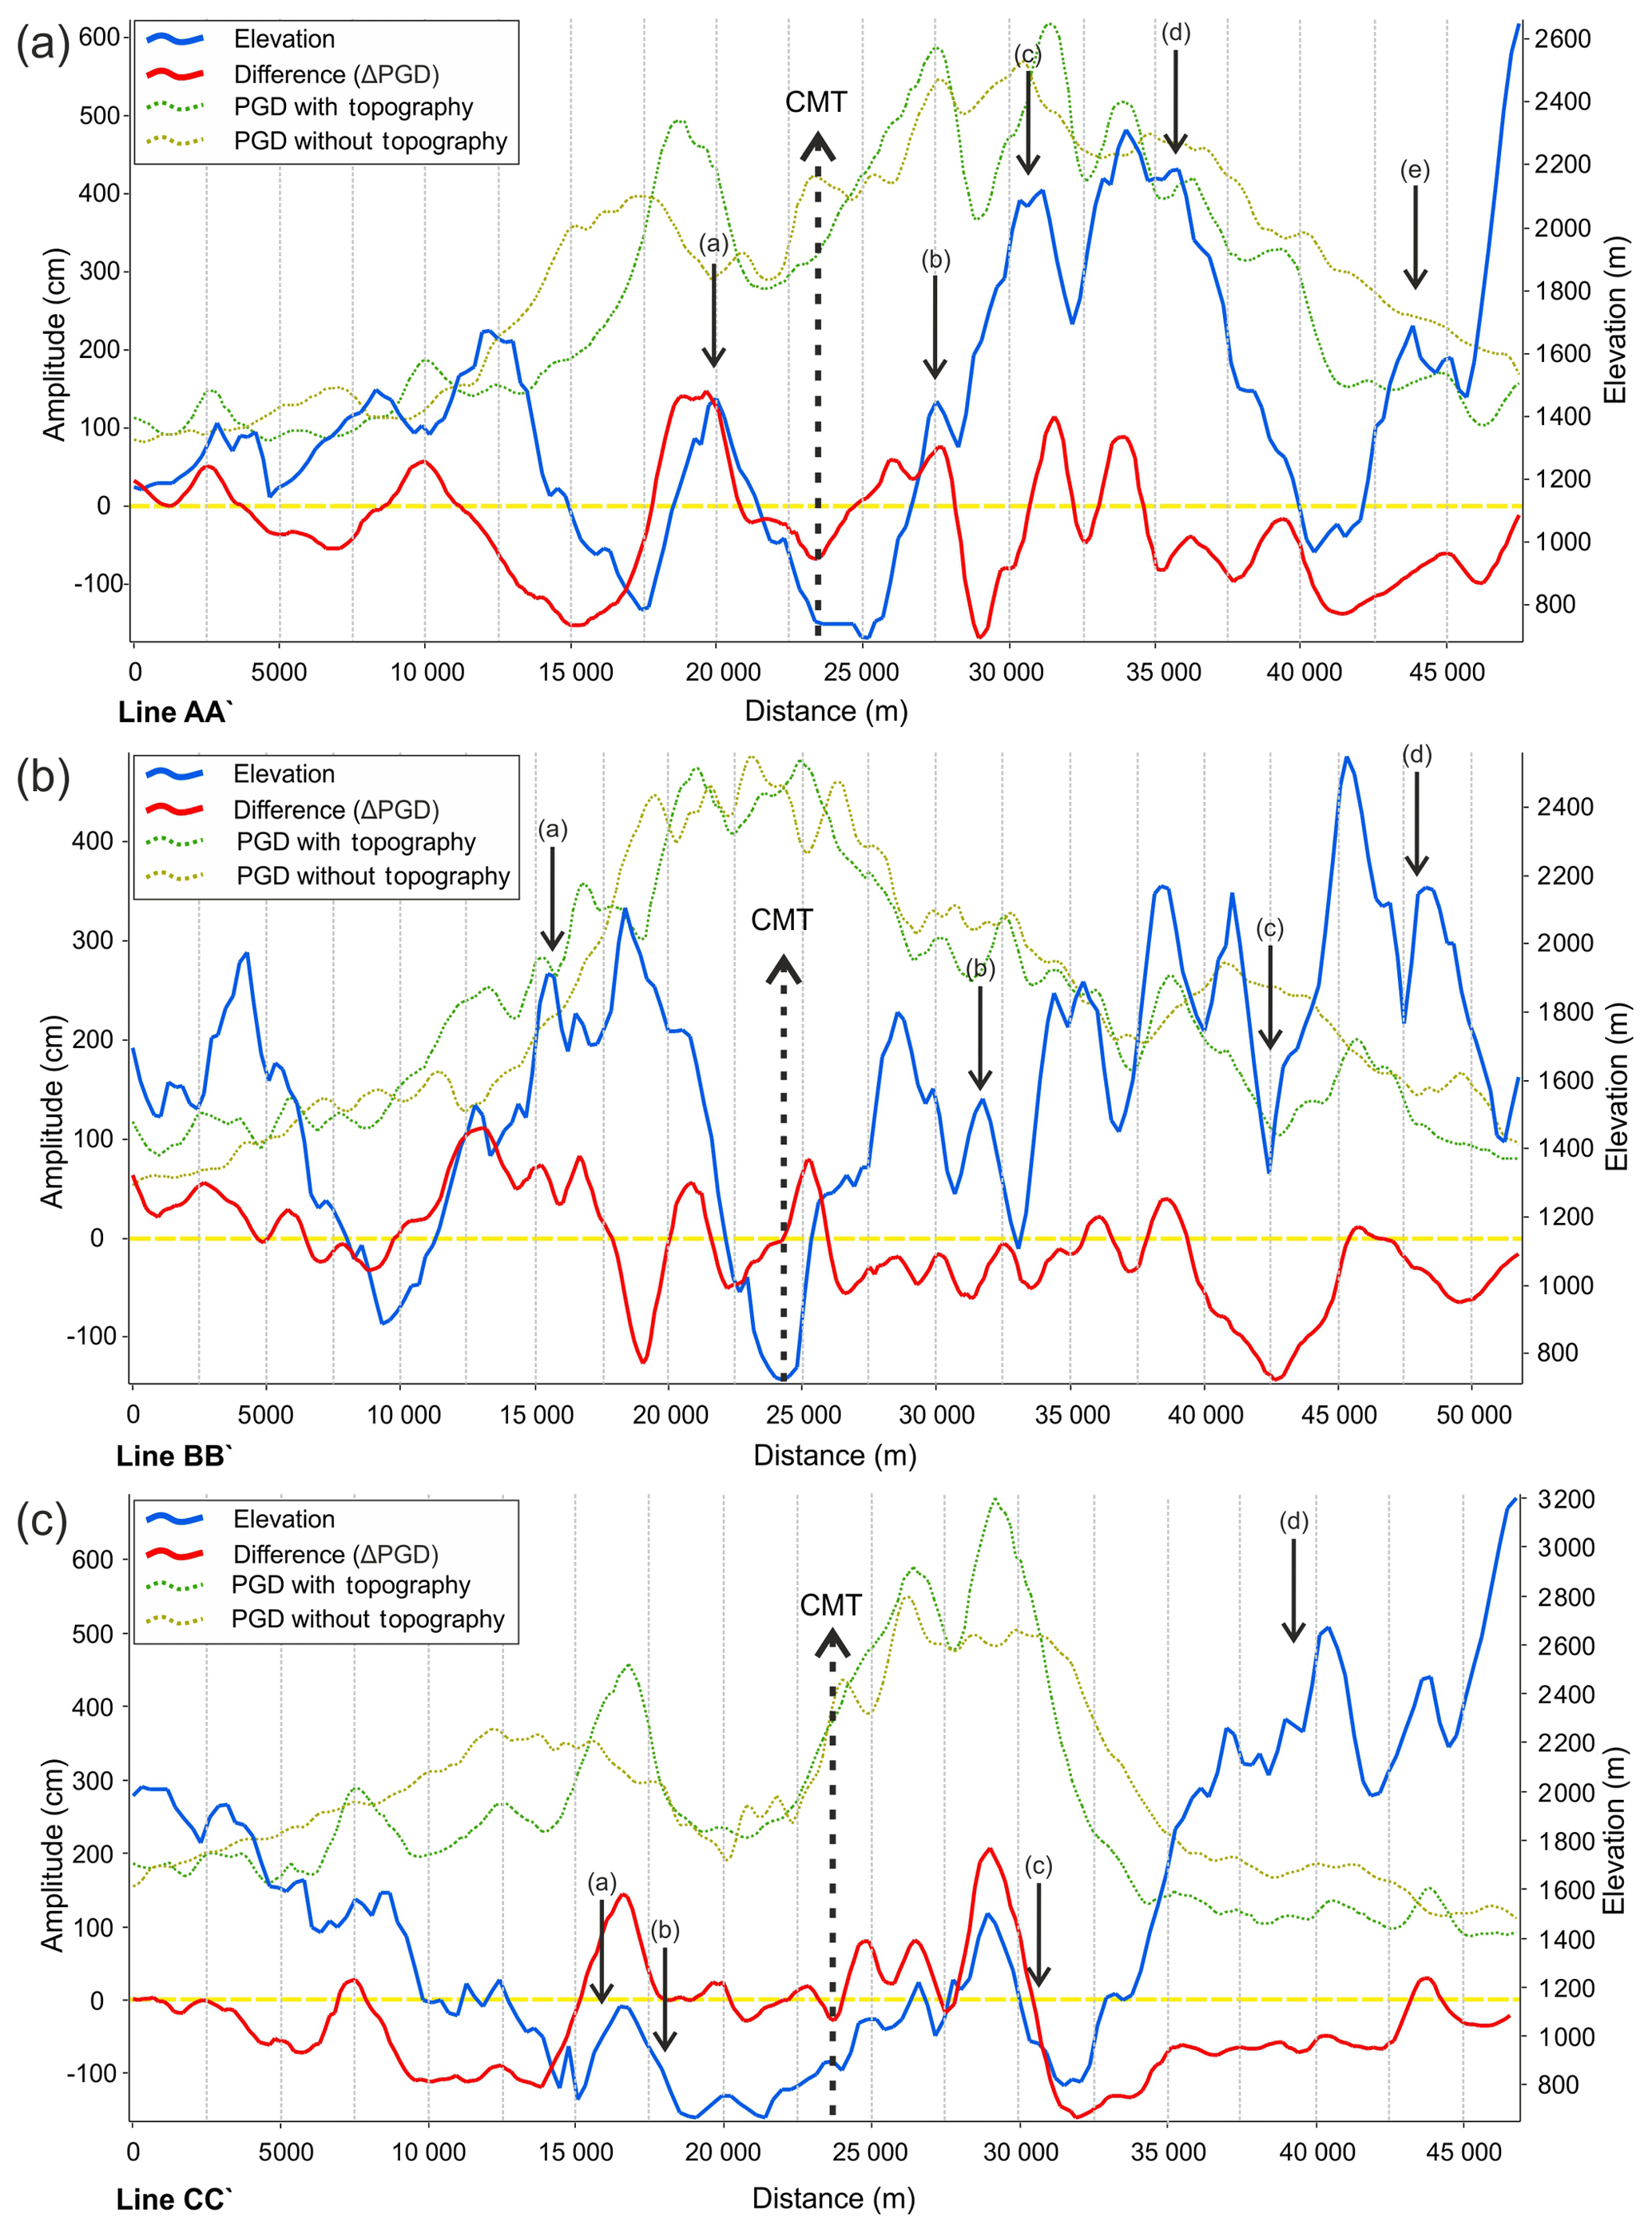
Figure 5Profile along line (a) AA', (b) BB' and (c) CC' (Fig. 4) of PGD with topography (dotted green) and without topography (dotted olive), their difference (ΔPGD, solid red) and elevation (solid blue). PGD are scaled on the left y axis, along the line, and elevation is shown on the right y axis. The profile line passes over the CMT location, which is located approximately in the center of the profile, marked with a dotted arrow line.
For a detailed analysis of the effect of topography we compare topography, PGD (with and without topography) and ΔPGD along profile lines. A comparison (Fig. 5a, b and c) is made along the white profile lines shown in Fig. 4 (AA', BB' and CC', respectively). The profile line AA' is approximately 47.5 km long, and passes over the CMT location in the center of the profile (marked with a dotted arrow). We observe, in general, amplification at ridges and de-amplification in valleys. The amplification and de-amplification related to ridges and valleys, respectively, has a shift towards the ridge slope facing away from the CMT location (Fig. 5a). We find that slopes facing away from the epicenter have an amplified seismic response. Similarly, slopes facing towards the CMT have a de-amplified seismic response. The most clear and prominent example of this amplification is at location (a) in Fig. 5a. The slope facing away from the CMT location experiences amplified PGD amplitudes. The maximum amplitudes occur at the top and near the top on the slope facing away from the CMT location. On the slope side facing towards the CMT location, we see a rapid decrease in amplification, turning into de-amplification for the lower part of the slope. We also see this pattern of decay with elevation for the amplified side but the decay there is much slower and the model shows amplified signals up until much further down the slope. Similar patterns can be observed for the ridges at locations (b) and (c): we find that the slope facing towards the source experiences de-amplification, while the slope facing away shows amplification. The same phenomena of amplification and de-amplification can also be observed on slope along profiles BB' and CC' (at locations a, b and c) in Fig. 5b and c for profile lines BB' and CC', respectively. The trapping of energy due to the shape of the mountain is observed, and the reflection of energy towards the top of the mountain leads to increased amplification effects with an increase in elevation from the base of the mountain, particularly on the side of the mountain that is directly exposed to the incoming seismic waves. A clear shadow effects due to terrain features can be seen at some locations. At locations (d) and (e) of Fig. 5a, we observe that a deep valley blocks the continuation of seismic wave energy into the next topographic high, thereby leading to de-amplification. Similarly, at location (d) in Fig. 5b and c, we observe a similar shadow effect, and resulting de-amplification, due to blocking of seismic waves by deep valleys between the ridge and the CMT.

Figure 6The difference in peak ground displacement (ΔPGD) between the models with and without topography (Fig. 4d) compared with damage data of Shafique et al. (2012). The top part shows the relation between damaged areas with (de-)amplification in table form. The bottom part shows the distribution of damage with ΔPGD graphically. The high damage zone constitutes 11 % of the Muzaffarabad damaged area, while moderate and low damage zones respectively cover 51 % and 38 % of the damaged area.
The ΔPGD shown in Fig. 4d is compared with damage data (Fig. 2) of the 2005 Kashmir earthquake in Fig. 6. Shafique et al. (2012) divided damage into three categories; high (red), moderate (yellow) and low (green). The high damage zone constitutes 11 % of the damaged part of the Muzaffarabad area, while moderate and low damage zones respectively cover 51 % and 38 % of the damaged area. There is a clear correlation between (de-)amplification and damage level. For the highest class of damage, 98 % of the damaged buildings are found in the amplified zone (positive ΔPGD, Fig. 4d). On the other hand, 80 % of the least damaged buildings lies within the de-amplified zone. Overall the distribution of damage is equally distributed over amplified and de-amplified zones, but amplification does have an impact on the level of damage.

Figure 7The difference in peak ground displacement (ΔPGD) between the models with and without topography (Fig. 4d) is compared with certain aspects of the study area. Aspects are categorized as away (facing away from the epicenter), towards (facing the epicenter) and other (facing a direction other than towards or away). The categorization is based on 60∘ offset of aspect with respect to its angle towards the CMT.
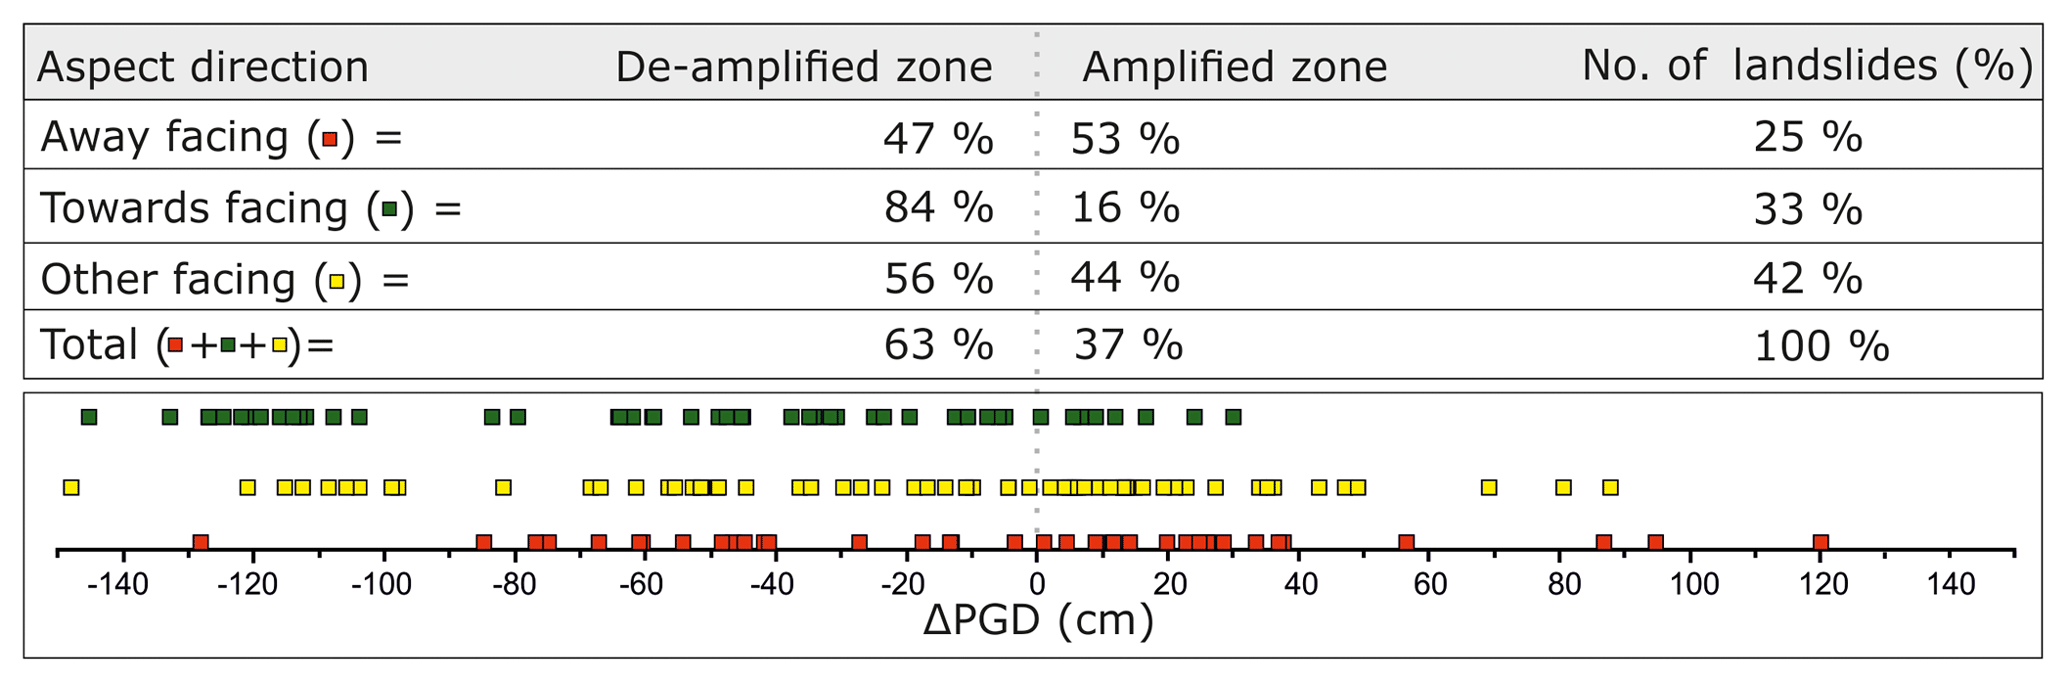
Figure 8The difference in peak ground displacement (ΔPGD) between the models with and without topography (Fig. 4d) is compared with certain aspects of earthquake-induced landslides (source: HIC-Pakistan, courtesy of Shafique et al., 2008). Aspects are categorized as away (facing away from the epicenter), towards (facing the epicenter) and other (facing a direction other than towards or away). The categorization is based on 60∘ offset of aspect with respect to its angle towards the CMT.
Following the hypothesis that the direction of slopes has an impact on the amplification we would expect that the away-facing slopes show a relatively higher ΔPGD than slopes facing towards or any other direction. Analysis of the terrain shows that 30 % of the slopes face away from the CMT location, 35 % face towards the CMT location and 35 % face another direction (Fig. 7). On average we observe that around two-thirds of the area (63 %) experiences de-amplification, and around one-third (37 %) shows amplification. When comparing these statistics with the statistics for the different aspect classes a relative increase is observed for slopes that face away from the CMT location to 47 %. Conversely, a decrease is observed, to 25 %, for slopes facing towards the CMT location. So, the effect of slope direction on the amplification is significant. In line with these observations, there have been studies (e.g., Ashford and Sitar, 1997; Ashford et al., 1997) that suggested a correlation between landslide occurrence and earthquake location as a possible result of amplification (Shafique et al., 2008; Meunier et al., 2008; Qi et al., 2010; Xu et al., 2013). For the Muzaffarabad area, the ΔPGD was compared with landslide data (Fig. 3) collected shortly after the earthquake by HIC-Pakistan (Shafique et al., 2008; Fig. 8). This shows a similar pattern as the previous analysis. On slopes facing away from the CMT location we observe 53 % of the landslides in the amplified zone, whereas on slopes facing towards the CMT this is only 16 %.
This study used spectral-element modeling and numerical modeling to evaluate the impact of topography on ground shaking induced by the 2005 Kashmir earthquake. There are several factors that amplify ground shaking at the earth’s surface, such as earthquake magnitude, depth of hypocenter, distance from the epicenter, medium of the seismic waves, topography and site-specific geology (Kramer, 1996; Wills and Clahan, 2006; Shafique and van der Meijde, 2015; Khan et al., 2017). Thus, to ensure that only topographic amplification is isolated, we have two models with exactly the same characteristics and simulation parameters: all factors are kept constant except for topography. Therefore, the resulting amplification is only due to topography, as it is the only variable. Using the CMT location (the point of maximum release of energy) of the 2005 Kashmir earthquake resulted in obtaining the required peak amplitudes as output. Instead of using the CMT point in lieu of a full-finite fault solution in the simulations, sub-sources along the fault rupture could have been used (e.g., Lee et al., 2014a, 2016; Zhang and Xu, 2017). This might have influenced the analysis but we have opted to focus on the maximum release point since it has been shown to have a strong relation with damage patterns (Raghukanth, 2008).
Our results show that by incorporating topography in spectral-element modeling, the minimum and maximum amplitude of the peak ground displacement changes. The results show manifestations of topographic influence on building damage during the 2005 Kashmir earthquake. We found that the majority (98 %) of the high damaged area lies in the topographically amplified response region. Conversely, the majority (80 %) of the area with low damage lies in the topographically de-amplified response region. The relation between damage and amplification indicates that the topography was a contributing factor to the building damages during the 2005 Kashmir earthquake. It is also important to consider other factors that could play a role in damage to infrastructure. Shafique et al. (2011b) has shown that regolith thickness had an influence on damages during the 2005 Kashmir earthquake. Actual damage is also dependent on building quality. Although the Asian Development Bank and World Bank (2005) reported that building material and poor construction was homogeneous in the area, Shafique et al. (2011b) observed differences between different sectors in the area. Poor construction practices such as connected buildings and poor reinforcements, are also considered as a contributing factor for damage in the area in response to the 2005 Kashmir earthquake (Shafique et al., 2011b) and might have influenced, in a positive or negative sense, the comparison between amplification and damage.
Most of the structures in the area are low to medium-high, which are normally most sensitive to high-frequency amplification effects. However, considering such high PGDs in this area, combined with non-earthquake proof building styles, the relation between PGD and damage might not be optimal but is thought to show a strong correlation. Furthermore, during this study, PGD, peak ground velocity (PGV) and peak ground acceleration (PGA) have been found to be spatially very strongly correlated, with only some minor amplitude deviations at specific topographic features. So the overall pattern in a comparison would still look very similar to the damage vs ΔPGD comparison we show in the paper.
The directions of incident seismic waves have a significant impact on distribution of seismic-induced landslides (Ashford and Sitar, 1997; Shafique et al., 2008; Meunier et al., 2008; Qi et al., 2010; Xu et al., 2013). In our results this effect is not directly clear. For example, only 37 % of the landslides fall within the amplified zone; the other 63 % fall within the de-amplified zone (Fig. 8). However, when the relative distribution of landslides is compared to slopes facing away (prone to amplification due to focusing of seismic waves directly compared to slope facing towards) versus slopes facing towards the CMT location, a correlation is observed. The majority of the landslides on slopes facing away from the CMT location are in the amplified zone (53 %) while for slopes facing towards the CMT location this is only 16 %. These figures are much lower than Shafique et al. (2008) results for the same area and the same landslide catalogue. The main difference between their study and ours is the location to which the slope direction is compared. While Shafique et al. (2008) used the onset of the earthquake (the Epicenter location, Fig. 1), in our modeling we used the CMT location (the location of maximum energy release, Fig. 1). It was assumed that the maximum seismic amplitudes and corresponding amplification will lead to the occurrence of landslides but apparently this is not true. Based on the comparison of the two results it is very likely that a much lower displacement value may have already triggered the landslides. The threshold at which the landslides will occur cannot be derived from this study but it is evident that already at much earlier stage in the earthquake propagation enough energy is created to activate landslides. The maximum energy release related to the CMT location occurs only later in the earthquake process and clearly has less control since the critical ground displacement required for activating a landslide might have already been exceeded. This can explain the abundance of landslides in the de-amplified zone based on modeling from the CMT location.
The aforementioned evidence of amplified seismic response on slopes facing away from the source could be a possible reason behind triggering landslides. However, it is important to consider complications associated with landslides. Landslides induced by the 2005 Kashmir earthquake have been addressed in several studies, from different perspectives. Owen et al. (2008) reported that more than half of the landslides were in some way associated with road construction and other human activity. According to Kamp et al. (2008), bedrock lithology (comprising highly fractured slate, shale, dolomite, limestone and clastic sediments) was the most important landslide controlling parameter during the 2005 Kashmir earthquake. Dellow et al. (2007) reported a highly asymmetric size and distribution of landslides induced by the 2005 Kashmir earthquake. According to the aforementioned paper, the landslides can be classified into the following three types: (1) landslides formed over/adjacent to the fault rupture, (2) landslides which extend about 10–20 km from the fault trace on the hanging side of the fault and (3) landslides on the footwall side which are generally rare except within 2–3 km of the fault trace. And as mentioned earlier, Shafique et al. (2008) compared the aspect of landslides relative to the initial rupture point and found that about 80 % of the landslides had an aspect facing away from the rupture point. In summary, the major controlling factors for landslides induced by the 2005 Kashmir earthquake were (1) human activity (Owen et al., 2008), (2) bedrock lithology (Kamp et al., 2008), (3) proximity with reference to fault trace (Dellow et al., 2007) and (4) slope direction with respect to source (Shafique et al., 2008). In our study, we analyzed landslide aspects with respect to the point of maximum release of energy (CMT solution). The percentage of landslides facing away was found to be 25 %, facing towards 33 % and facing other directions 42 %. Keeping in mind factors such as human activity and bedrock lithology beside the relation of landslides with the fault trace, it is uncertain at which stage of the rupture the landslides have been triggered. It could be because of the initial rupture (used by Shafique et al., 2008), the fault trace (Owen et al., 2008), the moment of maximum release of energy (the CMT solution location used in this study) or somewhere in between.
The 2005 Kashmir earthquake was a shallow earthquake. In such case a seismic wave field will reach the surface at an angle, rather than vertical when originating a larger distance away. This can lead to the creation of a so-called shadow zone effect due to deep valley blocking the propagation of a seismic wave field into a topographic feature. This phenomenon has also been observed in this study. Because of this shadow effect, ridges show de-amplification instead of amplification (location (d) and (e) in Fig. 5a, and location (d) in Fig. 5b). The detailed topography of low areas can be found in Fig. 4c with blue colors indicating deep valleys. These deep valleys can also be seen with the blue profile line in Fig. 5, for example, around distance 32 500 and 40 000 m in Fig. 5a, 42 500 m in Fig. 5b and 31 000 m in Fig. 5c. These valleys restricted the impact of seismic waves on the next ridge(s) away from the CMT. Thus the ridges, which are normally supposed to show amplification because of trapping, show de-amplification instead. This effect however, may not be visible for deep-seated seismic sources or sources at a larger epicentral distance. The deeper or further away the source of the earthquake, the more vertical will be the incoming seismic wave field. A similar effect is possible if we have significantly reduced seismic velocities close to the surface, due to, e.g., sediments, that will also turn the wave field towards the vertical. The results of the study can be used as an important parameter for seismic microzonation of the study area to mitigate the negative impacts of earthquakes.
Topography affects the diffraction and reflection of incident seismic waves, thereby amplifying or de-amplifying the seismic response. The impact of topography on seismic-induced ground shaking was evaluated for the 2005 Kashmir earthquake in Muzaffarabad using a spectral-element method, SPECFEM3D. An ASTER Global DEM, re-sampled to 270 m spatial resolution, was used for representing the topography of the study area. A mesh of 270 m spatial resolution was used to model the topography and geometry of the topography and subsurface conditions in the Muzaffarabad region. Overall, topography-induced amplification of seismic response is found on ridges and slopes facing away from the CMT location and de-amplification is found in valleys and at the bottom of slopes facing towards the CMT location, which is consistent with previous studies. The study demonstrates that topography changed the PGD values from approximately −2.5 to +3 m when compared to a plain mesh surface.
It is shown that topography played a significant role in damage induced by the 2005 Kashmir earthquake: 98 % of the highly damaged area lies within the topographically amplified seismic response area.
All data sources have been cited in this article, and the results can be reproduced by adopting the methodology.
The conceptualization was done by SK, MvdM, HvdW, and MS. SK, MvdM, and HvdW planned and performed methodology. SK, HvdW, and MvdM validated the methodology. SK, MvdM, HvdW, and MS analyzed the results. SK, MvdM, and HvdW prepared the original draft, while all authors contributed to the review and editing. Visualization and graphics were designed by SK and MvdM. MvdM, HwdW, and MS supervised the research work. All authors have read and reviewed the paper.
The authors declare that they have no conflict of interest.
This article is part of the special issue “Advances in computational modelling of natural hazards and geohazards”. It is a result of the Geoprocesses, geohazards – CSDMS 2018, Boulder, USA, 22–24 May 2018.
The damage data were obtained from Shafique et al. (2012) and are based on a post-earthquake SPOT5-image combined with field observations. The landslide inventory was developed by the Humanitarian Information Center (HIC), a subsidiary organization of the United Nations Office for the Coordination of Humanitarian Affairs (OCHA). We are thankful to Steven de Jong and one anonymous referee for their valuable input.
This research has been supported by the University of Twente (grant no. 93003030) and partial funding of Bacha Khan University Charsadda.
This paper was edited by Maria Ana Baptista and reviewed by Steven de Jong and one anonymous referee.
Ali, Z., Qaisar, M., Mahmood, T., Shah, M. A., Iqbal, T., Serva, L., Michetti, A. M., and Burton, P. W.: The Muzaffarabad, Pakistan, earthquake of 8 October 2005: surface faulting, environmental effects and macroseismic intensity, Geol. Soc. Spec. Publ., 316, 155–172, 2009. a
Ashford, S. A. and Sitar, N.: Analysis of topographic amplification of inclined shear waves in a steep coastal bluff, B. Seismol. Soc. Am., 87, 692–700, 1997. a, b
Ashford, S. A., Sitar, N., Lysmer, J., and Deng, N.: Topographic effects on the seismic response of steep slopes, B. Seismol. Soc. Am., 87, 701–709, 1997. a
Asian Development Bank and World Bank: Preliminary Damage and Needs Assessment-Pakistan 2005 Earthquake, Islamabad, Pakistan, 2005. a
Athanasopoulos, G., Pelekis, P., and Leonidou, E.: Effects of surface topography on seismic ground response in the Egion (Greece) 15 June 1995 earthquake, Soil Dyn. Earthq. Eng., 18, 135–149, 1999. a
Avouac, J.-P., Ayoub, F., Leprince, S., Konca, O., and Helmberger, D. V.: The 2005, M w 7.6 Kashmir earthquake: sub-pixel correlation of ASTER images and seismic waveforms analysis, Earth Planet. Sc. Lett., 249, 514–528, 2006. a, b, c
Bassin, C., Laske, G., and Masters, G.: The current limits of resolution for surface wave tomography in North America, in: EOS Trans AGU, 81, F897, Washington, D.C., USA, 2000. a
Bauer, R. A., Kiefer, J., and Hester, N.: Soil amplification maps for estimating earthquake ground motions in the Central US, Eng. Geol., 62, 7–17, 2001. a
Bhukta, S. K. and Tewari, H.: Crustal Seismic Structure in Jammu and Kashmir Region, India, Geol. Soc. India, 69, 755–764, 2007. a, b
Bouckovalas, G. D. and Papadimitriou, A. G.: Numerical evaluation of slope topography effects on seismic ground motion, Soil Dyn. Earthq. Eng., 25, 547–558, 2005. a
Casarotti, E., Stupazzini, M., Lee, S. J., Komatitsch, D., Piersanti, A., and Tromp, J.: CUBIT and seismic wave propagation based upon the spectral-element method: An advanced unstructured mesher for complex 3D geological media, in: Proceedings of the 16th International Meshing Roundtable, 579–597, Springer, Berlin, Heidelberg, Germany, 2008. a
Computational Infrastructure for Geodynamics: SPECFEM3D Cartesian, available at: https://geodynamics.org/cig/software/specfem3d/ (last access: 2 January 2019), 2016. a
Dellow, G., Ali, Q., Ali, S., Hussain, S., Khazai, B., and Nisar, A.: Preliminary reconnaissance report for the Kashmir earthquake of 8 October 2005, Bulletin of the New Zealand Society for Earthquake Engineering, 40, 18–24, https://doi.org/10.5459/bnzsee.40.1.18-24, 2007. a, b
Dhanya, J., Gade, M., and Raghukanth, S.: Ground motion estimation during 25th April 2015 Nepal earthquake, Acta Geod. Geophys., 52, 69–93, 2016. a
Dunning, S., Mitchell, W., Rosser, N., and Petley, D.: The Hattian Bala rock avalanche and associated landslides triggered by the Kashmir Earthquake of 8 October 2005, Eng. Geol., 93, 130–144, 2007. a
Dziewoński, A., Chou, T.-A., and Woodhouse, J.: Determination of earthquake source parameters from waveform data for studies of global and regional seismicity, J. Geophys. Res.-Sol. Ea., 86, 2825–2852, 1981. a
Ekström, G., Nettles, M., and Dziewoński, A.: The global CMT project 2004–2010: Centroid-moment tensors for 13,017 earthquakes, Phys. Earth Planet. In., 200, 1–9, 2012. a
Evangelista, L., del Gaudio, S., d'Onofrio, A., Festa, G., Santo, A., Iervolino, I., and Silvestri, F.: 3D Spectral Element Model for Numerical Simulation of the Seismic Ground Motion in the Aterno Valley (Italy), in: High Performance Scientific Computing Using Distributed Infrastructures: Results and Scientific Applications Derived from the Italian Pon Recas Project, edited by: Andronico, G., Bellotti, R., De Nardo, G., Laccetti, G., Maggi, G., Merola, L., Russo, G., Silvestris, L., Tangaro, S., and Tassi, E., chap. 10, p. 363, World Scientific, Singapore, 2016. a
Hartzell, S. H., Carver, D. L., and King, K. W.: Initial investigation of site and topographic effects at Robinwood Ridge, California, B. Seismol. Soc. Am., 84, 1336–1349, 1994. a
Hayes, G. P., Meyers, E. K., Dewey, J. W., Briggs, R. W., Earle, P. S., Benz, H. M., Smoczyk, G. M., Flamme, H. E., Barnhart, W. D., Gold, R. D., and Furlong, K. P.: Tectonic summaries of magnitude 7 and greater earthquakes from 2000 to 2015, Tech. rep., No. 2016-1192. US Geological Survey, Reston, VA, USA, 2017. a
Hough, S. E., Altidor, J. R., Anglade, D., Given, D., Janvier, M. G., Maharrey, J. Z., Meremonte, M., Mildor, B. S.-L., Prepetit, C., and Yong, A.: Localized damage caused by topographic amplification during the 2010 M 7.0 Haiti earthquake, Nat. Geosci., 3, 778–782, 2010. a, b, c
Hussain, A., Yeats, R. S., and MonaLisa: Geological setting of the 8 October 2005 Kashmir earthquake, J. Seismol., 13, 315–325, 2009. a, b
Hussain, S., Nisar, A., Khazai, B., and Dellow, G.: The Kashmir earthquake of October 8, 2005: impacts in Pakistan, Earthquake Engineering Research Institute Special Paper, 8, Oakland, CA, USA, 2006. a
Johnson, M. and Vincent, C.: Development and testing of a 3D velocity model for improved event location: a case study for the India-Pakistan region, B. Seismol. Soc. Am., 92, 2893–2910, 2002. a, b
Kamp, U., Growley, B. J., Khattak, G. A., and Owen, L. A.: GIS-based landslide susceptibility mapping for the 2005 Kashmir earthquake region, Geomorphology, 101, 631–642, 2008. a, b
Kamp, U., Owen, L. A., Growley, B. J., and Khattak, G. A.: Back analysis of landslide susceptibility zonation mapping for the 2005 Kashmir earthquake: an assessment of the reliability of susceptibility zoning maps, Nat. Hazards, 54, 1–25, 2010. a
Khan, S., van der Meijde, M., van der Werff, H., and Shafique, M.: Impact of mesh and DEM Resolutions in SEM Simulation of 3D Seismic Response, B. Seismol. Soc. Am., 107, 2151–2159, https://doi.org/10.1785/0120160213, 2017. a, b, c
Komatitsch, D. and Tromp, J.: Introduction to the spectral element method for three-dimensional seismic wave propagation, Geophys. J. Int., 139, 806–822, 1999. a, b
Komatitsch, D. and Vilotte, J.-P.: The spectral element method: An efficient tool to simulate the seismic response of 2D and 3D geological structures, B. Seismol. Soc. Am., 88, 368–392, 1998. a
Komatitsch, D., Ritsema, J., and Tromp, J.: The spectral-element method, Beowulf computing, and global seismology, Science, 298, 1737–1742, 2002. a
Komatitsch, D., Liu, Q., Tromp, J., Süss, P., Stidham, C., and Shaw, J. H.: Simulations of ground motion in the Los Angeles basin based upon the spectral-element method, B. Seismol. Soc. Am., 94, 187–206, 2004. a, b
Kramer, S.: Geotechnical Earthquake Engineering, Pearson Education, Delhi, India, 1996. a, b
Kumagai, H., Saito, T., O'Brien, G., and Yamashina, T.: Characterization of scattered seismic wavefields simulated in heterogeneous media with topography, J. Geophys. Res.-Sol. Ea., 116, B03308, https://doi.org/10.1029/2010JB007718, 2011. a
Lee, S.-J., Chen, H.-W., Liu, Q., Komatitsch, D., Huang, B.-S., and Tromp, J.: Three-dimensional simulations of seismic-wave propagation in the Taipei basin with realistic topography based upon the spectral-element method, B. Seismol. Soc. Am., 98, 253–264, 2008. a, b
Lee, S.-J., Chan, Y.-C., Komatitsch, D., Huang, B.-S., and Tromp, J.: Effects of realistic surface topography on seismic ground motion in the Yangminshan region of Taiwan based upon the spectral-element method and LiDAR DTM, B. Seismol. Soc. Am., 99, 681–693, 2009a. a, b, c, d, e, f, g
Lee, S.-J., Komatitsch, D., Huang, B.-S., and Tromp, J.: Effects of topography on seismic-wave propagation: An example from northern Taiwan, B. Seismol. Soc. Am., 99, 314–325, 2009b. a, b, c, d
Lee, S.-J., Liang, W.-T., Cheng, H.-W., Tu, F.-S., Ma, K.-F., Tsuruoka, H., Kawakatsu, H., Huang, B.-S., and Liu, C.-C.: Towards real-time regional earthquake simulation, I: Real-time moment tensor monitoring (RMT) for regional events in Taiwan, Geophys. J. Int., 196, 432–446, https://doi.org/10.1093/gji/ggt371, 2013. a
Lee, S.-J., Huang, H.-H., Shyu, J. B. H., Yeh, T.-Y., and Lin, T.-C.: Numerical earthquake model of the 31 October 2013 Ruisui, Taiwan, earthquake: Source rupture process and seismic wave propagation, J. Asian Earth Sci., 96, 374–385, 2014a. a
Lee, S.-J., Liu, Q., Tromp, J., Komatitsch, D., Liang, W.-T., and Huang, B.-S.: Toward real-time regional earthquake simulation, II: Real-time Online earthquake Simulation (ROS) of Taiwan earthquakes, J. Asian Earth Sci., 87, 56–68, 2014b. a
Lee, S.-J., Yeh, T.-Y., and Lin, Y.-Y.: Anomalously large ground motion in the 2016 ML 6.6 Meinong, Taiwan, earthquake: A synergy effect of source rupture and site amplification, Seismol. Res. Lett., 87, 1319–1326, 2016. a
Leprince, S., Berthier, E., Ayoub, F., Delacourt, C., and Avouac, J.-P.: Monitoring earth surface dynamics with optical imagery, Eos, Transactions American Geophysical Union, 89, 1–2, 2008. a, b
Liu, Q., Yu, Y., and Zhang, X.: Three-dimensional simulations of strong ground motion in the Shidian basin based upon the spectral-element method, Earthq. Eng. Eng. Vib., 14, 385–398, https://doi.org/10.1007/s11803-015-0031-4, 2015. a
Magnoni, F., Casarotti, E., Michelini, A., Piersanti, A., Komatitsch, D., Peter, D., and Tromp, J.: Spectral-element simulations of seismic waves generated by the 2009 L'Aquila earthquake, B. Seismol. Soc. Am., 104, 73–94, 2014. a
Makra, K. and Raptakis, D.: Uncertainties on Vs profiles and site response at a vertical strong motion array, Bulletin of the Geological Society of Greece, 50, 1525–1534, 2016. a
Meunier, P., Hovius, N., and Haines, J. A.: Topographic site effects and the location of earthquake induced landslides, Earth Planet. Sc. Lett., 275, 221–232, 2008. a, b
Owen, L. A., Kamp, U., Khattak, G. A., Harp, E. L., Keefer, D. K., and Bauer, M. A.: Landslides triggered by the 8 October 2005 Kashmir earthquake, Geomorphology, 94, 1–9, 2008. a, b, c
Paolucci, R., Evangelista, L., Mazzieri, I., and Schiappapietra, E.: The 3D numerical simulation of near-source ground motion during the Marsica earthquake, central Italy, 100years later, Soil Dyn. Earthq. Eng., 91, 39–52, 2016. a
Parsons, T., Yeats, R. S., Yagi, Y., and Hussain, A.: Static stress change from the 8 October, 2005 M =7.6 Kashmir earthquake, Geophys. Res. Lett., 33, L06304, https://doi.org/10.1029/2005GL025429, 2006. a
Patera, A. T.: A spectral element method for fluid dynamics: laminar flow in a channel expansion, J. Comput. Phys., 54, 468–488, 1984. a
Pathier, E., Fielding, E., Wright, T., Walker, R., Parsons, B., and Hensley, S.: Displacement field and slip distribution of the 2005 Kashmir earthquake from SAR imagery, Geophys. Res. Lett., 33, L20310, https://doi.org/10.1029/2006GL027193, 2006. a, b, c, d
Peter, D., Komatitsch, D., Luo, Y., Martin, R., Le Goff, N., Casarotti, E., Le Loher, P., Magnoni, F., Liu, Q., and Blitz, C.: Forward and adjoint simulations of seismic wave propagation on fully unstructured hexahedral meshes, Geophysical Journal International, 186, 721–739, 2011. a
Pilz, M., Parolai, S., Stupazzini, M., Paolucci, R., and Zschau, J.: Modelling basin effects on earthquake ground motion in the Santiago de Chile basin by a spectral element code, Geophys. J. Int., 187, 929–945, 2011. a
Qi, S., Xu, Q., Lan, H., Zhang, B., and Liu, J.: Spatial distribution analysis of landslides triggered by 2008.5.12 Wenchuan Earthquake, China, Eng. Geol., 116, 95–108, 2010. a, b
Raghukanth, S.: Ground motion estimation during the Kashmir earthquake of 8th October 2005, Nat. Hazards, 46, 1–13, 2008. a, b
Restrepo, D., Bielak, J., Serrano, R., Gómez, J., and Jaramillo, J.: Effects of realistic topography on the ground motion of the Colombian Andes – A case study at the Aburrá Valley, Antioquia, Geophys. J. Int., 204, 1801–1816, https://doi.org/10.1093/gji/ggv556, 2016. a, b
Saba, S. B., van der Meijde, M., and van der Werff, H.: Spatiotemporal landslide detection for the 2005 Kashmir earthquake region, Geomorphology, 124, 17–25, 2010. a
Sandia National Laboratories: CUBIT 13.0, available at: https://cubit.sandia.gov/ (last access: 2 January 2019), 2011. a
Sepúlveda, S. A., Murphy, W., Jibson, R. W., and Petley, D. N.: Seismically induced rock slope failures resulting from topographic amplification of strong ground motions: The case of Pacoima Canyon, California, Eng. Geol., 80, 336–348, 2005. a
Shafique, M. and van der Meijde, M.: Impact of uncertainty in remote sensing DEMs on topographic amplification of seismic response and Vs 30, Arab. J. Geosci., 8, 2237–2245, 2015. a, b, c, d
Shafique, M., van der Meijde, M., Kerle, N., van der Meer, F., and Khan, M. A.: Predicting topographic aggravation of seismic ground shaking by applying geospatial tools, Journal of Himalayan Earth Sciences, 41, 33–43, 2008. a, b, c, d, e, f, g, h, i, j, k, l
Shafique, M., van der Meijde, M., Kerle, N., and van der Meer, F.: Impact of DEM source and resolution on topographic seismic amplification, Int. J. Appl. Earth Obs., 13, 420–427, 2011a. a
Shafique, M., van der Meijde, M., and Rossiter, D. G.: Geophysical and remote sensing-based approach to model regolith thickness in a data-sparse environment, Catena, 87, 11–19, 2011b. a, b, c
Shafique, M., van der Meijde, M., and van der Werff, H.: Evaluation of remote sensing-based seismic site characterization using earthquake damage data, Terra Nova, 24, 123–129, 2012. a, b, c, d, e
Smerzini, C., Pitilakis, K., and Hashemi, K.: Evaluation of earthquake ground motion and site effects in the Thessaloniki urban area by 3D finite-fault numerical simulations, B. Earthq. Eng., 15, 787–812, https://doi.org/10.1007/s10518-016-9977-5, 2017. a
Spudich, P., Hellweg, M., and Lee, W.: Directional topographic site response at Tarzana observed in aftershocks of the 1994 Northridge, California, earthquake: implications for mainshock motions, B. Seismol. Soc. Am., 86, S193–S208, 1996. a
Taborda, R. and Roten, D.: Physics-Based Ground-Motion Simulation, 1–33, Springer Berlin Heidelberg, Berlin, Heidelberg, https://doi.org/10.1007/978-3-642-36197-5_240-1, 2015. a
Wang, F., Miyajima, M., Dahal, R., Timilsina, M., Li, T., Fujiu, M., Kuwada, Y., and Zhao, Q.: Effects of topographic and geological features on building damage caused by 2015.4.25 Mw 7.8 Gorkha earthquake in Nepal: a preliminary investigation report, Geoenvironmental Disasters, 3, 7, https://doi.org/10.1186/s40677-016-0040-2, 2016. a
Wang, H., Ge, L., Xu, C., and Du, Z.: 3-D coseismic displacement field of the 2005 Kashmir earthquake inferred from satellite radar imagery, Earth Planets Space, 59, 343–349, 2007. a, b, c
Wills, C. J. and Clahan, K. B.: Developing a map of geologically defined site-condition categories for California, B. Seismol. Soc. Am., 96, 1483–1501, 2006. a, b
Wu, S., Li, J., and Huang, G.: A study on DEM-derived primary topographic attributes for hydrologic applications: Sensitivity to elevation data resolution, Appl. Geogr., 28, 210–223, 2008. a
Xu, C., Xu, X., and Yu, G.: Landslides triggered by slipping-fault-generated earthquake on a plateau: an example of the 14 April 2010, Ms 7.1, Yushu, China earthquake, Landslides, 10, 421–431, 2013. a, b
Zhang, L. and Xu, Y.: 3-D simulation of hanging wall effect at dam site, in: AGU Fall Meeting Abstracts, 11–15 December 2017, New Orleans, USA, 2017. a