the Creative Commons Attribution 4.0 License.
the Creative Commons Attribution 4.0 License.
 | 23 Mar 2020
Real-time probabilistic seismic hazard assessment based on seismicity anomaly
Yu-Sheng Sun
Hsien-Chi Li
Ling-Yun Chang
Zheng-Kai Ye
Chien-Chih Chen
Real-time probabilistic seismic hazard assessment (PSHA) was developed in this study in consideration of its practicability for daily life and the rate of seismic activity with time. Real-time PSHA follows the traditional PSHA framework, but the statistic occurrence rate is substituted by time-dependent seismic source probability. Over the last decade, the pattern informatics (PI) method has been developed as a time-dependent probability model of seismic source. We employed this method as a function of time-dependent seismic source probability, and we selected two major earthquakes in Taiwan as examples to explore real-time PSHA. These are the Meinong earthquake (ML 6.6) of 5 February 2016 and the Hualien earthquake (ML 6.2) of 6 February 2018. The seismic intensity maps produced by the real-time PSHA method facilitated the forecast of the maximum expected seismic intensity for the following 90 d. Compared with real ground motion data from the P-alert network, our seismic intensity forecasting maps showed considerable effectiveness. This result indicated that real-time PSHA is practicable and provides useful information that could be employed in the prevention of earthquake disasters.


Currently, research on and the application of seismic hazard analyses focus on two major aspects of seismic activity, namely the pre-earthquake and post-earthquake phases. Post-earthquake seismic hazard assessment is employed mainly in the earthquake early warning (EEW) system (Cooper, 1868; Wu et al., 1998, 2013), which provides people with crucial time to seek refuge before the arrival of larger seismic waves. Pre-earthquake seismic hazard assessment conventionally employs probabilistic seismic hazard analysis (PSHA; Cornell, 1968; SSHAC, 1997) mainly for engineering design. PSHA determines the probability of exceeding the ground motion level over a specified time period based on the occurrence rate of earthquakes and ground motion prediction equations (GMPEs). The occurrence rate of earthquakes is generally described by the truncated exponential model (Cosentino et al., 1977) and the characteristic earthquake model (Schwartz and Coppersmith, 1984; Wang et al., 2016). The earthquake occurrence rate computed from these models will not change with time regardless of whether the data being used are from long-term observations or paleoseismic studies. However, seismic activity is a complex dynamic process in time and space and usually fluctuates greatly over a short timescale (Chen et al., 2006). Furthermore, the assessment is usually computed by using extremely long recurrence intervals, 475 or 2475 years, for the purpose of engineering design (Iervolino et al., 2011). Consequently, it is difficult to verify the accuracy of seismic hazard assessment in relation to the limited lifespan of humans. Although long recurrence intervals are suitable in building construction, the concept of “catastrophic” over such long intervals does not resonate with the general public. In addition, most ordinary people would find it difficult to comprehend an indication such as “10 % probability of exceedance in 50 years”. Statistical long-term seismic hazard assessment, therefore, does not have relevance to the daily life of most people.
However, we believe that short-term, time-dependent, pre-earthquake hazard assessment is necessary for everyone's daily use. Accordingly, we propose a preliminary method to achieve this goal by employing time-dependent seismic source probability instead of the static probability used in long-term assessment. We used the pattern informatics (PI) method developed over the past decade (Rundle et al., 2000; Tiampo et al., 2002; Wu et al., 2008a; Chang et al., 2016) as a time-dependent seismic source probability method.
Anomalous change in seismicity is used widely as a precursory indicator for large earthquakes and is usually classified into seismic activation or seismic quiescence, depending on an ascending or descending number of seismicity occurrences (Chen et al., 2005; Wu et al., 2008b). In the PI method, large earthquakes tend to occur after precursory anomalous seismic changes, and the occurrence probability can be quantified by the magnitude of the spatiotemporal variation in seismicity. In preliminary research, PI performed well in identifying locations in the vicinity of impending large earthquakes. A modified version of PI developed in recent research has apparently improved the accuracy of identifying the occurrence time interval of large earthquakes. After a series of verifications, an occurrence probability of large earthquakes over the following 90 d was found to be plausible (Chang et al., 2016; Chang, 2018). Accordingly, we used the modified PI method to compute the time-dependent seismic source probability in the Taiwan region.
We illustrate an uncomplicated method to conduct real-time seismic hazard assessment. The crucial difference is to replace statistical seismic probability with the time-dependent probability from the modified PI method. This real-time seismic hazard assessment is able to produce seismic hazard forecasting maps for the following 90 d. Compared with the forecasting timescale and static seismic rate of traditional PSHA, real-time PSHA can be updated by refreshing the earthquake catalog (time-dependent) and can forecast for the near future (short term). Thus, it can be referred to as “real-time”.
Table 1Earthquakes occurring in the forecast interval. Date format: mm/dd.

“P alert” indicates that the P-alert recording was obtained from the Taiwan Earthquake Research Center (TEC) or the National Taiwan University (NTU). “No.” indicates the number of recording stations. “Nan” indicates no P-alert data were recorded from either TEC or NTU, even if the event was recorded by CWB. Bold font represents the Meinong and Hualien earthquakes.
We illustrate the real-time assessment process using two recent large earthquake events in Taiwan, namely the 2016 Meinong earthquake (ML 6.6) (Lee et al., 2016, 2017; Chen et al., 2017) and the 2018 Hualien earthquake (ML 6.2) (Hsu et al., 2018). Detailed parameters of the two earthquakes are listed in Table 1. Finally, we verified the reliability of the seismic hazard forecasting maps by comparing them with real ground motion data recorded by the P-alert network.
2.1 Central Weather Bureau seismic network catalog
We used data from the seismic network catalog maintained by the Central Weather Bureau (CWB) of Taiwan (R.O.C.) (https://www.cwb.gov.tw/V7e/earthquake/seismic.htm and http://gdms.cwb.gov.tw/index.php, last access: July 2018). The completeness magnitude (Mc) of this catalog is estimated at approximately 2.0 in local magnitude (ML) (Wu et al., 2008c). In an analysis of focal depth, Wu et al. (2008b) observed that the focal depth of approximately 80 % of earthquakes was shallower than 30 km. Accordingly, we used ML 2.0 and 30 km as the threshold of magnitude and focal depth, respectively, to select the events to be used in the PI calculation.
2.2 P-alert network
We used the ground motion recordings from the P-alert network to verify the effectiveness of the real-time seismic hazard assessments from our model. The National Taiwan University (NTU) commenced development of the P-alert real-time strong motion network for EEW purposes in 2010 with the support of the Ministry of Science and Technology (MOST) (Wu, 2015). The devices of the P-alert network can record real-time three-component acceleration signals and publish alerts when the peak initial-displacement amplitude (Pd) or the peak ground acceleration (PGA) exceeds predefined thresholds (Wu et al., 2013, 2016b; Wu, 2015). Today, there are more than 600 P-alert stations in Taiwan, most located in elementary schools (Wu et al., 2013; Yang et al., 2018). We mainly adopted the P-alert waveform database maintained by the Taiwan Earthquake Research Center (TEC), and we used the data from the NTU as an auxiliary catalog (data from the P-alert network can be downloaded from the Data Center of the TEC at http://palert.earth.sinica.edu.tw/db/, last access: July 2018, or by contacting Yih-Min Wu at drymwu@ntu.edu.tw for access to the NTU catalog).
The distribution of the P-alert network is still not uniform (see Figs. 2b and 3b), despite the large number of seismic stations covering Taiwan. Obviously, this could cause problems, which will be discussed later.
3.1 Pattern informatics
Phase dynamics is the physical fundamental of the PI method, which describes changes in a system by rotation of the state vector in the Hilbert space (Rundle et al., 2002, 2003). The evolution of the state vector in a dynamic fault system is suggested to be related to stress accumulation and release (Chen et al., 2006). The computational steps we adopted here are a modified version developed by Chang et al. (2016) and Chang (2018) to improve the spatiotemporal resolution of the PI method. The research area (21–26∘ N, 119–123∘ E) was divided into boxes of grid size , with each box being indicated by parameter xi. Because of the Mc and the distribution of the focal depth (mentioned in Sect. 2.1), we selected all the events with ML≥2.0 and depth ≤30 km. In PI computation, t1 and t2 represent the beginning and the end of a change interval, respectively, with the length of a change interval being 4 years. The start time of calculation, t0, is defined as 12 years before t2. Then, tb is a sampling reference time between t0 and t1. The tb starts from t0 and shifts forward 3 d in each calculation until the length of time between tb and t1 is a half change interval. The forecasting interval, t3, starts after t2 (Chang, 2018). The seismicity rate in the period tb to t (tb to t1 and tb to t2) can be expressed as
We conservatively considered the earthquake number, n, occurring in the xi and its eight neighboring boxes. The rate change during the change interval can be expressed as
is a vector in a Hilbert space that records present seismic activity, so that ΔS can be interpreted as an angular drift of S (Rundle et al., 2002; Tiampo, 2002). To reduce the time-dependent background seismicity, we used the temporal standard score normalizing ΔS and obtained . To compare the high and low levels of seismicity rate change in each grid box at the same tb, we subsequently used the spatial standard score normalizing and obtained . The average of the absolute value at all tb points in each xi is
Then, the mean squared change in probability
was computed (Chen et al., 2005; Chang et al., 2016). We further divided the magnitude range of earthquakes into several segments to separately calculate the relative probabilities ΔP(xi). The divided magnitude range is from magnitude 2.0 with a window length of 0.5 magnitude, and it shifts forward by 0.2 each time. Then, we calculated the relative probability each time, such as ΔP(xi)2.0–2.5, ΔP(xi)2.2–2.7. Finally, we multiplied all the relative probabilities.
ΔPM to forecast the occurrence of earthquakes is referred to as the modified pattern informatics method (Chang, 2018). According to Chang et al. (2016), the forecasting interval of the PI method reaches 90 d. Finally, the PI method produced a forecasting probability distribution of seismic sources for ML≥5.0 within the forecasting interval.
3.2 Real-time PSHA
In the traditional PSHA framework (Cornell, 1968; Wang et al., 2016), the probability of an earthquake occurrence follows the Poisson process and the average recurrence interval for an annual frequency of exceedance can be expressed as
where and are the probability density functions of magnitude and distance, respectively; is the conditional probability of ground motion Z exceeding a specified value z for a specific magnitude m and distance r. is the annual occurrence rate of earthquakes and is described by the truncated exponential model (Cosentino et al., 1977) and the characteristic earthquake model (Schwartz and Coppersmith, 1984). Finally, to consider all scenarios, the total probability of Ns earthquakes is summarized in a given region.
In real-time PSHA, the occurrence rate of earthquakes used in the traditional PSHA framework is replaced by seismic forecasting probability to achieve spatiotemporal variability in the hazard assessment. Then, considering the gridded space, real-time PSHA can be expressed as
where , the forecasting probability distribution, is a function of magnitude and location. It specifies an occurrence probability for specific magnitude, Mi, at each spatial location, Loci. The summations are to consider the whole of the contribution from any possible magnitude, Ms, and location, Locs. We adopted the forecasting probability from the PI method as . Loc refers to xi in the PI method. The forecasting probability of the PI method presents a distribution of cumulative forecasting probability for ML≥5.0. We referred to the average character of the Gutenberg–Richter law in Taiwan (Gutenberg and Richter, 1944; Wang et al., 2015) to convert it into the probability density function (PDF). It can correspond to the specific magnitude conditions for . To evaluate the ground motion, we used the GMPE published by Lin et al. (2012),
which was also adopted for the Taiwan PSHA in Lee et al. (2017). In Eq. (7), C1 to C8 and H are the regression coefficients (Table 2); R is the closest distance (km); FNM and FRV represent the earthquake type, namely FNM=1 and FRV=0 for a normal fault earthquake and FNM=0 and FRV=1 for a reverse fault earthquake. In this GMPE, earthquake type is regarded as an important parameter. However, the division of seismic sources in the PI method is no longer based on the geological classification but on the grid box, xi. Considering that most faults in Taiwan are reverse faults (Shyu et al., 2016), we adopted the reverse fault parameter setting for the entire research area. Vs30 is eclectically assigned Vs30=760. Using the conversion equation from Lin and Lee (2008), which was adopted in Lin (2012), turns ML into Mw. Finally, the forecasting maximum PGA from real-time PSHA is transferred to seismic intensity according to the seismic intensity scale of the CWB listed in Table 3 (Wu et al., 2003; Central Weather Bureau, 2020). This implies that the seismic intensity forecasting map presents the maximum seismic intensity that every site will encounter over the following 90 d.


3.3 Performance verification
3.3.1 Receiver operating characteristic curve
The receiver operating characteristic (ROC) diagram is a binary classification model used widely as a tool to quantify the performance of earthquake prediction (Holliday et al., 2006; Nanjo et al., 2006; Wu et al., 2016a). We used the ROC diagram as an objective quantitative indicator to evaluate the performance of the seismic forecasting probability computed by the PI method. For each box, xi, there are four situations (parameters) when comparing forecasting hot spots and target earthquakes. Namely, a means any target earthquake in a hot spot, b means no target earthquake in a hot spot, c means no hot spot but at least one target earthquake, d means no target earthquake and no hot spot. The true positive rate (TPR) is defined as and the false positive rate (FPR) is defined as . The values of a, b, c, and d change with the threshold of forecasting probability and, therefore, TPR and FPR change as well. The value of the area under the ROC curve (AUC) varies between 0 and 1. AUC=1 is a perfect prediction and AUC=0.5 is a random guess. For each PI forecasting map, we generated 1000 random test maps by re-distributing the hot spots randomly over the research area to examine the possibility that a specific distribution of hot spots could be generated by chance. In Fig. 1c and d, the blue line is the 95 % confidence interval based on 2 standard deviations. The standard deviation is calculated by the random test results in each bin of the x axis. The 95 % confidence interval helps to differentiate the distributing range of random tests and the significance of the forecasting probability.
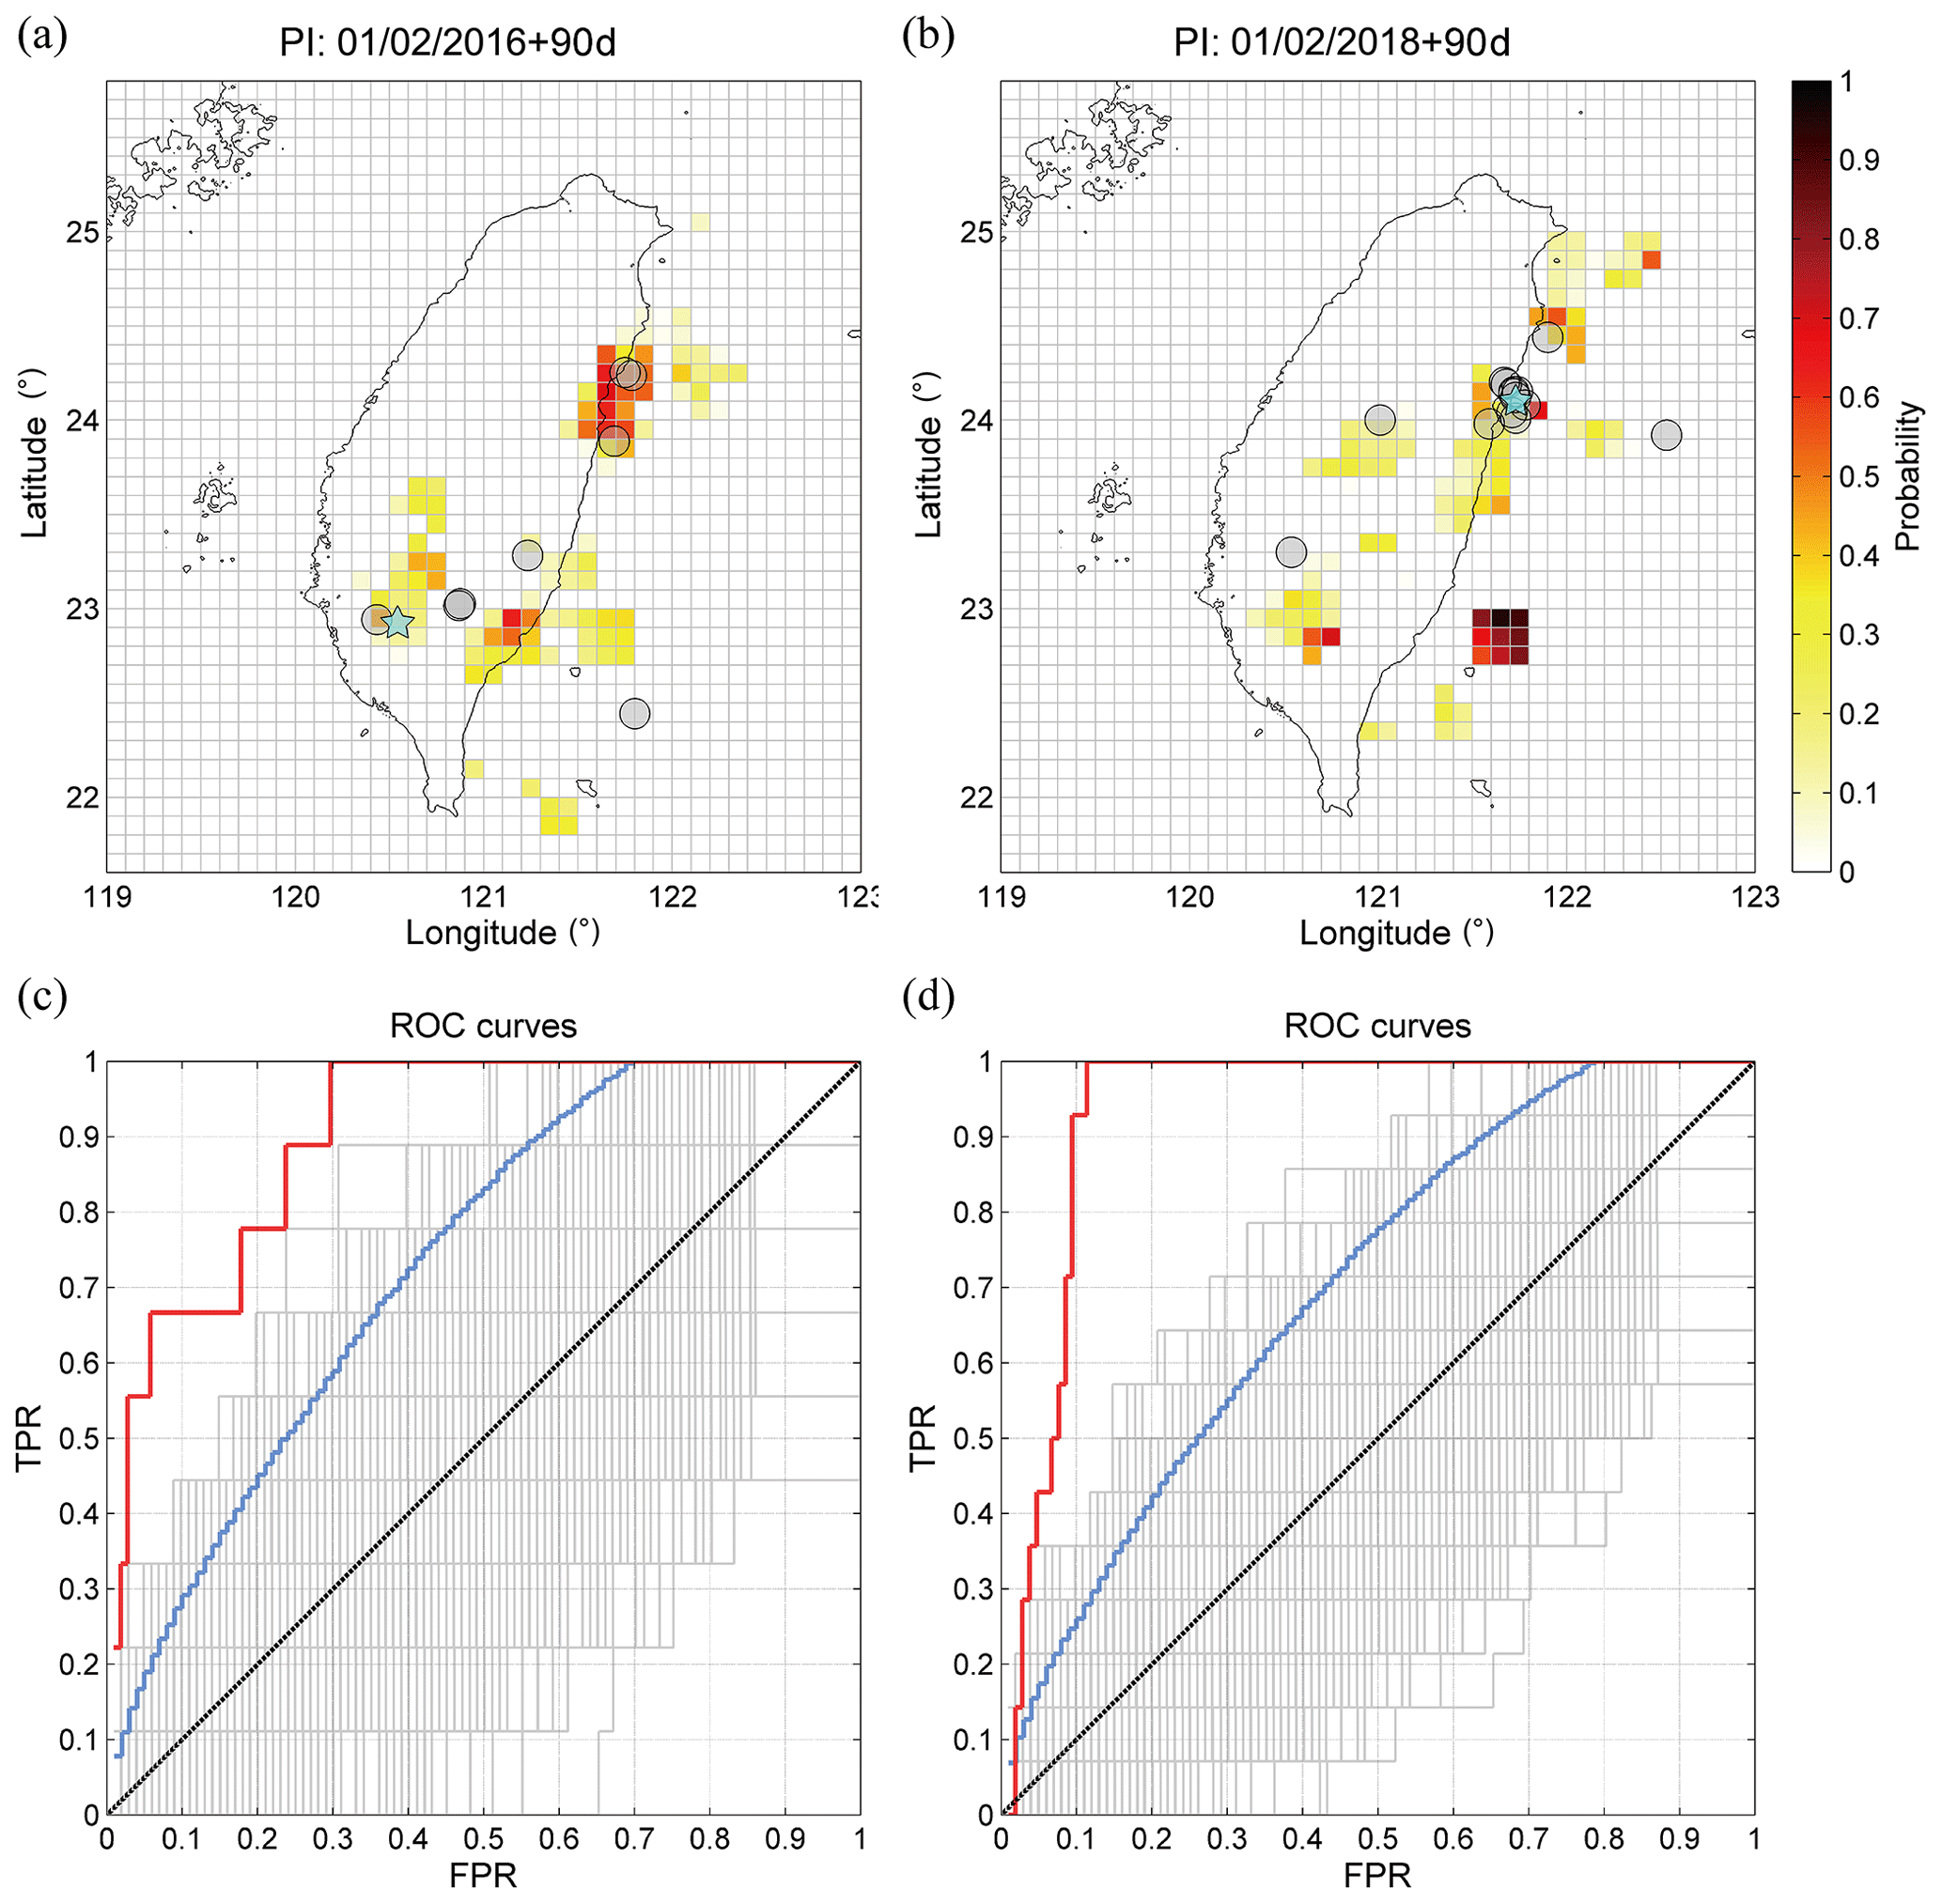
Figure 1Panels (a) and (b) show the forecasting probability maps of the Meinong earthquake and the Hualien earthquake, respectively. Panels (c) and (d) are the ROC curves of (a) and (b), respectively. Red, gray, blue, and black curves represent the forecasting probability map, random tests, 95 % confidence interval, and the average of random tests, respectively.
3.3.2 Average percent hit rate
The success rate of forecasting seismic intensity is a predictive accuracy of classification problems for which the average percent hit rate (APHR) is arguably the most intuitive discrimination measure. The APHR is a rate at which the forecasting data are classified into the correct classes (Sharda and Delen, 2006). We used the APHR to quantify the forecasting performance of real-time seismic hazard assessments. In the APHR, the exact hit rate, which only counts the correct classifications to the exact same class, can be expressed as
where, in this study, N is the total number of the P-alert stations or the boxes on the forecasting hazard map, g is the total number of seismic intensity classes (eight, according to the CWB seismic intensity scale), and pi is the total number of samples classified as class i. In the random test, we generated 1000 random tests by randomly redistributing the forecasting maximum seismic intensity over the research area and the stations to examine the possibility that a specific distribution of the forecast could be generated by chance.
4.1 Forecasting earthquake occurrences
Figure 1a and b show the forecasting probability maps computed with the PI method, and Fig. 1c and d show the corresponding forecasting performance verified by the ROC tests. In the case of the 2016 Meinong earthquake, t0, t1, and t2 are 31 January 2004, 31 January 2012, and 31 January 2016. In the case of the 2018 Hualien earthquake, t0, t1, and t2 are 31 January 2006, 31 January 2014, and 31 January 2018. The forecasting intervals of both cases are 90 d after t2. The cyan stars in Fig. 1a and b indicate the main shock of the 2016 Meinong and 2018 Hualien earthquakes and the largest earthquake in the forecasting interval. The gray circles in Fig. 1a and b are the earthquakes with magnitude ML≥5.0 in the forecasting interval, with more-detailed information about these earthquakes presented in Table 1. Notably, both main shocks and most large earthquakes are located in or in close proximity to hot spots. Overall, simply from visual inspection, the performance of the PI forecasting probabilities appeared satisfactory.
In Fig. 1c and d, the red curves are located far above the blue curves (95 % confidence interval). The AUCs of the red curves are 0.91 and 0.94 and are apparently larger than the AUCs of the blue curves, which are 0.73 and 0.70. The ROC tests quantitatively verified that the performance of the PI forecasting probability was significant and that these patterns were not generated by chance by the random distribution of hot spots. Both distributions of hot spots were found to be physically meaningful. In view of the above, we were able to use these probability maps as the function of earthquake occurrence rate in subsequent calculations for real-time PSHA.
4.2 Real-time PSHA
In Figs. 2 and 3, panel (a) shows the map forecasting the maximum seismic intensity estimated by real-time PSHA for the forecasting interval, and panel (b) shows the map indicating the maximum seismic intensity recorded by the P-alert network during the forecasting interval. To ensure that it was the absolute maximum intensity during the forecasting interval, we used only the stations that had recorded all the target events (ML≥5.0) in the forecasting interval. Although there are over 600 P-alert stations distributed widely in Taiwan, some boxes do not contain any station, e.g., the Central Mountain Range (see Fig. 5a and b). Therefore, we estimated the intensities in these boxes by interpolating. However, clearly, our strategy generated an artificial effect, which will be shown later.
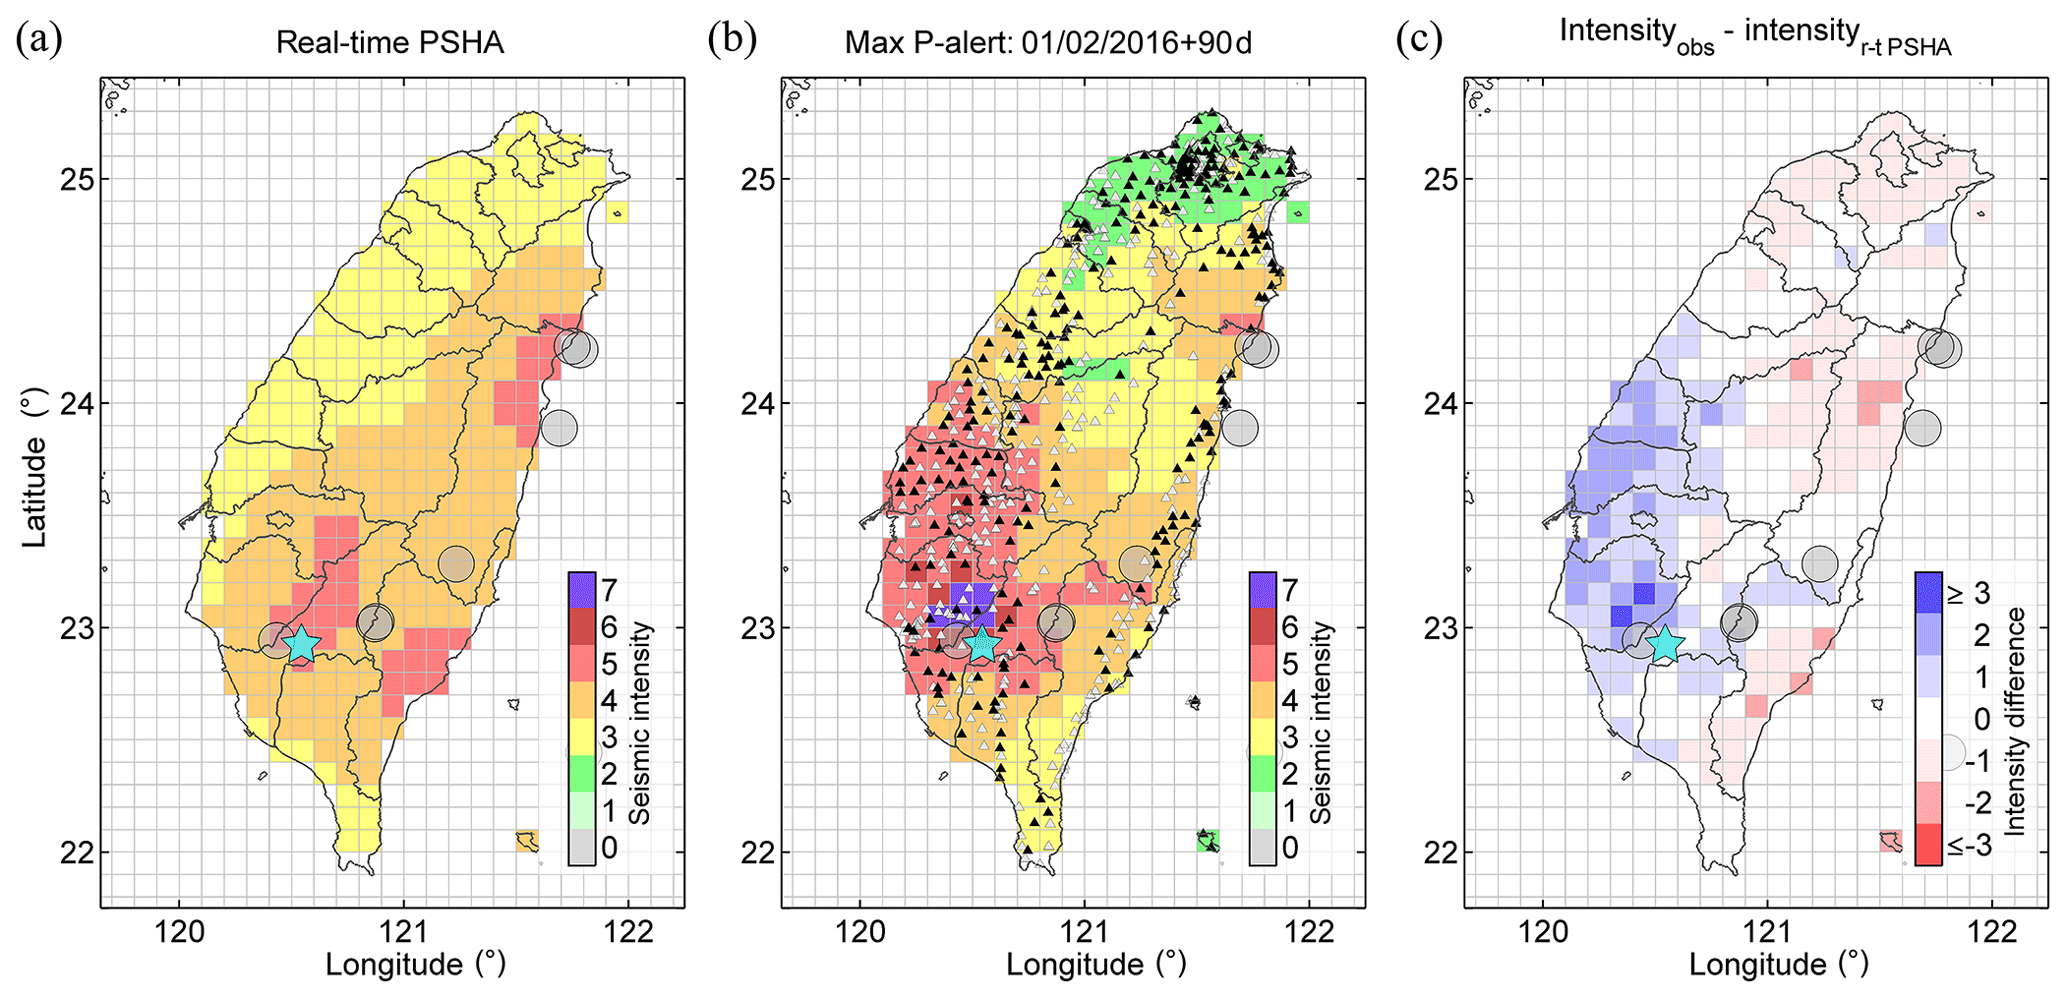
Figure 2The 2016 Meinong earthquake. (a) Map of forecasted maximum seismic intensity by real-time PSHA. The forecasting interval of seismic intensity is 90 d. (b) Map of maximum seismic intensity recorded by the P-alert network. Black and white triangles indicate the P-alert stations that we used and did not use, respectively, in the verification. (c) Difference in seismic intensity between the forecast and the record. The cyan star represents the Meinong earthquake, and the gray circles represent the earthquakes with magnitude ML≥5 in this forecasting interval.
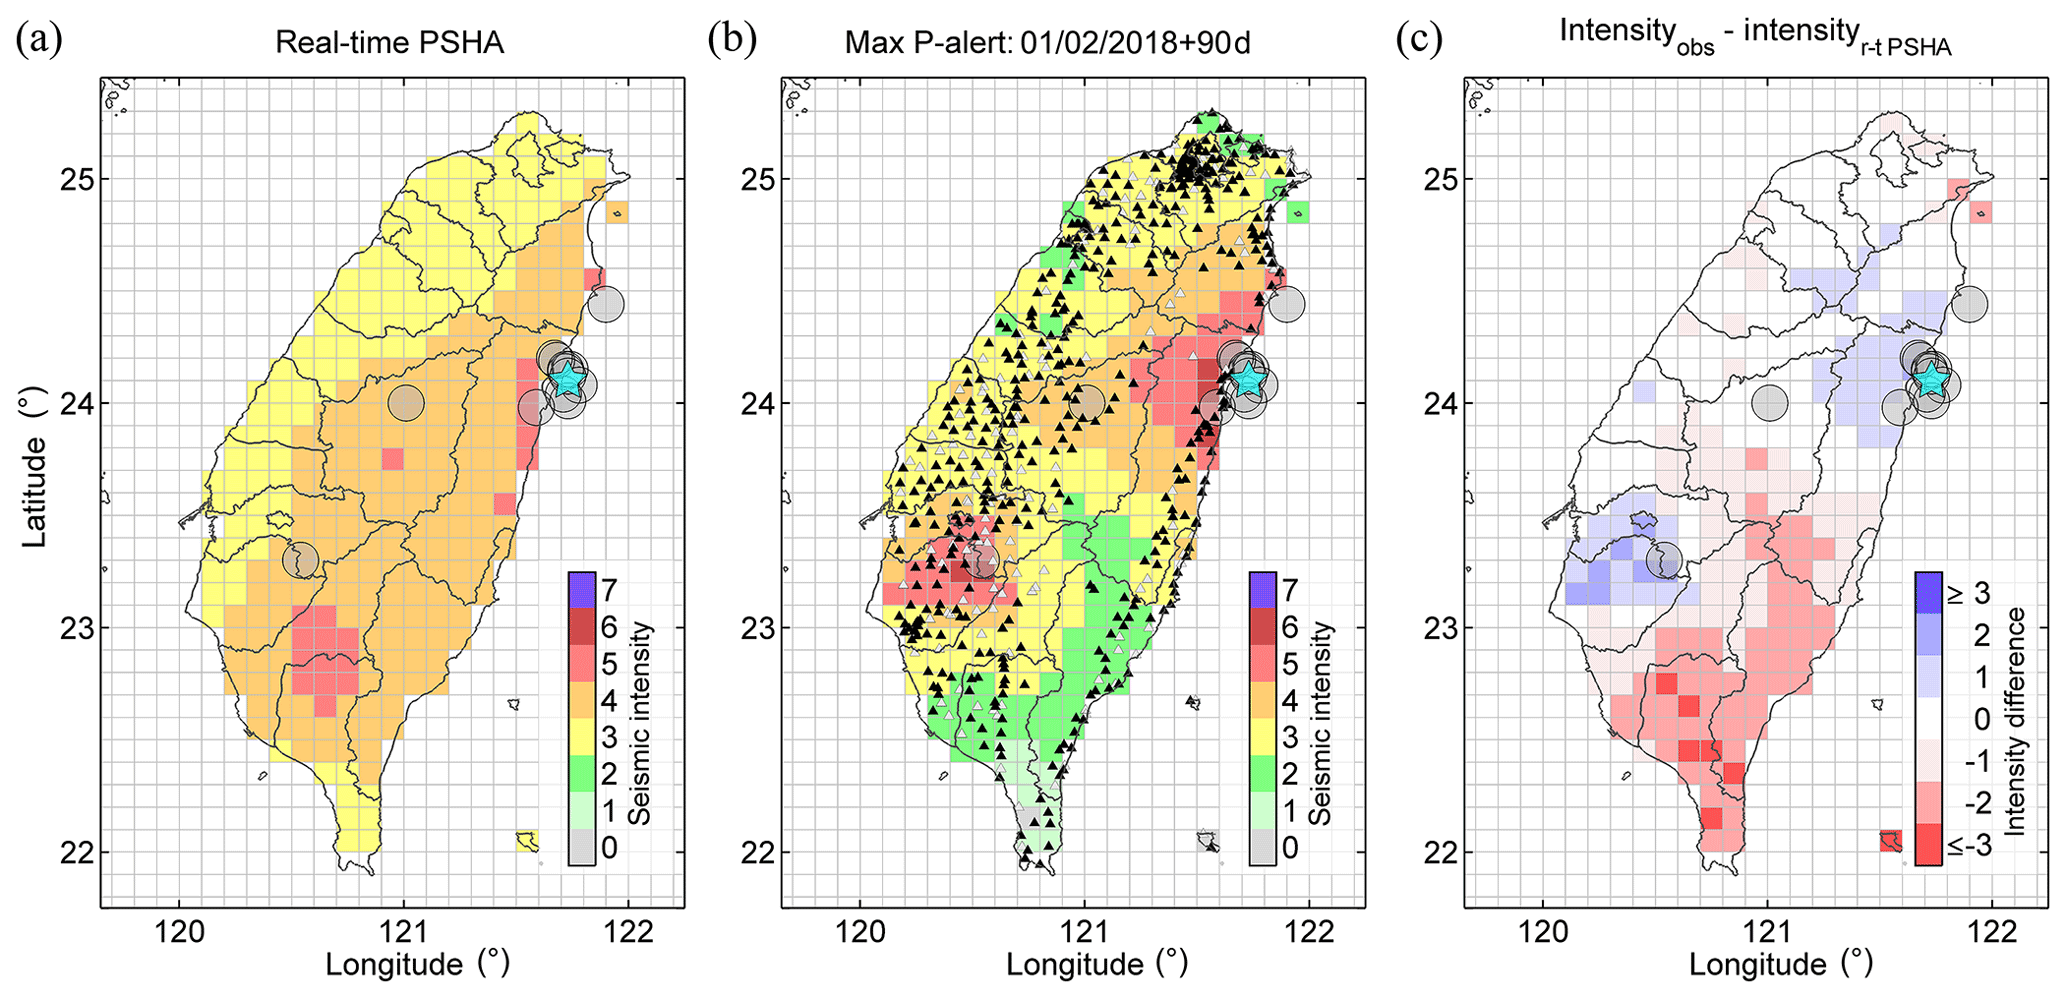
Figure 3The 2018 Hualien earthquake. (a) Map of forecasting maximum seismic intensity. (b) Map of maximum seismic intensity recorded by the P-alert network. (c) Difference in seismic intensity between the forecast and the record. The cyan star represents the Hualien earthquake.
Comparing Fig. 2a and b, we suggest that both seismic intensity distributions are remarkably similar. An apparent deviation between the forecasted seismic intensities and the recorded values occurs in southwestern Taiwan, particularly the area closer to the 2016 Meinong main shock. Figure 2c shows the difference in seismic intensity between Fig. 2a and b, with the blue and red colors indicating that the forecasting value in a box was underestimated or overestimated, respectively. Most boxes have an intensity difference in the range −1 to 1, but some boxes in southwestern Taiwan are underestimated, with the differences being mostly 2 or even up to 3.
Comparing Fig. 3a and b, we suggest that both seismic intensity distributions are still extremely similar. In this instance, an apparent deviation between the forecasted seismic intensities and the recorded values occurs in southern Taiwan and a part of the southwestern area. Figure 3c shows that most boxes in southern Taiwan have a smaller recorded intensity, with the recorded intensities in a part of southwestern Taiwan being larger than the forecasting values.
Figure 4 shows the verifications generated by the APHR to quantitatively evaluate the performance of forecasting the seismic intensity. We considered the denominator of two classifications in Eq. (8), i.e., the total number of P-alert stations and the total number of boxes in the research area. The results are indicated by “P-alert” and “Map”, respectively, in Fig. 4. When comparing forecasting intensity with recorded value, both cases “forecasting = recorded” and “forecasting = recorded + 1” indicate “successful forecasting”. However, defining the tolerance range, which depends on the perspectives and allowances of different users, is debatable (Hsu et al., 2018). In this study, we tolerated an overestimation of 1 intensity rather than underestimation, as, in relation to the prevention or mitigation of earthquake disasters, “overestimation” was considered preferable to “underestimation”.
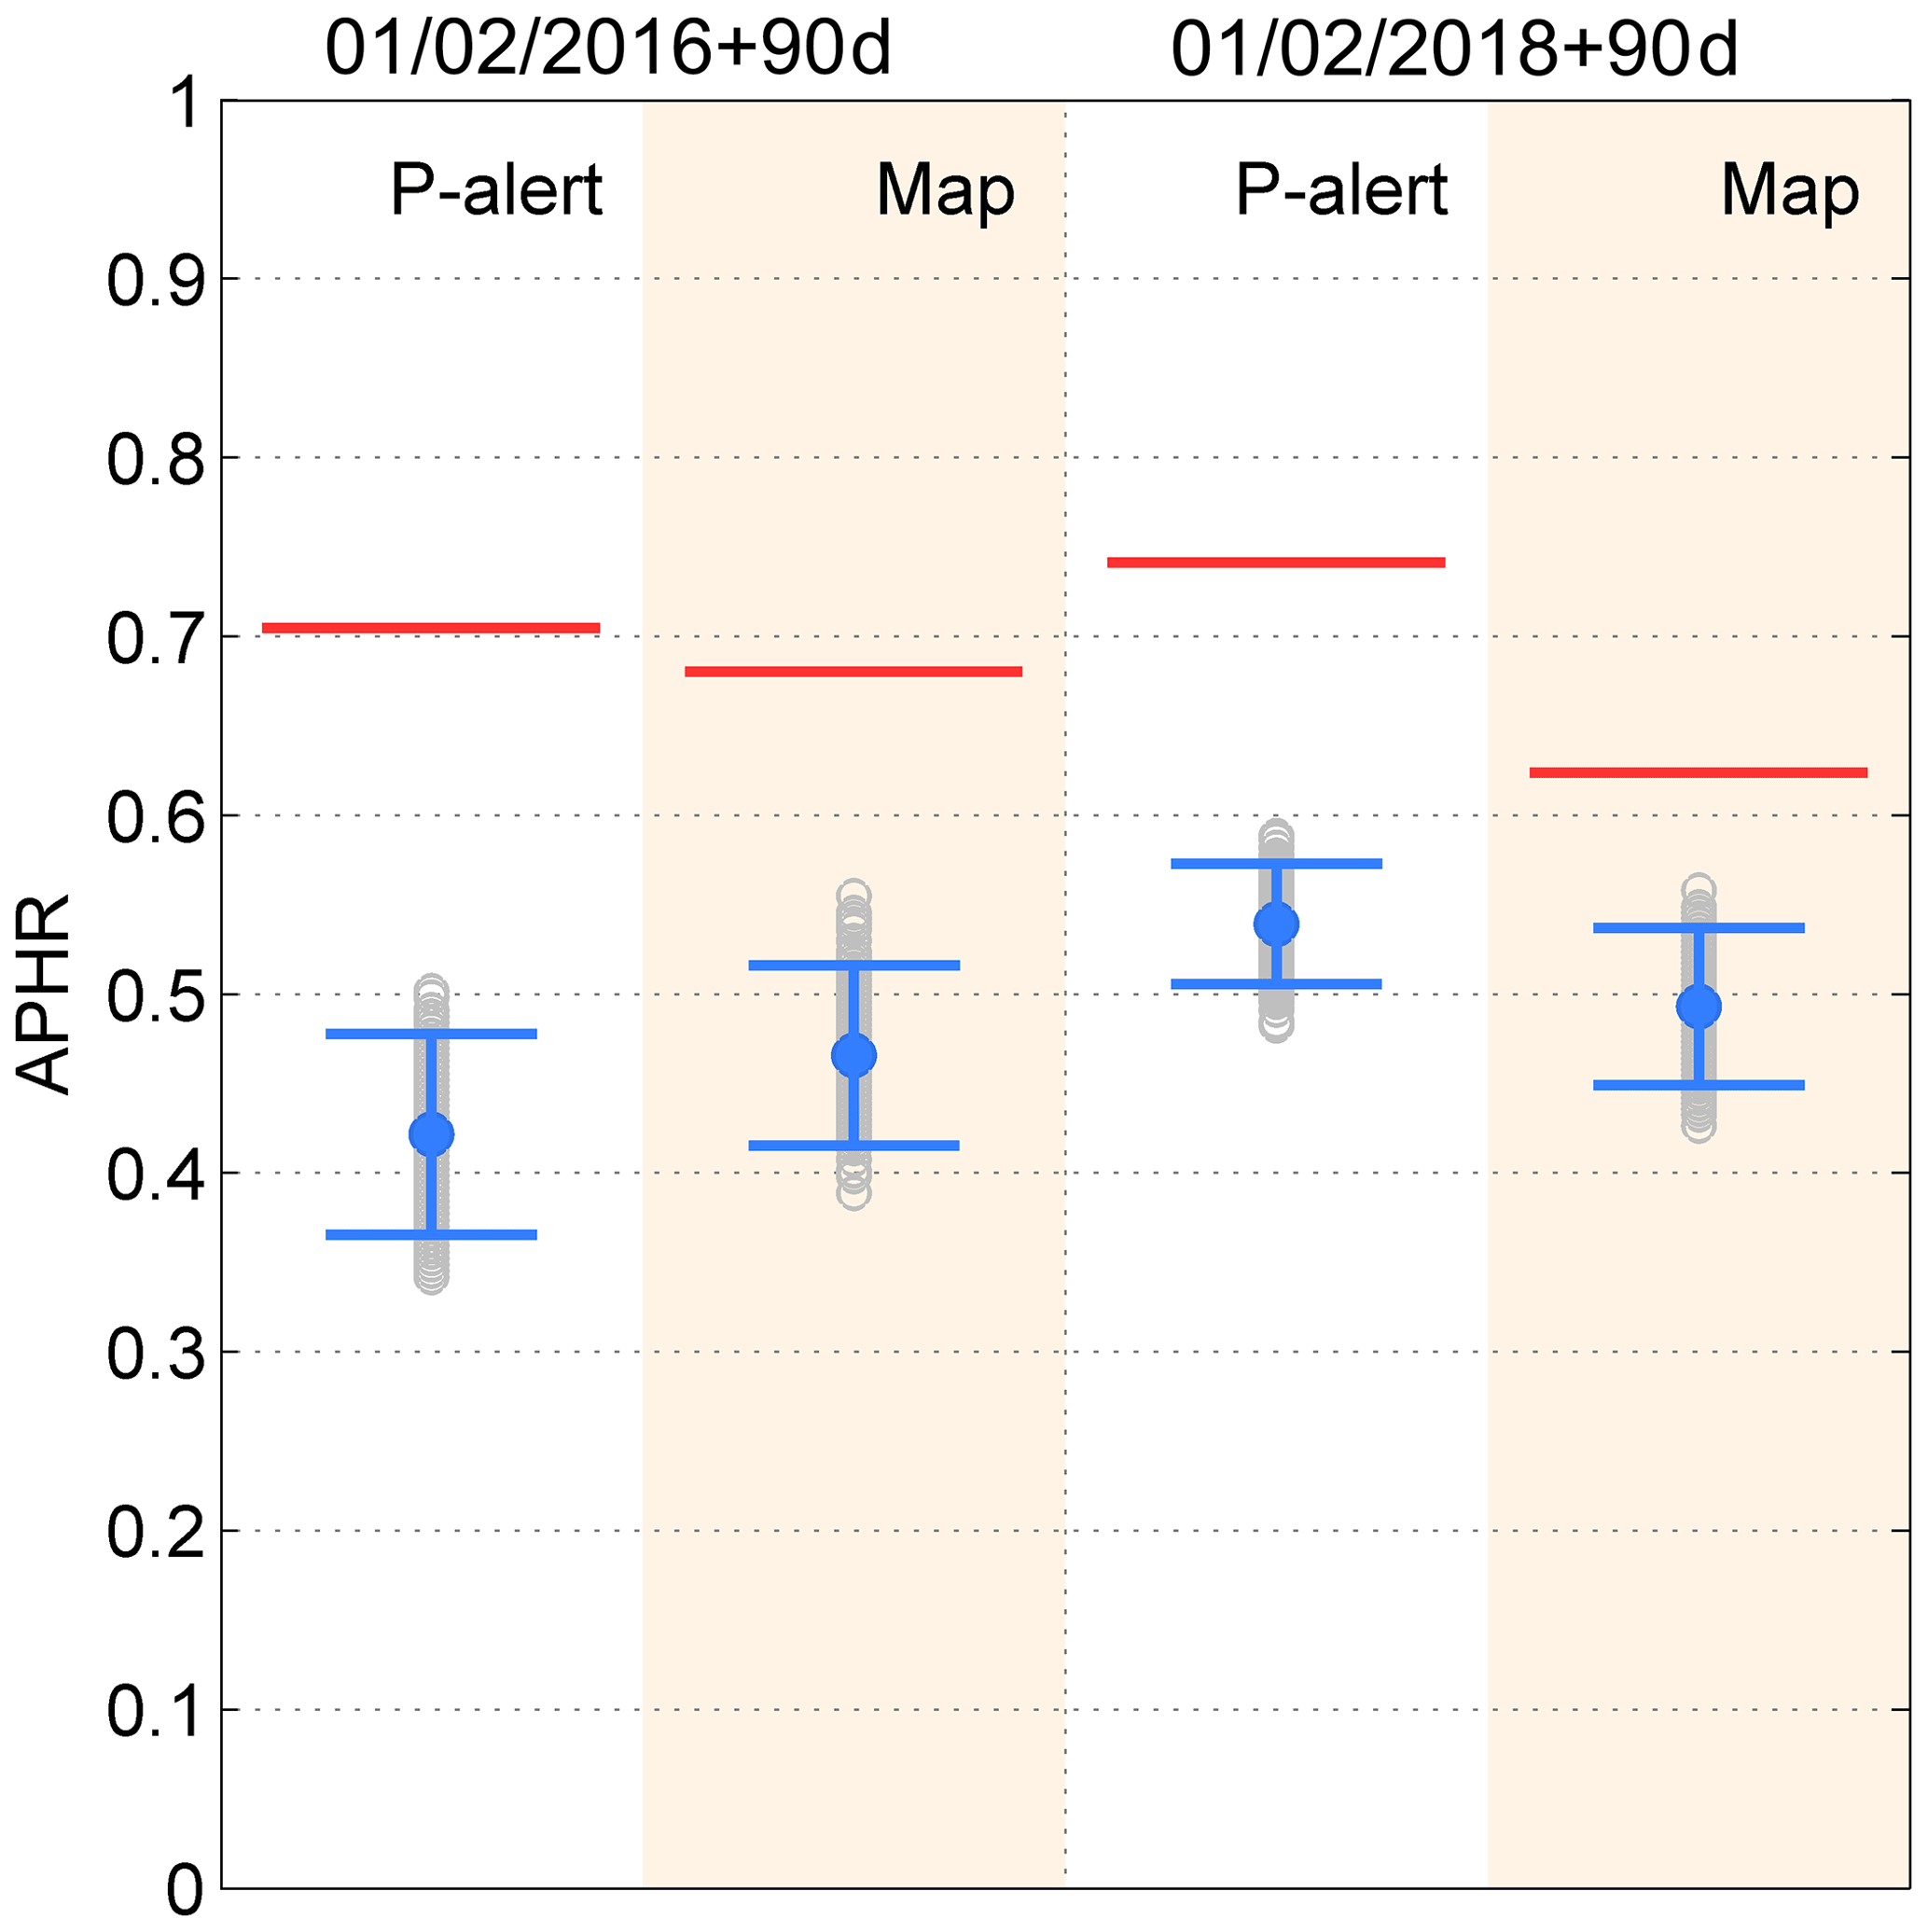
Figure 4Performance test of APHR. The red line indicates the forecasts of real-time PSHA, the gray circle indicates the result of a random test by randomly redistributing seismic intensities, and the blue error bar indicates the interval with 2 standard deviations over all random tests.
All the red lines are above the maximum hit rate of the random tests and higher than 0.5, not to mention the random guesses of the eight choices of the seismic intensity scale on each station or box. This implies that the forecasting ability of the generated seismic intensity maps is significantly effective and that this satisfactory performance could not be ascribed to chance. Furthermore, both hit rates of the “P-alert” cases are higher than the rates of the “map” cases. However, this result could be attributed to the influence of the artificial effect generated by the interpolation of seismic intensity from the P-alert data of nonuniform distribution. Finally, it should be emphasized that we focused only on earthquakes with ML≥5 and we cannot deny the possibility that a ML<5 earthquake could cause large seismic intensity in the near field.
The results of the APHR performance test indicated that the maps and stations employed to forecast the maximum seismic intensity by real-time PSHA were significant and effective. Figure 5 is a concretization of the APHR verification and provides more detail. It clearly shows the P-alert station distributions of the “hit” and “not hit”, considering only the station-to-station prediction relationship between the forecasts and records. In both instances, most of the P-alert stations are hit (Fig. 5a and b), and the hit percentages are distributed along the diagonal and tolerant ranges (Fig. 5c and d). However, some locations or stations produced incorrect forecasts. In the case of the 2016 Meinong earthquake, the stations located in southwestern Taiwan do not match the real records and, at high seismic intensities (>3), the forecasting results at some stations are underestimated (Fig. 5c), particularly in the southwestern area. In the case of the 2018 Hualien earthquake, the result from the P-alert APHR appears superior to that of Meinong, and the distribution of the hit percentage is more concentrated along the diagonal and tolerant ranges (Fig. 5d). Nevertheless, the forecasts in southern Taiwan and part of southwestern Taiwan were not hit.
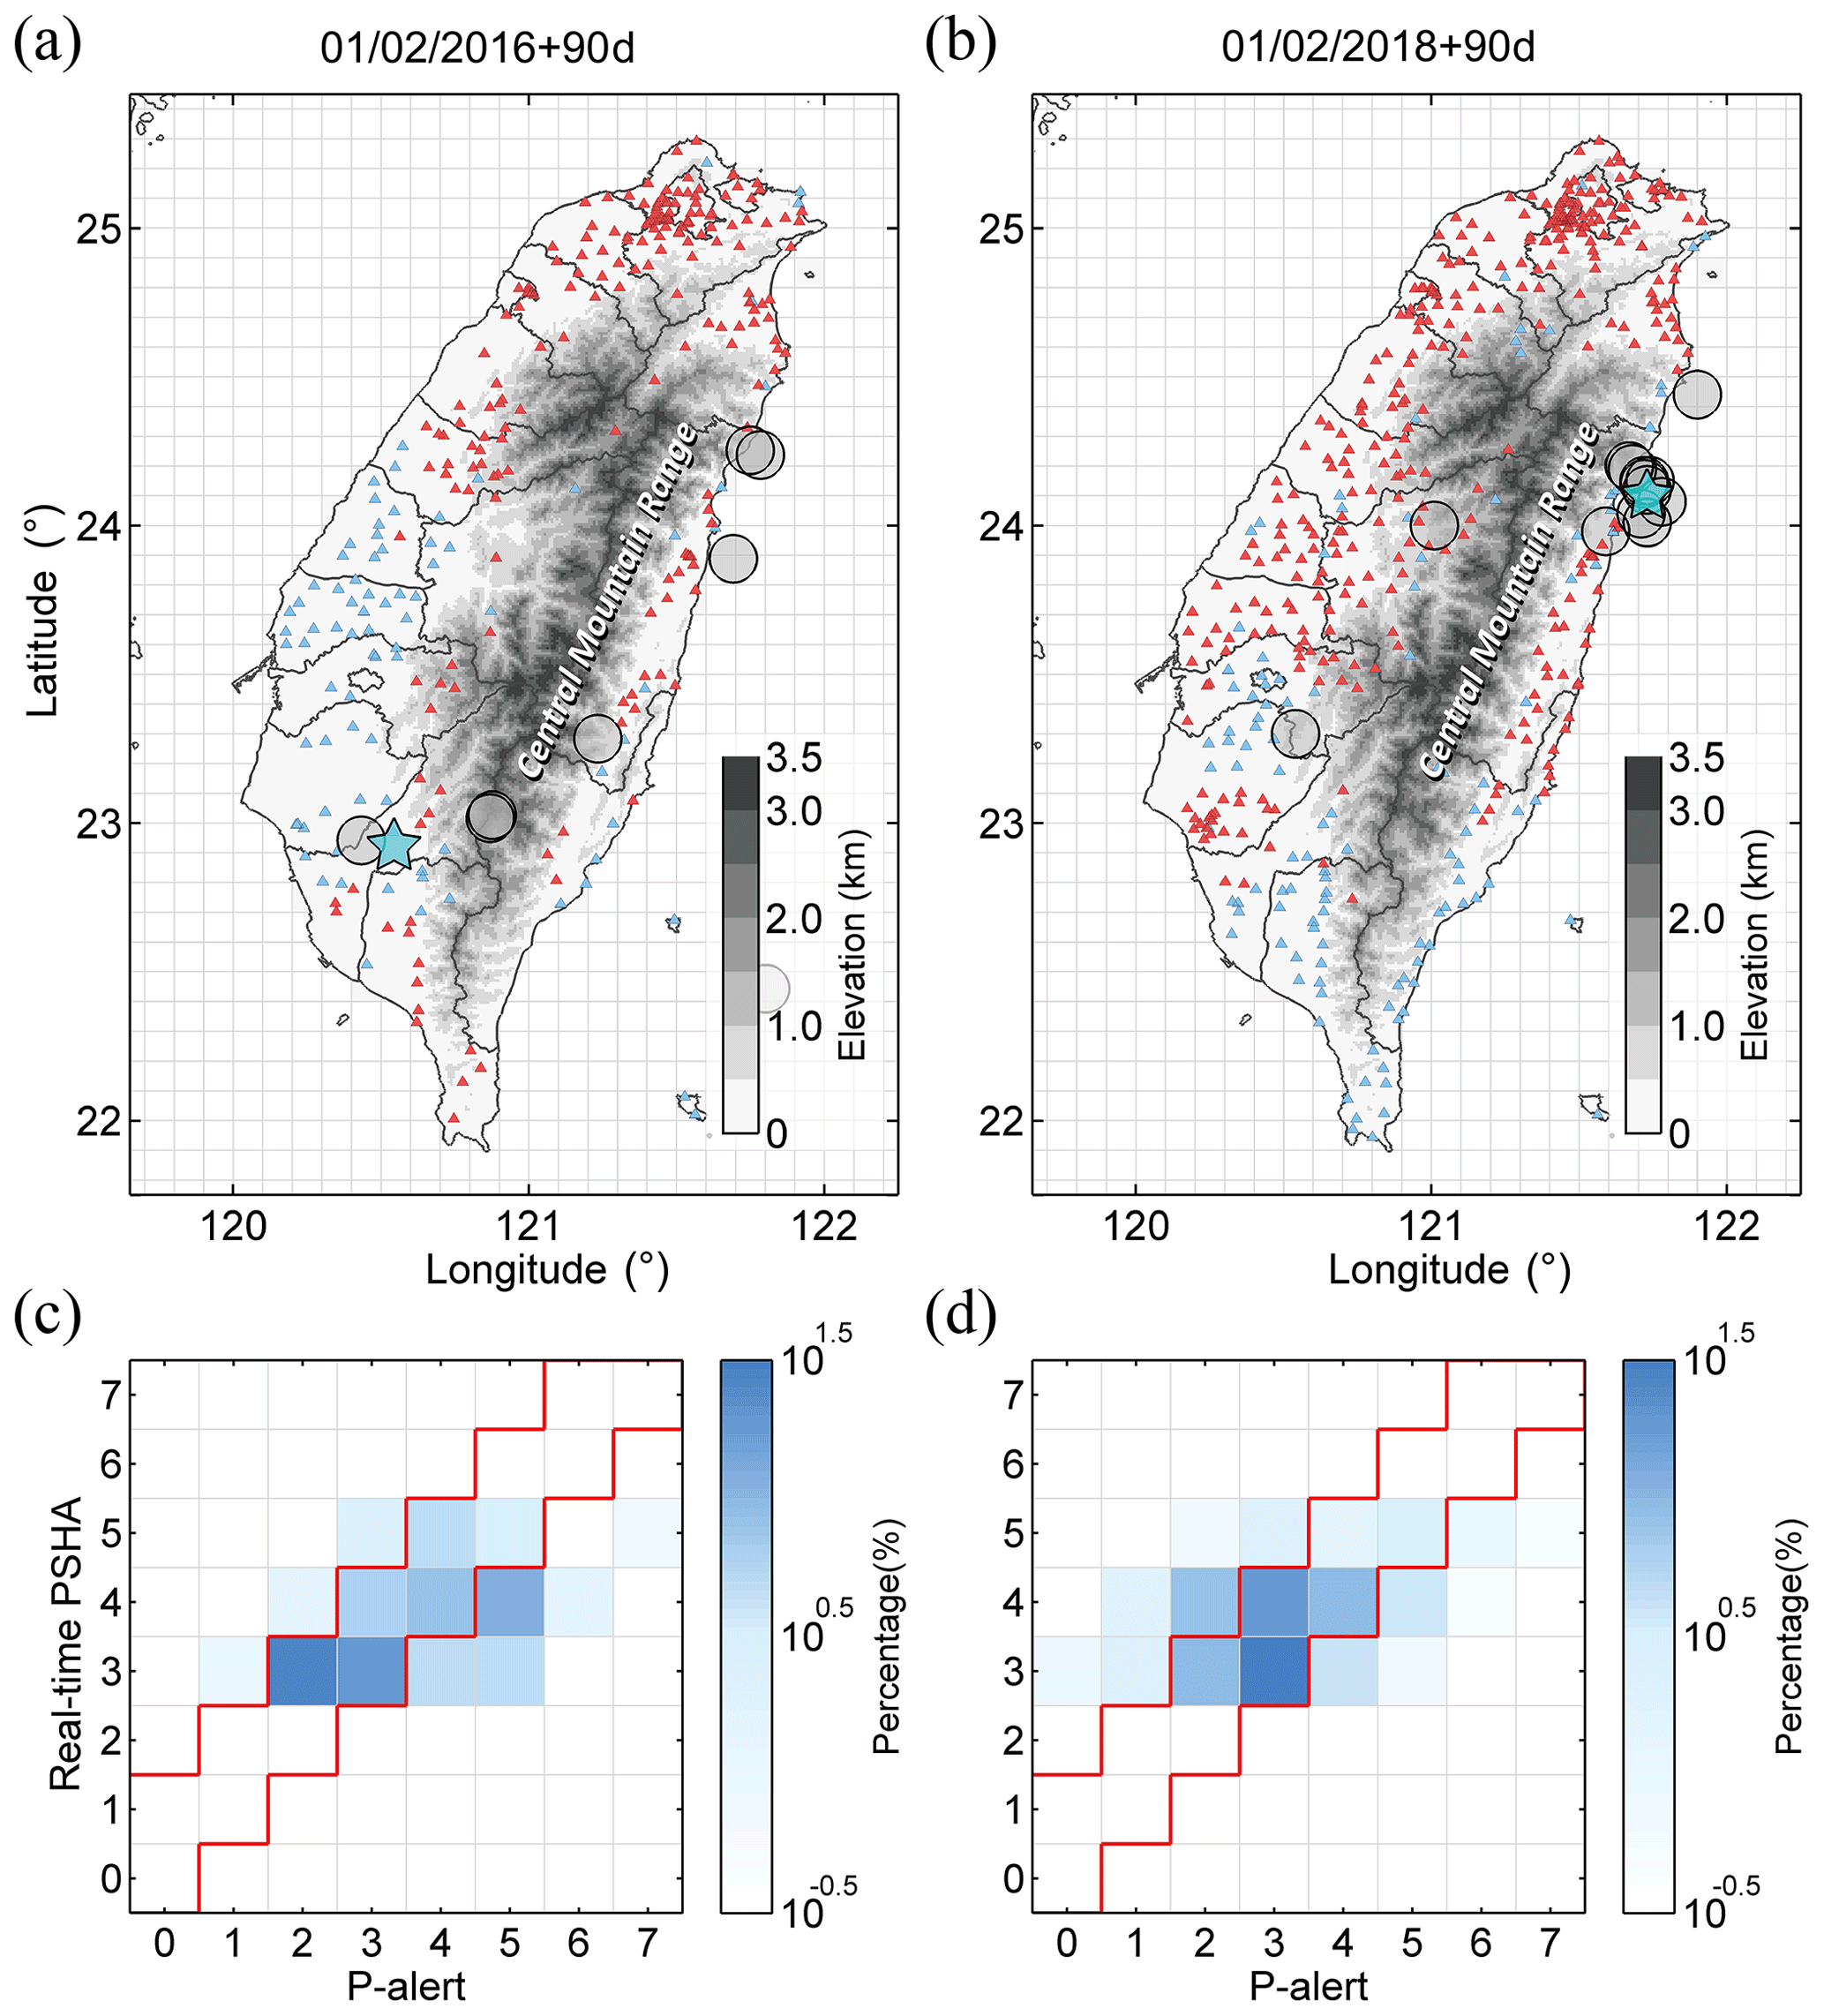
Figure 5Panels (a) and (b) are the P-alert station distributions indicating “hit” and “not hit”. The red and blue triangles represent “hit” and “not hit”, respectively. Panels (c) and (d) are the distributions of the hit percentage for the 2016 Meinong and 2018 Hualien earthquakes, respectively. The red line area represents the acceptable prediction range.
In both instances, the differences between the forecasting results and the recorded seismic intensities could be ascribed mainly to three aspects. First, the forecasting model that determines the probability distributions of earthquake occurrences is critical in real-time PSHA. If the probability distribution misses or is a false alarm somewhere, it directly leads to inaccurate forecasts in real-time PSHA. In the PI results, some differences were located at the hot spots with relatively higher probability, e.g., the area in 22.6 to 23∘ N and 120.9 to 121.3∘ E in Fig. 1a and 22.7 to 23.1∘ N and 120.4 to 120.8∘ E in Fig. 1b. Compared with the locations of the earthquakes, these hot spots shifted slightly and it appeared acceptable. However, in the results of real-time PSHA, this led to underestimation of the maximum seismic intensity in the area close to the epicenters and overestimation in the area without any earthquake events but with high probability of earthquake occurrence. For instance, in the case of the 2018 Hualien earthquake, the maximum seismic intensity in the southwestern area was underestimated and that in the southern area was overestimated (see Figs. 3 and 5b). Therefore, in real-time PSHA, a more accurate and precise forecasting model would facilitate the obtainment of results that are more positive. Furthermore, even if the PI results performed well in the ROC test, the PI method still needed improvement.
Second, the evaluation of earthquake ground motion is subject to the limitations of GMPEs. We adopted the GMPE produced by Lin et al. (2012), whose data (ML≥5.0) within 50 km represent less than 14 % of all the data for regression of GMPE. Therefore, when there is shortage of data in the near field and, for larger events, in the regression of GMPEs, the applicability of GMPEs becomes limited (Edwards and Fäh, 2014). Accordingly, the limited applicability of GMPEs probably caused the deviation in evaluation of the seismic intensity forecasting maps, e.g., the underestimation of the areas around the two main shocks (Figs. 2c and 3c). Furthermore, it is difficult to properly and comprehensively evaluate the site effect in GMPEs, but it dramatically affects the behavior of seismic waves. For example, the amplitudes in the Meinong earthquake were amplified extending along the northwest (in Fig. 2b) because the western plain is composed of thick and low-velocity sedimentary deposits (see Fig. 4 in Lee et al., 2016). Consequently, the site effect leads to underestimation in the seismic intensity forecast (Figs. 2c and 5a).
In addition, the directivity effect plays a vital role in the distribution of ground motion. In regards to the main shocks in the two study cases, the rupture characteristic had a strong directivity effect that caused significant amplification of the ground motion along the rupture direction (Lee et al., 2016; Hsu et al., 2018). However, basically, GMPEs indicate the statistical distribution of PGA generated by all the data at the same radical distance without considering the possible effect of rupture directivity. As a result, GMPEs are only able to provide the ground motion estimation of radial extension. Furthermore, the forecasting model does not include information on the rupture direction. Therefore, we suggest that some differences along the rupture direction could be ascribed to this effect.
This study presents a method to achieve real-time seismic hazard assessment by replacing the static seismic rate, i.e., the truncated and characteristic earthquake models, with the time-dependent seismic source probability of the PI method. With regard to this time-dependent seismic source probability, ROC tests verified quantitatively that the performance of the PI forecasting probabilities in the forecasting intervals was quite effective. Therefore, we were able to use the significant probability distributions as the function of the earthquake occurrence rate, P(m, loc), in real-time PSHA. The hit rates of our seismic intensity forecasting maps generated with real-time PSHA outperformed the random guesses and were higher than 0.5 for both the Meinong and the Hualien earthquakes. Therefore, we suggest that real-time PSHA maps are effective forecasting tools, and their satisfactory performance cannot be attributed to coincidence. We demonstrated that real-time seismic hazard assessment was attainable and could be realized and updated by time-dependent seismic source probability.
In future, different time-dependent seismic source probability models of earthquake occurrences could be introduced to provide estimation that is more accurate and robust. In addition, a possible improvement to our results could be from estimated PGA distribution, not only by means of state-of-the-art machine learning tools for an extensive databank of the P-alert network but also by physics-based numerical simulations (PBSs) of seismic ground motion, instead of empirical GMPEs. Presumably, a real-time forecasting map of seismic intensity would enable governments or businesses to prepare efficiently for earthquake disasters. Furthermore, the seismicity intensity scale based on PGA is related to the vulnerability level of buildings, which will also change over time because of degradation and upgrades (e.g., obsolescence, retrofitting actions, and climate events). Therefore, real-time PSHA and change in vulnerability should be considered when assessing seismic risk fluctuation with time.
The earthquake catalog can be found on the Central Weather Bureau website (https://www.cwb.gov.tw/V7e/earthquake/seismic.htm, Central Weather Bureau, 2018a and http://gdms.cwb.gov.tw/index.php, Central Weather Bureau, 2018b). Data from the P-alert network can be downloaded from the Data Center of the TEC at http://palert.earth.sinica.edu.tw/db/ (Taiwan Earthquake Research Center, 2018) or by contacting Yih-Min Wu at drymwu@ntu.edu.tw for access to the NTU catalog.
YSS conducted this study and wrote the main program of real-time PSHA and the article. HCL and CCC provided the main idea and helpful feedback and revised the paper. LYC and CCC provided expertise in the pattern informatics model and wrote the modified PI code. ZKY helped simulate the ground motion.
The authors declare that they have no conflict of interest.
The authors are grateful for support from the Ministry of Science and Technology (ROC, Taiwan), the Department of Earth Sciences at the National Central University (ROC, Taiwan), and the Earthquake-Disaster & Risk Evaluation and Management Center (E-DREaM) at the National Central University.
This research has been supported by the Ministry of Science and Technology, Taiwan, R.O.C. (grant no. MOST108-2116-M-008-019).
This paper was edited by Filippos Vallianatos and reviewed by two anonymous referees.
Central Weather Bureau: Seismicity, available at: https://www.cwb.gov.tw/V7e/earthquake/seismic.htm, last access: July 2018a.
Central Weather Bureau: http://gdms.cwb.gov.tw/index.php, last access: July 2018b.
Central Weather Bureau: Seismic intensity scale, available at: http://scweb.cwb.gov.tw/en-US/Guidance/FAQdetail/182, last access: 5 March 2020.
Chang, L.-Y.: A study on an improved pattern informatics method and the soup-of-group model for earthquakes. Doctoral dissertation, Department of Earth Sciences, National Central University, Taiwan, R.O.C., 2018.
Chang, L.-Y., Chen, C.-C., Wu, Y.-H., Lin, T.-W., Chang, C.-H., and Kan, C.-W.: A Strategy for a Routine Pattern Informatics Operation Applied to Taiwan, Pure Appl. Geophys., 173, 235–244, https://doi.org/10.1007/s00024-015-1079-9, 2016.
Chen, C.-C., Rundle, J. B., Holliday, J. R., Nanjo, K. Z., Turcotte, D. L., Li, S.-C., and Tiampo, K. F.: The 1999 Chi-Chi, Taiwan, earthquake as a typical example of seismic activation and quiescence, Geophys. Res. Lett., 32, L22315, https://doi.org/10.1029/2005GL023991, 2005.
Chen, C.-C., Rundle, J. B., Li, H.-C., Holliday, J. R., Turcotte, D. L., and Tiampo, K. F.: Critical point theory of earthquakes: Observation of correlated and cooperative behavior on earthquake fault systems, Geophys. Res. Lett., 33, L18302, https://doi.org/10.1029/2006GL027323, 2006.
Chen, H.-J., Chen, C.-C., Ouillon, G., and Sornette, D.: Using geoelectric field skewness and kurtosis to forecast the 2016/2/6, ML 6.6 Meinong, Taiwan Earthquake, Terr. Atmos. Ocean. Sci., 28, 745–761, https://doi.org/10.3319/TAO.2016.11.01.01, 2017.
Cooper, J. D.: Letter to editor, San Francisco Daily Evening Bulletin, Nov. 3, San Francisco, USA, 1868.
Cornell, C. A.: Engineering seismic risk analysis, B. Seismol. Soc. Am., 58, 1583–1606, 1968.
Cosentino, P., Ficarra, V., and Luzio, D.: Truncated exponential frequency-magnitude relationship in earthquake statistics, B. Seismol. Soc. Am., 67, 1615–1623, 1977.
Edwards, B. and Fäh, D.: Ground motion prediction equations, ETH-Zürich, Zürich, Switzerland, 2014.
Holliday, J. R., Rundle, J. B., Turcotte, D. L., Klein, W., Tiampo, K. F., and Donnellan, A.: Space-Time Clustering and Correlations of Major Earthquakes, Phys. Rev. Lett., 97, 238501, https://doi.org/10.1103/PhysRevLett.97.238501, 2006.
Gutenberg, B. and Richter, C. F.: Frequency of earthquakes in California, B. Seismol. Soc. Am., 34, 185–188, 1944.
Hsu, T. Y., Lin, P. Y., Wang, H. H., Chiang, H. W., Chang, Y. W., Kuo, C. H., Lin, C. M., and Wen, K. L.: Comparing the Performance of the NEEWS Earthquake Early Warning System Against the CWB System During the 6 February 2018 Mw 6.2 Hualien Earthquake, Geophys. Res. Lett., 45, 6001–6007, https://doi.org/10.1029/2018GL078079, 2018.
Iervolino, I., Chioccarelli, E., and Convertito, V.: Engineering design earthquakes from multimodal hazard disaggregation, Soil Dynam. Earthquake Eng., 31, 1212–1231, https://doi.org/10.1016/j.soildyn.2011.05.001, 2011.
Lee, S.-J., Yeh, T.-Y., and Lin, Y.-Y.: Anomalously Large Ground Motion in the 2016 ML 6.6 Meinong, Taiwan, Earthquake: A Synergy Effect of Source Rupture and Site Amplification, Seismol. Res. Lett., 87, 1319–1326, https://doi.org/10.1785/0220160082, 2016.
Lee, Y.-T., Wang, Y.-J., Chan, C.-H., and Ma, K.-F.: The 2016 Meinong earthquake to TEM PSHA2015, Terr. Atmos. Ocean. Sci., 28, 703–713, https://doi.org/10.3319/TAO.2016.12.28.02, 2017.
Lin, P.-S. and Lee, C.-T.: Ground-Motion Attenuation Relationships for Subduction-Zone Earthquakes in Northeastern Taiwan, B. Seism. Soc. Am., 98, 220–240, https://doi.org/10.1785/0120060002, 2008.
Lin, P.-S., Hsie, P.-S., Lee, Y.-R., Cheng, C.-T., and Shao, K.-S.: The research of probabilistic seismic hazard analysis and geological survey of nuclear power plant: Construction of ground motion prediction equation for response spectra, Commission Report of the Institute of Nuclear Energy Research, Atomic Energy Council, Executive Yuan, Taipei, Taiwan, R.O.C., 2012 (in Chinese).
Nanjo, K. Z., Holliday, J. R., Chen, C.-C., Rundle, J. B., and Turcotte, D. L.: Application of a modified pattern informatics method to forecasting the locations of future large earthquakes in the central Japan, Tectonophysics, 424, 351–366, https://doi.org/10.1016/j.tecto.2006.03.043, 2006.
Rundle, J. B., Klein, W., Tiampo, K., and Gross, S.: Linear pattern dynamics in nonlinear threshold systems, Phys. Rev. E, 61, 2418–2431, https://doi.org/10.1103/PhysRevE.61.2418, 2000.
Rundle, J. B., Tiampo, K. F., Klein, W., and Sá Martins, J. S.: Self-organization in leaky threshold systems: The influence of near-mean field dynamics and its implications for earthquakes, neurobiology, and forecasting, P. Natl. Acad. Sci. USA, 99, 2514–2521, https://doi.org/10.1073/pnas.012581899, 2002.
Rundle, J. B., Turcotte, D. L., Shcherbakov, R., Klein, W., and Sammis, C.: Statistical physics approach to understanding the multiscale dynamics of earthquake fault systems, Rev. Geophys., 41, 1019, https://doi.org/10.1029/2003RG000135, 2003.
Senior Seismic Hazard Analysis Committee (SSHAC): Recommendations for probabilistic seismic hazard analysis: guidance on uncertainty and use of experts, US Nuclear Regulatory Commission, Washington, D.C., USA, 1997.
Schwartz, D. P. and Coppersmith, K. J.: Fault behavior and characteristic earthquakes: Examples from the Wasatch and San Andreas Fault Zones, J. Geophys. Res., 89, 5681–5698, https://doi.org/10.1029/JB089iB07p05681, 1984.
Sharda, R. and Delen, D.: Predicting box-office success of motion pictures with neural networks, Expert Syst. Appl., 30, 243–254, https://doi.org/10.1016/j.eswa.2005.07.018, 2006.
Shyu, J. B. H., Chuang, Y.-R., Chen, Y.-L., Lee, Y.-R., and Cheng, C.-T.: A New On-Land Seismogenic Structure Source Database from the Taiwan Earthquake Model (TEM) Project for Seismic Hazard Analysis of Taiwan, Terr. Atmos. Ocean. Sci., 27, 311–323, https://doi.org/10.3319/TAO.2015.11.27.02(TEM), 2016.
Taiwan Earthquake Research Center (TEC): P-alert data, available at: http://palert.earth.sinica.edu.tw/db/, last access: July 2018.
Tiampo, K. F., Rundle, J. B., McGinnis, S., Gross, S. J., and Klein, W.: Mean-field threshold systems and phase dynamics: An application to earthquake fault systems, Europhys. Lett., 60, 481, https://doi.org/10.1209/epl/i2002-00289-y, 2002.
Wang, J.-H., Chen, K.-C., Leu, P.-L., and Chang, J.-H.: b-Values Observations in Taiwan: A Review, Terr. Atmos. Ocean. Sci., 26, 475–492, https://doi.org/10.3319/TAO.2015.04.28.01(T), 2015.
Wang, Y.-J., Chan, C.-H., Lee, Y.-T., Ma, K.-F., Shyu, J. B. H., Rau, R.-J., and Cheng, C.-T.: Probabilistic Seismic Hazard Assessment for Taiwan, Terr. Atmos. Ocean. Sci., 27, 325–340, https://doi.org/10.3319/TAO.2016.05.03.01, 2016.
Wu, Y.-M.: Progress on development of an earthquake early warning system using low cost sensors, Pure Appl. Geophys., 172, 2343–2351, https://doi.org/10.1007/s00024-014-0933-5, 2015.
Wu, Y.-M., Shin, T.-C., and Tsai, Y.-B.: Quick and reliable determination of magnitude for seismic early warning, B. Seismol. Soc. Am., 88, 1254–1259, 1998.
Wu, Y.-M., Teng, T.-l., Shin, T.-C., and Hsiao, N.-C.: Relationship between Peak Ground Acceleration, Peak Ground Velocity, and Intensity in Taiwan, B. Seismol. Soc. Am., 93, 386–396, https://doi.org/10.1785/0120020097, 2003.
Wu, Y.-H., Chen, C.-C., and Rundle, J. B.: Detecting precursory earthquake migration patterns using the pattern informatics method, Geophys. Res. Lett., 35, L19304, https://doi.org/10.1029/2008GL035215, 2008a.
Wu, Y.-H., Chen, C.-C., and Rundle, J. B.: Precursory seismic activation of the Pingtung (Taiwan) offshore doublet earthquakes on 26 December 2006: A pattern informatics analysis, Terr. Atmos. Ocean. Sci., 19, 743–749, https://doi.org/10.3319/TAO.2008.19.6.743(PT), 2008b.
Wu, Y.-M., Chang, C.-H., Zhao, L., Teng, T.-L., and Nakamura, M.: A Comprehensive Relocation of Earthquakes in Taiwan from 1991 to 2005, B. Seismol. Soc. Am., 98, 1471–1481, https://doi.org/10.1785/0120070166, 2008c.
Wu, Y.-M., Chen, D.-Y., Lin, T.-L., Hsieh, C.-Y., Chin, T.-L., Chang, W.-Y., and Li, W.-S.: A High-Density Seismic Network for Earthquake Early Warning in Taiwan Based on Low Cost Sensors, Seismol. Res. Lett., 84, 1048–1054, https://doi.org/10.1785/0220130085, 2013.
Wu, Y.-H., Chen, C.-C., and Li, H.-C.: Conditional Probabilities for Large Events Estimated by Small Earthquake Rate, Pure Appl. Geophys., 173, 183–196, https://doi.org/10.1007/s00024-014-1019-0, 2016a.
Wu, Y.-M., Liang, W.-T., Mittal, H., Chao, W.-A., Lin, C.-H., Huang, B.-S., and Lin, C.-M.: Performance of a Low-Cost Earthquake Early Warning System (P-Alert) during the 2016 ML 6.4 Meinong (Taiwan) Earthquake, Seismol. Res. Lett., 87, 1050–1059, https://doi.org/10.1785/0220160058, 2016b.
Yang, B. M., Huang, T.-C., and Wu, Y.-M.: ShakingAlarm: A Nontraditional Regional Earthquake Early Warning System Based on Time-Dependent Anisotropic Peak Ground-Motion Attenuation Relationships, B. Seismol. Soc. Am., 108, 1219–1230, https://doi.org/10.1785/0120170105, 2018.